
Abstract
Increasing evidence indicates that metal-induced oxidative stress plays a pivotal role in the pathogenesis of Alzheimer’s disease (AD). Recently, the presence of 8-hydroxydeoxyguanosine, a biomarker of oxidative DNA damage, was demonstrated in nuclear DNA (nDNA) in the AD brain. Iron (Fe) is a pro-oxidant metal capable of generating hydroxyl radicals that can oxidize DNA, and aluminum (Al) has been reported to facilitate Fe-mediated oxidation. In the present study, we examined the elements contained in the nuclei of nerve cells in AD brains using scanning electron microscopy coupled with energy-dispersive X-ray spectroscopy (SEM-EDS). Our results demonstrated that Al and Fe were colocalized in the nuclei of nerve cells in the AD brain. Within the nuclei, the highest levels of both Al and Fe were measured in the nucleolus. The SEM-EDS analysis also revealed the colocalization of Al and Fe in the heterochromatin and euchromatin in neuronal nuclei in the AD brain. Notably, the levels of Al and Fe in the nucleus of nerve cells in the AD brain were markedly higher than those in age-matched control brains. We hypothesize that the colocalization of Al and Fe in the nucleus of nerve cells might induce oxidative damage to nDNA and concurrently inhibit the repair of oxidatively damaged nDNA. An imbalance caused by the increase in DNA damage and the decrease in DNA repair activities might lead to the accumulation of unrepaired damaged DNA, eventually causing neurodegeneration and the development of AD.
Keywords
INTRODUCTION
Alzheimer’s disease (sporadic Alzheimer’s disease, senile dementia of the Alzheimer type, AD) is an age-related neurodegenerative disease characterized by the accumulation of senile plaques and neurofibrillary tangles [1–4]. The incidence of AD is 14-fold higher among people older than 85 years than among people between 65 and 69 years of age, and AD affects as much as 47% of people over 85 years of age [5, 6]. Aging is the biggest risk factor for the development and progression of AD [7, 8].
The etiology of AD remains to be clarified, but growing lines of evidence indicate that metal-induced oxidative stress plays a pivotal role in AD pathogenesis [9–11]. Oxidized products of various biomolecules, including nucleic acids, proteins, lipids, and carbohydrates, were found to be markedly increased in the brains of elderly people and patients with AD [11–13]. Moreover, iron (Fe) levels were increased substantially in aged and AD brains [14, 15]. Excessive Fe accumulation has also been reported in neurodegenerative diseases such as Parkinson’s disease, Huntington’s disease, and amyotrophic lateral sclerosis [16–18]. Fe is essential for maintaining the function of the central nervous system; however, it is also a transition metal capable of generating, through the Fenton reaction, hydroxyl radicals (OH?), which cause severe oxidative damage to biomolecules such as DNA, RNA, proteins, and lipids [10]. Copper (Cu) is also a transition metal that can generate hydroxyl radicals [19], but Cu levels in the AD brain were found to decrease markedly with AD progression [20, 21]. Castellani et al. [10] and Honda et al. [22] have reported that hydroxyl radicals are mainly generated by the Fe-mediated Fenton reaction in the AD brain.
An intriguing finding is that Fe-mediated oxidation is facilitated, both in vitro and in vivo, by aluminum (Al), although Al itself is a non-redox-active metal [23–26]. Al cannot oxidize phospholipid liposomes by itself, but can accelerate Fe-induced peroxidation of these liposomes several fold [27, 28]. Moreover, Al administration to experimental animals is known to cause oxidative damage to nucleic acids, proteins, and lipids in the brain [29, 30]. Al has also been reported to potentiate Fe-mediated oxidative stress in cultured neurons [31, 32]. Notably, increased Al levels have been reported in the aged brain and in brains of patients with AD [33–35]. In addition, Virk and Eslick have reported that Al levels in the AD brain were significantly higher than those in the age-matched control brain [36].
Recently, the presence of 8-hydroxydeoxygua-nosine, which is a biomarker of oxidative DNA damage, has been demonstrated in nuclear DNA (nDNA) in brains of patients with AD [37–39]. Because nDNA plays a critical role in the cell, oxidative damage to nDNA might represent one of the most important factors in neuronal degeneration and AD pathogenesis. DNA is a stable compound: therefore, reactive oxygen species (ROS) such as hydrogen peroxide or superoxide anion radicals cannot, by themselves, readily oxidize DNA [40, 41]. In contrast, hydroxyl radicals comprise the most potent ROS in the cell. These radicals can not only directly oxidize DNA but also alter gene sequences by oxidizing the proteins that bind to DNA [38, 41–44]. Prestwich et al. reported that when DNA-bound proteins were oxidized to form amino acid peroxides, the peroxides proceeded to cleave the DNA backbone by introducing single-strand breaks in the DNA [45, 46]. Furthermore, Moreira et al. have reported that hydroxyl radicals play a major role in DNA oxidation in the AD brain [11]. The half-lives of hydroxyl radicals have been reported to be as short as 10−9 s (1 ns) [47, 48]. Therefore, in order to oxidize nDNA, the Fe that catalyzes the generation of hydroxyl radicals through the Fenton reaction must either bind directly to nDNA, or to the histone proteins that closely bind nDNA [49–52].
To facilitate Fe-mediated oxidative reactions with nDNA, Al must be closely colocalized with Fe. However, the colocalization of Fe and Al in the nuclei of brain cells, particularly in the nuclei of nerve cells, remains to be clearly demonstrated in the AD brain. Honda et al. found that Fe was distributed homogenously in the nuclei of nerve cells in the AD brain when examined using histochemistry [53]. In contrast, Quintana et al. carried out analytical electron microscopy experiments and reported that Fe was not present in the nuclei of nerve cells in the AD brain, but was instead present at high concentrations in the nuclei of oligodendrocytes [54]. Furthermore, Connor et al. failed to detect Fe in the nuclei of nerve cells in the AD brain using histochemistry [55, 56].
Al has been reported to accumulate in the nuclei of nerve cells in the AD brain [57–62]. Walton reported Al accumulation in the nuclei of nerve cells in the AD brain using histochemistry [58]. We have also reported the presence of Al in isolated cell nuclei from AD brains using particle-induced X-ray emission (PIXE) analysis, microprobe PIXE analysis [59], and secondary ion mass spectrometry analysis [60]. Moreover, we have demonstrated Al accumulation in the nuclei of nerve cells in frozen thin sections from AD brains using transmission electron microscopy (TEM) coupled with energy-dispersive X-ray spectroscopy (EDS) [61, 62]. However, the localization of Fe in biological samples cannot be demonstrated using TEM-EDS analysis due to the high peak of the Fe spectrum that emerges from the components of the transmission electron microscope in TEM-EDS measurements [63].
In the current study, we examined the colocalization of Fe and Al in the nuclei of nerve cells in the AD brain using scanning electron microscopy (SEM) coupled with EDS (SEM-EDS). SEM-EDS analysis allows the concurrent imaging of subcellular structures with high spatial resolution and detection of small quantities of both Al and Fe contained in the same subcellular structures.
MATERIALS AND METHODS
Chemicals
Potassium dichromate, ammonium molybdate, HEPES, ethanol, and propylene oxide were purchased from Wako Pure Chemical Industries, Ltd. (Osaka, Japan). Epon, 25% glutaraldehyde, 20% formaldehyde, carbon rods, and Cu mesh were obtained from Nisshin EM Co. Ltd. (Tokyo, Japan). Al distearate and ferric stearate were purchased from Soekawa Chemical Co., Ltd. (Tokyo, Japan) to prepare the standard samples for Al and Fe, respectively. All buffers, fixatives, and staining solutions were prepared with Milli-Q water (Milli-Q Plus System, Millipore, Mississauga, ON, Canada).
PIXE analysis of chemicals
To ensure accurate measurements of Al and Fe in the samples using EDS analysis, it is critical to exclude contamination by exogenous Al and Fe, and to rule out the presence of elements featuring energy levels that result in characteristic X-rays similar to those of Al Kα (1.487 keV) and/or Fe Kα (6.404 keV) [64]. PIXE analysis can be used to detect both Al and Fe with high sensitivity and concurrently demonstrate the presence of elements with energy levels that result in characteristic X-rays similar to those of Al Kα and Fe Kα [65]. All chemicals used for the preparation of the samples for SEM-EDS analyses were examined using PIXE analysis, as reported previously [63]. PIXE analysis was performed at an accelerating voltage of 3 MeV using a tandem accelerator at the Micro Analysis Laboratory of Tokyo University [63].
Standard samples for SEM-EDS analysis
Standard samples of Al (Al-Epon mixtures and Epon)
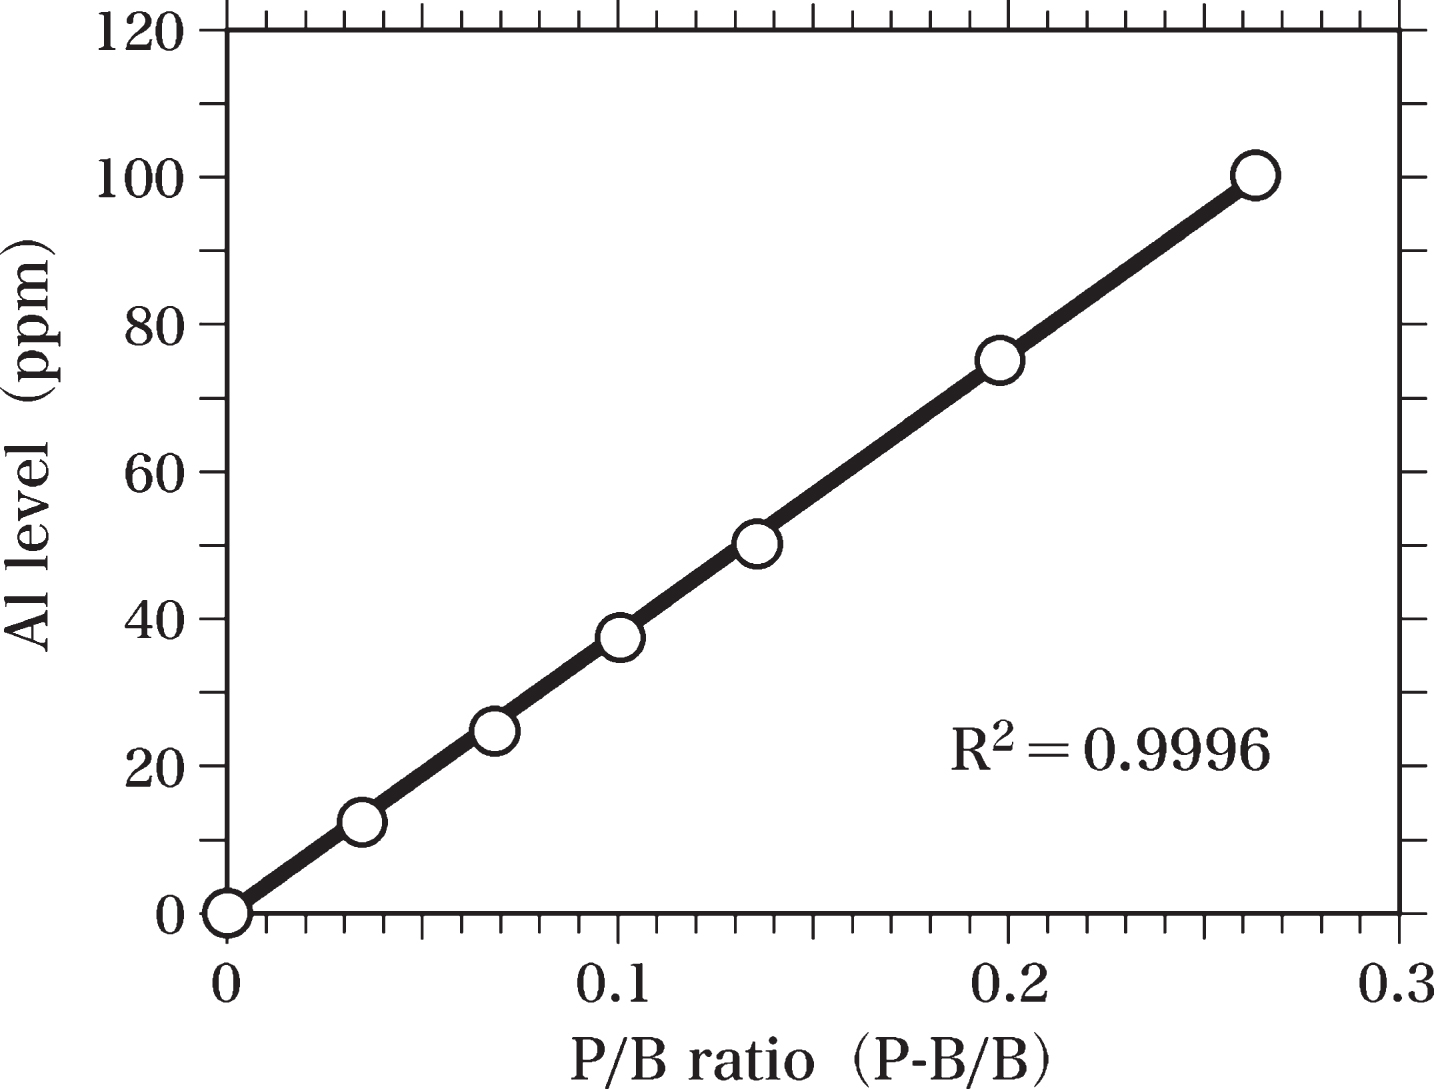
In order to measure the Al levels in the brain samples, Al-standard samples were prepared. Al distearate was mixed with Epon to homogeneity and used to prepare Al-standard samples (Al-Epon mixtures) containing 100, 75, 50, 37.5, 25, and 12.5 ppm Al. Al-Epon mixtures and Epon were hardened in an oven maintained at 60°C, as reported previously [63]. Semi-thin sections (0.4-μm thick) of Epon and Al-Epon mixtures were cut using an LKB Ultratome microtome equipped with a diamond knife [63]. These semi-thin sections were analyzed by SEM-EDS to prepare the standard curve of Al levels (Fig. 3). The peak of Al Kα (1.49 keV) and the background at 1.49 keV were measured to determine the value of peak-to-background ratio (P-B/B). The Al standard curve was used to estimate the Al level in the brain sample by comparing the peak-to-background ratio of each brain sample with that of the standard curve. The standard curve was obtained by using the least squares method.
Standard samples of Fe (Fe-Epon mixtures and Epon)
Fe-standard samples were prepared for measurements of Fe levels in the brain samples. Ferric stearate was mixed with Epon to homogeneity and used to prepare Fe-standard samples (Fe-Epon mixtures) containing 1600, 1200, 800, 600, 400, 200, and 100 ppm Fe. Fe-Epon mixtures and Epon were hardened at 60°C. Semi-thin sections (0.4-μm thick) of Fe-standard samples and Epon were cut using an LKB Ultratome microtome equipped with a diamond knife. These semi-thin sections were analyzed by SEM-EDS to prepare the standard curve of Fe levels (Fig. 4). The peak of Fe Kα (6.40 keV) and the background at 6.40 keV were measured to determine the value of peak-to-background ratio (P-B/B). The Fe standard curve was applied to calculate Fe levels in the brain sample by comparing the peak-to-background ratio of each sample with that of the standard curve. The standard curve of Fe levels was obtained by using the least squares method.
Preparation of brain samples for SEM-EDS analysis
Brain samples were obtained from the Department of Pathology at the University of Tokyo, and the Department of Pathology at Nihon University School of Medicine, where the samples were classified based on pathology. In this study, we used samples from 5 patients with AD (age range: 76–85 y; mean age: 82 y) and 5 age-matched controls without any neurological disorders (age range: 74–85 y; mean age: 81 y). This study was conducted in accordance with the 1975 Declaration of Helsinki on the ethical principles for medical research involving human subjects as stated by the World Medical Association.
Samples used for SEM-EDS analyses were prepared using a method reported previously, with minor changes [63]. Brain samples (hippocampus and temporal lobe) were removed at autopsy from the brains of patients with AD and age-matched controls using a clean stainless steel knife. After the brain tissues were transferred to a clean room, the cutting surface made at autopsy was cut off using a sharp, clean ceramic knife (Kyocera Corporation, Kyoto, Japan) and the arachnoid membrane was removed using a pair of ceramic tweezers (Kyocera Corporation). All autopsy instruments used in the present study were rinsed in 70% ethanol overnight, washed with ethanol, rinsed in Milli-Q water, dried, and stored in a clean box before use. Samples from the hippocampus and the cortex of the temporopolar area in the superior temporal gyrus (temporal cortex, Brodmann area 38) were collected from each patient for this study. The temporal cortex was used because the DNA in the temporal lobe has been reported to be the most oxidatively damaged in the AD brain [66]. The tissue samples were cut into small blocks, fixed with 3% glutaraldehyde and 2.5% paraformaldehyde in 0.1 M HEPES buffer (pH 7.2) for 12 h, washed with 10% sucrose in the same buffer for 1 h, and post-fixed with 3% glutaraldehyde and 2.5% potassium dichromate in 0.1 M HEPES buffer (pH 7.6) for 3 h. Samples were dehydrated using an ascending series of ethanol, embedded into Epon using a clean plastic capsule with a cap, and hardened at 60°C. Thirty to fifty Epon blocks were prepared from the brains of each subject.
Semi-thin sections (0.4-μm thick) were cut using an LKB Ultratome microtome equipped with a diamond knife, mounted on Cu mesh, washed with Milli-Q water several times, and dried in a clean desiccator. To avoid environmental contamination, all the processes for cutting and staining of semi-thin sections were carried out in a clean room.
Approximately, 80–120 sections were prepared from the hippocampus and temporal cortex from each patient. These semi-thin sections were stored in a clean desiccator and used as samples for SEM-EDS analysis.
In the present study, potassium dichromate was used instead of osmium (Os) tetroxide as a fixative for the brain samples. Os tetroxide is the standard fixative used to prepare biological samples for electron microscopy. However, the energy levels of the characteristic X-ray for Al Kα (Kα-1, 1.48670 keV and Kα-2, 1.48627 keV) and those for Os Mξ (Mξ-1, 1.4919 keV and Mξ-2, 1.4831 keV) are too close for them to be distinguished using EDS analysis [63, 64]. The characteristic X-rays of chromium (Cr) or potassium do not possess energy levels close to those of either Al-Kα or Fe-Kα [64]. Therefore, we used potassium dichromate as a fixative to study the characteristic X-rays of Al-Kα and Fe-Kα using EDS analysis.
Analysis of samples using SEM-EDS
The EDS spectra of the standard samples and the brain samples were examined using an EX-64175 JMU X-ray microanalyzer (JEOL Ltd., Tokyo, Japan) combined with a JSM-7000F Type-A scanning electron microscope (JEOL Ltd.). Samples were placed on a sample holder made of carbon, and the evacuated sample chamber containing the sample holder was cooled using liquid nitrogen. The nuclei of nerve and glial cells were identified using SEM. A small spot (0.2μm in diameter) in the samples was irradiated for 10 or 30 min with electron beams at an accelerating voltage of 15 keV, and the emitted X-rays were analyzed using the X-ray microanalyzer.
Summarized results of the EDS analysis on nerve cells in AD brains and age-matched control brains
Table 1 shows the summarized results of the EDS analysis on nerve cells in 5 AD brains and 5 control brains. For each major region of the nerve cell, 25 samples obtained by EDS analysis are shown in the Table. For the 25 samples, 5 samples were used from the analysis of each brain. We estimated the pairwise comparisons between the levels of Al and/or Fe for each major neuronal region in the AD brain and control brain by the Welch t-test method. SD, standard deviation; n, number of samples.
RESULTS
PIXE analysis of chemicals used for sample preparation for SEM-EDS analysis
PIXE analysis did not reveal the presence of Al Kα or Fe Kα in the chemicals used to prepare the samples for SEM-EDS analysis. We also did not detect the presence of any element featuring energy levels with characteristic X-rays close to those of Al-Kα or Fe-Kα in the chemicals used.
SEM-EDS analysis
Blank test
When SEM-EDS analysis was performed without placing the samples on the sample holder, we observed peaks for carbon (C), Cu, and zinc (Zn) (Fig. 1). No peaks for Al-Kα or Fe-Kα were detected. The C peak was considered to originate from the sample holder, which was made of carbon, and the peaks for Cu and Zn were due to the Cu and Zn used in the components of the electron microscope [63].
EDS spectrum of the blank test. SEM-EDS analysis was performed without placing samples on the sample holder. No Al or Fe (arrows) was detected. The C peak appears to be derived from the sample holder made of carbon. The Cu and Zn peaks are considered to originate from the components of the electron microscope.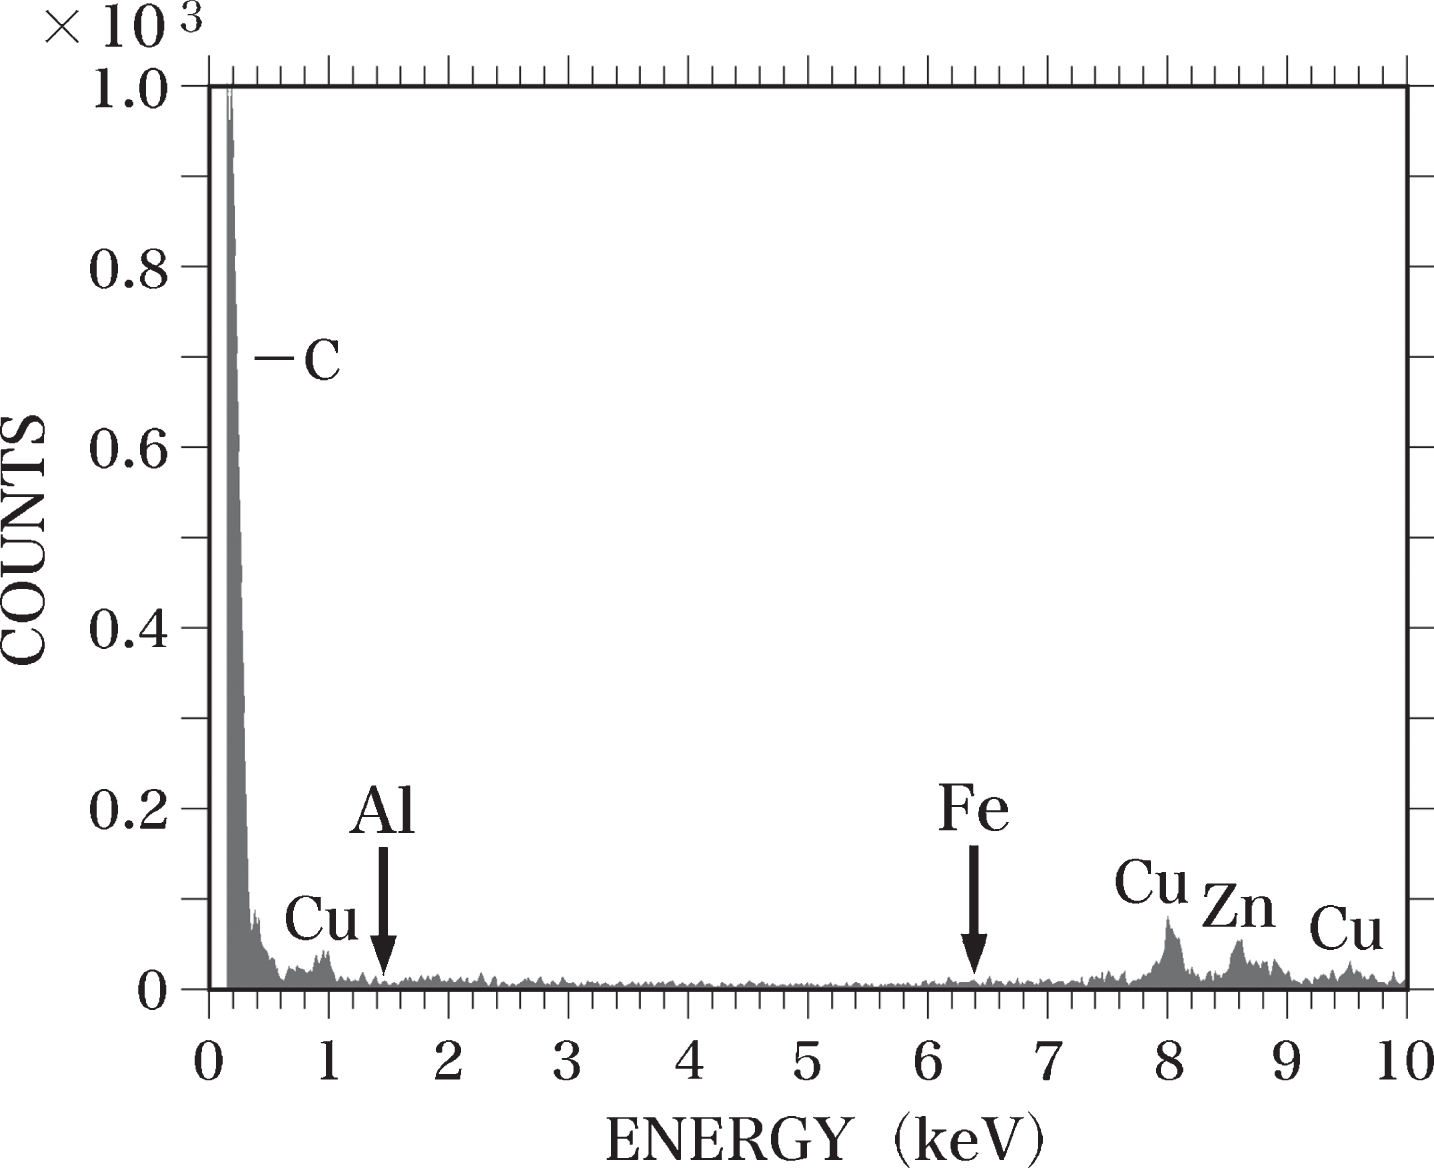
Standard samples
In the Epon semi-thin sections (0.4-μm thick), peaks for C, silicon (Si), chlorine (Cl), Cu, and Zn were detected using SEM-EDS analysis. We observed no Al or Fe peaks in these samples (Fig. 2). The detected Cl peak was considered to originate from the Epon itself, as a considerable amount of Cl was measured in Epon using TEM-EDS analysis [63, 68] and PIXE analysis [63]. We have previously reported that the Si peak observed in Epon sections using TEM-EDS analysis might result from the vacuum oil used for the electron microscope [63]. Si was not detected in Epon here using PIXE analysis. An Al-Kα peak was detected in sections of the Al-Epon mixture (Al-standard sample), which contains 12.5 ppm Al. When the Al concentration in the Al-Epon mixture was raised from 12.5 to 25, 37.5, 50, 75, or 100 ppm, the magnitudes of the Al-Kα peaks increased correspondingly (Fig. 3).
EDS spectrum of an Epon section. A semi-thin section (0.4-μm thick) of Epon was analyzed using EDS. No Al or Fe (arrows) was detected in the section. The Si peak is considered to be generated from contamination by oil vapor evaporated from the vacuum pump oil. The Cl peak was considered to originate from the Epon itself. Standard curve of Al. The standard curve of Al levels was prepared by SEM-EDS analysis using semi-thin sections (0.4-μm thick) of Epon and Al-Epon mixtures containing 100, 75, 50, 37.5, 25, and 12.5 ppm Al. The Al standard curve was used to calculate Al levels in brain samples by comparing the peak-to-background ratio (P-B/B) of each sample with that of the standard curve. The standard curve was obtained using the least squares method.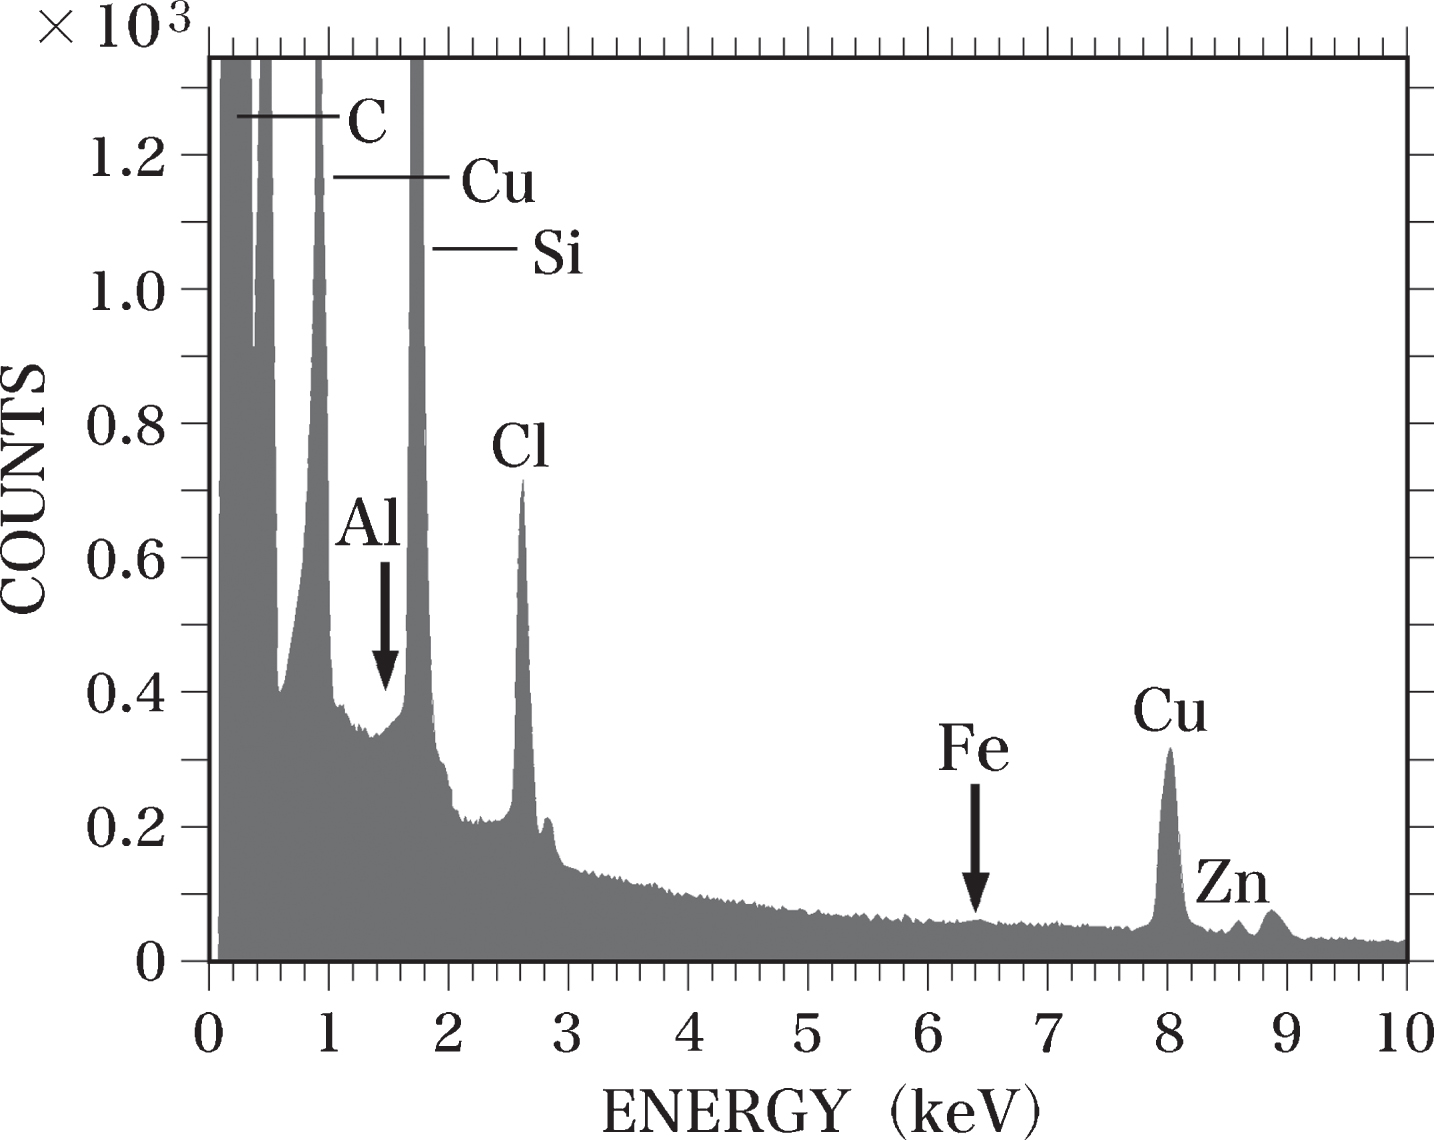
Furthermore, an Fe-Kα peak was detected in the sections of the Fe-Epon mixture (Fe-standard sample) containing 100 ppm Fe. When the Fe concentration in the mixture was raised to 200, 400, 600, 800, 1200, and 1600 ppm, the amplitudes of the Fe-Kα peaks increased almost proportionally to the increase in Fe concentrations (Fig. 4).
Standard curve of Fe. The standard curve of Fe levels was made by SEM-EDS analysis using semi-thin sections (0.4-μm thick) of Epon and Fe-Epon mixtures containing 1600, 1200, 800, 600, 400, 200, and 100 ppm Fe. The Fe standard curve was used to estimate Fe levels in brain samples by comparing the peak-to-background ratio (P-B/B) of each sample with that of the standard curve. The standard curve was obtained using the least squares method.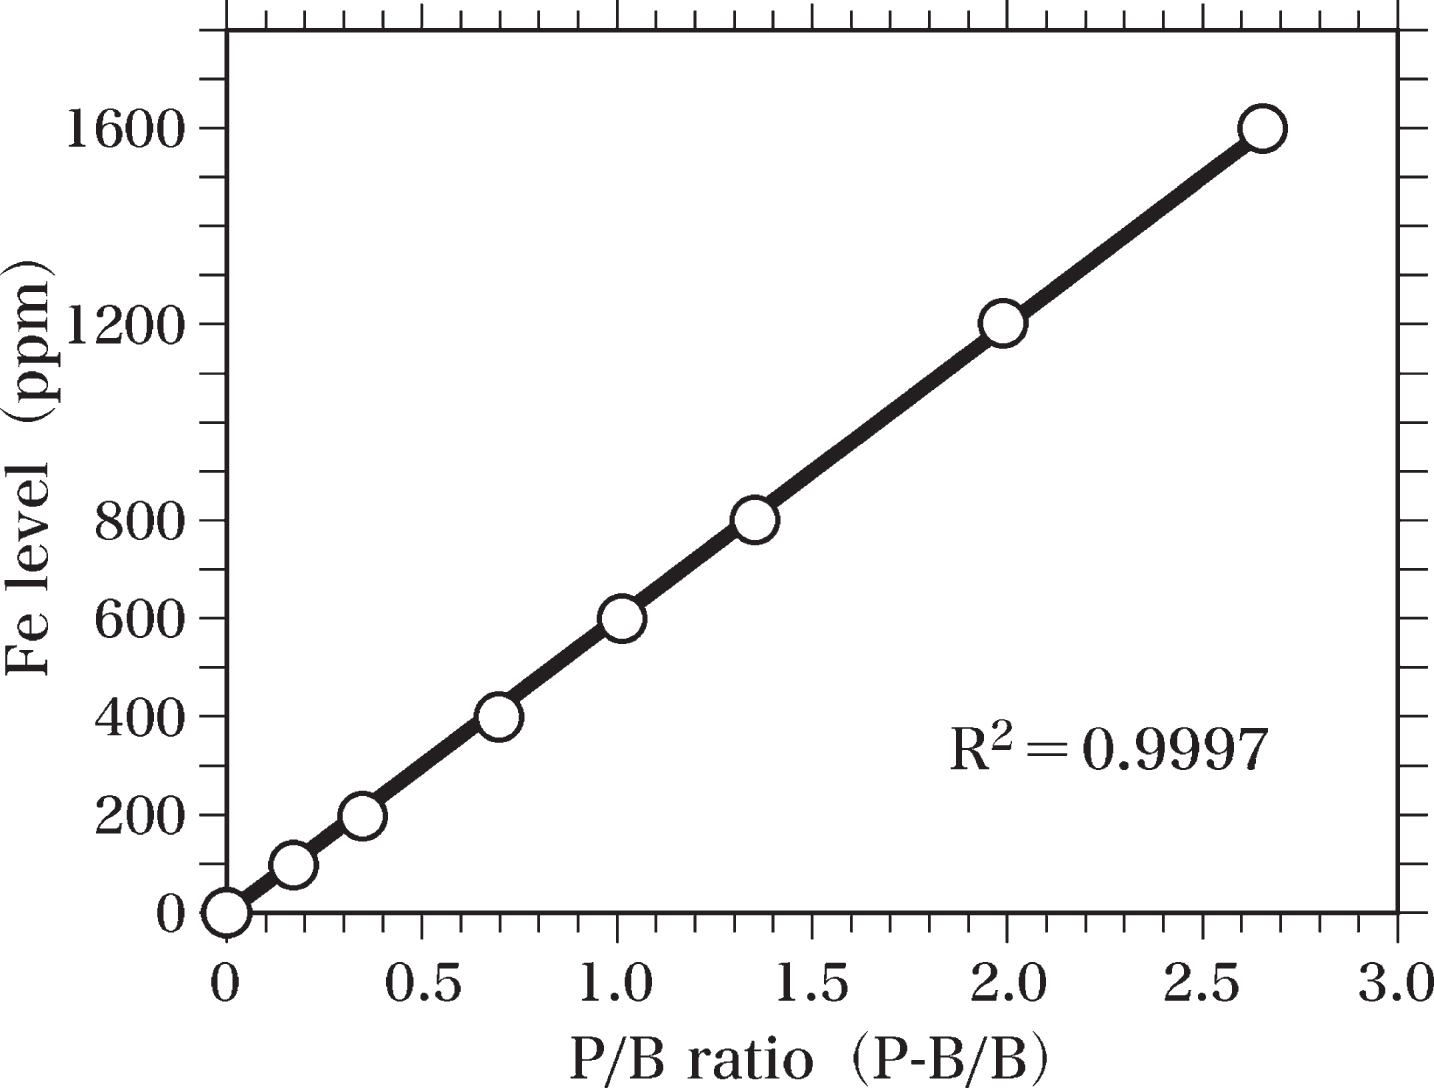
Brain samples
Nerve cells in AD brains
The SEM images in this study were produced by scanning the surface of semi-thin sections (0.4-μm thick) of brains with a focused beam of electrons. In the area where atoms were dense, the SEM images were bright, whereas the SEM image were dark in the area where atoms existed sparsely. In contrast, the TEM images have been known to be dark in regions with a high density of atoms and bright in regions with sparse atoms. Namely, the bright and dark image were reversed between SEM and TEM.
Figure 5 shows a SEM micrograph of a nerve cell in the temporal cortex of the AD brain taken at autopsy, and fixed with potassium dichromate. The nerve cell possessed a large nucleus in the center and two dendrites (Fig. 5, D) branched from the cytoplasm (Fig. 5, dagger) of the nerve cell. Neurons were surrounded by neuropil (NP), which consisted mainly of unmyelinated axons, dendrite and glial cell processes [69, 70]. The extracellular space (double dagger) was enlarged due to postmortem changes in the brain.
SEM micrograph of a nerve cell in the temporal cortex of the AD brain. The SEM micrograph shows a nerve cell of the AD brain fixed with potassium dichromate and stained with ammonium molybdate. The nuclear envelope (NE) shows an intact shape. Intranuclear structures such as the nucleolus, heterochromatin (H, bright region), and euchromatin (E, dark region) are well preserved. In the center of the nucleolus, pars amorpha (arrowhead) is clearly observed. Two dendrites (D) branches from the cytoplasm (dagger) of the nerve cell. Due to postmortem changes, the extracellular space (double dagger) is enlarged. NP, neuropil. Scale bar, 2μm.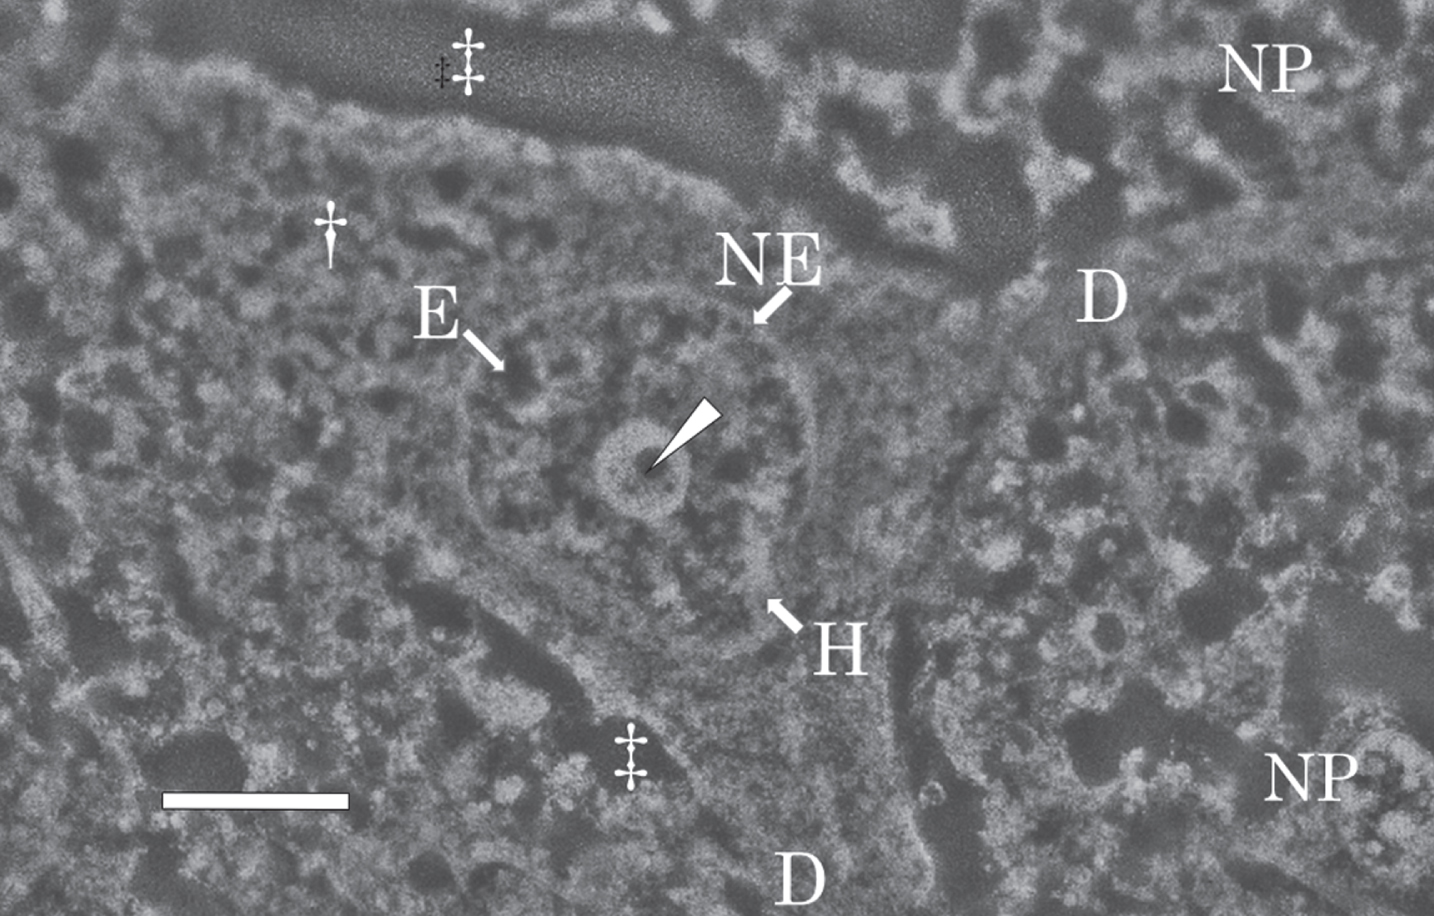
The nuclear envelope (Fig. 5, NE) was intact, with no breakage observed. The intranuclear structures such as the nucleolus, heterochromatin (H in Fig. 5, bright region), and euchromatin (E in Fig. 5, dark region) were preserved well despite using an autopsy brain. The nucleolus was large, well developed, and contained small circular dark regions, pars amorpha (Fig. 5, arrowhead), in the center. The morphological features of the intranuclear structures found in sections fixed with potassium dichromate and observed by SEM in this study were essentially the same as those previously observed by TEM after fixation with Os tetroxide [69, 70].
Figure 6 shows SEM-EDS analysis on the nucleus of the nerve cell in the AD brain exhibited in Fig. 5. It is well known that nDNA is localized exclusively in the nucleus [39], but not located in the cytoplasm, or in nerve processes such as axons or dendrites. Therefore, the SEM-EDS analysis in this study focused on the localization of Al and Fe in the nucleus of nerve cells in order to investigate the mechanism of nDNA oxidation and to clarify the pathogenesis of AD. Additionally, the perinuclear cytoplasm and the extracellular space were also analyzed by SEM-EDS as controls of the analysis on the intranuclear structures.
SEM-EDS analysis of the nucleus of the nerve cell in the AD brain shown in Fig. 5. A) SEM image of the nucleus of the nerve cell in the AD brain shown in Fig. 5. SEM examination shows a well-developed, large nucleolus (arrow), heterochromatin (arrowhead), and euchromatin (asterisk) in the nucleus. Dagger shows the perinuclear cytoplasm. Double dagger indicates the extracellular space. Scale bar, 1μm. B) EDS spectrum of the nucleolus (A, arrow) of the nerve cell in the AD brain. A small region (0.2μm in diameter) of the nucleolus in the nerve cell was examined using EDS. Elevated peaks for Al and Fe (arrows) are demonstrated. C) EDS spectrum of the heterochromatin (A, arrowhead) of the nerve cell in the AD brain. Al and Fe peaks (arrows) are detected in the heterochromatin. D) EDS spectrum of the euchromatin (A, asterisk) of the nerve cell in the AD brain. Al and Fe peaks (arrows) are detected in the euchromatin. The peaks for both Al and Fe measured in the heterochromatin and euchromatin are markedly lower than those measured in the nucleolus. E) EDS spectrum in the perinuclear cytoplasm (A, dagger) of the nerve cell in the AD brain. The elevated Fe peak is demonstrated in the perinuclear region of the cytoplasm. In contrast, no Al peak is detected. F) EDS spectrum in the extracellular space (A, double dagger) in the AD brain. No Al or Fe can be detected in the extracellular space.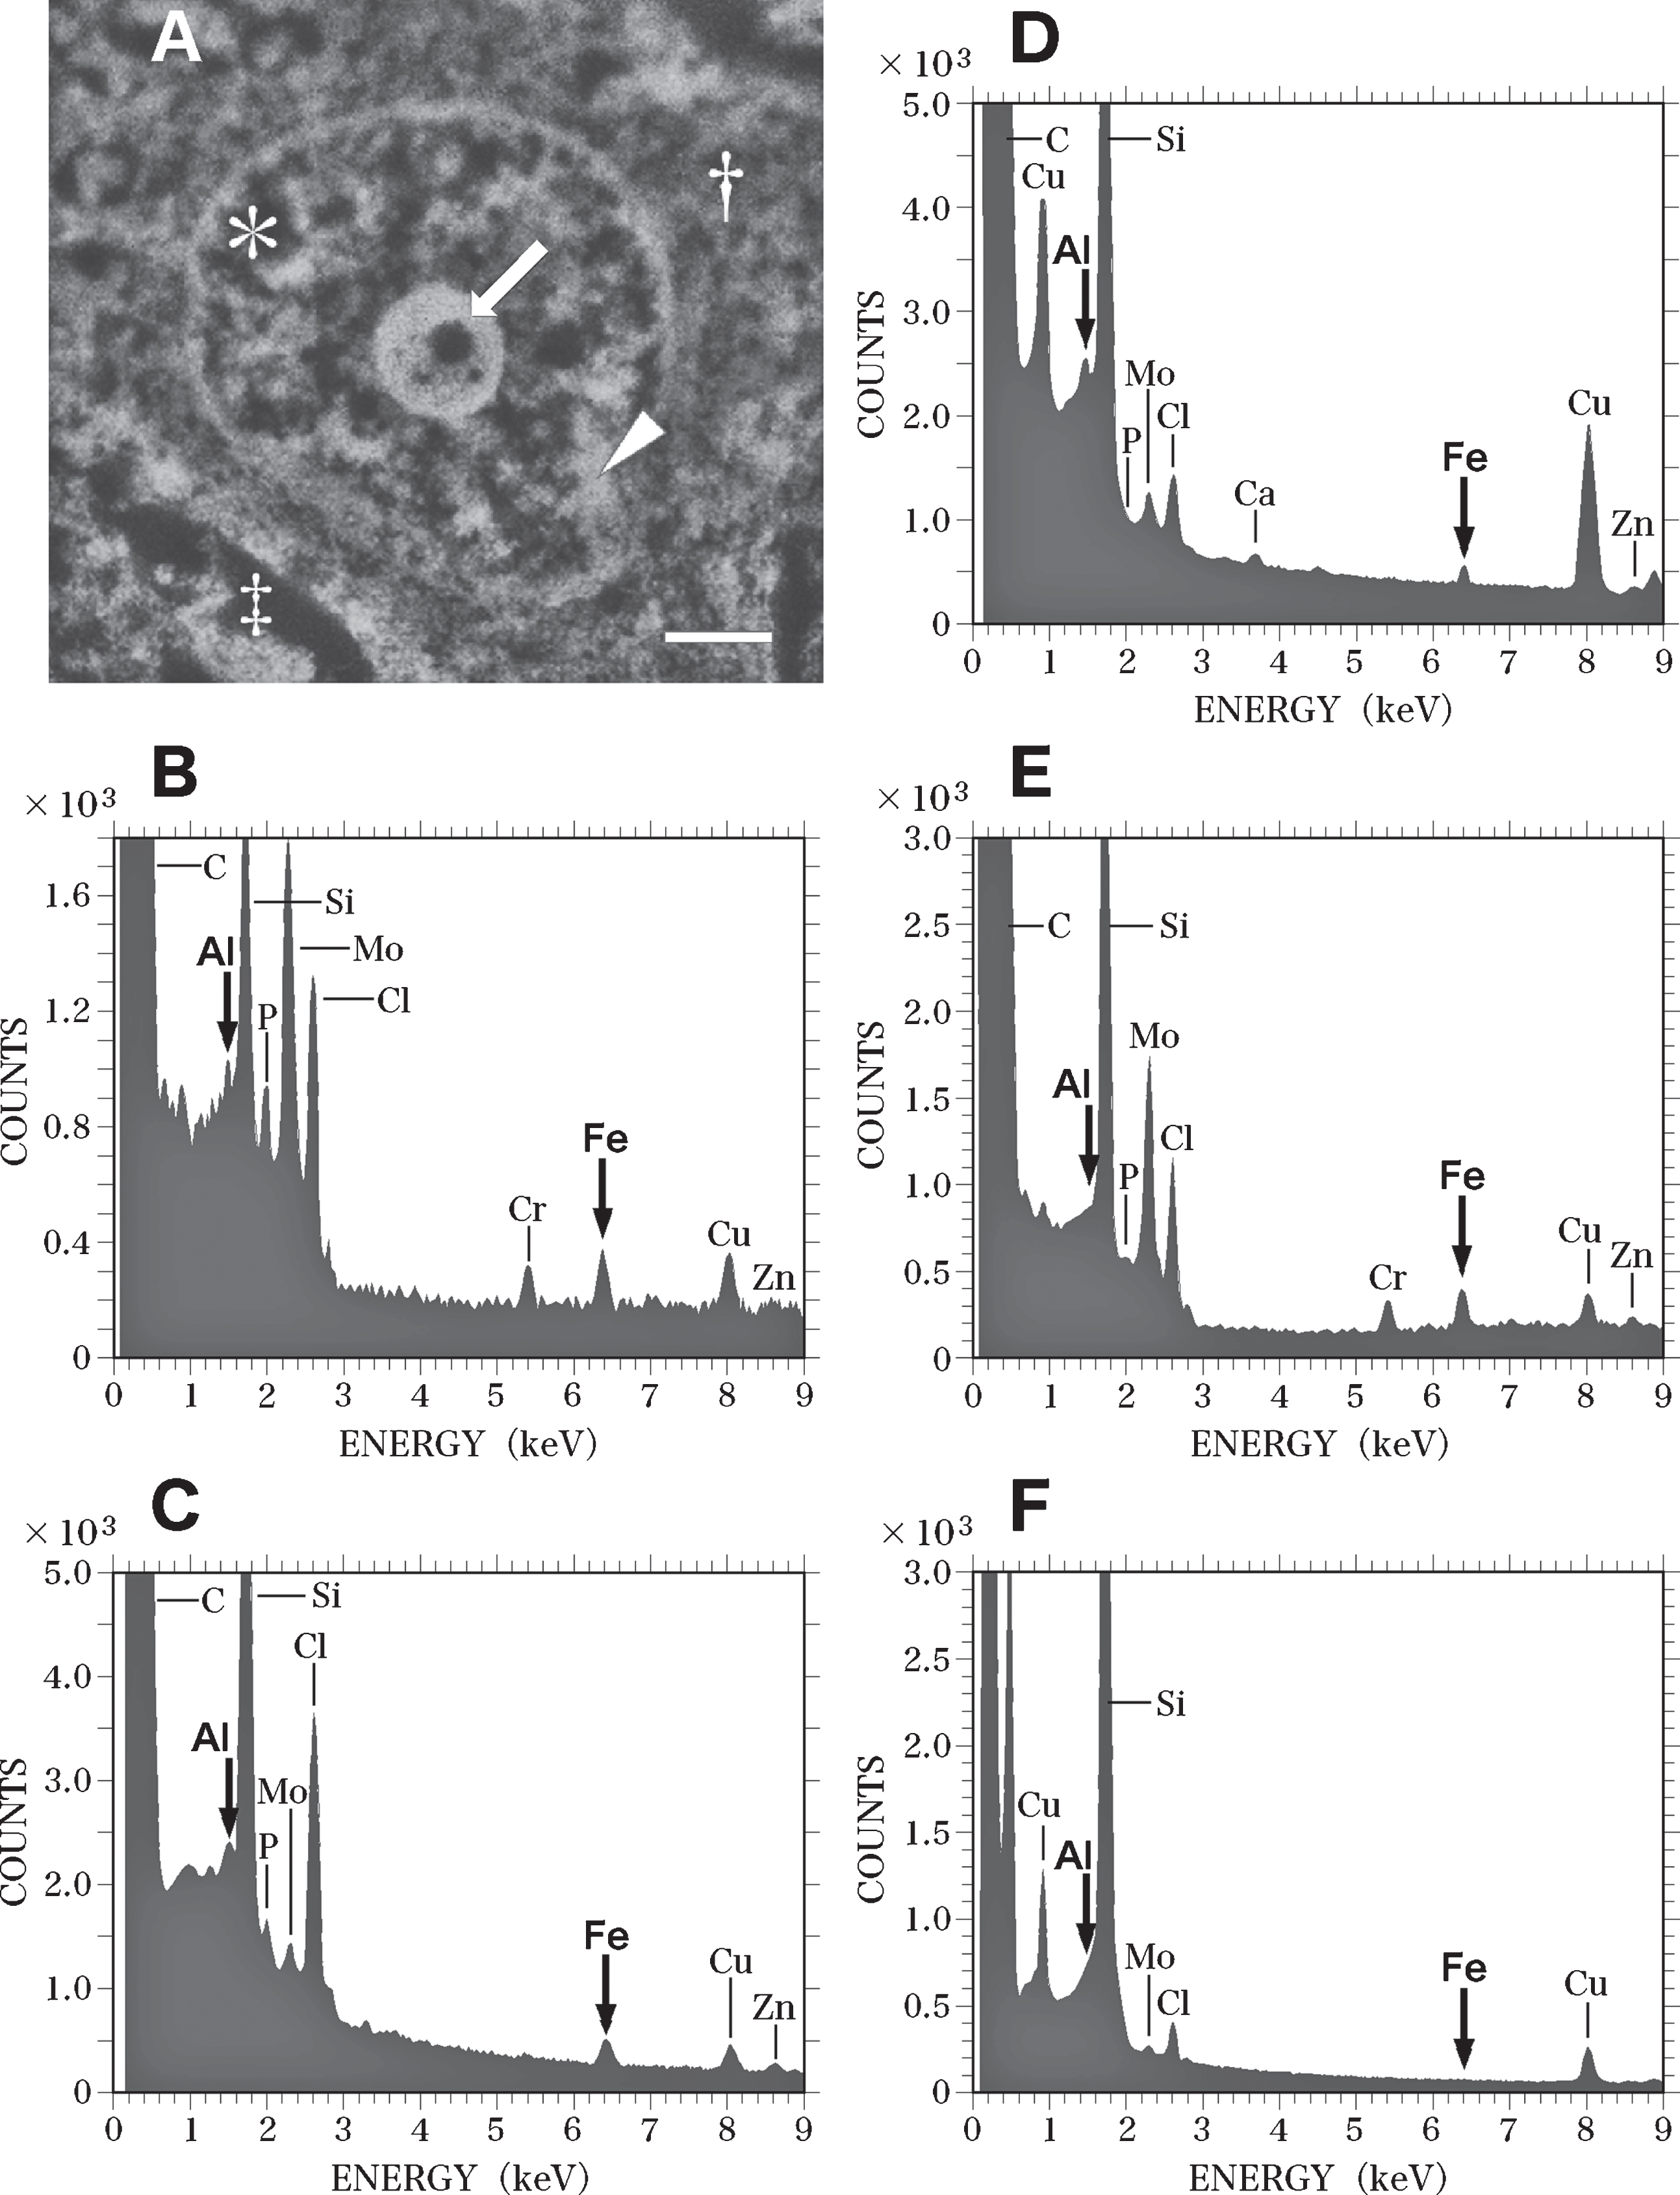
When a small region (0.2μm in diameter) of the nucleolus (Fig. 6A, arrow) was analyzed using EDS, Al and Fe were found to be clearly colocalized (Fig. 6B, arrows). Peaks for phosphorus (P), molybdenum (Mo), and Cr were also detected in the nucleolus (Fig. 6B). The Mo peak was considered to originate from the staining of sections with ammonium molybdate, and the Cr peak was thought to be due to the fixation of brain samples with potassium dichromate. The P peak was considered to represent the phosphorus in the nucleic acids and histone proteins contained in the nucleolus [63]. The EDS analysis also demonstrated the colocalization of Al and Fe in the heterochromatin (Fig. 6C) and euchromatin (Fig. 6D) of nerve cells. However, the peaks of both Al and Fe measured in the heterochromatin and euchromatin were markedly lower than those in the nucleolus.
In the perinuclear region of the cytoplasm (Fig. 6A, dagger), an elevated Fe peak was observed, while no Al peak could be detected using EDS (Fig. 6E). In this study, neurofibrillary tangles in the cytoplasm of nerve cells in the AD brain were not examined using EDS, because tangles have been previously reported to contain high levels of Al [71] and Fe [72]. In the extracellular space (Fig. 6A, double dagger) surrounding nerve cells, no Al or Fe was detected using EDS (Fig. 6F). The contamination of these nerve cells with environmental Al or Fe can thus be ruled out. The SEM-EDS analyses revealed no significant differences between the nerve cells in the temporal cortex and those in the hippocampus in the AD brain.
Nerve cells in control brains
Figure 7 shows a SEM micrograph of a nerve cell in the hippocampus of the control brain taken at autopsy, and fixed with potassium dichromate. A large nucleus was located in the center of the nerve cell. A dendrite (D in Fig. 7) branched from the cytoplasm (dagger in Fig. 7). The extracellular space (double dagger in Fig. 7) became enlarged due to postmortem changes. The nuclear envelope (NE) retained its intact structure without breakage. The intranuclear structures such as the nucleolus, heterochromatin (H, bright region), and euchromatin (E, dark region) were well preserved.
SEM micrograph of a nerve cell in the hippocampus of the control brain. The SEM micrograph exhibits a nerve cell of the control brain fixed with potassium dichromate and stained with ammonium molybdate. The nuclear envelope (NE) retains an intact structure and the intranuclear structures such as the nucleolus, heterochromatin (H, bright region), and euchromatin (E, dark region) are well preserved. A dendrite (D) branches from the cytoplasm (dagger). An arrow shows pars amorpha in the nucleolus. The extracellular space (double dagger) is enlarged due to postmortem changes. Scale bar, 1μm.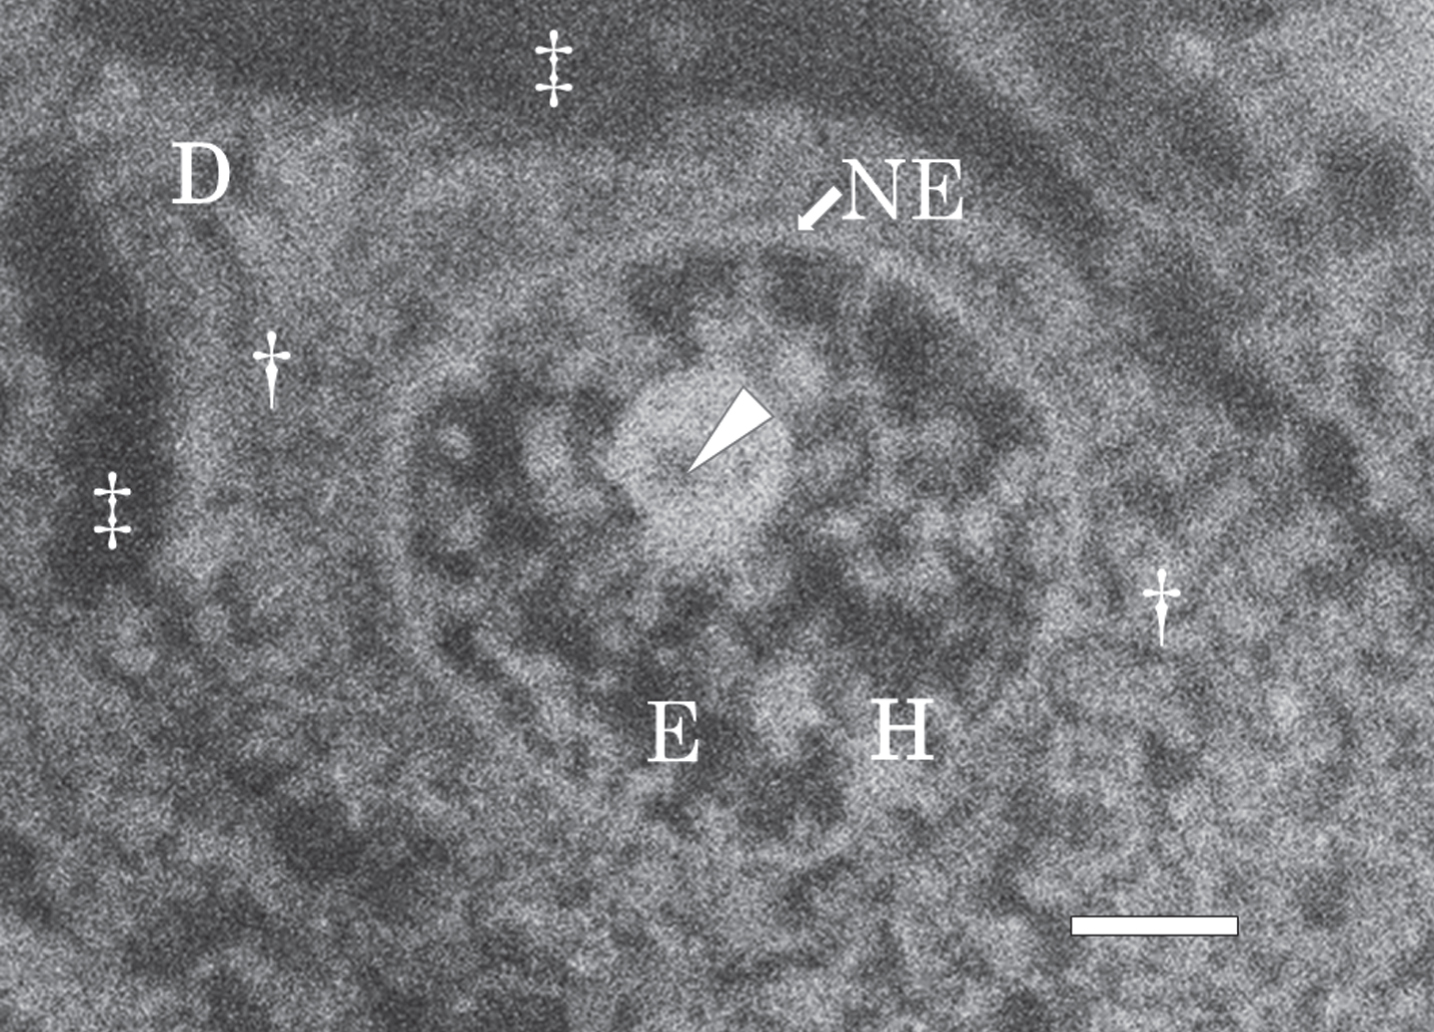
Figure 8 shows SEM-EDS analysis on the nerve cell in the control brain exhibited in Fig. 7. Figure 8A presents a SEM image of the nucleus of the nerve cell shown in Fig. 7. Intranuclear structures such as the nucleolus (Fig. 8A, arrow), heterochromatin (Fig. 8A, arrowhead), and euchromatin (Fig. 8A, asterisk) were clearly observed.
SEM-EDS analysis of the nucleus of the nerve cell in the control brain exhibited in Fig. 7. A) SEM image of the nucleus of the nerve cell in the control brain shown in Fig. 7. SEM image shows the nucleolus (arrow), heterochromatin (arrowhead) and euchromatin (asterisk) in the nucleus. Dagger shows the perinuclear cytoplasm. Double dagger indicates the extracellular space. Scale bar, 1μm. B) EDS spectrum of the nucleolus (A, arrow) of the nerve cell in the control brain. Arrows indicate the sites for Al Kα (1.487 keV) and Fe Kα (6.404 keV), respectively. Al and Fe peaks (arrows) are detected in the nucleolus. However, these Al and Fe peaks of the nucleolus in the control brain are significantly lower than those measured in the AD brain C) EDS spectrum of the heterochromatin (A, arrowhead) in the nerve cell of the control brain. No Al or Fe can be detected in the heterochromatin in the control brain. D) EDS spectrum of the euchromatin (A, asterisk) in the nerve cell in the control brain. No Al or Fe can be detected in the euchromatin in the control brain. E) EDS spectrum in the perinuclear cytoplasm (A, dagger) in the nerve cell in the control brain. The elevated peak for Fe is demonstrated in the perinuclear cytoplasm. In contrast, no Al peak is detected. F) EDS spectrum in the extracellular space (A, double dagger) in the control brain. No Al or Fe can be detected in the extracellular space in the control brain.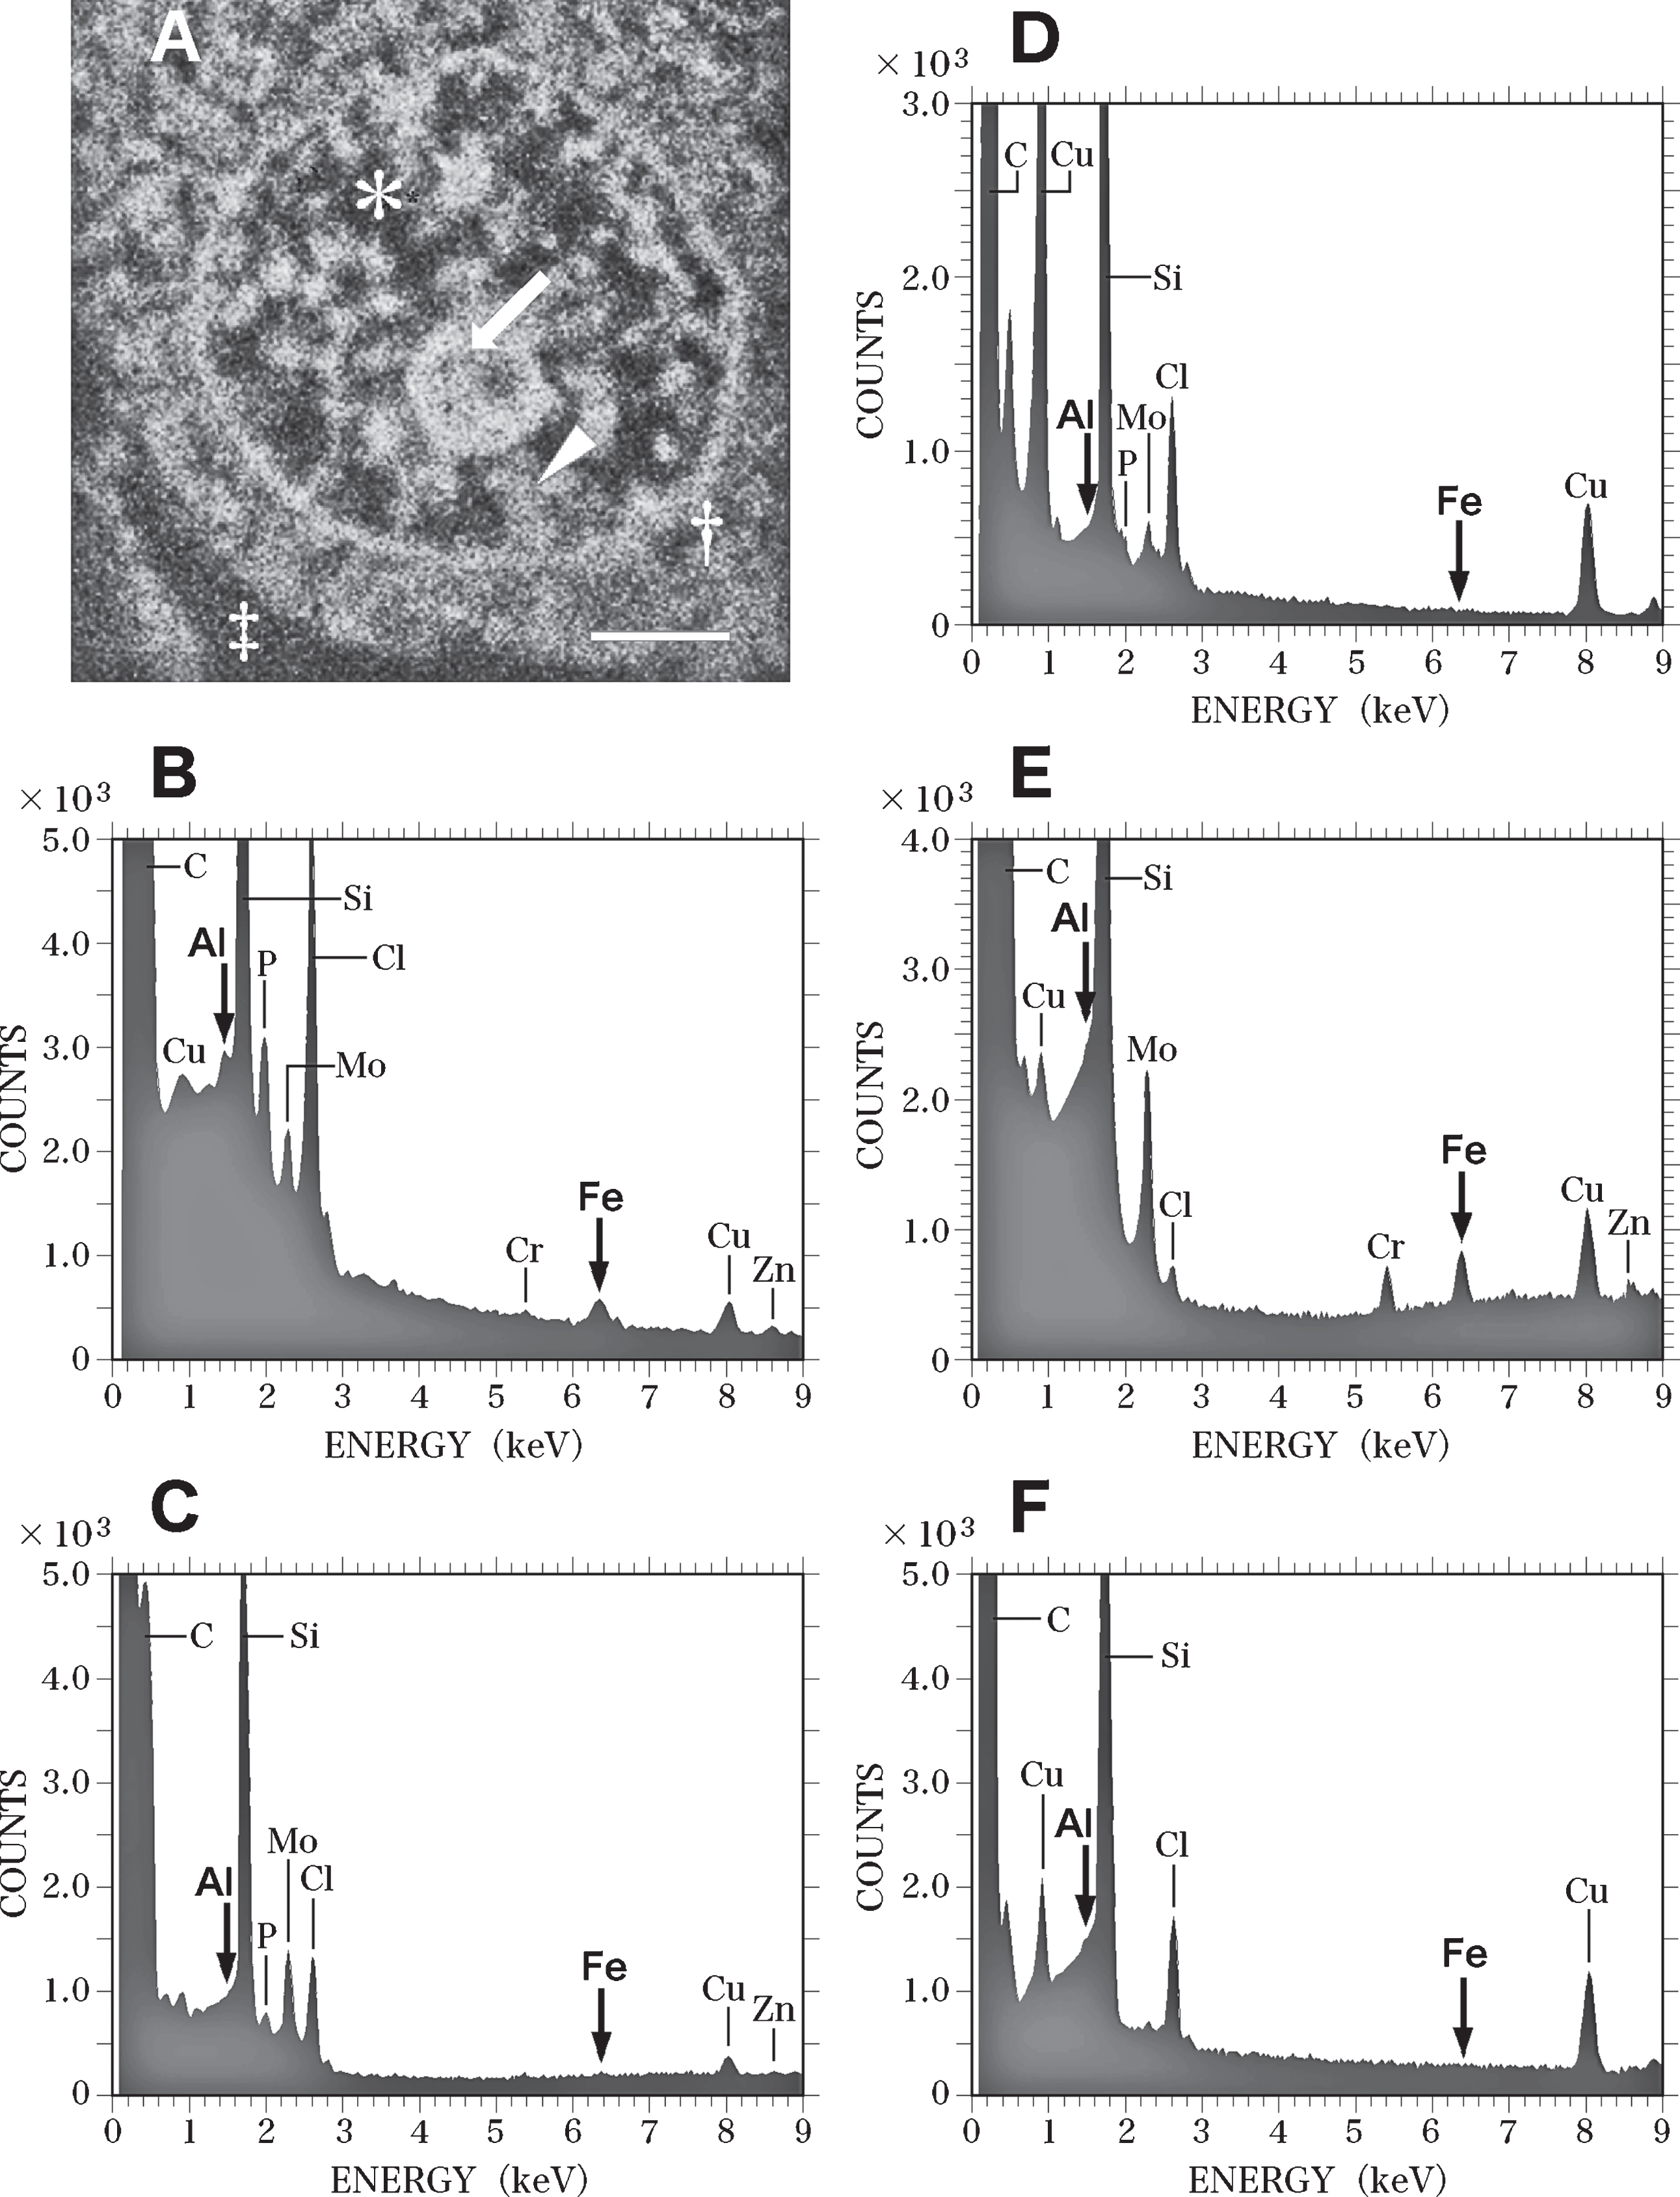
EDS analysis proved peaks for both Al and Fe (Fig. 8B, arrows) in the nucleolus. However, the Al and Fe peaks in the nucleoli of nerve cells in the control brain were markedly lower than those in the AD brain. No Al or Fe could be detected in the heterochromatin or the euchromatin of nerve cells in the control brain (Fig. 8C and Fig. 8D, respectively. In the perinuclear region of the cytoplasm of nerve cells (Fig. 8A, dagger), a large peak for Fe was detected, although no Al was found here (Fig. 8E). In the extracellular space (Fig. 8A, double dagger) surrounding nerve cells, no Al or Fe could be detected using EDS (Fig. 8F). Moreover, SEM-EDS analyses revealed no significant differences between nerve cells in the temporal cortex and those in the hippocampus of the control brain.
Table 1 summarizes the results of the EDS analysis of nerve cells in the AD and control brains. The colocalization of Al and Fe was demonstrated in the nucleolus, heterochromatin, and euchromatin in the nuclei of nerve cells in the AD brain. Statistical analysis by Welch’s t-test method showed that the levels of Al and Fe in the nucleus of nerve cells in the AD brain were markedly higher than those in age-matched control brains (t-test, p < 0.05) [67]. The statistical analysis by Welch’s t-test also revealed that both Al and Fe levels in the nucleolus were the highest within the nuclei of nerve cells in the AD brain. On the other hand, the levels of Fe in the perinuclear cytoplasm were almost similar levels in the AD and control brain.
DISCUSSION
Here we demonstrated the colocalization of Al and Fe in the nuclei of nerve cells in the AD brain using SEM-EDS analysis. In neuronal nuclei in the AD brain, the highest levels of both Al and Fe were measured in the nucleoli. Al and Fe were colocalized in the heterochromatin and euchromatin in these nuclei. Notably, Fe and Al levels in the nuclei of nerve cells were significantly higher in AD brains than in age-matched control brains. In contrast, similar levels of Fe were measured in the perinuclear cytoplasm of nerve cells in AD and control brains. It is likely that the overloading of Fe due to Fe dyshomeostasis [73, 74] in nerve cells in the AD brain may lead to the accumulation of excess Fe in the nucleus of nerve cells.
Intranuclear DNA-containing structures, such as the nucleolus, heterochromatin, and euchromatin, are composed of assemblies of chromatin fibers (chromatin). Each chromatin fiber mainly consists of nDNA and histone proteins, which bind firmly to each other [50–52]. We have previously reported that when Al-26, which is a radioisotope of Al, was intraperitoneally injected into rats, 90% of the Al-26 incorporated into the isolated brain-cell nuclei was bound to the chromatin fraction [75]. Al has been reported to exhibit high affinity for phosphate groups [76–78], and Martin has reported that phosphorylated histone proteins represent a crucial Al-binding site in chromatin [79]. Lukiw et al. have reported that Al binds to H1 linker histone proteins, which bind to linker DNA [80, 81]. Moreover, Llorente et al. have demonstrated the binding of Al to n-DNA contained within chromatin using fluorescence microscopy [82].
Fe3 + also exhibits high affinity for DNA [41] and phosphorylated proteins [83]. In the AD brain, Fe was demonstrated to bind to DNA [83, 84]. This binding was reported to be due to the dysregulation of Fe homeostasis associated with AD [73, 86]. Fe3 + was shown to selectively bind to isolated phosphorylated proteins in vitro. Yamamoto et al. have reported that Fe3 + selectively binds to phosphorylated tau proteins [88], which are the major components of paired helical filaments present in the AD brain [89]. Because Fe3 + displays robust phosphate-binding capacity [90] and can selectively bind to phosphorylated proteins [83, 88], phosphorylated histone proteins might represent Fe-binding sites in neuronal nuclei of AD brains. Therefore, we conclude that a considerable fraction of the Al and Fe contained in the nuclei of nerve cells in the AD brain might bind to nDNA and/or phosphorylated histone proteins, and that these two metals might be colocalized in close proximity to each other in chromatin in neuronal nuclei in the AD brain.
DNA is oxidized by the hydroxyl radicals generated via the Fenton reaction in the presence of Fe (Fe(II)) and hydrogen peroxide [41, 91]. However, during the Fenton reaction, Fe(II) transforms into Fe(III), which does not lead to the generation of hydroxyl radicals (Formula 1, below) [92]. If the redox-inactive Fe(III) is not reduced to redox-active Fe(II) again, the Fe(II) that has reacted once with hydrogen peroxide through the Fenton reaction will not be able to repeatedly generate hydroxyl radicals. This leads to only mild oxidative damage to nDNA. The nucleus is widely recognized to possess an efficient repair system for oxidative DNA damage. This system can effectively repair mild DNA damage [93, 94]. Kulkarni and Wilson have reported that although human cells are subjected to a daily average of approximately one million DNA lesions, under physiological conditions, these lesions are repaired every day by the DNA repair system [95].
Conversely, Imlay et al. have reported that considerable oxidative damage to DNA through the Fenton reaction requires the presence of either a constant source of reducing equivalents or sufficient amounts of reducing compounds in order to repeatedly reduce Fe(III) into the redox-active Fe(II) [96, 97]. Chakrabarti et al. have reported the presence of substantial oxidative DNA damage by hydroxyl radicals in the presence of adriamycin-bound Fe(III), hydrogen peroxide, and ascorbate [98]. Adriamycin interacts with DNA by intercalating between DNA bases [99]. Chakrabarti et al. have reported that ascorbate present in sufficient amounts can repeatedly reduce adriamycin-bound Fe(III) to Fe(II), which results in repeated production of hydroxyl radicals through the Fenton reaction [98].
Al has been reported to promote Fe-mediated oxidation [28, 32]. Recently, Exley [24] and Lopez et al. [26, 100] have reported that Al3 + binds to the superoxide anion radical (O2¯•, superoxide) to form the Al superoxide semi-reduced radical ion (AlO22 +•, Al-superoxide complex) under physiological conditions (Formula 2, below). The Al-superoxide complex can reduce Fe(III) to Fe(II) (Formula 3, below). The newly formed Fe(II) was reported to be capable of generating hydroxyl radicals again, thus implicating the occurrence of a cyclic reaction in this biological oxidation pathway.
Based on the results presented in these reports [24, 100], it appears that the Al and Fe colocalized in the nuclei of nerve cells in the AD brain may catalyze the cyclic reaction leading to the generation of hydroxyl radicals. These hydroxyl radicals may then lead to marked oxidative damage to nDNA in the presence of hydrogen peroxide and superoxide.
The human brain is a highly aerobic organ; although the brain accounts for only 2% of the body weight, it consumes as much as 20% of the oxygen in the entire body [101–103]. The oxygen in the brain is largely used by neurons to supply the energy to maintain ion gradients across the plasma membrane, which are essential for the generation of action potentials. This energy requirement of neurons is driven by mitochondrial oxidative phosphorylation. Notably, approximately 2% of the oxygen consumed in mitochondria is converted into ROS such as superoxide and hydrogen peroxide [101, 105]. Because superoxide and hydrogen peroxide can cross cell membranes through anion channels [106–109] and aquaporin water channels, respectively [108–110], large amounts of the superoxide and hydrogen peroxide generated in mitochondria diffuse into the cytoplasm and the nuclei of nerve cells.
In the young adult brain, hydrogen peroxide is efficiently detoxified by glutathione peroxidase and catalase in the cytoplasm [111]. Superoxide is also actively catalyzed by superoxide dismutase into hydrogen peroxide and oxygen [112]. In contrast, in the aged brain, the amounts of ROS generated in mitochondria increase markedly because of the mitochondrial dysfunction that occurs with aging [113–115]. Venkateshappa et al. have reported that antioxidant enzyme activities decrease considerably in the human hippocampus and frontal cortex with increasing age [116]. Therefore, neurons in the aged brain appear to be particularly vulnerable to ROS when compared with neurons in the young adult brain [117, 118].
Another key previous finding is that metals that bind to DNA or DNA-binding proteins inhibit the repair of oxidatively damaged DNA [85, 119–121]. These metals, including Fe and Al, were reported to impair the DNA glycosidase activity required for the repair of DNA base excision [119, 120]. Hegde et al. also reported that the Fe that bound to DNA inhibited the activities of DNA-repair enzymes by both oxidizing these enzymes and forming stable complexes with the enzymes [121]. These stable complexes were reported to interfere with the scanning and detection of DNA damage. Therefore, it is probable that the Fe and Al colocalized in the nuclei of nerve cells not only cause oxidative damage to nDNA but also concurrently inhibit the repair of oxidatively damaged nDNA [84, 122].
An imbalance resulting from the increase in oxidative nDNA damage and the decrease in DNA repair activities might lead to the accumulation of unrepaired damaged DNA with increasing age [95, 123]. Lovell and Markesbery [38] and Coppedè and Migliore [124] have reported that accumulation of DNA damage is one of the earliest detectable events during the progression from healthy aging to dementia. Accumulation of nDNA damage in neurons has been considered to be a major factor in AD development [125]. The increased amount of genome damage might result in RNA and protein damage, giving rise to misfolding and aggregation of abnormal protein components [126, 127]. Toxic protein aggregates have been reported as potential contributory factors to various neurodegenerative diseases. These proteins include amyloid-β in AD [3, 8], tau in frontotemporal dementia [128], and α-synuclein in Parkinson’s disease [129]. Consequently, accumulation of nDNA damage in neurons might induce neurodegenerative pathology and, ultimately, neuron death.
In conclusion, we used SEM-EDS analysis to demonstrate the colocalization of Al and Fe in the nuclei of nerve cells in brains from patients with AD. The highest levels of both Al and Fe were measured in the nucleoli of nerve cells from AD brains. The colocalization of Al and Fe was also demonstrated in heterochromatin and euchromatin in neuronal nuclei from AD brains. Al and Fe levels in neuronal nuclei were markedly higher in AD brains than in age-matched control brains. We hypothesize that the Al and Fe colocalized in the nuclei of nerve cells might play a pivotal role in neuron degeneration and AD pathogenesis by inducing oxidative nDNA damage and, concomitantly, inhibiting the repair of oxidatively damaged nDNA.
Footnotes
ACKNOWLEDGMENTS
The authors thank Dr. Koichi Kobayashi, Dr. Hisao Nagai, and Dr. Tadashi Shimamura for valuable discussion and technical assistance. The authors would like to acknowledge the Department of Pathology at the University of Tokyo and the Department of Pathology at the Nihon University School of Medicine for the provision of brain tissues used in this study. The authors thank the Micro Analysis Laboratory of the University of Tokyo for the PIXE assays of the samples.