
Abstract
Background:
Amyloid PET (aPET) imaging could improve patient outcomes in clinical practice, but the extent of impact needs quantification.
Objective:
To provide an aggregated quantitative analysis of the value added by aPET in cognitively impaired subjects.
Methods:
Systematic literature searches were performed in Embase and Medline until January 2017. 1,531 cases over 12 studies were included (1,142 cases over seven studies in the primary analysis where aPET was the key biomarker; the remaining cases included as defined groups in the secondary analysis). Data was abstracted by consensus among two observers and assessed for bias. Clinical utility was measured by diagnostic change, diagnostic confidence, and patient management before and after aPET. Three groups were further analyzed: control patients for whom feedback of aPET scan results was delayed; aPET Appropriate Use Criteria (AUC+) cases; and patients undergoing additional FDG/CSF testing.
Results:
For 1,142 cases with only aPET, 31.3% of diagnoses were revised, whereas 3.2% of diagnoses changed in the delayed aPET control group (p < 0.0001). Increased diagnostic confidence following aPET was found for 62.1% of 870 patients. Management changes with aPET were found in 72.2% of 740 cases and in 55.5% of 299 cases in the control group (p < 0.0001). The diagnostic value of aPET in AUC+ patients or when FDG/CSF were additionally available did not substantially differ from the value of aPET alone in the wider population.
Conclusions:
Amyloid PET contributed to diagnostic revision in almost a third of cases and demonstrated value in increasing diagnostic confidence and refining management plans.
Keywords
INTRODUCTION
An accurate dementia diagnosis is crucial to optimize effective patient management strategies. Recent diagnostic criteria for Alzheimer’s disease and its prodromal states now include measurement of at least one biomarker to support clinical assessments [1 –4]. The approval of 18F-labelled amyloid PET (aPET) tracers—AmyvidTM (Eli Lilly, [5, 6]), NeuraceqTM (Piramal Inc., [7, 8]), and VizamylTM (GE Healthcare, [9, 10])—in multiple countries worldwide from 2012 onwards, has meant that aPET has been increasingly used in routine evaluation of patients with cognitive impairment.
As part of regulatory approval processes for aPET tracers, autopsy studies correlating tracer uptake to pathologically detected amyloid demonstrated sensitivities of 91–98% and specificities of 89–100% [11 –14]. Previous aPET meta-analyses focused on diagnostic accuracy relative to clinical or pathological standards of truth [15 –17]. Similar analyses have been conducted on other relevant dementia tests, such as [18F]fluorodeoxyglucose PET (FDG) [18, 19], cerebrospinal fluid (CSF) analysis [18, 20], magnetic resonance imaging (MRI) [18], and Mini-Mental State Examination (MMSE) scoring [21].
This aggregated analysis expands on the recent paper by Barthel and Sabri [22] who focused on a high level qualitative overview of aPET utility across individual studies. Here, the primary analysis consolidates individual patient data from each included study, generating deeper insight into diagnostic changes and clinical value added by aPET in cognitively impaired subjects. Using as baseline working diagnoses and management plans before aPET scanning, aPET is analyzed in its utility as a tool to aid differential diagnosis, diagnostic confidence and patient management. Individual diagnostic trajectories pre- to post-scan are also described for four different patient groups relevant to the quantification of aPET utility and include confidence intervals to give an estimate of variability around the pooled patient groups. The latter include the Appropriate Use Criteria (AUC) patient group, recommended jointly by the Alzheimer’s Association and the Society for Nuclear Medicine and Molecular Imaging [23, 24] and comprised only of cases where aPET is specifically recommended (indeterminate persistent mild cognitive impairment (MCI), atypical or mixed disease presentation or atypically early age of onset).
METHODS
Study identification and selection
To classify for inclusion, studies had: A diagnostic and clinical utility analysis of aPET imaging visually interpreted by pre-established [5
–10] dichotomization methods (i.e., amyloid positive or negative). More than ten cognitively impaired patients. Pre-aPET working diagnoses based on symptoms, clinical history, neuropsychological testing and/or structural imaging and without aPET. Post-aPET final diagnoses based on in vivo clinical diagnostic criteria of the highest standards available at the time of study execution [1–4
, 26]. Histopathological validation of the final diagnoses was not reported in any aPET utility study. A unique and sequential association between aPET and post-aPET diagnosis. Post-aPET diagnoses accompanied by FDG/CSF tests were collected separately. A publication in peer-reviewed scientific journals or a conference presentation with peer-reviewed abstract selection.
Search methods
The systematic search was carried out through MEDLINE and EMBASE (both up to week 4 2017, Ovid interface) using 38 terms (Supplementary Table 1) to identify the included population and disease type, imaging modality, tracers, clinical utility terms and publication language (English). References within review articles were searched for any additional papers (see Supplementary Figure 1 for study selection flow). An additional, more focused 56-term literature search was performed by a second blinded researcher for closer inspection of publications reporting utility measures and as reported in Supplementary Table 2 and Supplementary Figure 2.
From both searches, studies selected for inclusion were reviewed by two authors (E.F., A.C.) (Table 1). Studies with overlapping cohorts were refined only to include the largest studies. Authors were contacted for clarifications when required. Studies excluded at the final manual selection stage are listed in Supplementary Table 3 with the relevant rationale for exclusion.
Overall characteristics of the included studies and incoming patients
aPET, amyloid PET; Dx, diagnosis.
QUADAS
The methodological and reporting quality of the individual studies selected was assessed with the 14-question QUADAS tool [27, 28] adapted by two investigators (E.F., A.C.) to suit this review (see Supplementary Table 4). QUADAS was then applied to each study independently by each investigator and a consensus on scoring reached (Supplementary Table 4). QUADAS was independent of the analysis and not designed to weigh data [29, 30].
Analysis methods
A total number of 1,531 subjects from 12 studies were considered for this aggregated analysis, focusing on assimilating individual study data (rather than summary study results of aPET utility) into quantitative measures. All patients were broadly classified into presumed AD, Non-AD or indeterminate as per Supplementary Table 6. Of these, 1142 cognitively impaired subjects from 7 studies with pre- and post-aPET diagnosis, aPET scans and no FDG/CSF testing were considered for the primary measure (Fig. 1) and consisted of an aggregate analysis of all included patients. A secondary analysis detailing more in-depth patient diagnostic trajectories was also performed (Table 2). This included patient-level data processed into measures useful to draw comparisons between four patient groups from across all 12 studies. Additionally, data on both diagnostic confidence (described in text) and patient management impact (Table 3) was available from a proportion of the studies reviewed and was synthesized insofar as the granularity of reporting allowed.
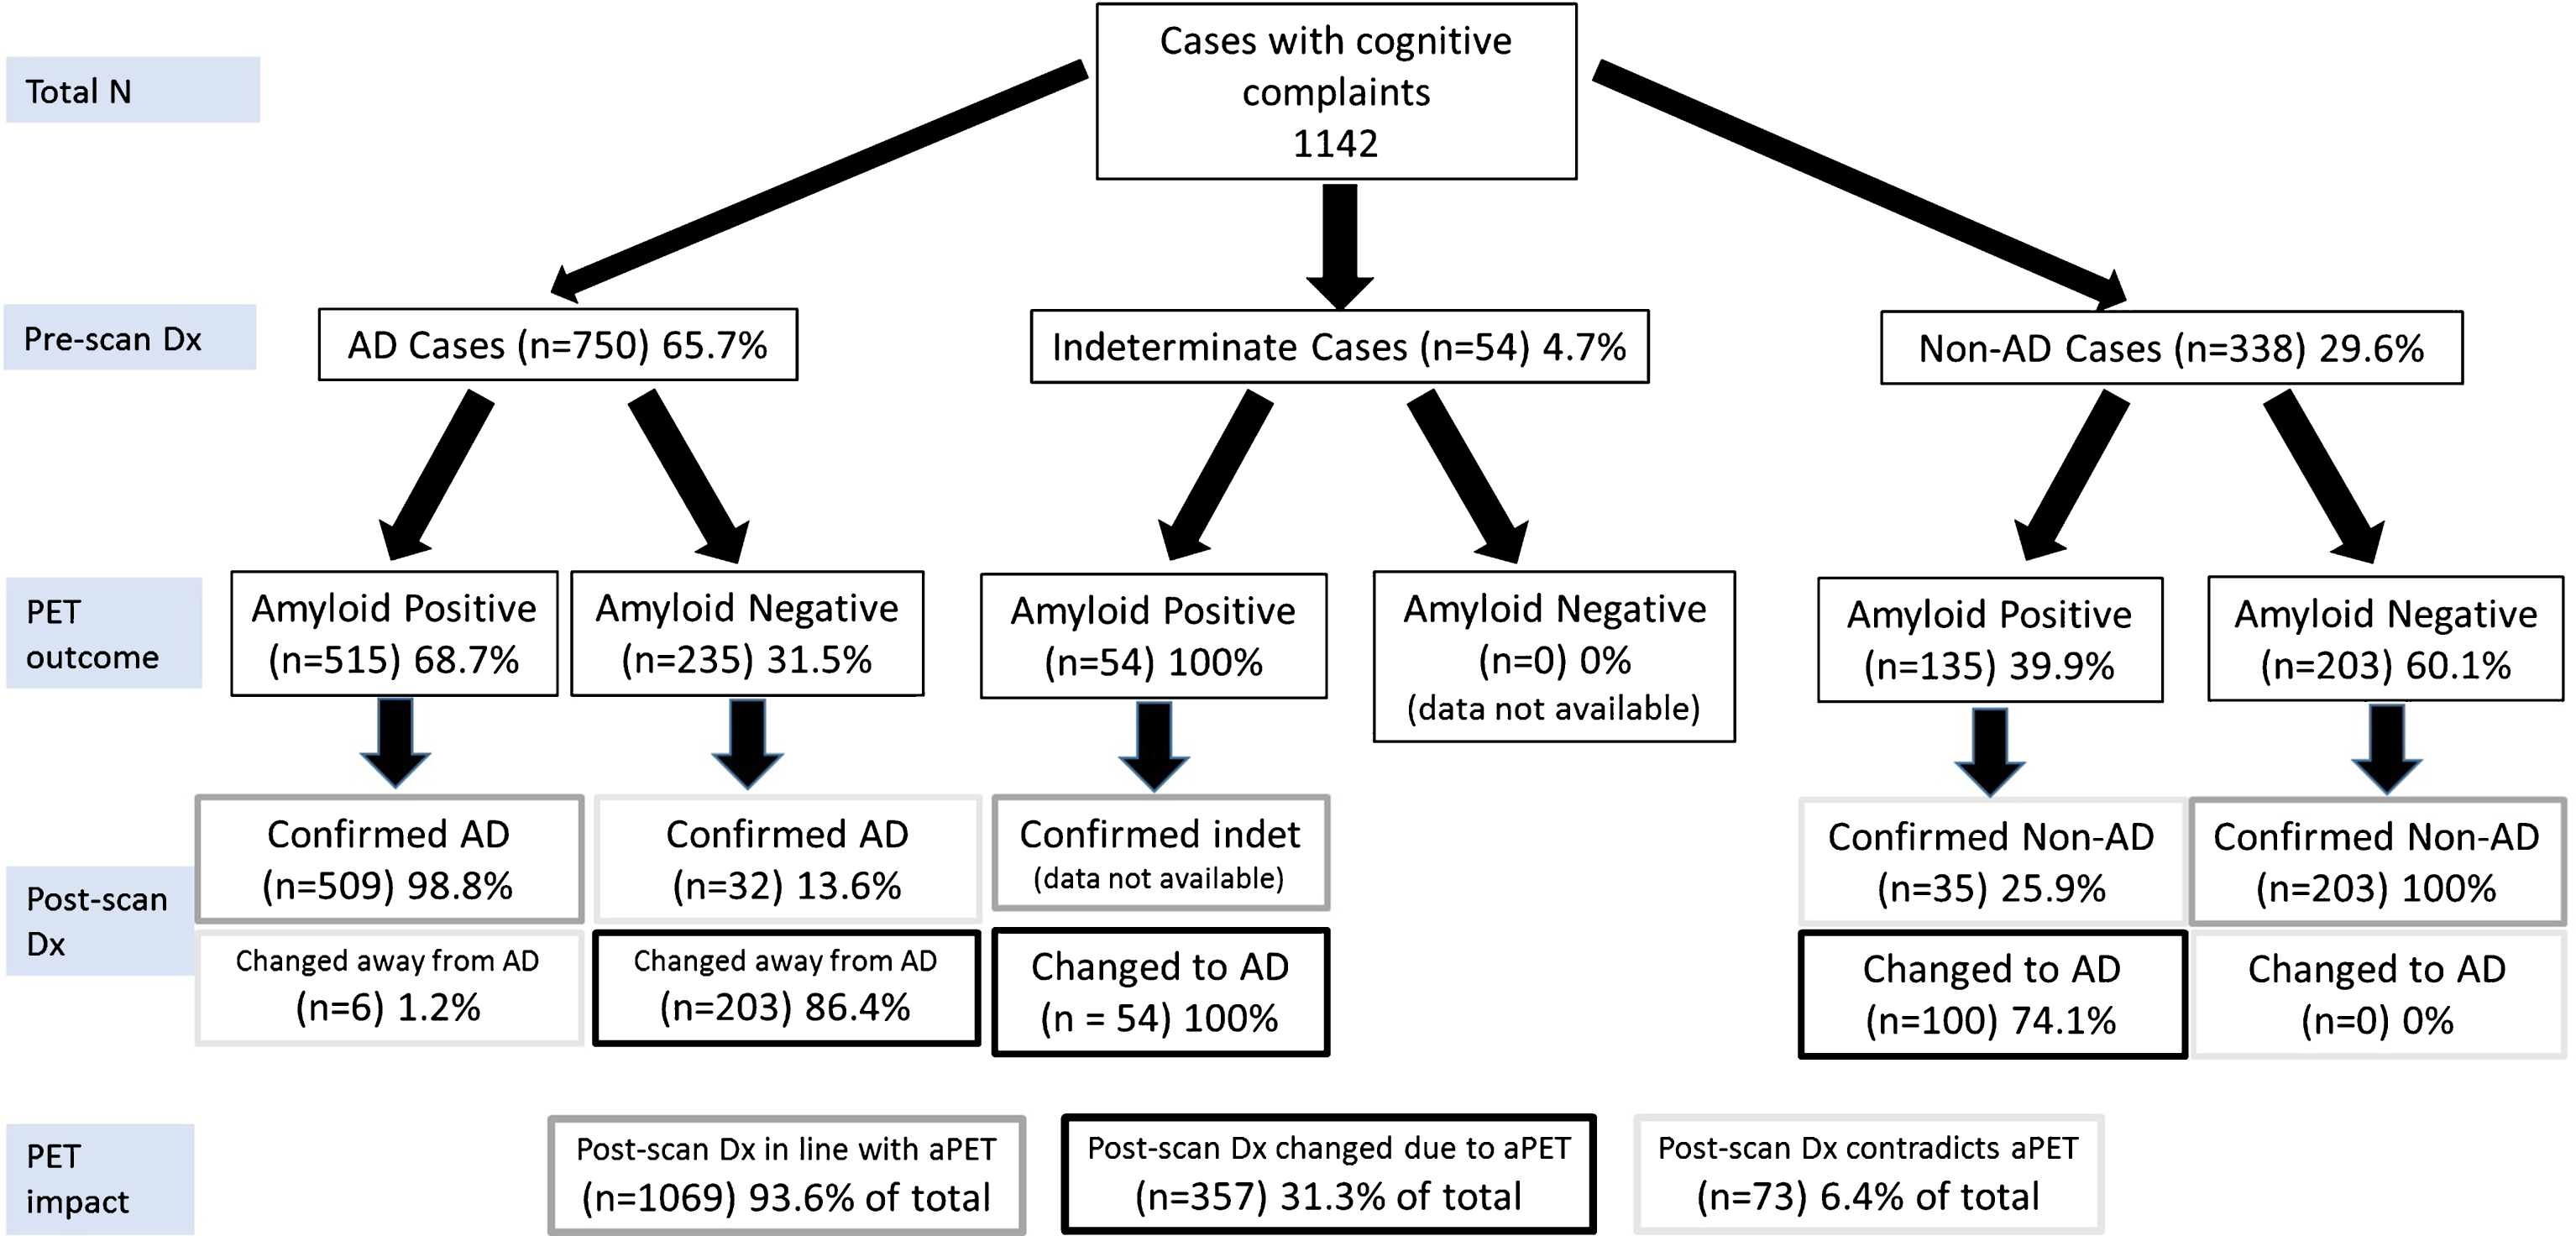
Primary analysis of the diagnostic trajectories for patients without CSF or FDG-PET data available at the time of the pre-scan diagnosis (Group 1). All included subjects were broadly classified into presumed AD, Non-AD or indeterminate as per Supplementary Table 6. Due to the included studies’ reporting format, it was not possible to include cases that undergo the following trajectories: indeterminate-nonAD, nonAD-indeterminate, indeterminate-indeterminate. Hence the only trajectory from indeterminate is indeterminate-AD. Each percentage reported relates to the level above it. Dx, diagnosis. PET, amyloid PET. Color coding from Post-scan Dx onwards: Grey boxes: diagnoses in line with aPET; Black boxes: diagnoses changed in line with PET, Light grey boxes: diagnoses changed or confirmed contradicting PET.
Secondary analysis of the diagnostic trajectories. 95% CI were calculated by the Clopper-Pearson method
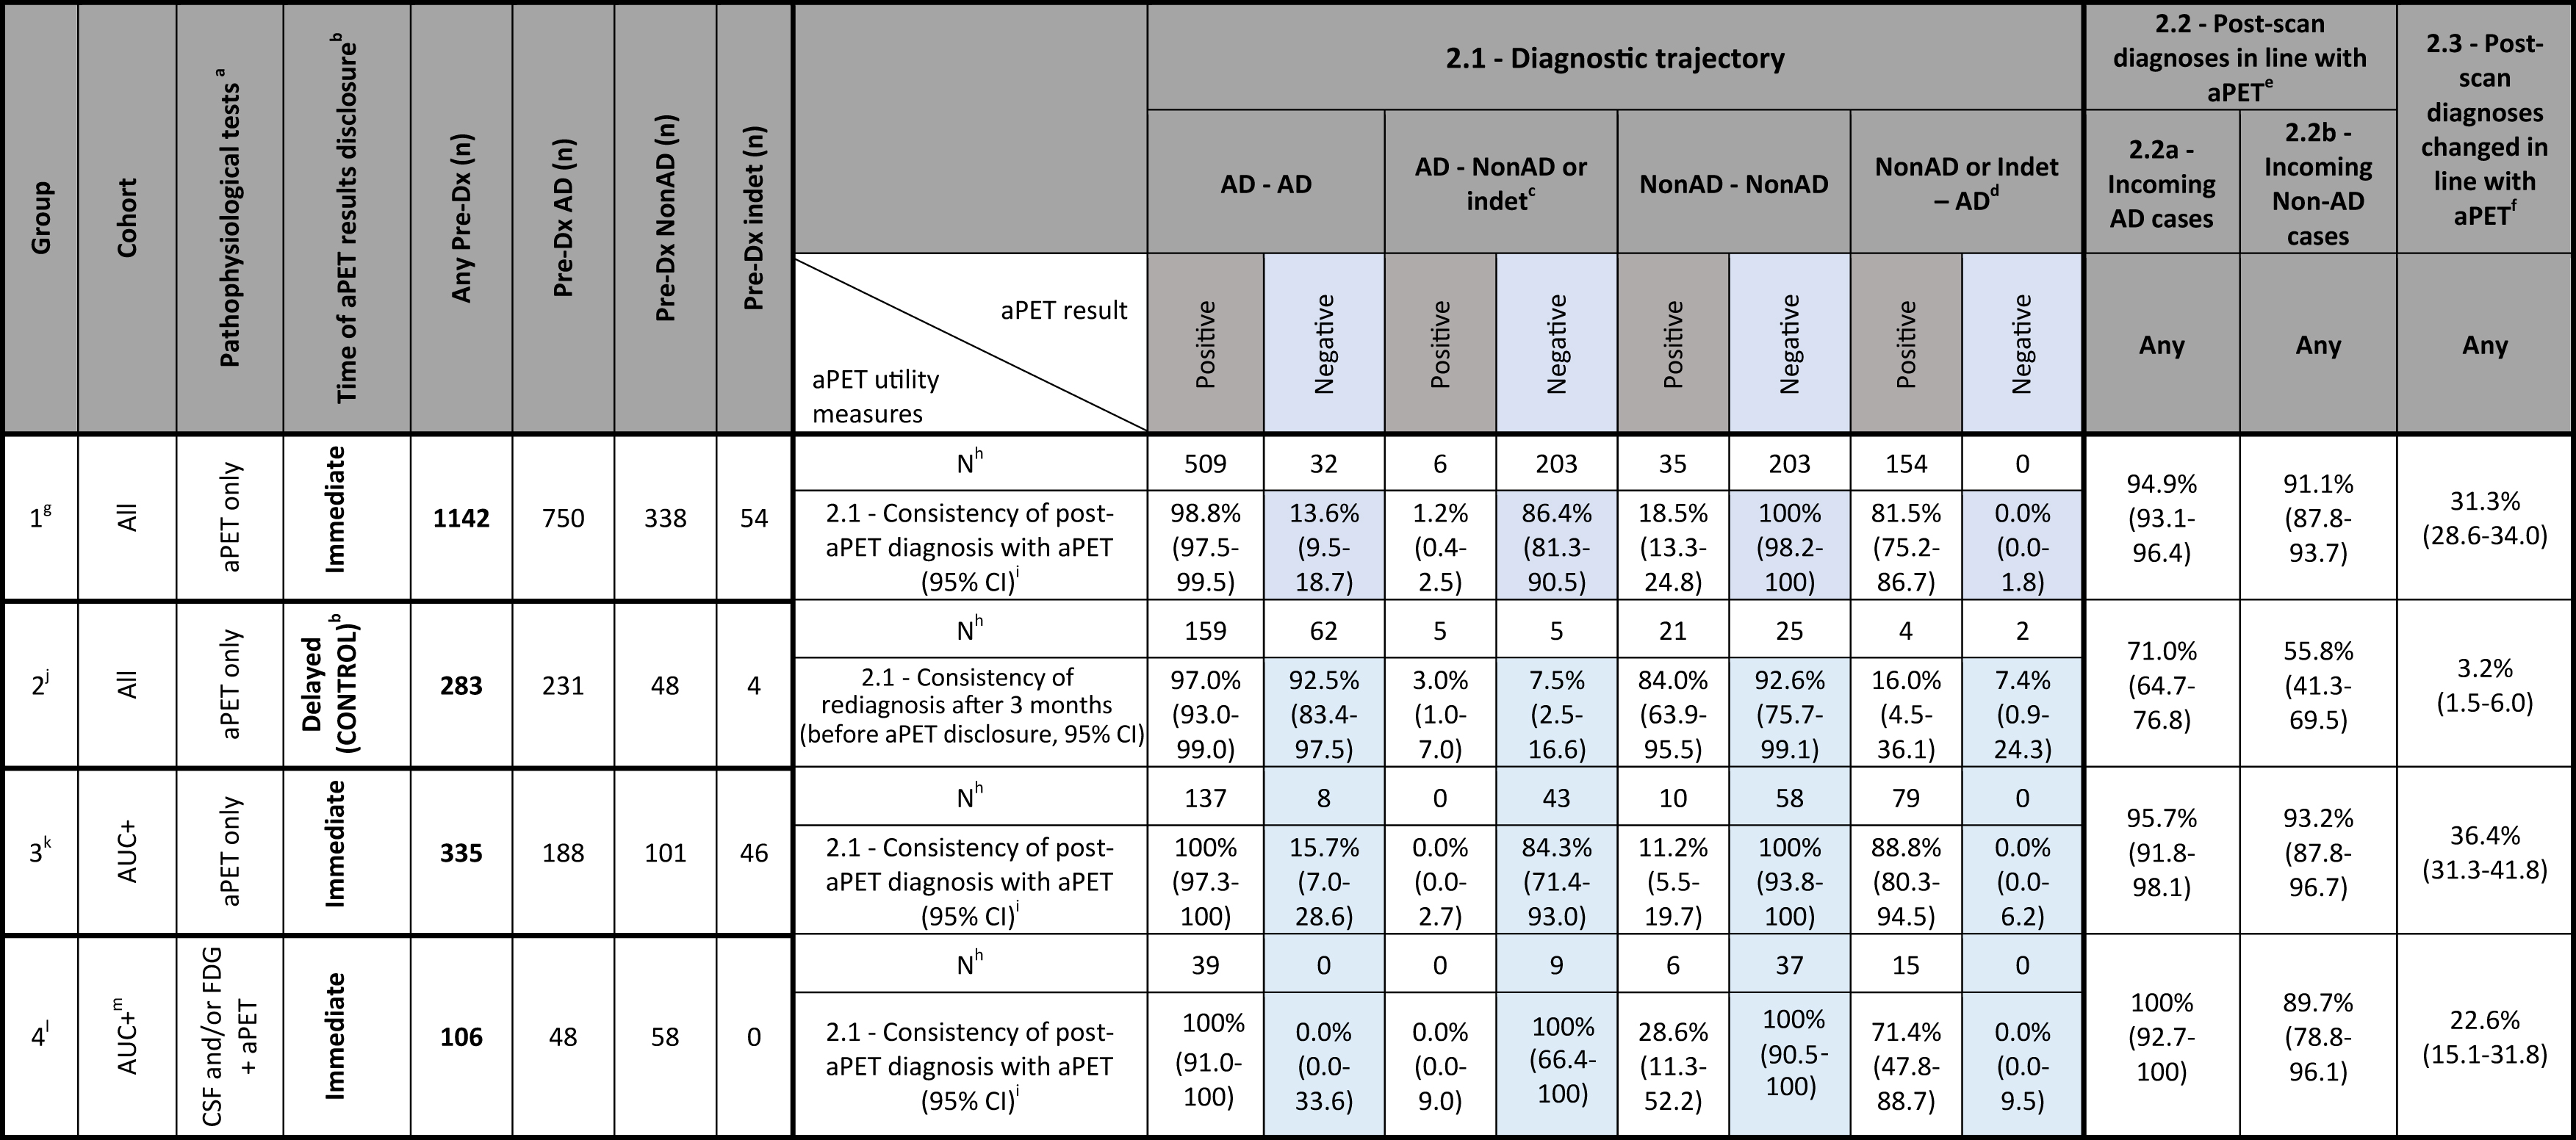
Diagnostic trajectory is defined as confirmation or change of pre-aPET AD or Non-AD diagnosis in the post-aPET diagnosis.
Management changes. 95% CI were calculated by the Clopper-Pearson method
The primary analysis assimilates all cases with pre-aPET diagnoses based only on a combination of clinical history, neurocognitive assessment and/or structural imaging and a post-aPET diagnosis. Three measures were calculated: Post-aPET diagnoses in line with amyloid PET status (as a percentage); Post-aPET diagnoses in contradiction to amyloid PET status (as a percentage); Post-aPET diagnoses changed due to amyloid PET result (as a percentage).
A secondary more in-depth analysis of patient diagnostic trajectories was performed on a set of groups, defined based on the following patient or pre-aPET testing characteristics. Group 1 further analyses all subjects examined in the primary analysis. Group 2 acted as control where the aPET scan result was not disclosed during the 3-month diagnostic assessment period. This served to reveal the extent of diagnostic change independent of aPET. Group 3 only included subjects consistent with the aPET Appropriate Use Criteria (AUC+). Group 4 captured all cases where pre-aPET diagnosis was based on CSF testing and/or FDG in addition to the standard combination of clinical history, neurocognitive assessment and structural imaging.
The above groups were analyzed using three measures outlined below (calculations further outlined in Table 2 caption): Consistency of post-scan diagnosis with aPET result. For each of four possible pre-scan to post-scan diagnostic trajectories (e.g., AD confirmed as AD or Non-AD changed to AD) data is shown for both positive and negative aPET scans (therefore 8 permutations reported as percentages). Post-aPET diagnosis in line with the aPET result (includes those confirmed and those changed) when pre-aPET diagnoses of either AD or Non-AD were recorded (two measures, 2.2a and 2.2b, reported as percentages). Post-aPET diagnoses changed due to amyloid PET result because of the insight provided by aPET (one measure reported as a percentage). This measure is similar to that captured in 1.3 in the primary analysis but is recorded here for all 4 patient groups.
Two measures of impact on confidence were used. The first examined the extent of change in confidence over the population for which quantitative data was available (6 studies, 725 cases [31 –36]) and the second assessed the proportion of patients having a diagnostic confidence increase (6 studies, 870 cases [32 , 36–39]), further subdivided by aPET outcome when reported (5 studies, 850 cases [32 , 37–39]).
The impact on patient management was assessed according to overall management change (in terms of changes in therapy, care plan or additional testing) by aPET outcome and by the change in medications. The same four groups as for the aPET impact on diagnostic change were considered. Some studies discriminated patient management by aPET outcome only (7 studies, 1046 cases [31 , 39–41]) whereas others (4 studies, 605 cases [31 , 41]) split the analysis between positive and negative aPET outcome.
Statistical analysis
Each measure of aPET utility had 95% confidence intervals calculated (Clopper-Pearson method, GraphPad Prism 7). Statistical significance between groups of possible clinical interest (group 1 versus 2 and AD diagnostic rule-in versus rule-out) was analyzed by Pearson Chi-Square Tests on SAS V9.3.
RESULTS
Study characteristics
This review included 12 studies: nine prospective (8 open-label and one randomized to immediate and delayed aPET result disclosure [42]), two retrospective observational studies [38, 41], and a questionnaire extension of a retrospective study [39] (Table 1). The data for [42] was retrieved from a conference poster which was later published in full with no alteration of data [40].
Studies included cohorts of variable size and study reporting format, including some with patient-level data [32–34 , 43] and others with summary data [31 , 42].
Risk of bias within and across studies
The heterogeneity of cohorts included required reclassification of patient diagnostic categories into standardized groups (presumed AD, Non-AD and indeterminate) by consideration of diagnostic guidelines [1] (Supplementary Table 6). Supplementary Table 7 shows the diagnostic language used in each study to include subjects, breakdown of subjects fulfilling the AUC criteria and numbers of patients with additional FDG or CSF testing. The presence within standardized diagnostic groups of a mix of disease stage (prodromal, SCI, MCI, established dementia), age of onset (early, late), symptomatic presentation (typical, atypical, mixed) and certainty of diagnosis (low to high) is acknowledged but its impact is difficult to quantify with the limited data granularity available to correlate to observed diagnostic changes. Nevertheless, this underlying diversity is inherent to populations observed throughout memory clinics, allowing for a clinically relevant and current analysis of the utility of aPET.
The less specialized the clinical setting, the higher the proportion of patients with diagnostic uncertainty, although study inclusion criteria mitigate this effect. Similarly, studies involving an element of randomization, such as unselected consecutive patients [32 , 43] or non-disclosure of aPET result during the diagnostic assessment period [42], are less prone to bias when assessing true aPET impact. Additionally, the group analysis performed in the secondary analysis is limited by the subjects in group 2 coming from the same patient cohort [42] (this point is further expanded in the discussion).
An assessment of study bias can be inferred from QUADAS [27, 28] in Supplementary Table 4.
Quantitative analysis
Impact on diagnosis
Primary analysis: In 1142 patients undergoing aPET and no FDG/CSF testing, the pre-scan working diagnosis was AD in 65.7%, Non-AD in 29.6% and indeterminate in 4.7% of cases (Fig. 1). Among presumed AD subjects, 68.7% were aPET-positive. AD dementia was confirmed post-aPET in 98.8% of these cases, while the diagnosis was changed in the remaining 1.2% despite positive aPET. Among presumed Non-AD subjects, 60.1% were aPET-negative and in all a Non-AD diagnosis was confirmed. All indeterminate cases had positive aPET, and all diagnoses were subsequently revised to AD (by inclusion criteria, see caption to Fig. 1).
Amyloid PET results were incongruent with the pre-aPET working diagnoses in 31.5% of the incoming presumed AD cases and in 39.9% of Non-AD cases, leading to a significantly higher (p = 0.0031) AD diagnosis rule-out (86.4%) than AD rule-in (74.1%). Interestingly, despite discordant aPET results, the pre-aPET working diagnosis was confirmed in 13.6% of AD and 25.9% of Non-AD cases.
Overall, 93.6% of final diagnoses reflect disease pathophysiology suggested by aPET either by confirming the pre-aPET working diagnosis (62.3%) or by a discordant aPET result supporting a change in diagnosis (31.3%). A minority of cases (6.4%) had a revised diagnosis inconsistent with amyloid status.
Secondary analysis:
For the secondary analysis (Table 2), comparisons between patient groups were performed. No substantial difference in terms of the influence of aPET on diagnosis was found for all three outcome measures between group 1 (aPET only, all subjects), group 3 (AUC+ patients) and group 4 (aPET and CSF or FDG, AUC+ patients).
Comparison between group 1 and control group 2 where aPET results were withheld from clinicians until after formulation of a revised diagnosis, allows to compare time-related diagnostic changes in the absence and presence of aPET. As a result (group 1 versus 2, Table 2): In the absence of the aPET data, the diagnosis remains largely unchanged over time.
When aPET data is available and is discordant from the pre-aPET diagnosis there is significant diagnostic change. Two examples are described: in analysis measure 2.1 92.5% AD cases remain AD when negative aPET result is withheld (control group 2), while when negative aPET is disclosed (group 1) only 13.6% AD cases remain AD. Conversely, when the Group 1 AD cases have a negative scan, 86.4% of diagnoses are changed to Non-AD, whereas in the control group the change to Non-AD diagnosis over 3 months was only 7.5%. In the control group, the amyloid burden revealed by aPET at the end of the 3-month observation period is more frequently inconsistent with the working diagnosis (see measure 2.1): in control group 2 the percentage of cases having an AD/Non-AD/indeterminate final diagnosis is unvaried irrespective of aPET outcome, whereas with immediate disclosure (group 1) these percentages vary depending on aPET outcome. For both incoming presumed AD and Non-AD cases there is high consistency with aPET compared to when aPET results were withheld (see measures 2.2a and 2.2b, both >91% for group 1 but only 56-71% for group 2). In the period when aPET results are withheld there is only 3.2% change in pre-aPET working diagnosis versus 31.3% when aPET is disclosed (see measure 2.3).
Impact on diagnostic confidence
The impact of aPET on diagnostic confidence was assessed in descriptive summary terms due to variability of reported data. It is also recognized that this measure may be subjective and dependent on clinician expertise levels.
Overall, aPET raises diagnostic confidence by a mean of 12.7±35.3% (with a net decrease in confidence being associated with negative aPET cases, 6 Studies, 725 cases [31 –36]). Where specified, the pre-aPET diagnostic confidence was modest (e.g., 68% in Zwan et al. [32], 71% in Ossenkoppele et al. [34]). Diagnostic confidence increases in a total of 62.1% [95% CI 58.8% –65.3%] of 870 incoming subjects, 6 studies [32 , 36–39]). An increase in diagnostic confidence (25.7% of 850 cases, 5 studies [32 , 37–39]) occurs more often for patients with positive aPET (both concordant and discordant from pre-aPET working diagnoses; 71.4% [95% CI 67.3%–75.3%] of cases) than for aPET negative patients (both concordant and discordant from working diagnoses, 45.6% [95% CI 40.2%–51.2%] of cases).
Impact on patient management
Results are described according to Table 3. Changes in medication ranged between 24–34% in the three groups having aPET available with a similar percentage (22%) in the control group with delayed aPET disclosure. The overall combined management changes (in terms of changes in therapy, care plan and additional testing) in both the AUC+ group (group 3) and wider cohort (group 1) were similar both with positive aPET (52% and 54% respectively) and negative aPET (39% and 45% respectively). Lower management changes were found in group 4, where aPET was combined with CSF/FDG. In some cases, management changes were reported for all aPET results combined. These ranged widely, e.g., 72% in the wider cohort (group 1) down to 41% in group 4 where aPET was combined with CSF/FDG. In the control group, reported management changes were 56% indicating propensity to change in the absence of pathophysiological evidence.
DISCUSSION
This study is a systematic review and quantitative aggregated analysis aiming to reach a consensus over the extent of utility of amyloid brain PET imaging across different radiotracers and cohorts of cognitively impaired patients assessed in conditions close to routine clinical practice. The aim is to generate data which could support diagnostic decision-making and possible future cost-benefit assessments. The systematic review primarily discusses the utility of aPET though it is recognized that other tests for measuring amyloid load such as CSF provide an alternative opportunity to influence diagnosis despite some current limitations of this technique [20 , 44–48].
Our primary analysis in 1,142 patients shows that the adjunctive use of aPET (in absence of CSF/FDG) leads to revision of up to 31.3% [95% CI 28.6%–34.0%] diagnoses by elucidation of disease pathophysiology. Additionally, for 94.9% [95% CI 93.1%–96.4%] of these cases initially diagnosed with AD and 91.1% [95% CI 87.8%–93.7%] of Non-AD cases (measures 2.2a/2.2b, Table 2), aPET results are consistent with the revised diagnosis, demonstrating strong confidence in aPET for assisting diagnostic decision-making. It is particularly noteworthy that when aPET result disclosure is delayed rather than immediate [42], the working diagnosis at the end of the 3 month control period is much less frequently consistent with the amyloid burden eventually revealed by aPET (measure 2.1, Table 2).
It is now understood that cognitive decline is anticipated by alterations in normal molecular biomarker patterns, with amyloid being the first majorly affected [49]. In this context, frequent discordance between pre-aPET working diagnosis and aPET result is noteworthy and underscores the notion that earlier amyloid imaging may valuably contribute to measuring risk of future cognitive decline [50].
It is recognized that what constitutes sufficient clinical utility in a practical setting varies by center, clinician, clinical population, and the wider context. However, the evidence in this aggregated analysis and other reviews [22] indicates that in general aPET supports diagnostic change in as high as one out of three patients, emphasizing a strong need for clinical practice to shift away from symptom-based diagnoses and towards pathophysiologically-driven diagnoses [1, 25]. Nonetheless, the extent of utility needed to justify clinical adoption of this technique is a complex matter that requires to consider both the therapeutic implications and the wider health-economic impact including care planning, hospitalization, additional clinical time and possible alternative diagnosis methods available [51]. On the other hand, the assessment of utility remains a subjective topic which some have attempted to address by surveying patient willingness-to-pay in a variety of diagnostic scenarios [52].
There are small numbers of cases where the confirmed diagnosis is inconsistent with the etiology suggested by aPET. These few cases show that clinical symptoms consistent with Non-AD dementias can still overrule positive PET amyloid status. Amyloid-negative confirmed AD cases are likely “Suspected Non-Alzheimer’s Pathology” (SNAP) patients [53], increasingly recognized as a syndrome in their own right. Furthermore, negative aPET results are significantly more useful in diagnostic decision-making than positive aPET results (Fig. 1), confirming the primary use as an adjunct test for ruling out AD as recommended by EU and US regulators [5 –10]. In itself, the negative predictive value of aPET is highly impactful from diagnostic management [54], financial [55, 56] and patient well-being [57] standpoints. Nevertheless, positive aPET maintains a substantial 74.1% utility for ruling-in AD, which supports its use in this function as anecdotally reported by others [58, 59].
Regarding aPET positioning in the diagnostic decision-making process, it is still widely debated which test may most cost-effectively serve physicians in determining an accurate diagnosis for cognitively impaired subjects, particularly in early disease stages [17 , 60–64]. If we examine the AUC+ patients only, there is lack of substantial difference in aPET utility between aPET alone and accompanied by CSF/FDG (Table 2). This suggests that FDG and CSF may not substantially alter the impact of aPET both from a diagnostic and management perspective. Possible reasons for this observation could be the less precise correspondence between FDG uptake patterns and (particularly early) disease etiology [19, 49] and/or the potentially non-linear association between CSF and amyloid burden as the disease progresses [47]. Additionally, data from Sanchez-Juan et al. [41] in cognitively impaired subjects of uncertain disease etiology indicated greater relative impact of aPET than FDG when both were employed for diagnostic decision-making (Supplementary Table 5). Comparable results (albeit with less detail reported) were observed by Ossenkoppele et al. [34]. This is particularly the case when imaging results are discordant from pre-aPET diagnoses indicating that to maximize the impact of investigative procedures it may be beneficial for aPET to precede FDG. The patient outcome benefits of making use of aPET rather than FDG as a first-line test in certain cases has been previously argued [19, 65]. In particular, aPET may be more valuable in earlier stages of dementia pathogenesis, when regional FDG uptake variations are less revealing of different pathological processes [65] despite this being a time when treatments may be most effective [66]. Moreover, it is worth highlighting that aPET appeared most suitable when borderline CSF resulted in equivocal amyloid status as analyzed in Weston et al. [36].
As for patient management change, significant increase (over 16% extra cases, Table 3) occurs following amyloid PET, both compared to patients with delayed aPET results and to those having prior CSF/FDG. This suggests that the increase in management changes is independent of time-related disease progression and could be related to increased diagnostic confidence associated with pathophysiological evidence provided by aPET. The availability of CSF/FDG (group 4) prior to aPET could allow some triaging of the patient management which decreases somewhat the impact of additional aPET scanning. Positive aPET drives more management changes than negative aPET. Medication changes were apparent both in the absence and presence of aPET with similar levels seen in all groups (approximately 22–34%). These results indicate that even in the absence of pathophysiological data there is a bias to treat despite medications ultimately shown as inconsistent with the amyloid status when revealed (Table 2, group 2). Earlier aPET could therefore provide more informed medication planning [41].
Regarding diagnostic confidence, this study found an increase with both positive and negative aPET results concordant with pre-aPET working diagnosis due to additional pathophysiological diagnostic evidence. Conversely, discordant results had lower impact on diagnostic confidence since often giving rise to diagnostic changes. Overall, positive aPET was associated with diagnostic confidence increases in 25.7% cases more than negative aPET.
Clinical guidelines published in 2013 [23, 24] indicated distinct patient categories where the use of aPET is deemed appropriate (AUC+). However, the analysis in this study indicates that subjects beyond the AUC criteria (i.e., group 1) could benefit similarly to those in the AUC+ group in terms of diagnostic impact (group 3). This is corroborated by previous reports by others [67 –69] who have found post-aPET diagnostic and treatment plan changes to be somewhat independent of age of onset and diagnostic confidence. Additionally, three studies included in this analysis [34 , 43] reported diagnostic confidence increases in AUC+ patients and a noticeably stronger impact in the management of AUC+ cases in amyloid-positive (but not negative) patients. This outcome-specific impact could be explained by the enhanced understanding of disease etiology offered by affirmative test results.
This analysis has some limitations. While necessary to effectively analyze diagnostic changes with respect to aPET, the reclassification of patient diagnoses into standardized groups (AD, Non-AD and indeterminate) by consideration of the latest diagnostic guidelines [1] lead to some loss of granularity. The majority of studies assessed here are also simple observational studies with the diagnosis observed before and after the aPET scan. The presence of a single study [42] with a control cohort (i.e., no aPET test considered between diagnoses) represents a limitation which is recognized as a known issue and is being addressed in new amyloid utility studies such as AMYPAD [70]. Furthermore, the heterogeneity of patient populations across individual studies could affect the quantification of utility (Supplementary Table 7 and Risk of Bias section in Methods). Given the detail available in each paper, it is not possible to quantify at this time how different patient groups benefit from aPET, as this requires further research to avoid speculative conclusions. This is particularly the case for Non-AD aPET positives and cognitively normals.
Conversely, the aggregation of this data inherently displaying a variety routine practice patient groups allows to quantify more broadly the value of aPET in the general population visiting secondary and tertiary centers and could be useful for cost-effectiveness analyses and clinical decision-making.
Our observations in this analysis are based on the post-aPET diagnosis as standard of clinical truth in absence of histopathological verification as the ultimate standard of truth. This may alter the figures obtained from the true aPET impact. However, aPET imaging and histopathological findings at autopsy have been shown to correlate strongly with over 90% accuracy [5 , 71] and this highly-powered analysis has the advantage of reducing both physician, population and test selection biases, giving good estimations of true aPET utility. Also, concordance between diagnostic change after aPET and extent of mismatch between clinical diagnosis and final neuropathological diagnosis [72] indicates overall high diagnostic performance of aPET. This analysis is also not intended to examine the impact of CSF and FDG as tests in their own right.
Analysis of the extent of impact of study-specific population and test variations on aPET utility was restricted by the limited detail available within the studies considered. Thus, the overall quantification of aPET utility assumed all cases in this aggregated analysis carry equal weight in reflection of the inherent variability of cases incoming in routine practices. Nonetheless, the consideration of individual patient data represents an advancement from Barthel and Sabri [22] where overall utility measures are only based on summary results as calculated in each individual study and then weighted according to study power. Furthermore, the impact of aPET on patient health, quality of life and institutionalization remain a domain for further research. Finally, the effect of medication and management changes on longer term patient outcomes useful for reimbursement discussions, is a subject that studies such as IDEAS [73] and AMYPAD [70] aim to address.
Since this analysis has been performed other studies have come to light examining the utility of aPET. Ceccaldi et al. [74] studied 205 subjects in a multi-center tertiary memory setting where CSF testing was not feasible or was equivocal. In this group of subjects, the patients presented with complex clinical features and a high degree of clinical uncertainly and hence the change in diagnosis after aPET (in this case [18F]florbetaben) was greater (66.8%) than seen in the meta-analysis reported here. A further [18F]florbetaben study of 507 subjects [75] examined an unselected memory clinic cohort of equal numbers of AUC and non-AUC subjects (for example subjective cognitive decliners) and reported similar levels of diagnostic changes; 28% in the AUC and 23% in the non-AUC group after the aPET scan further indicating the consistency of data reported in our paper.
Conclusion
The data retrieved in this aggregated analysis support the utility of aPET in diagnostic decision-making, confidence of diagnosis and management planning for patients with cognitive impairment. The relative impact of aPET on diagnostic change was >30%, consistent with the difference previously reported by Beach et al. [72] between clinical and post-mortem diagnoses.. Additionally, the substantial number of cases having diagnostic confidence increases and management changes point to a broad impact of aPET on patient outcomes.
Footnotes
ACKNOWLEDGMENTS
The authors wish to thank Michelle Zanette of GE Healthcare for the statistical analysis support. E.F. and G.F. are employed by GE Healthcare. A.C., A.H., and J.O. received no funding for this analysis from GE Healthcare and are employees of Kings College London (A.C., A.H.) and the University of Cambridge (J.O.). J.O. has acted as a consultant for GE Healthcare.