
Abstract
In 2017, approximately 5 million Americans were living with Alzheimer’s disease (AD), and it is estimated that by 2050 this number could increase to 16 million. In this study, we apply mathematical optimization to approach microarray analysis to detect differentially expressed genes and determine the most correlated structure among their expression changes. The analysis of GSE4757 microarray dataset, which compares expression between AD neurons without neurofibrillary tangles (controls) and with neurofibrillary tangles (cases), was casted as a multiple criteria optimization (MCO) problem. Through the analysis it was possible to determine a series of Pareto efficient frontiers to find the most differentially expressed genes, which are here proposed as potential AD biomarkers. The Traveling Sales Problem (TSP) model was used to find the cyclical path of maximal correlation between the expression changes among the genes deemed important from the previous stage. This leads to a structure capable of guiding biological exploration with enhanced precision and repeatability. Ten genes were selected (FTL, GFAP, HNRNPA3, COX1, ND2, ND3, ND4, NUCKS1, RPL41, and RPS10) and their most correlated cyclic structure was found in our analyses. The biological functions of their products were found to be linked to inflammation and neurodegenerative diseases and some of them had not been reported for AD before. The TSP path connects genes coding for mitochondrial electron transfer proteins. Some of these proteins are closely related to other electron transport proteins already reported as important for AD.
INTRODUCTION
Alzheimer’s disease (AD) is a degenerative brain disease which commonly causes dementia [1]. Age is the greatest risk factor for AD, with most patients being 65 years old or older. AD is characterized by pathological aggregates of amyloid-β protein (Aβ) and neurofibrillary tangles (NFTs) form by aggregates of hyperphosphorylated tau protein [2]. Aβ is believed to contribute to cell death by interfering with the neuron-neuron communication, while NFTs block the transport of nutrients inside the neurons. It is estimated that by 2050, 16 million people will suffer from AD in the United States [1]. Thus, there is a need to establish new biomarkers and understand how they interact to help in the characterization, diagnosis of disease progression, and identification of new drug targets.
To search for new genes that change their expression in the presence of NFTs, we advocate the use of mathematical optimization methods to analyze available microarray data, as we have done in previous works related to the study of cancer [3 –5]. High throughput biological experiments, like microarrays, have been used to detect potential AD biomarkers maintaining the issue of selecting genes for normalization and parameters for the analysis as reviewed in Cooper-Knock et al. [6]. The optimization-driven method presented here differs from many of the commonly used informatics-based and statistics-based analysis methods in that it does not require any parameter adjustment by the user nor any normalization procedure, as described in Camacho-Caceres et al. and Lorenzo et al. [5, 7].
This work discusses the detection of genes that change their expression the most in the presence of NFTs in AD, using publicly available microarray data first reported by Dunckley et al. [8] and proposes a possible signaling path among them. The identification of potential AD biomarkers from microarray data is casted as a multiple criteria optimization (MCO) problem. The aim of an MCO problem is to find the best compromises between two or more conflicting criteria. Formally, the solutions with the best compromises are located in the Pareto efficient frontier of the set of candidates evaluated in all criteria of interest (also called performance measures in this work). We propose that the genes of the efficient frontier in the present analyses, built with performance measures related to changes in gene expression, are potential AD biomarkers. It is our premise that the changes in expression of these important genes are correlated, that is, that there is a signal among them. We have proposed that this signal can be modeled as a cyclical correlation path, the elicitation of which constitutes a highly combinatorial optimization problem. In Mathematics, and particularly in the field of Operations Research, this problem is called the Traveling Salesman Problem (TSP). This study attempts the characterization of the signaling path in AD using the well-known TSP combinatorial optimization formulation [9] as was first used in our paper by Lorenzo et al. [7], in the context of cervix cancer.
In this work, the analysis of the AD microarray dataset first reported by Dunckley et al. [8] was modeled as an MCO problem and the correlation between the expression changes was modeled using the TSP formulation. The results from the MCO problem were validated through scientific literature and were used as the input for the TSP. The TSP path provides correlations that have not been reported yet, but that are biological plausible thereby offering new research opportunities.
METHODS
Alzheimer’s disease dataset
The microarray dataset GSE4757 reported by Dunckley et al. [8] was used for the analysis. The dataset consists of samples from ten patients, taken from the entorhinal cortex. From each patient, there was a sample of neurons with NFTs (cases) and one of neurons without NFTs (controls). The microarray platform, GPL570, has a total of 54,675 probes.
Identification of potential AD biomarkers from microarray data is casted as an MCO problem, and their correlation modeled through the TSP
The procedure to select the genes of interest through MCO is explained in detail Camacho-Caceres et al. [5]. In brief, MCO will select a family of solutions (genes in this case) that have the best compromises between the performances measures considered in the analysis. The performance measures that were considered in this case were: 1) the absolute value of the difference in gene expression of the group medians and 2) the absolute value of the difference in gene expression of the group means. The solution to the MCO problem is called the Pareto– efficient frontier, which in turn contains efficient solutions, as depicted in Fig. 1. The reader interested in MCO is referred to [5] for a detailed and illustrated explanation of the procedure.
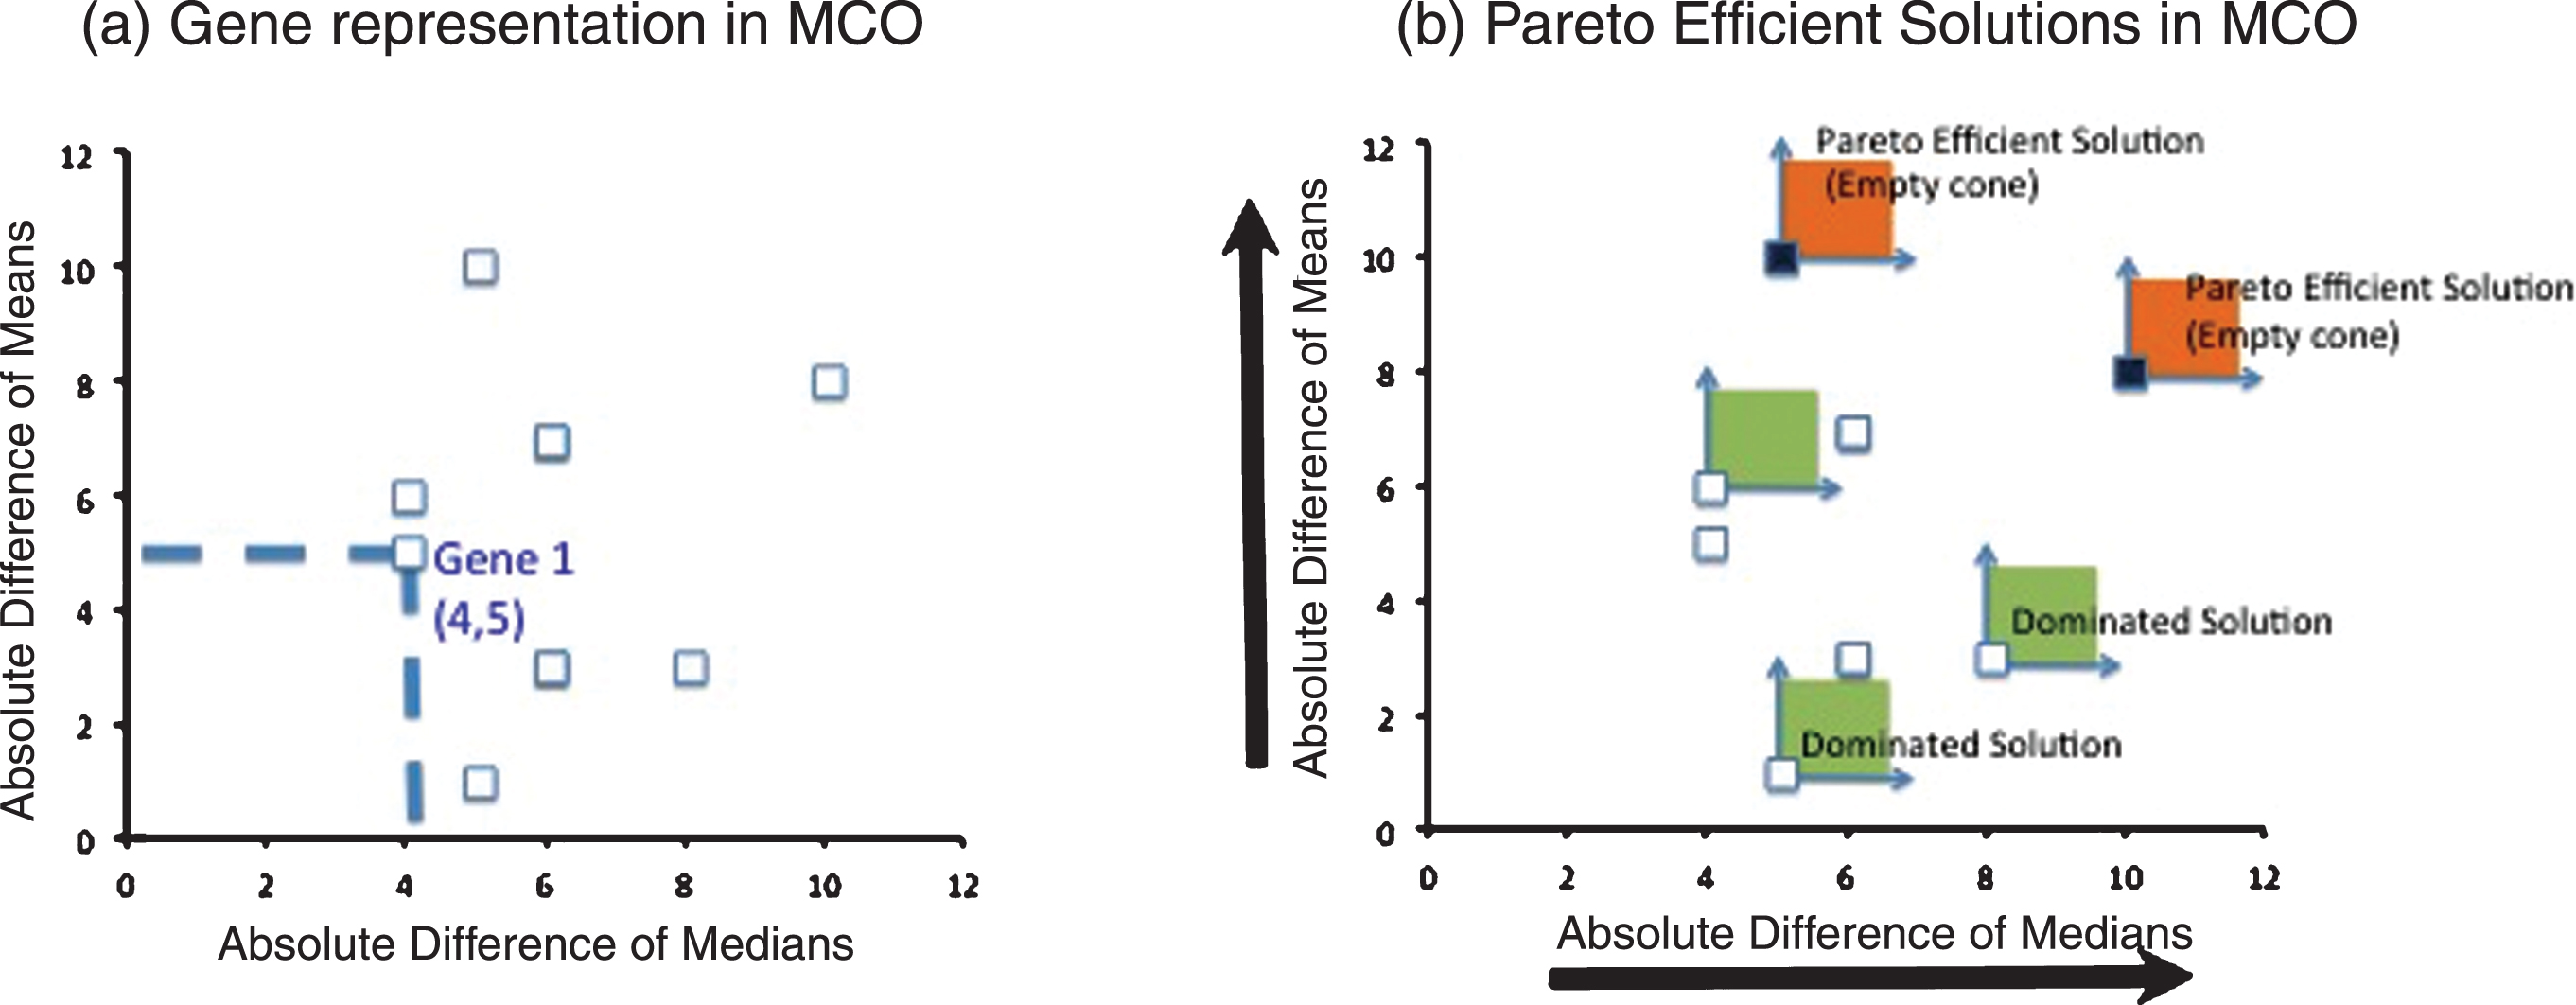
(a) MCO representation: Each gene under analysis is represented by two performance measures to be maximized, in this case, the absolute difference of medians and the absolute difference of means (b) MCO Solution: the maximization directions help to form a cone that originates on a particular gene to be evaluated. If this cone is empty (it does not contain another gene), then the gene is a Pareto Efficient solution. Otherwise, the gene is a dominated solution and therefore not Pareto Efficient.
In order to find how the gene expression changes were related in the genes identified through MCO, the relationship between each pair of genes was modeled as linear statistical correlation. The basic correlation formula denoted as ρ
XY
and between random variables X and Y is [10]:
The correlation between X and Y could be zero, positive or negative and is bounded as follows:
Because correlation values range from – 1 to 1, stronger correlations occur when their absolutevalues are closer to 1. If each gene is represented through a node in a graph, then the undirected arc joining a pair of genes can contain their absolute correlation value. This representation is shown in Fig. 2. Finding the most correlated cyclic path is a combinatorial optimization endeavor best described through the TSP formulation. In Fig. 2, the optimal solution to the TSP is the cyclic tour that visits each gene (node) just once to result in the largest sum of absolute pairwise correlations. Enumerating all possible cyclic tours would entail listing (n-1)! solutions, which is an instance of exponential growth. For example, for as little as 10 genes, there would be (10-1)! = 362,880 possible solutions. With only one more gene, this amounts to more than 3.6 million possible solutions. In our method, we solve the TSP to optimality capitalizing in the shortlist provided by the first part of the analysis, the MCO procedure. A Matlab code aided by the branch-and-bound exact method was used to this end, and can be found in [5] with the Matlab functions detailed in [11]. The MCO procedure in our case identified 10 genes shown in Table 1, and the most correlated cyclical path between the changes in their expression was approached as a TSP, as presented in Fig. 4.
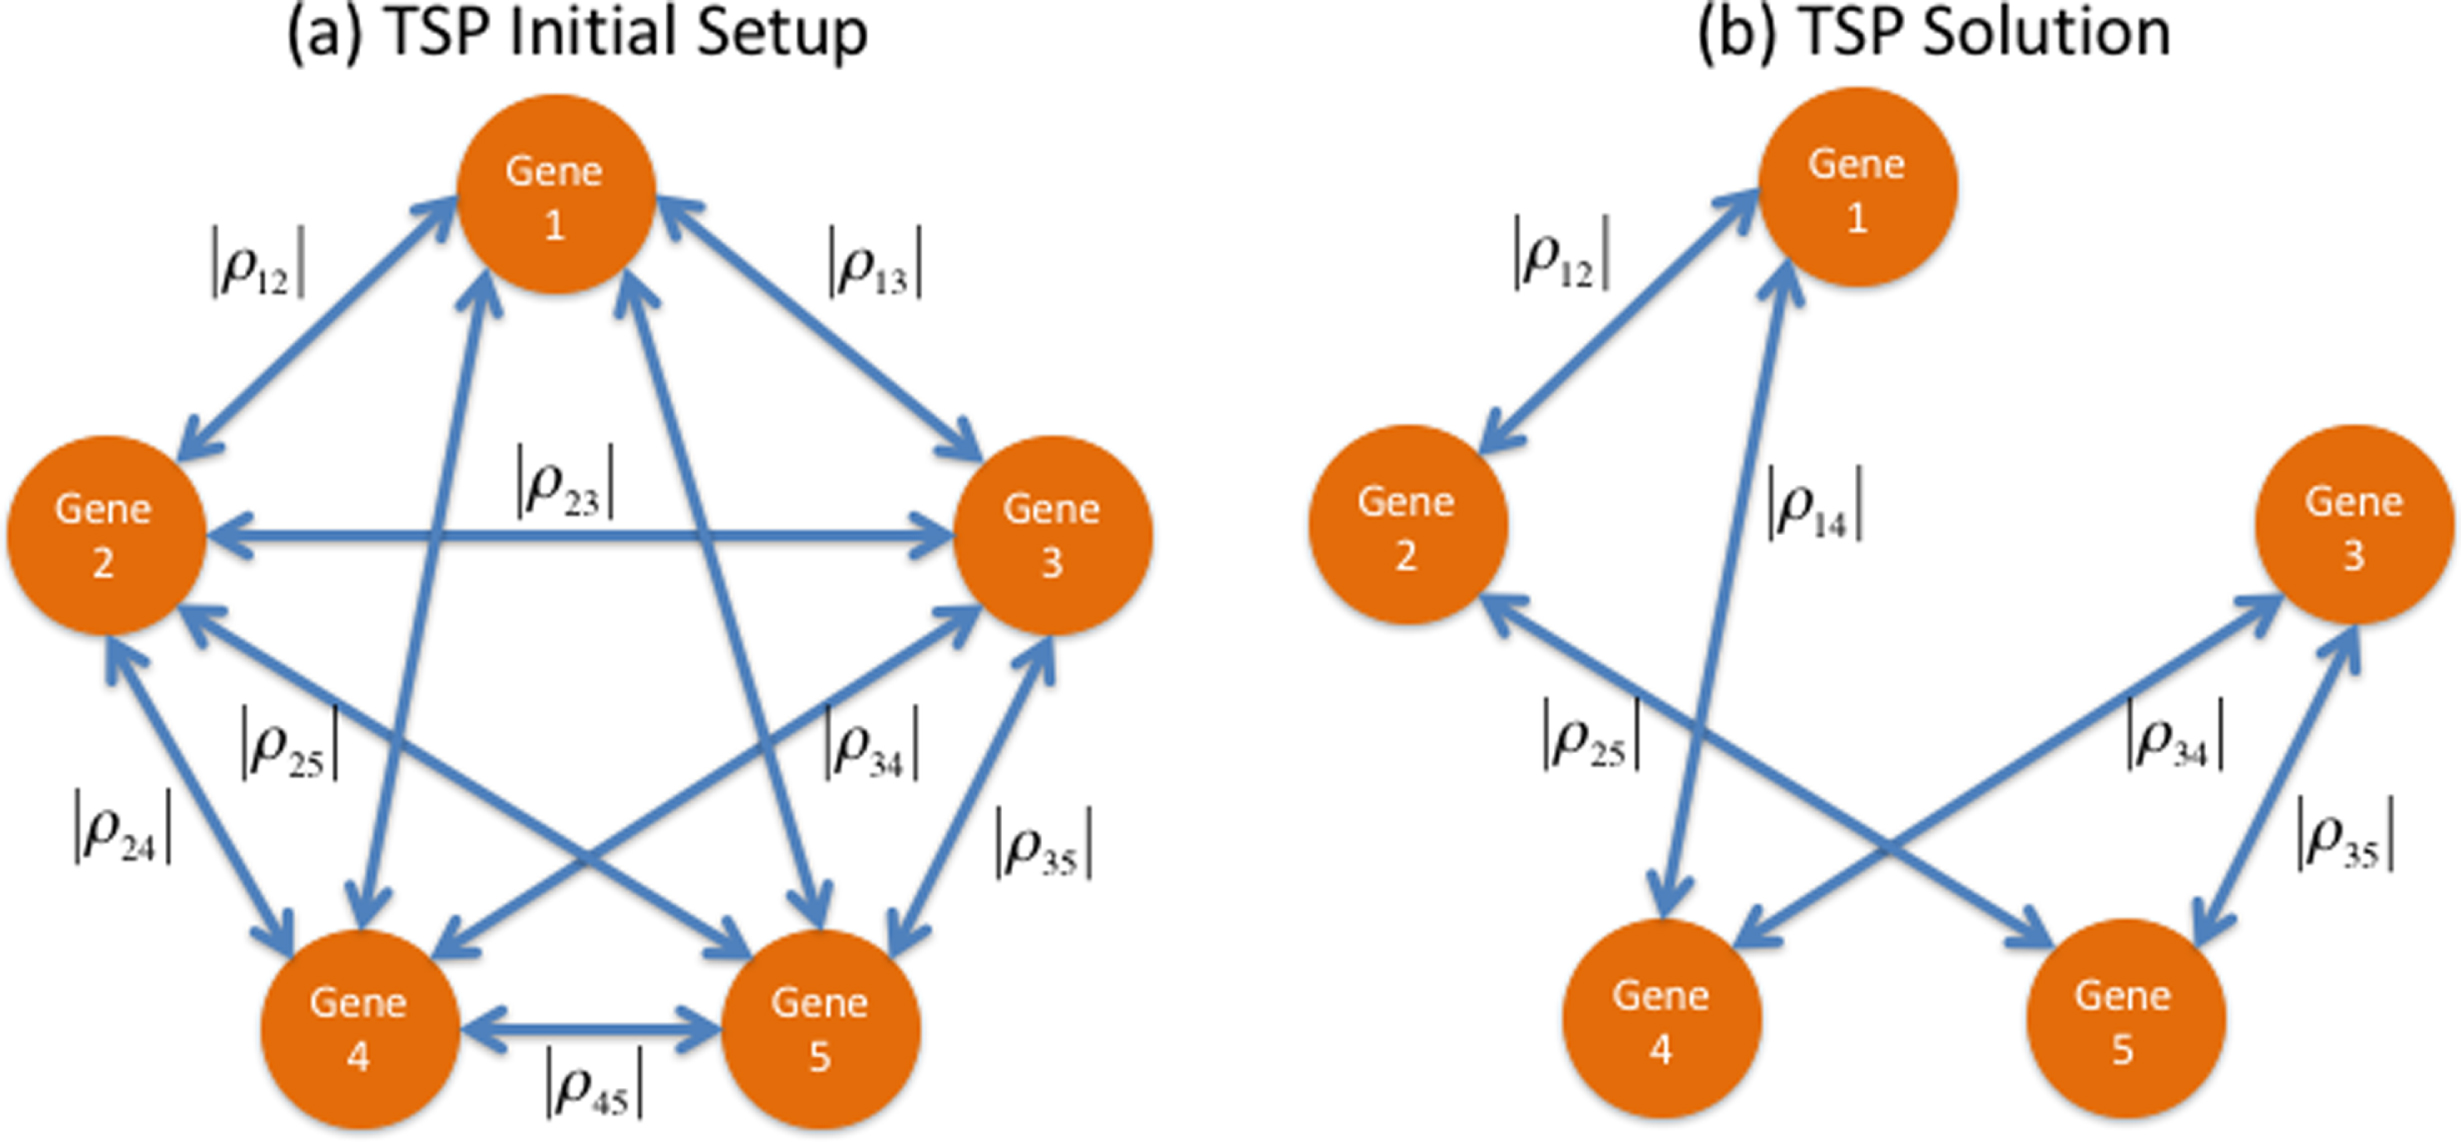
(a) TSP Initial Setup: in this graph, the nodes represent genes and the undirected arcs represent correlation between each pair of nodes. Each arc contains the absolute value of the correlation between the gene expression changes of the genes at its extremes (b) TSP Solution: the cyclic correlation path with the largest sum of absolute correlations, in this case those assigned to pairs (1,2)-(2,5)-(5,3)-(3,4)-(4,1).
List of 10 potential biomarkers identified in the first 3 frontiers through the MCO problem
RESULTS
The analysis of the GSE4757 dataset [8] as an MCO problem produced a list of 10 genes from the first 3 frontiers that are listed in Table 1. Analyzing thousands of genes to converge to a shortlist of 10 without setting any procedure parameter evidences some of the qualities of the MCO method.
The computations of the correlations were carried out in a pairwise manner and the results are presented in the correlation matrix in Fig. 3. Their absolute values allow assessing how strong these correlations are in a scale from 0 (not correlated) to 1 (perfectly linearly correlated). Out of the 10 potential biomarkers, the two expression changes most correlated were those of COX1 and ND2. COX1 expression changes correlates with four biomarkers while ND2 correlates with three biomarkers. Fig. 4 shows the result of modeling the expression changes of the selected genes as a TSP. Table 2 and Fig. 5 summarize the biological processes and chromosomal location of the 10 genes selected by the MCO analysis.
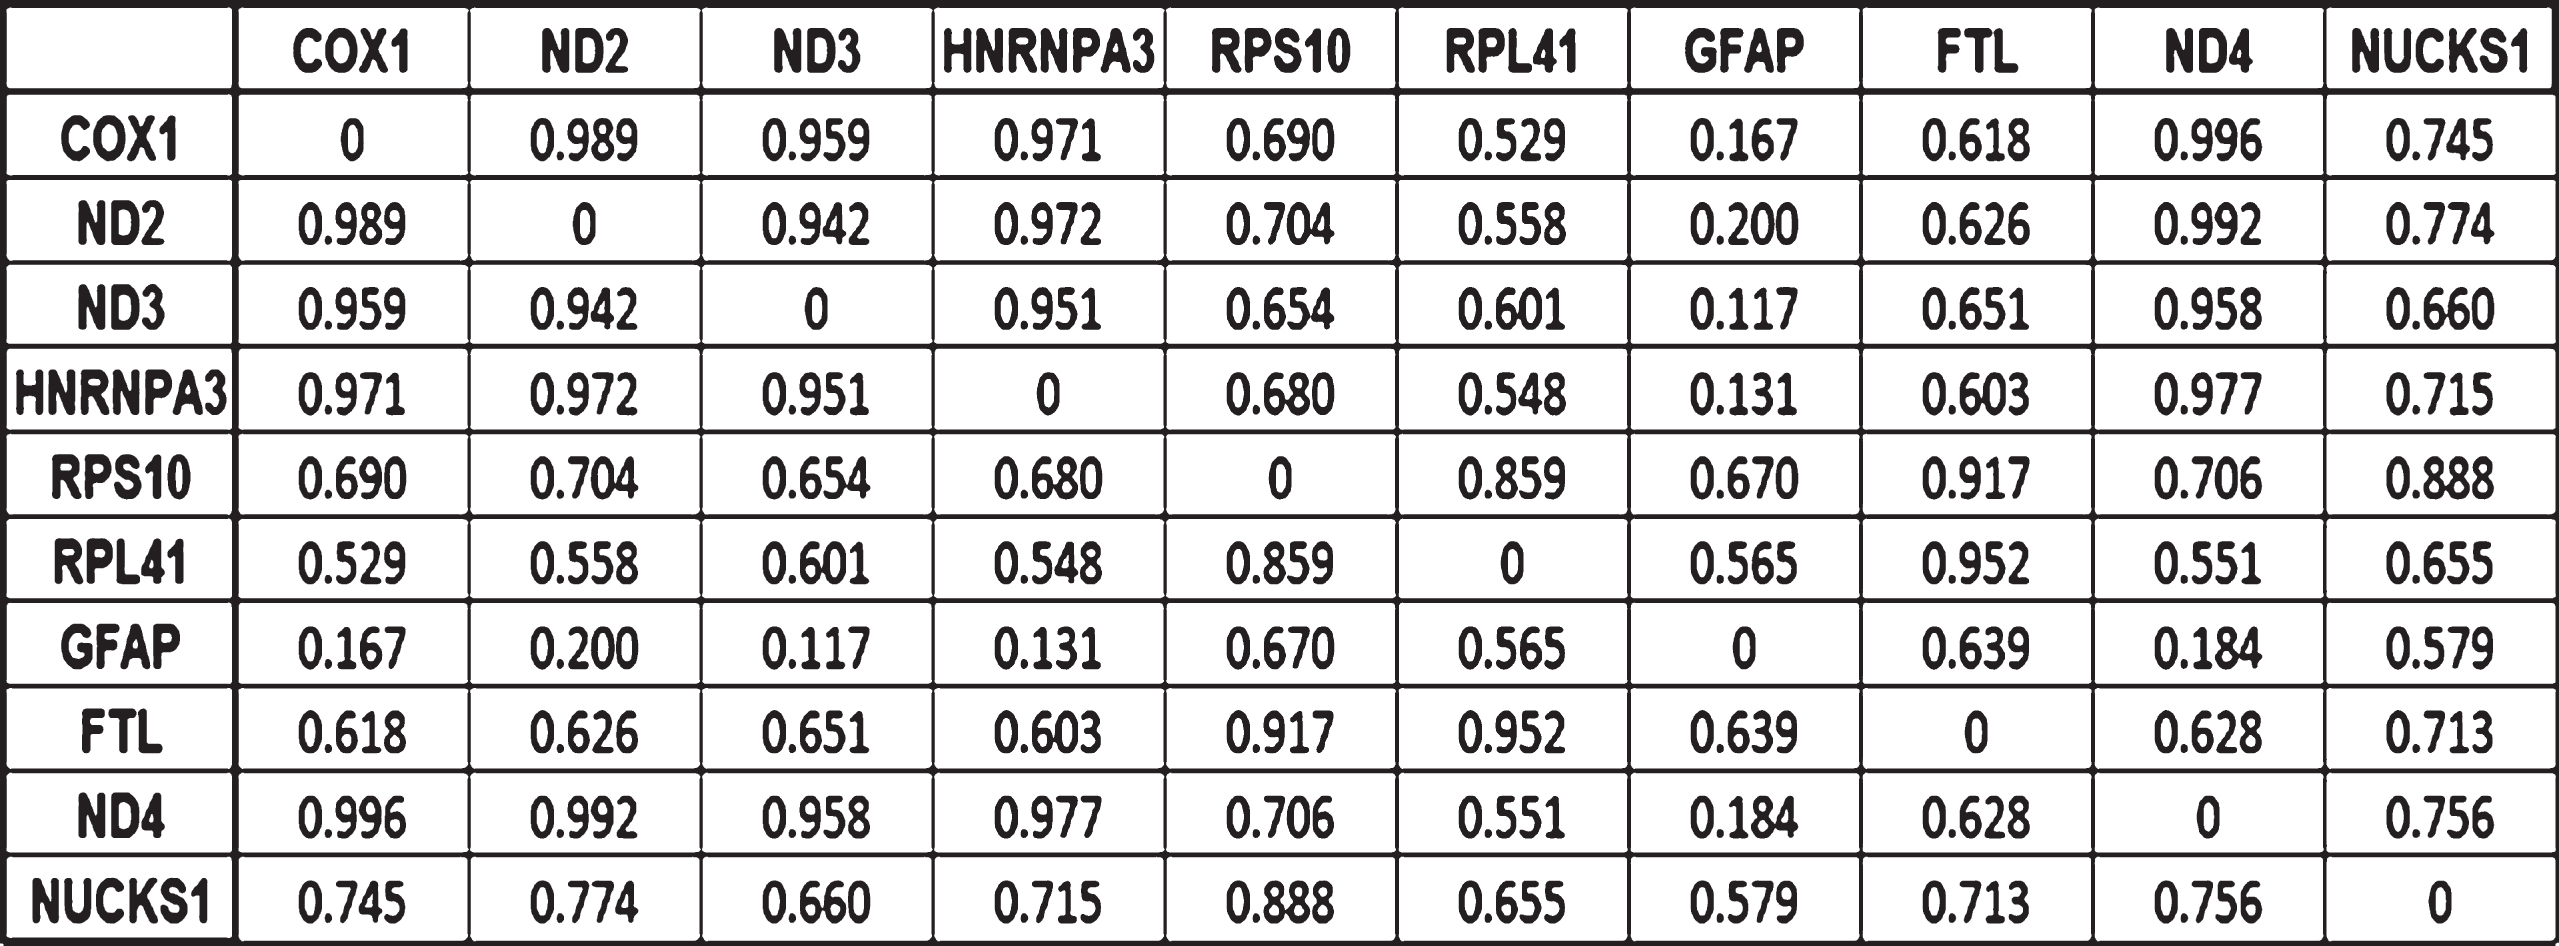
Correlation matrix indicating how strong the correlations between the expression changes for the 10 potential biomarkers are. Values close to 1 indicates strong correlations, the strength decreases as the correlation coefficient does.
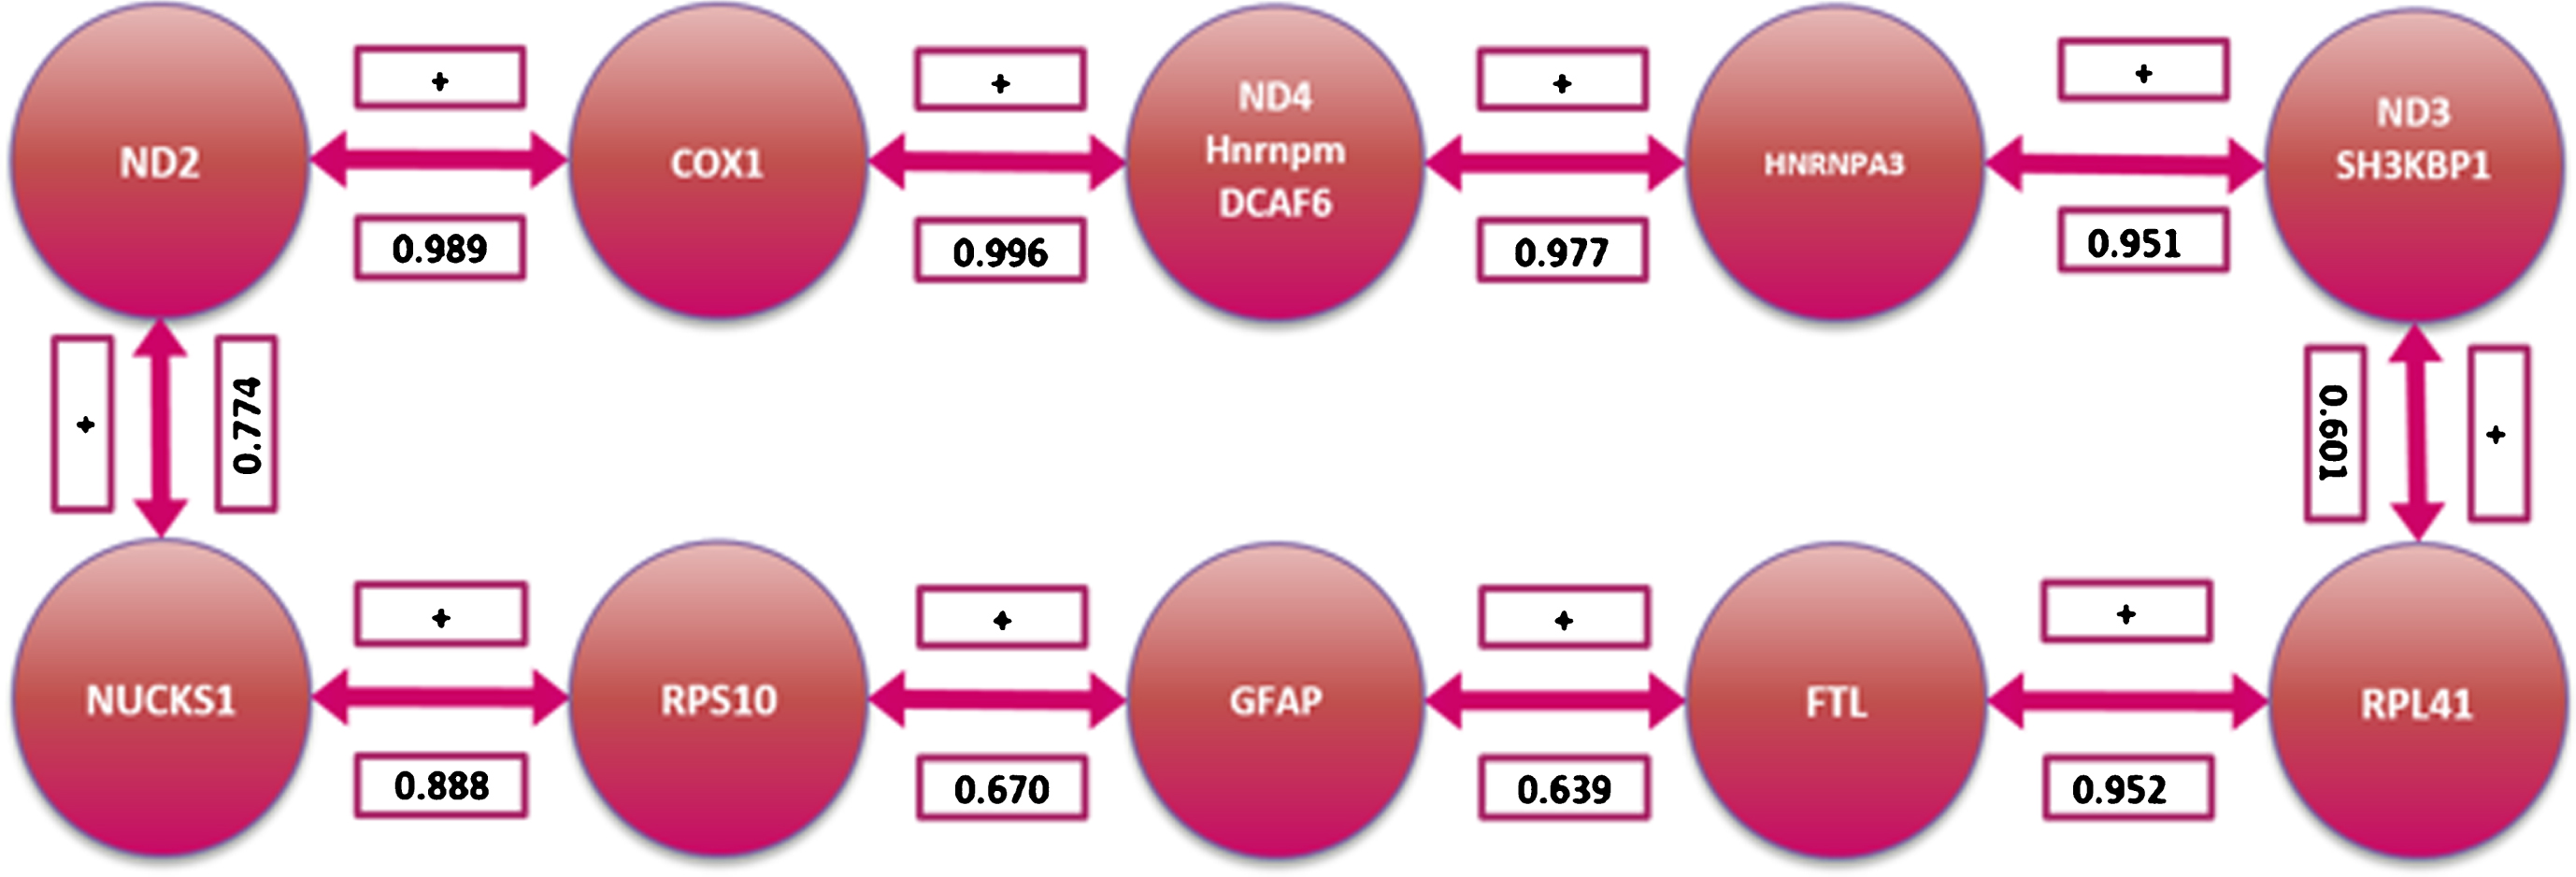
Gene coordinated behavior pathway as determined by the Traveling Sales Problem solution.
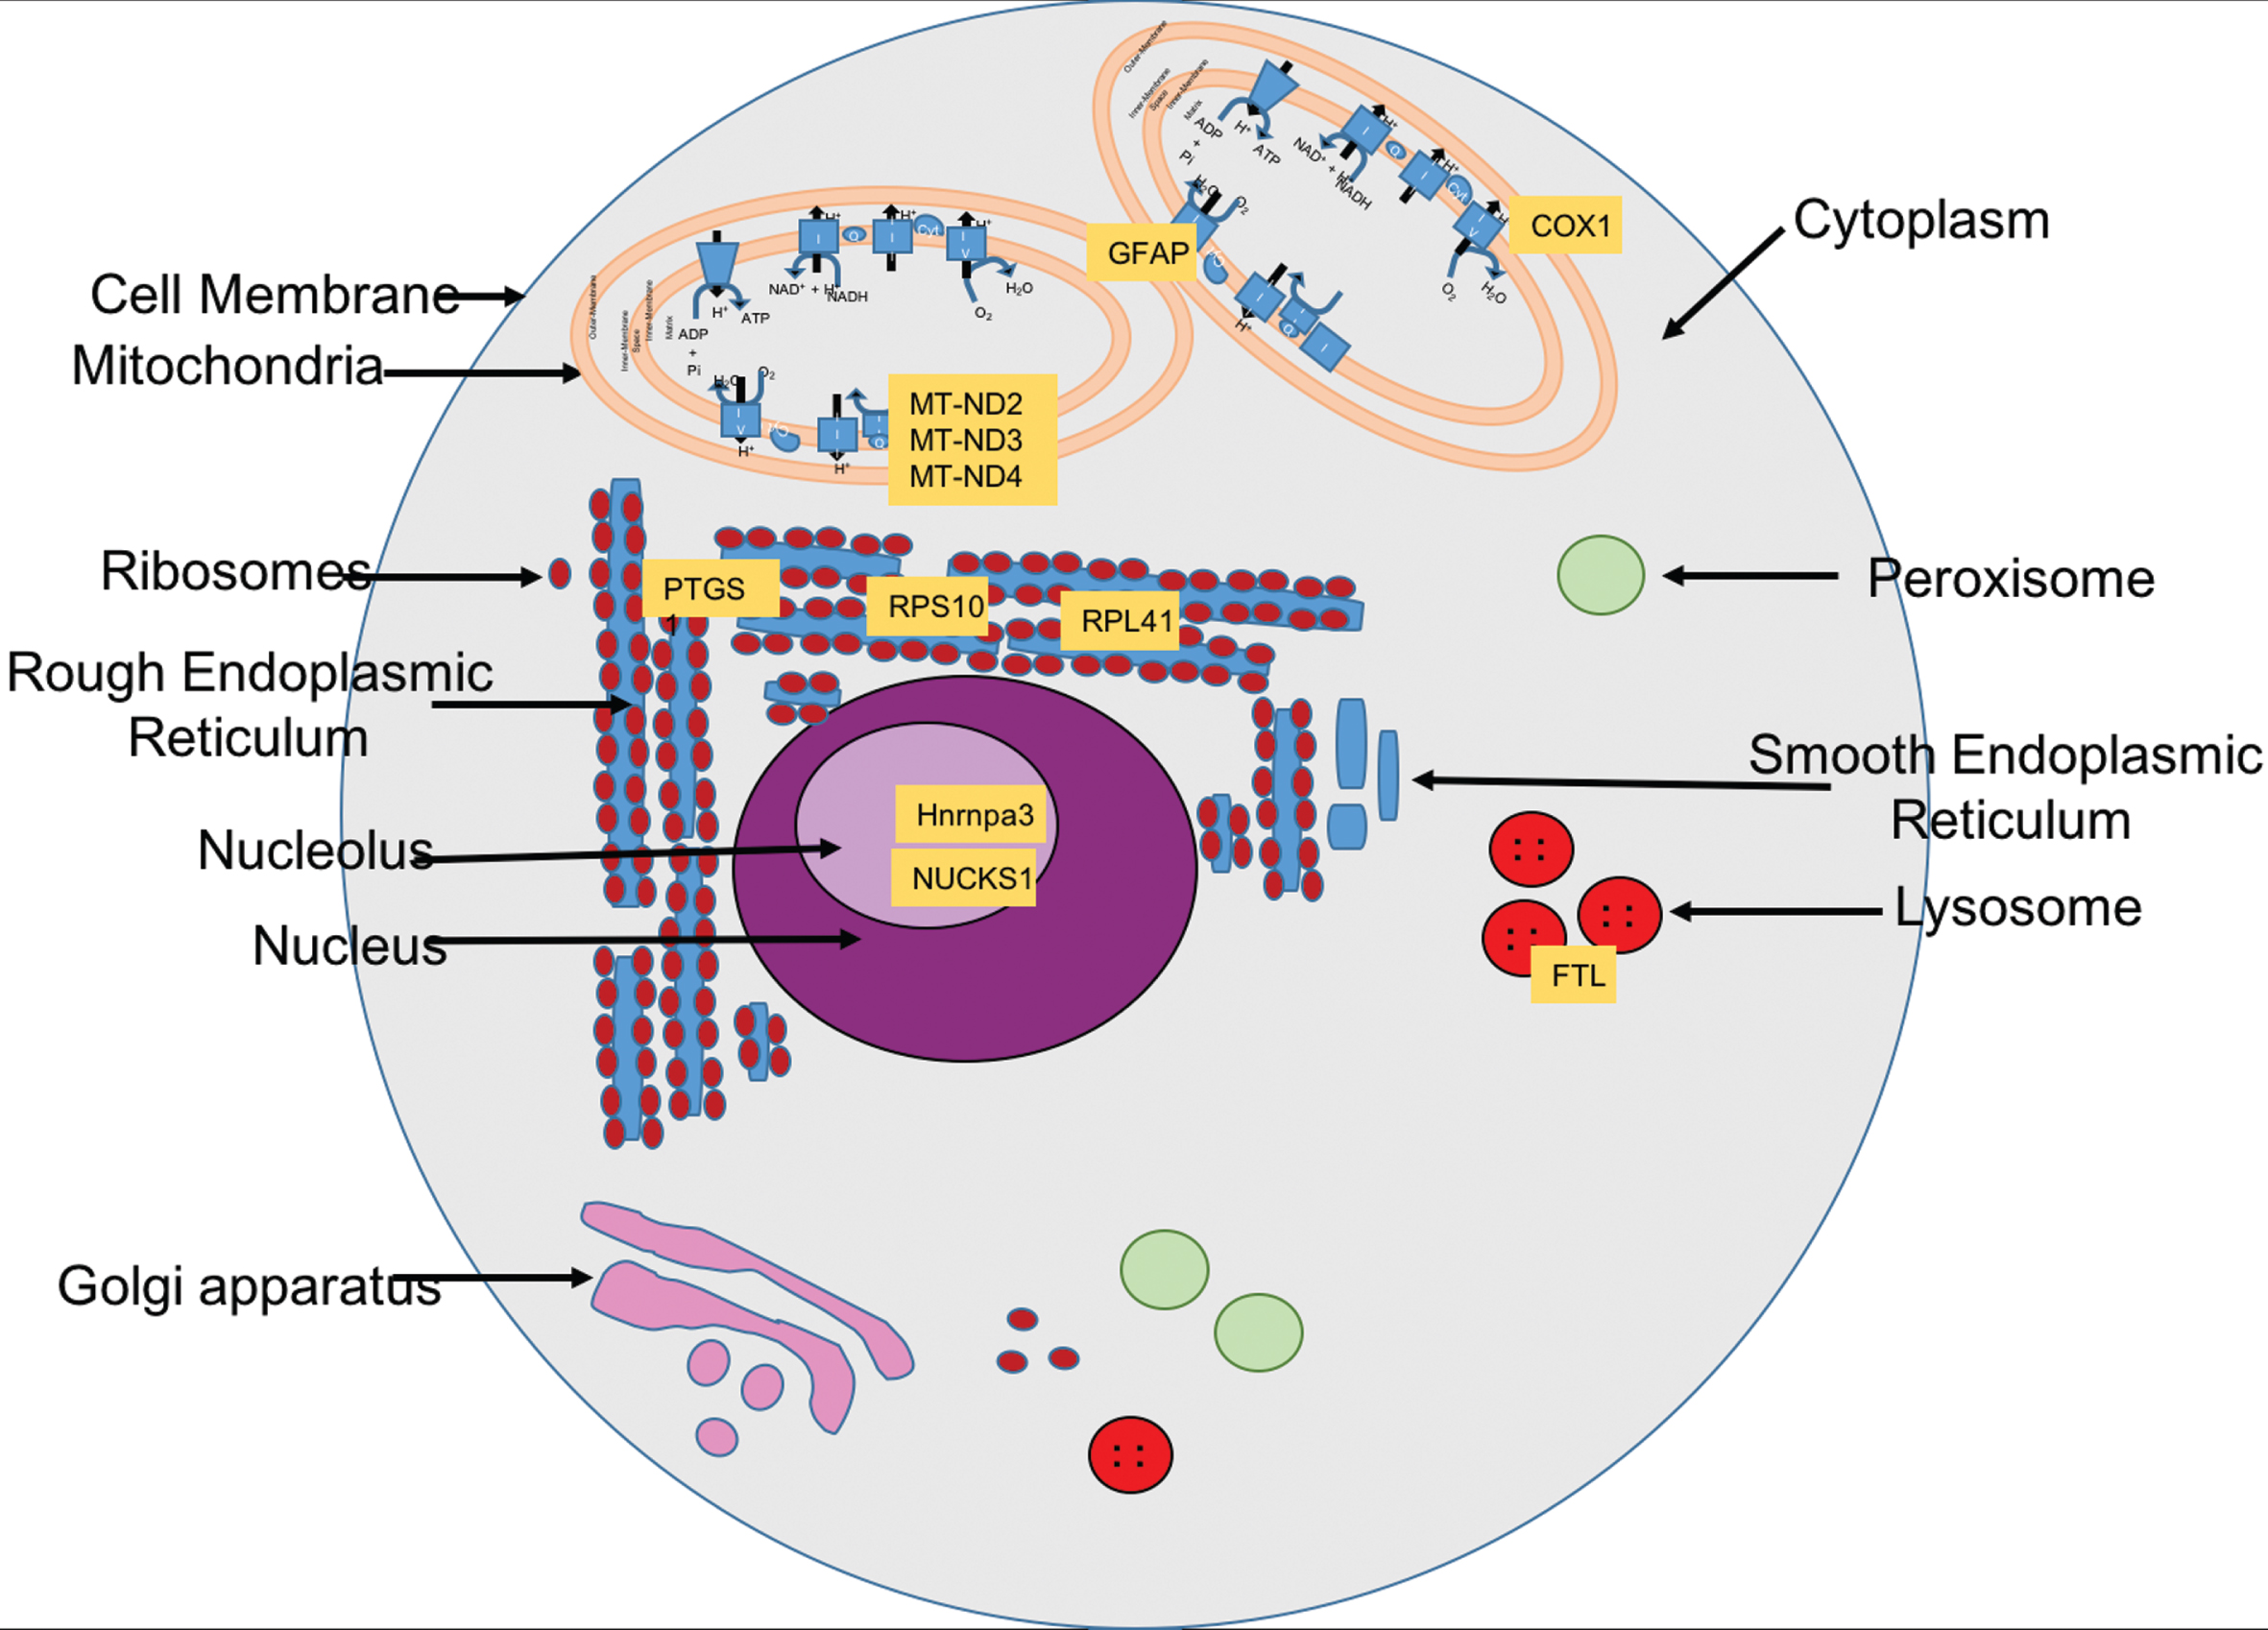
Cellular localization of the selected genes’ protein products
Biological processes, chromosomal location, and subcellular location of the 10 genes identified by the MCO and TSP method
DISCUSSION
The solution genes were grouped by function and their position in the TSP for the following discussion.
Mitochondrial dysfunction linked with AD pathogenesis
Mitochondrial dysfunction is known to be related to AD pathogenesis, but the relationship is still poorly understood [12]. Out of the 10 biomarkers identified by the analysis described in this work, four are related to the mitochondria function: MT-ND2, MT-ND4, COX1, and MT-ND3. Figure 6 shows the location of the genes identified with mitochondria dysregulation. These genes’ expressions have been reported to change in AD [13]. The genes found by the analysis will be discussed starting with MT-ND2 and will follow the TSP path in Fig. 4. MT-ND2 codes for the mitochondrial encoded NADH Dehydrogenase 2. Its product is part of the Complex I mitochondrial membrane respiratory chain NADH dehydrogenase. There are conflicting reports about the role of this gene in AD. Mutations in this gene have been observed in AD brains [14], but a later report concluded that the mutation was not specifically associated with AD [15]. Supporting MT-ND2 possible relation to AD, Drosophila MT-ND2 mutants show progressive neurodegeneration [16]. The results from our analysis support the role of MT-ND2 expression changein AD.
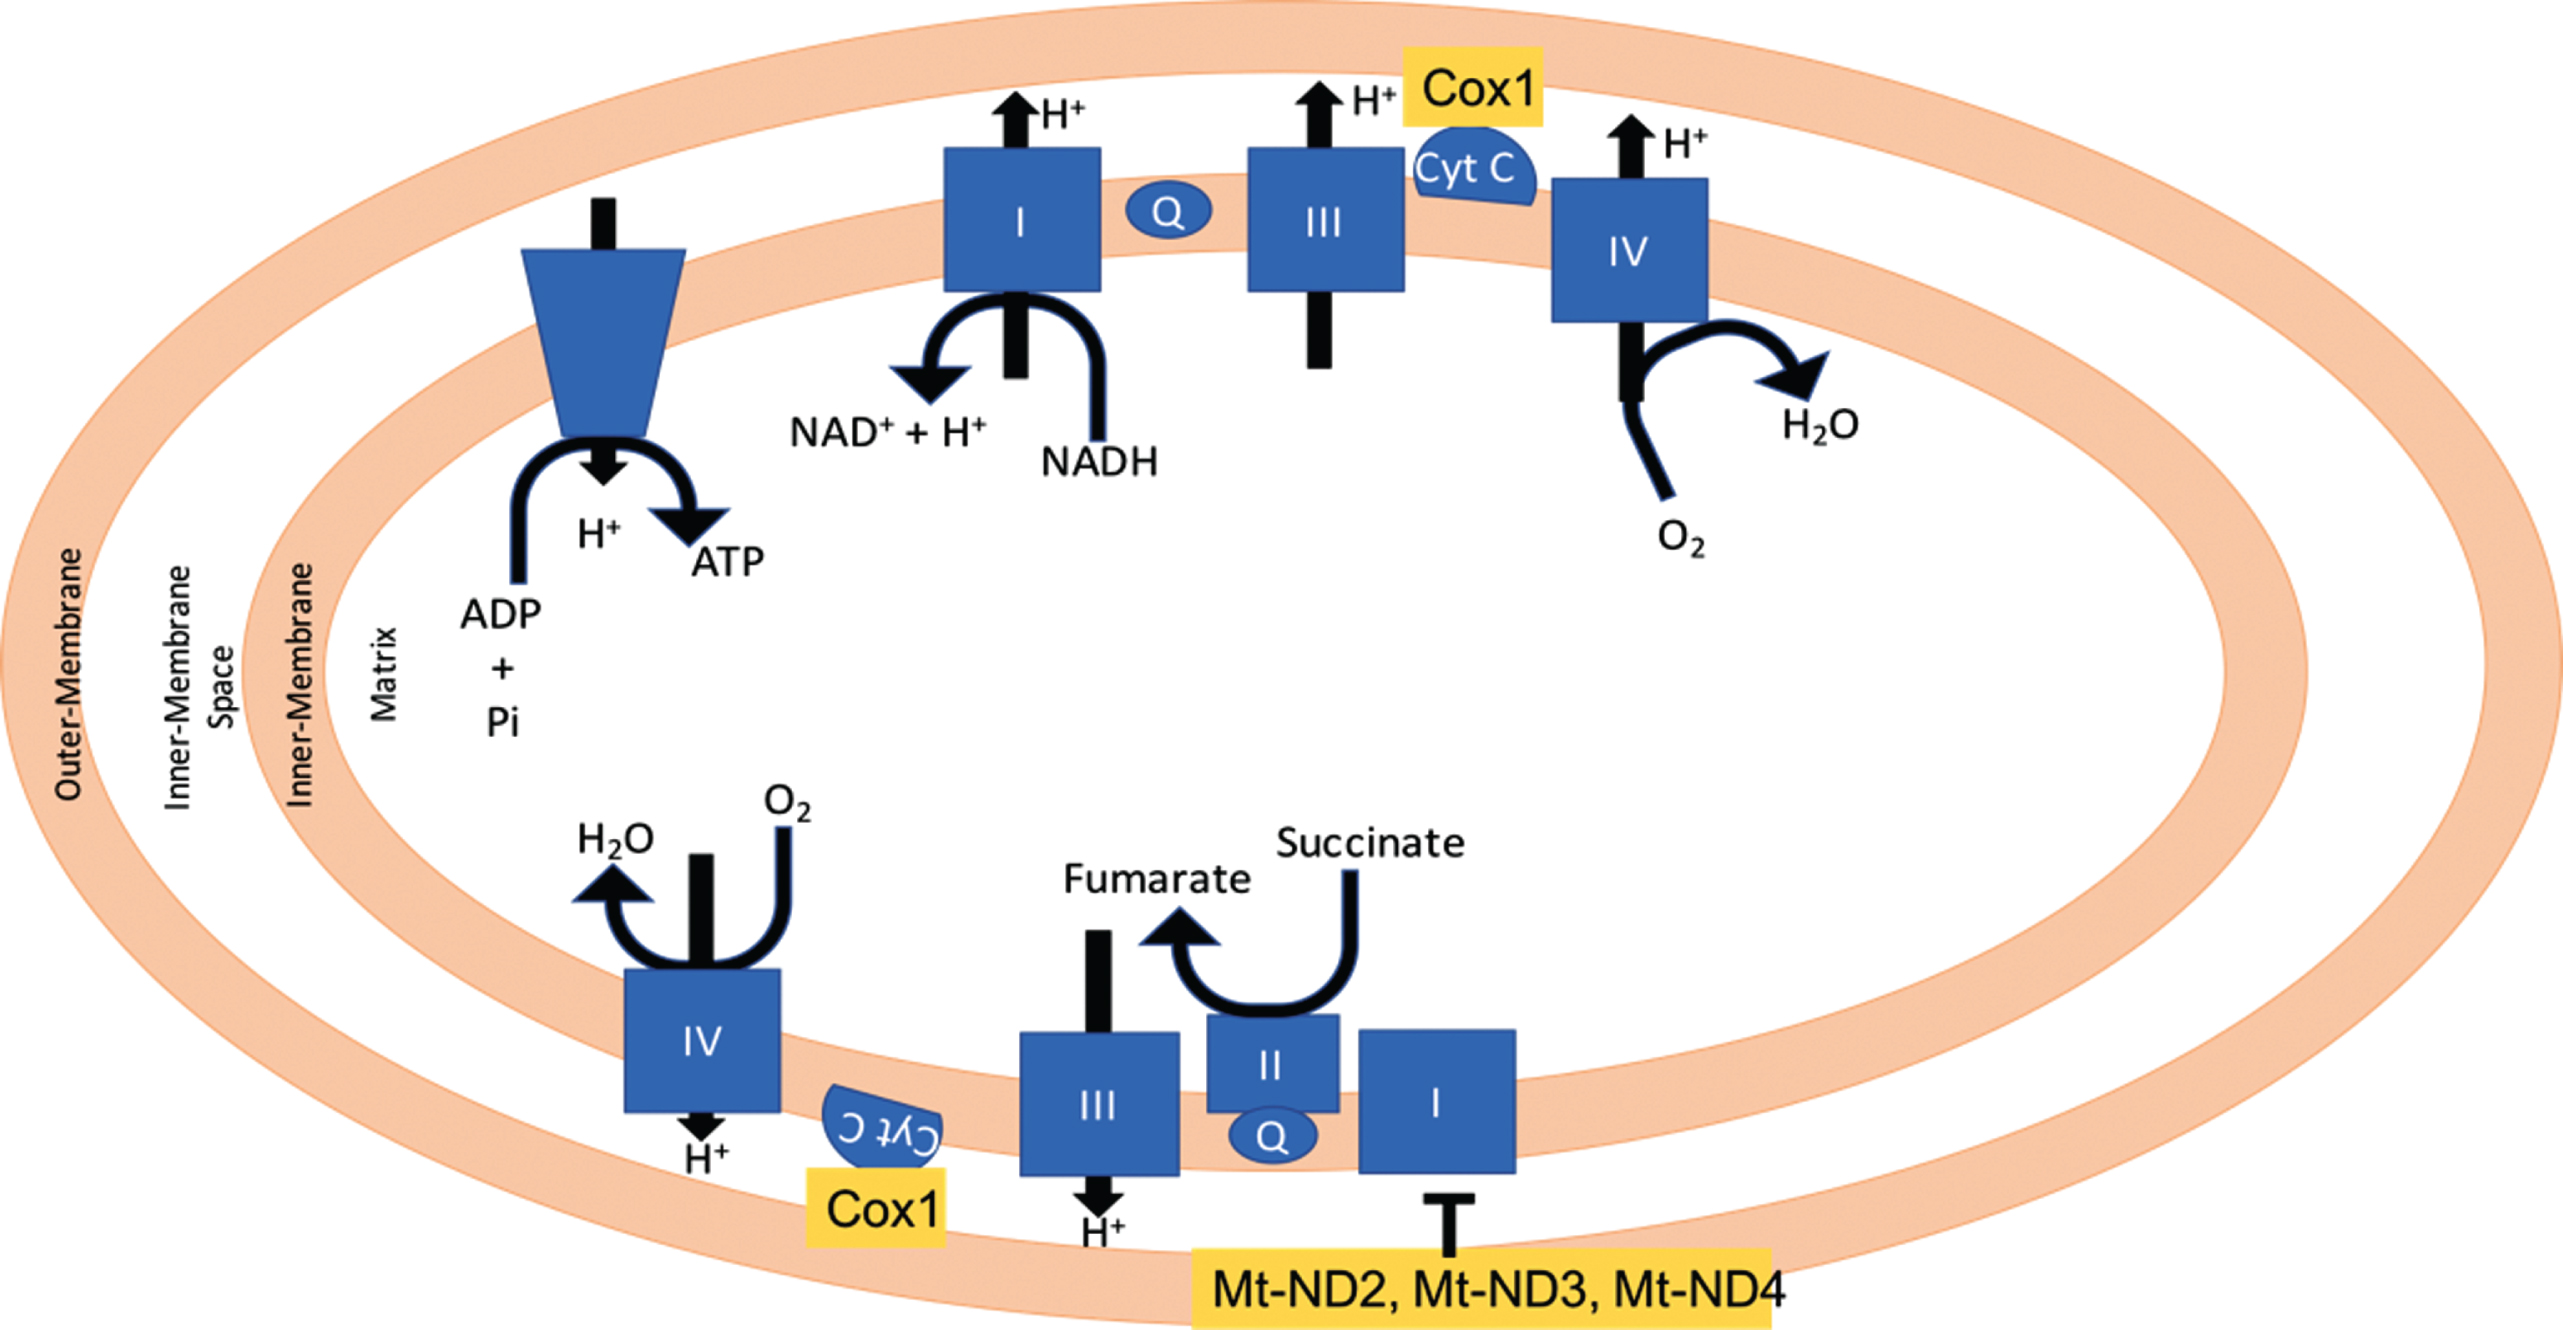
Mitochondrial localization of COX1, Mt-ND3, and Mt-ND4.
Following the TSP, the next gene is COX-1. COX are microsomal enzymes present in two isoforms: COX-1 and COX-2, that are constitutively expressed in most cells. COX enzymes have been reported to play a role in the mechanisms of neurodegeneration [17] and AD through inflammation [18] as well as through interferences with fatty acid metabolism [19]. In a study by Hoozemans et al. in AD brains, microglial cells stained COX-1 positive and was associated with Aβ plaques while COX-2 stained positive in the neuronal cells [20]. This cell specific difference in COX-1 and COX-2 could implicate that they are involved in different processes of AD pathogenesis [20]. COX-1 is overexpressed in frontal and temporal cortex, while its presence in the microglial cells is involved with the amyloid plaque formation [18]. Shukuri et al. provided evidence that COX-1 plays a critical role in microglial activation during acute neuroinflammation in vivo. Non-steroidal anti-inflammatory drugs (NSAIDs) have been shown to reduce AD risk by the inhibition of inflammatory responses [21, 22]. COX-1 is involved in immunoregulation of the CNS [23 –26] and the deletion of COX-1 gene reduces Aβ-induced neuroinflammation and neuronal damage [24 –27]. NCX-2216, is a selective inhibitor of COX-1 and has been shown to have an intermediate effect on reducing amyloid burden [28]. Oddo et al. [29] reported that SC-560, a selective inhibitor of COX-1, reduces amyloid deposits, tau hyperphosphorylation, and neuroinflammation in aged AD mice. Coma et al. [30] demonstrated that Triflusal, an irreversible inhibitor of COX-1, can correct cognition defects in an AD mousemodel.
The expression change for the genes recognized by probe 224373_s_at [31]: ND4, Hnrnpm, and DCAF6, is also selected by the method as being one of biggest ones. MT-ND4, or mitochondrial encoded NADH Dehydrogenase 4, product is also part of Complex I. The mRNA expression for this gene has been reported to decrease in the hippocampus and inferior parietal lobule of AD patients [32]. A study for the expression of mitochondrial ND2 and ND4 genes in amyotrophic lateral sclerosis found that the anterior neurons in the cervical spinal cord had reduced mtDNA gene levels and an increment in the amount of mtDNA deletions [33]. It has been reported that ND4 expression is lower in the temporal cortex of AD patients [34]. Supporting the relation of the mitochondrial electron transfer complexes changes and AD, the study by Lee et al. [35] reported that the expression of SIRT3 was reduced in AD patients, and that lower expression of SIRT3 was reflected in a lower amount of ND2 and ND4, summarized in Fig. 7. The other mRNA recognized by the 224373_s_at probe is that of the Heterogenous nuclear ribonucleoprotein (hnRNP) protein, the product directly binds to pre-mRNA and has important roles in the post-transcriptional regulations in splicing and transport of mRNAs [36, 37]. Studies have shown that some pathological incidents in the AD brain are associated with post-transcriptionally regulation [38 –42], but the details on the post-transcriptionally regulation still remains unclear [42]. Different studies have reported that tangle-bearing neurons reduced mRNAs that are implicated in AD pathology [43] and reduced polyadenylated RNA [44]. Another study reported that hnRNP A2 and B1 expression is decreased in tangle-bearing neurons [42]. DCAF6 codes for a protein that works as a ligand-dependent coactivator of nuclear receptors including androgen receptors, which are involved with the development of AD [32, 45]. Mutations of the DCAF6 gene have been also linked to maternally inherited schizophrenia [46].
Following the correlation path, the next probe (HNRNPA3) corresponds to a control for the microarray. The following probe is for MT-ND3. MT-ND3 codes for another member of mitochondrial Complex I. The product of this gene was shown to bind to a peptide corresponding to 25 amino acids of the C-terminal of Aβ [47]. The authors of the report proposed that the ND3 Aβ interaction could explain in part the lower activity of Complex I in astrocytes and neurons in AD patients.
Insight into molecular role of ribosomal proteins in AD
Following the TSP path, the next gene is RPL41, which codes for the Ribosomal Protein L41. RPL41 has not been associated with AD yet. RPL41 is a small peptide involved in initiating translation. It has been suggested that the RPL41 product plays different roles in cell proliferation and differentiation during neurogenesis [48]. This protein has also been found to help with virus replication in two avian viruses: infectious bursal disease virus [49] and Sindbis virus [50]. RPL41 promotes the expression of the c-myc proto-oncogene [51]. In carcinogenesis, RPL41 induces ATF4 phosphorylation [52]. ATF4 is needed for cancer cells to survive hypoxia and oxidative stress [53, 54]. Figure 8a provides a diagram for the relation of glutathione, RPL41, and neuronal dysfunction. ATF4 in turn mediates neurodegeneration in AD andtransmission of a neurodegenerative signal through some brain regions [55, 56]. Solid evidence have shown that oxidative stress is an initiator of neuronal dysfunction in prevalent neurological diseases, including spinal cord injury, AD, and Parkinson’ s disease [57]. ATF4 is induced by oxidative stress due to the depletion of glutathione. Deletion of ATF4 renders neurons resistant to neuronal cell death and is associated with the preservation of glutathione levels [58], as shown schematically in Fig. 8b.
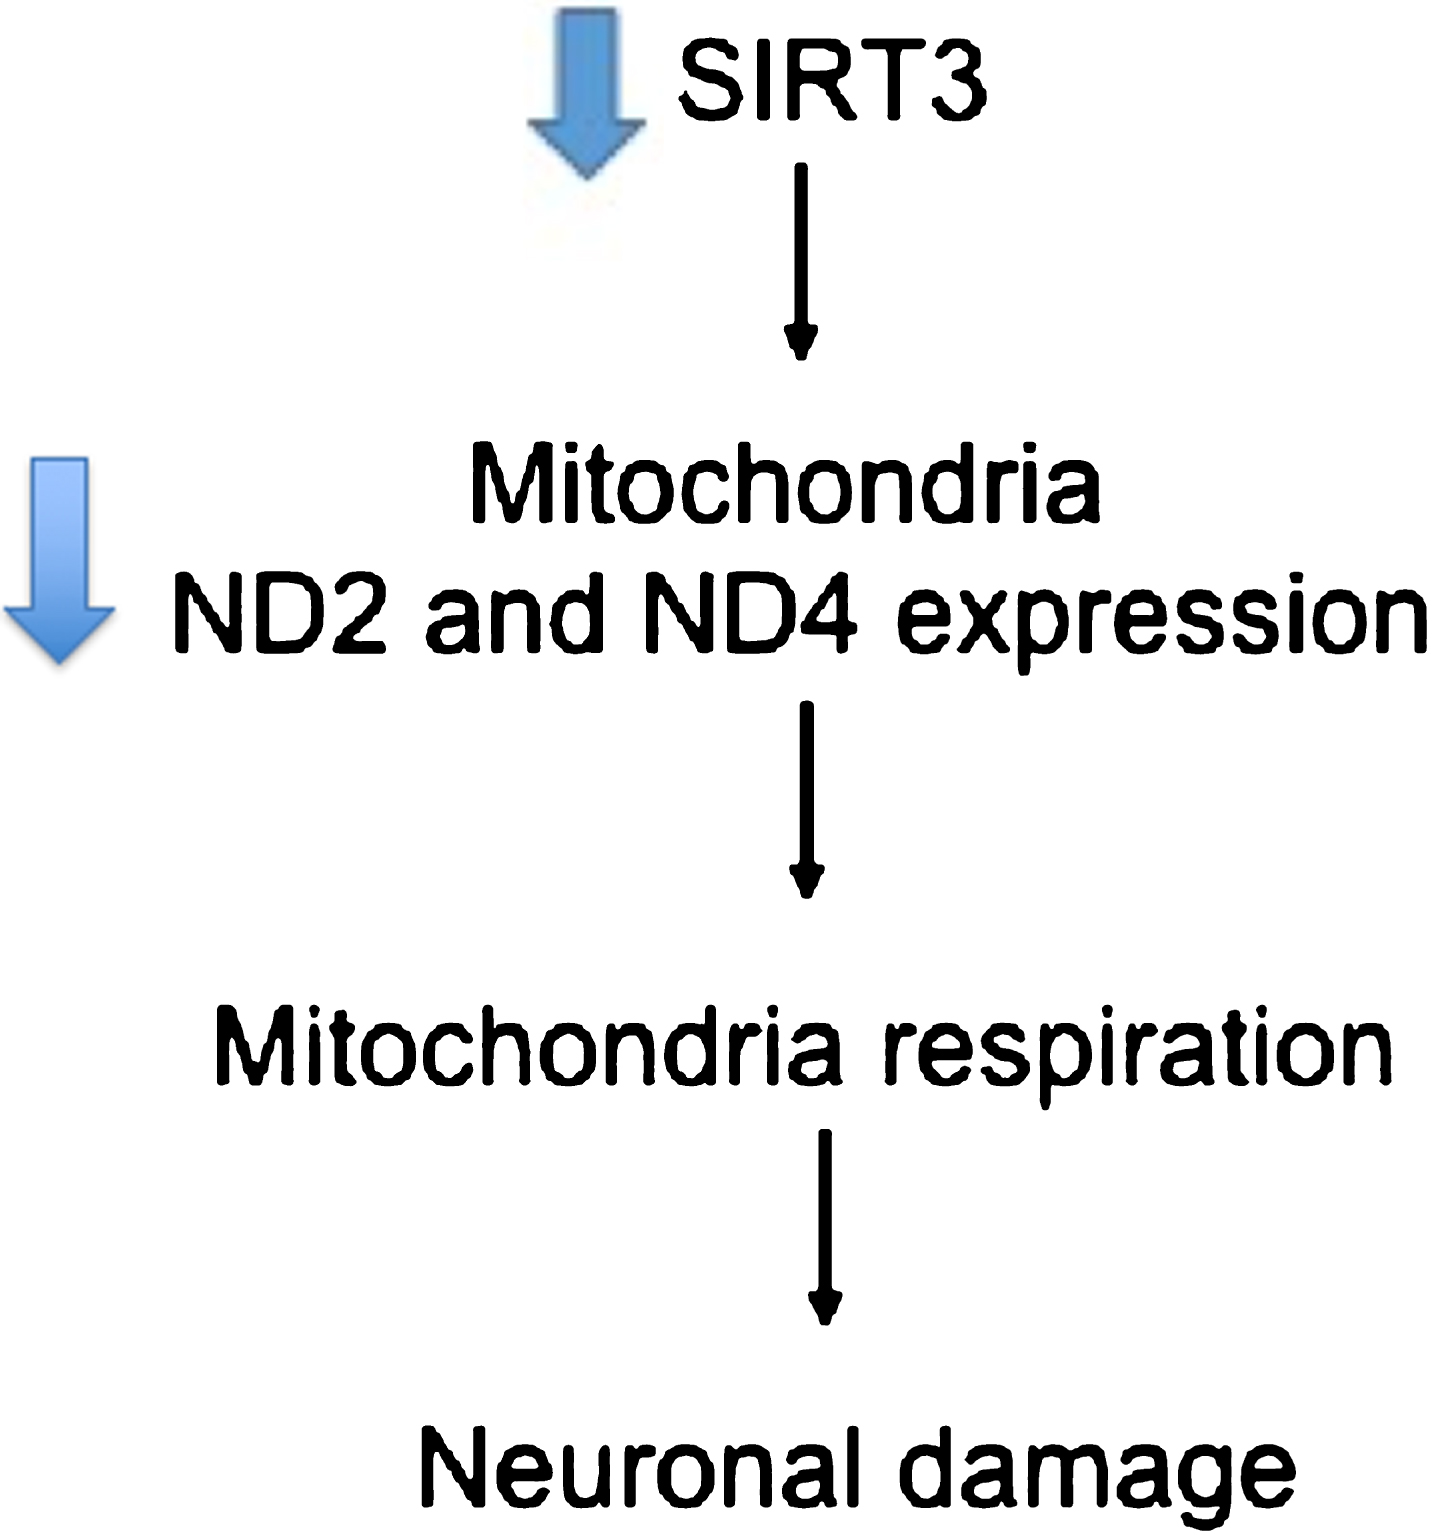
Diagram summarizing a response to SIRT3 lower expression leading to a decrease level of MT-ND2 and MT-ND4 [35]. This decrease levels results in neuronal damage and subsequent neurodegeneration.
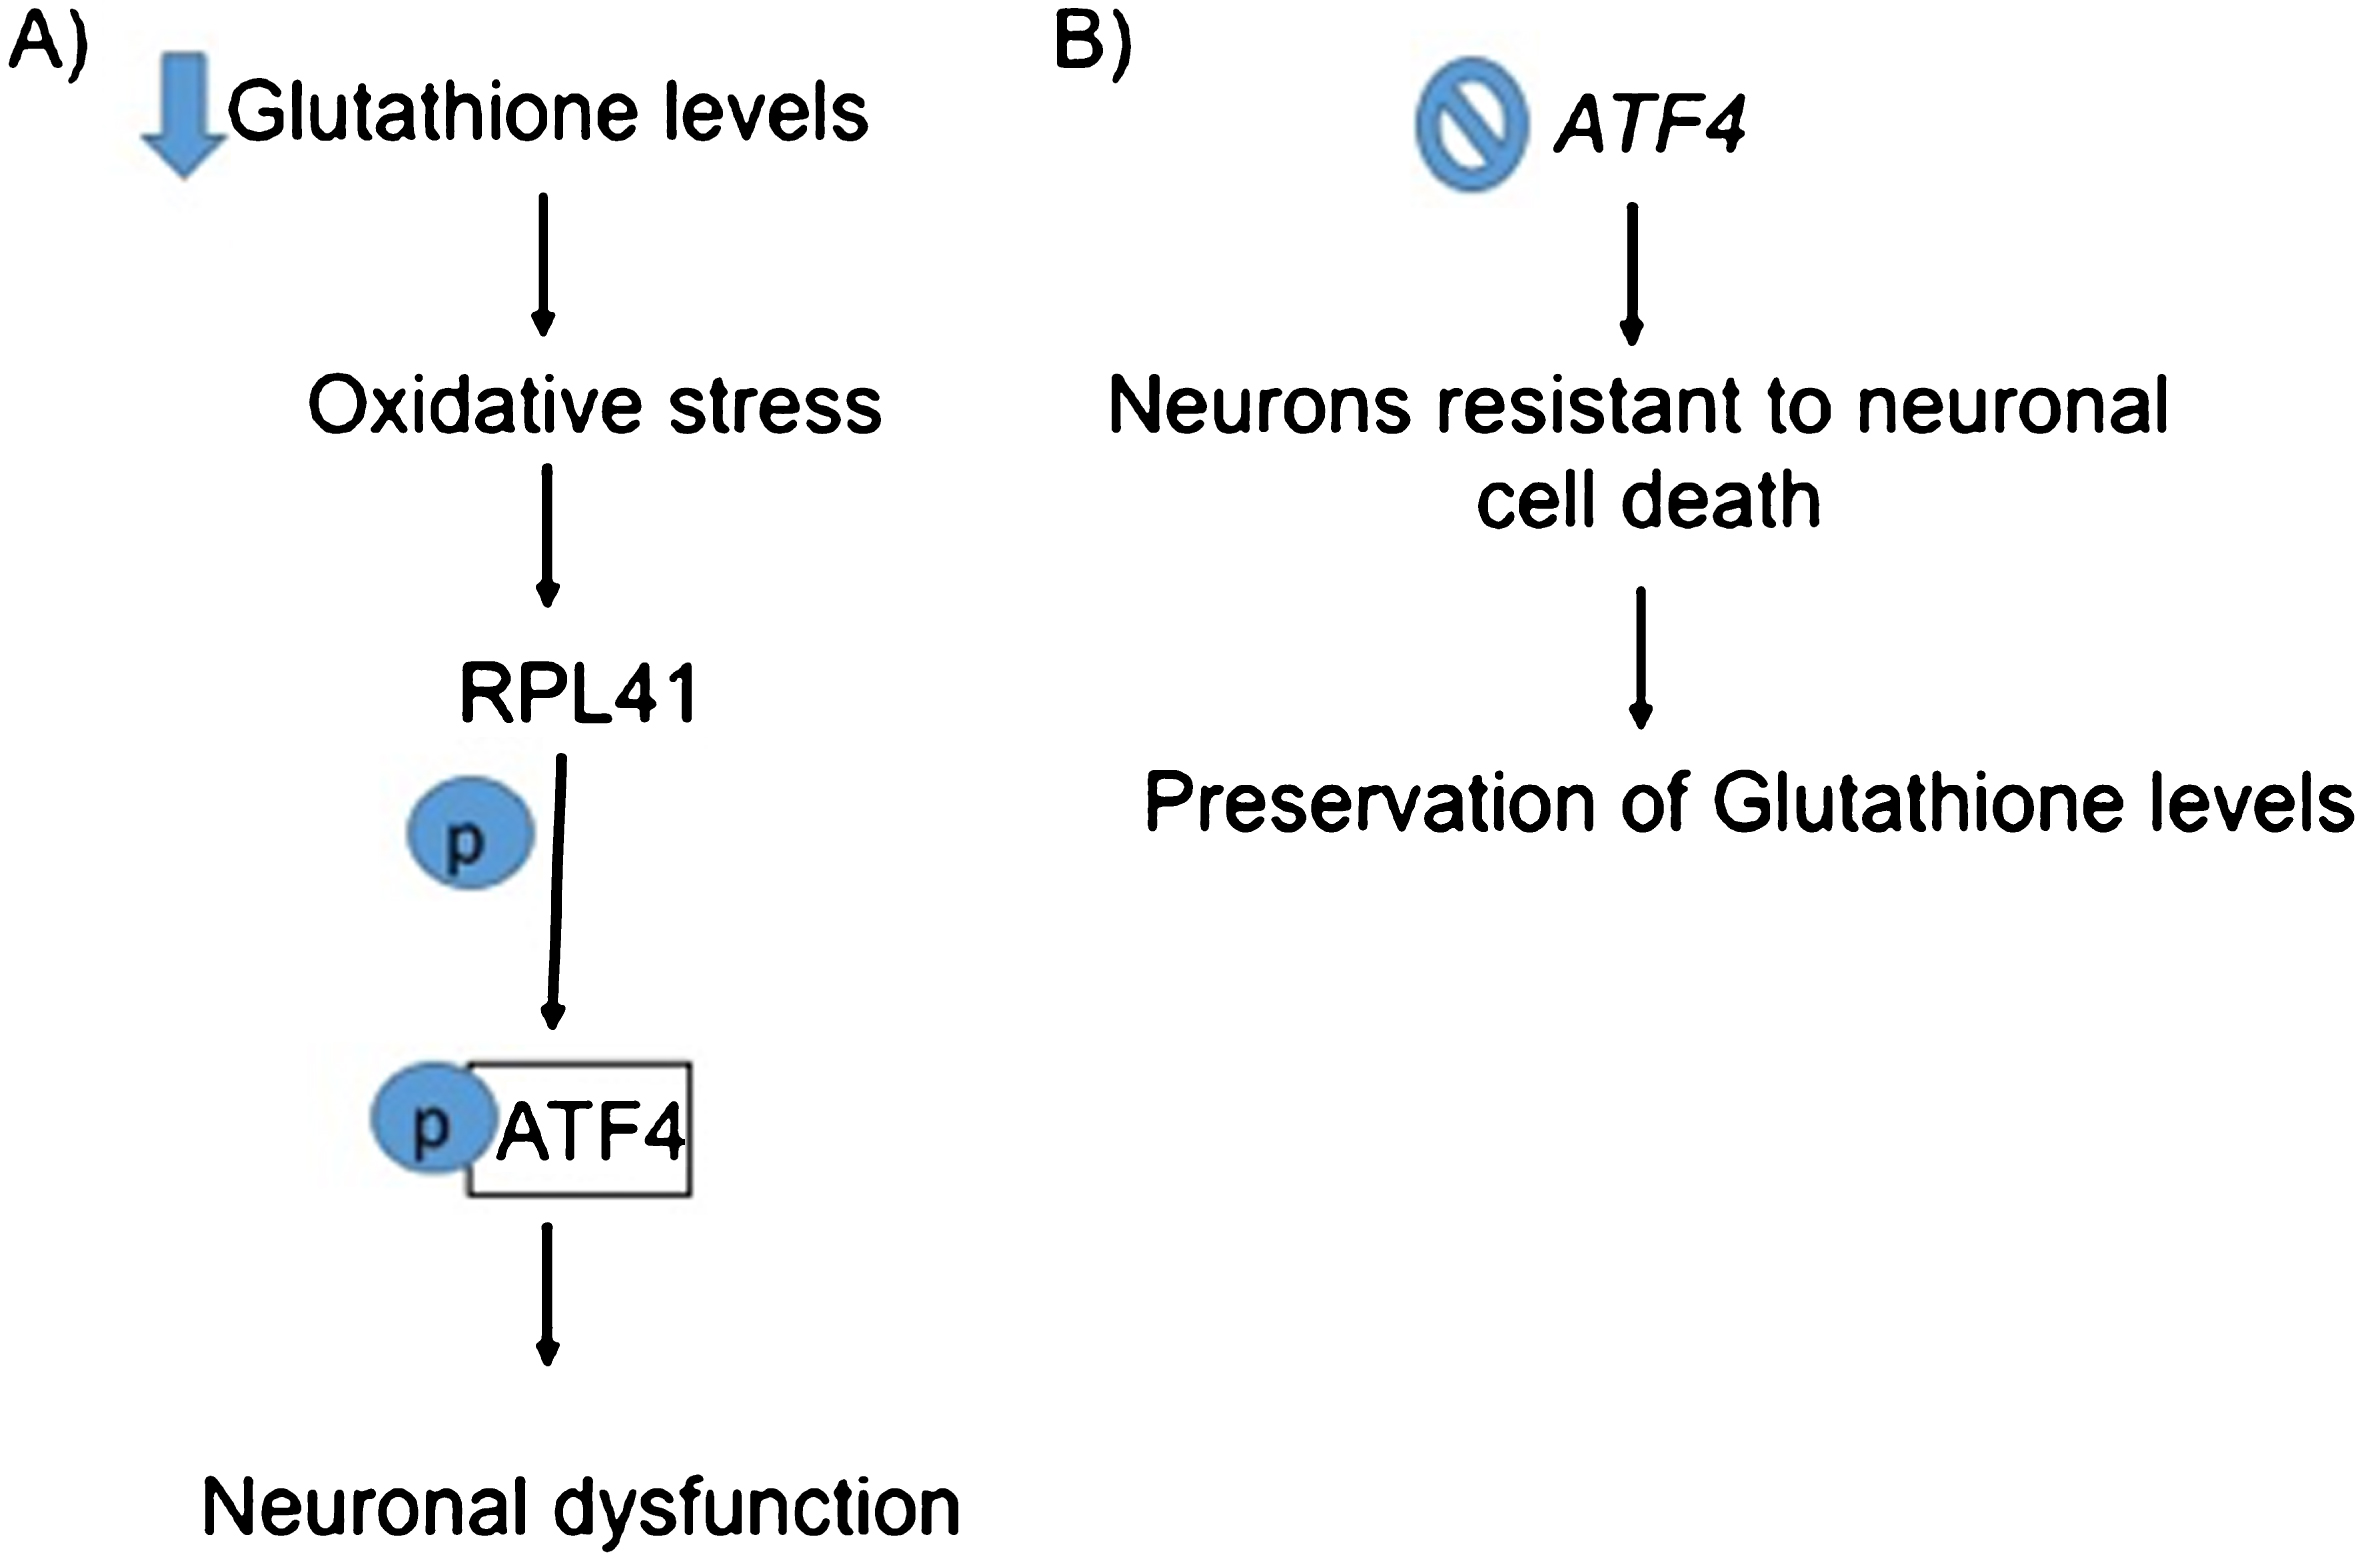
Flowchart summarizing a relation between RPL41 and ATF4. A) Depletion of glutathione induces oxidative stress which causes activation of RPL41 that results in phosphorylation of ATF4 causing neuronal dysfunction [52]. B) Deletion of ATF4 causes neurons to resist cell death and preserve glutathione levels [58].
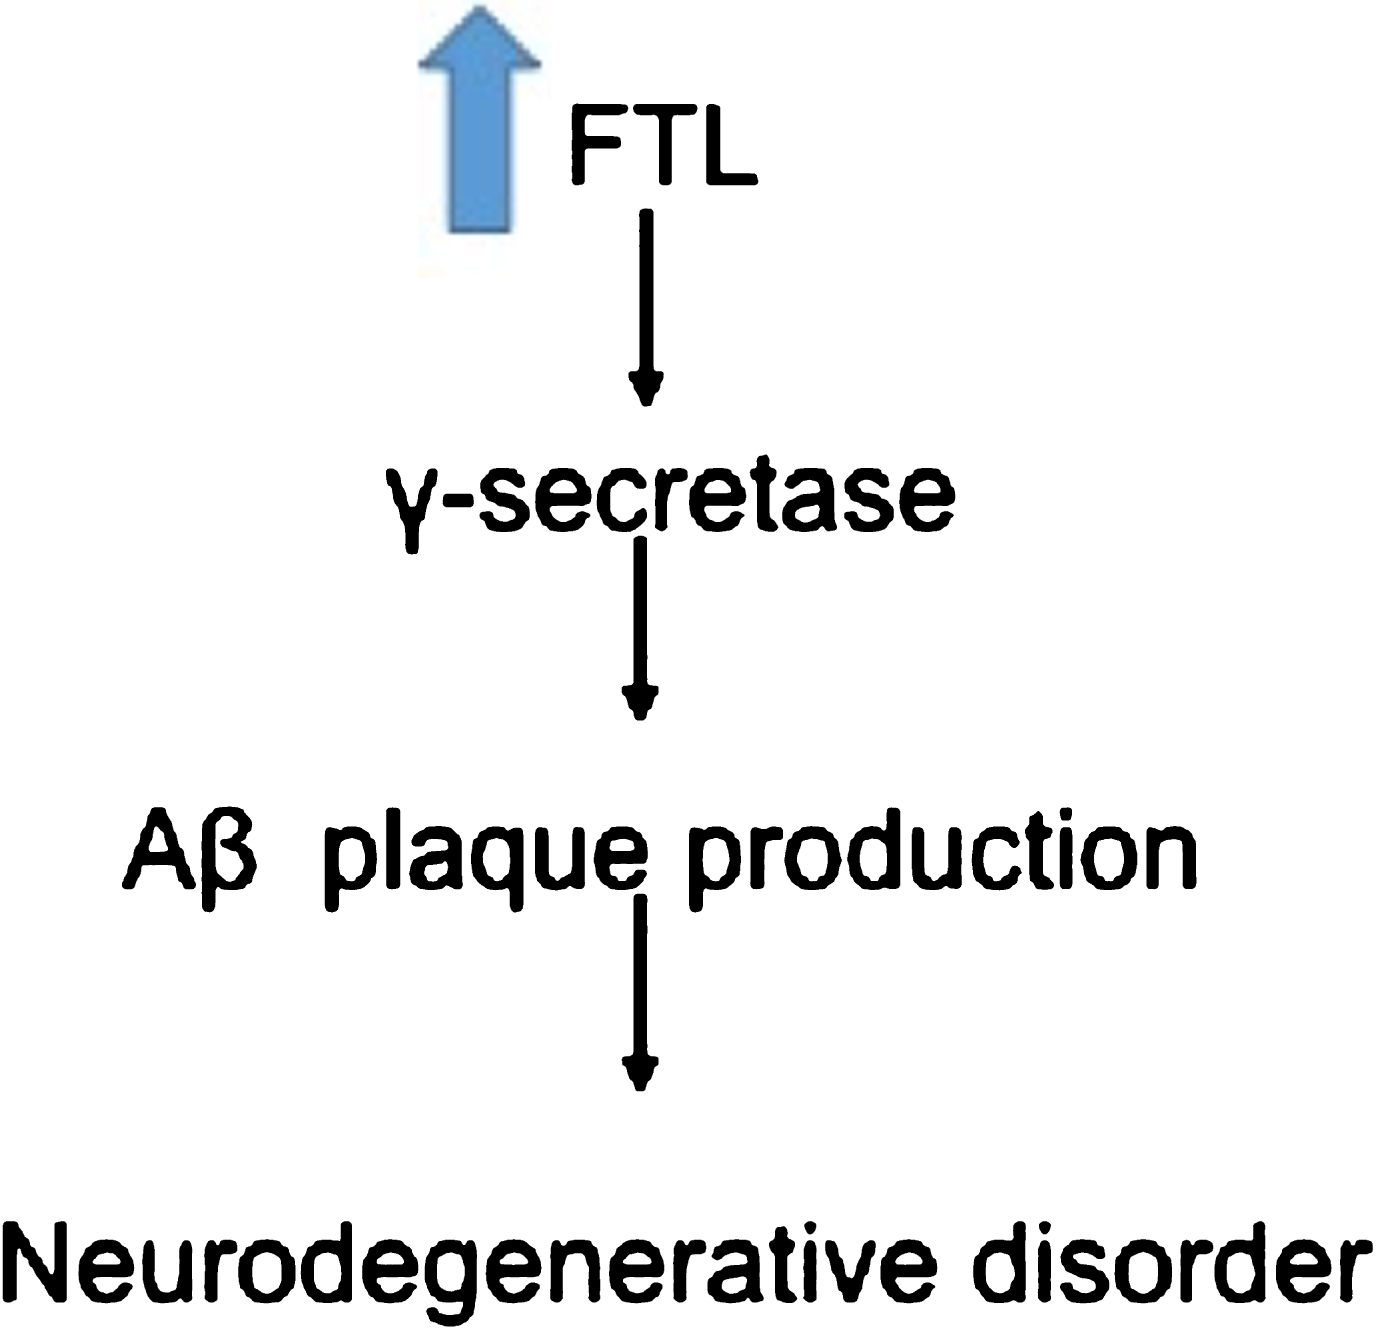
Overexpression of FTL causes increase production of Aβ plaques leading to neurodegeneration [66].
RPS10, next gene in the TSP pathway, codes for one of the proteins of the 40S ribosomal subunit. RPS10 is part of the ribosomal protein family, a family of proteins that has been reported to change its expression in neurodegenerative diseases such as AD [59]. The expression of this gene was found to be lower in schizophrenia patients than in controls [60]. Changes in expression of this gene has been observed in colorectal cancer [61]. The RPS10 protein interacts with the HIV-1 Nef protein [59]. Mutations in the RPS10 are linked to Diamond-Blackfan anemia [62].
Dysregulation of iron in the brain contributes to AD
FTL gene codes for the ferritin light polypeptide protein. Ferritin is the principal iron storage protein. Ferritin consists of ferritin heavy chain (FTH) and ferritin light chain (FTL) [63]. It has been reported that levels of ferritin are lower in the peripheral blood mononuclear cells from AD patients and it has been proposed that this change is one of the factors responsible for the dysregulation of iron found in AD patients [64]. Ferritin has been reported to protect cells from oxidative damage and to participate in innate immunity [65]. Even as ferritin as a whole has a protective role, it has been reported that overexpression of FTL increases γ-secretase that in turn produces more Aβ [66] (Fig. 8). In our results, FTL was overexpress in the cases. FTL product is associated with neurodegenerative disorder related with iron accumulation in the brain, primarily in the basal ganglia [67] and enhances oxidative damage [68 –70]. Besides the effect that FTL has on Aβ production, dysregulation of iron storage proteins has an impact on cell function. Iron has a direct impact on the formation of Aβ plaque through its effect on amyloid-β protein precursor metabolism [71, 72], promoting Aβ deposition and oxidative stress induced toxicity [73], as well as the aggregation of hyperphosphorylated tau [63].
Biomarker for astroglial pathology in AD
Next gene on the TSP path is GFAP; this gene codes for Glial fibrillary acidic protein (GFAP), an intermediate filament protein in astrocytes. Astrocytes are part of the glial cells and their functions include maintenance of the central nervous system neurons’ microenvironment [74]. GFAP is increased in processes of brain damage and neurodegeneration and is a target and biomarker for astroglial pathology in neurological diseases [75, 76]. Mutations in this gene are responsible for Alexander disease (a rare disorder of the central nervous system), leukodystrophy, and AD [22].
NUCKS1
Following the TSP pathway is NUCKS1, this gene codes for nuclear casein kinase and cyclin-dependent kinase substrate 1 [77]. NUCKS1 is a nuclear protein, highly conserved in vertebrates [78]. It is expressed in most tissues and experiments in rats have shown that its expression increases during the initial stages of embryonic development in brain and liver [77]. Qiu et al. [79] reported that in the embryonic development, NUCKS1 appears to be a marker for migrating cells of the neural crests. NUCKS1 has been shown to be important for homologous recombination DNA damage response [80] and to play a role in inflammatory immune response [78]. It is interesting to note that the NUCKS1 product is also used by the HIV-1 for the viral transcription of its genetic material [81] and has been reported as a biomarker for some cancer [82, 83]. Gene ontology analyses indicates that NUCKS1 also helps maintain glucose homeostasis [84]. The expression change of the NUCKS1 has been linked to mood disorders, Parkinson’s disease [85, 86], and to AD [87], providing a common link between different neurological conditions.
In summary, grouping genes that code for proteins of a bigger complex one finds: ND4, ND2, and ND3, mitochondrial encoded NADH dehydrogenase (Complex I) genes. Another mitochondrial-encoded gene is COX1 and its product also forms part of one of the electron transport complexes. The correlations between the expression changes for these genes are high, more than 0.9. These results coincide with the reports of mitochondrial genes expression change in AD [88, 89] and other neurodegenerative diseases [90]. There are two genes that code for different ribosomal proteins: RPS10 and RPL4, in the TSP they are separated by FTL and GFAP. Some of the selected genes have been reported to change their expression in different cancers and some are known to be used by viruses to produce infections.
Conclusion
In this study, the analysis of the microarray dataset GSE4757 was modeled as an MCO problem in order to find those genes that change their expression the most in AD neurons in the presence of NFTs. To find how the expression changes are correlated for the selected genes, the TSP formulation was used. From the results, it is possible to identify biologically relevant connections that can help to characterize this disease.
Our analysis identifies genes already reported as relevant to inflammation and neurodegenerative diseases and provides leads for future experimental studies for those genes that had not been reported yet in AD. Results also suggest that infections could be related to AD development as other reports have proposed [47 –50]. Genes without previous report relevance in AD can be proposed for further biological validation as well as the gene expression connections that have not been explored yet.
Footnotes
ACKNOWLEDGMENTS
The project described was supported by Award Number G12MD007579 from the National Institute on Minority Health and Health Disparities. The content is solely the responsibility of the authors and does not necessarily represent the official views of the National Institutes of Health. The authors also acknowledge the support of National Institutes of Health (NIH) MARC Grant 5T36GM095335-02 ‘Bioinformatics Programs at Minority Institutions’. Coauthors Cruz-Rivera and Cabrera-Ríos acknowledge the support of USDA-NIFA Award 2015-38422-24064 sub award 1000000920. BE AWARE Project.