
Abstract
Background:
Alzheimer’s disease (AD) mortality rates have steadily increased over time. Lithium, the current gold standard treatment for bipolar disorder, can exert neuroprotective effects against AD.
Objective:
We examined the relationship between trace levels of lithium in drinking water and changes in AD mortality across several Texas counties.
Methods:
6,180 water samples from public wells since 2007 were obtained and averaged for 234 of 254 Texas counties. Changes in AD mortality rates were calculated by subtracting aggregated age-adjusted mortality rates obtained between 2000–2006 from those obtained between 2009–2015. Using aggregated rates maximized the number of counties with reliable mortality data. Correlational analyses between average lithium concentrations and changes in AD mortality were performed while also adjusting for gender, race, education, rural living, air pollution, physical inactivity, obesity, and type 2 diabetes.
Results:
Age-adjusted AD mortality rate was significantly increased over time (+27%, p < 0.001). Changes in AD mortality were negatively correlated with trace lithium levels (p = 0.01, r = –0.20), and statistical significance was maintained after controlling for most risk factors except for physical inactivity, obesity, and type 2 diabetes. Furthermore, the prevalence of obesity and type 2 diabetes positively correlated with changes in AD mortality (p = 0.01 and 0.03, respectively), but also negatively correlated with trace lithium in drinking water (p = 0.05 and <0.0001, respectively).
Conclusion:
Trace lithium in water is negatively linked with changes in AD mortality, as well as obesity and type 2 diabetes, which are important risk factors for AD.
INTRODUCTION
Alzheimer’s disease (AD), the most common neurodegenerative disease, is a progressive neurological disorder characterized by the irreversible loss of neurons primarily in the cortex and hippocampus resulting in impaired memory, decision-making, orientation to physical surroundings, and language [1, 2]. Age is the most well known risk factor for AD with increased risk past the age of 65 [2, 3], and with the accelerated growth of older populations, AD is projected to place a significant burden on the economy and health care system. Indeed, age-adjusted AD mortality rates have steadily increased for decades [4–8], and AD is now the 6th leading cause of death in the U.S [9]. Altogether, this has placed prevention and treatment of this disease at the forefront of health promotion and public health concerns. However, determining cost-effective and equitable approaches to prevent or slow the rise of AD is difficult without knowing the exact cause or cure.
Lithium is most known for its use in treating bipolar disorder, but it also exerts neuroprotective effects, and has recently been viewed as a potential therapeutic agent that can slow or prevent the progression of AD (for review, see [10, 11]). However, adverse events, such as renal damage, thyroid disorders, and gastrointestinal disturbances, have been associated with lithium therapy at high doses, including those used to treat bipolar disorder (900–1,200 mg/day) [12–14]. As such, constant monitoring is required to maintain serum lithium concentrations at a safe and effective concentration of 0.5–1.5 mM [13]. Interestingly, several ecological studies have shown that trace levels of lithium, found naturally in tap water and hundreds below these therapeutic and potentially toxic doses can improve mental health and stabilize mood, thereby reducing rates of suicide and crime [15–22]. Given the putative effects of lithium on preventing/slowing progression of AD [10, 24], we questioned whether trace levels of lithium in the Texas public water supply would also be associated with AD. Since low dose lithium treatment has been effective in reducing AD pathology in pre-clinical and clinical models [10, 26], we hypothesized that trace levels of lithium would be negatively linked with AD. Specifically, we tested this association with changes in AD mortality, as AD mortality rates have steadily increased throughout the years [4–7], and are the most readily available indicator of AD in the U.S.
METHODS
Data acquisition
Cationic lithium concentrations in the public water supply were obtained from the Texas Water Development Board Groundwater Database after applying filters such as ‘quality’ and ‘last 10 years’. A total of 6,180 water samples from 234 of 254 Texas counties were obtained and then averaged. Lithium concentration data from the remaining 20 counties were missing from the database.
To calculate the change in AD mortality across the Texas counties, we obtained the age-adjusted AD mortality rates (per 100,000) for each county between 2000–2006 and between 2009–2015 from the Center for Disease Control (CDC) Wonder’s Compressed Mortality Database using the code ‘G30’. The change in AD mortality was then calculated by subtracting the rate obtained between 2000–2006 from those obtained between 2009–2015. We chose to obtain rates using a 7-year aggregation to increase the number of counties with reliable AD mortality rates. As per the CDC Wonder Database, a death rate based on fewer than 20 deaths has a relative standard error of 23% or more, and is therefore considered statistically unreliable. In total, 155 counties had reliable age-adjusted AD mortality rates from both 2000–2006 and 2009–2015 time periods.
To control for several AD risk factors, we obtained data on race, gender, education, rural living, air pollution, physical activity, obesity, and type 2 diabetes. Females, Hispanics, and African Americans are known to be at a greater risk for developing AD [27, 28], and we obtained the percent of population represented by females, Hispanics, and African Americans within each county from 2011–2015 from the Census Bureau’s Population Estimates Program. Individuals with a low education status are also at increased risk for the development of AD [29], and the percentage of adults having some post-secondary education (2011–2015) was obtained from the American Community Survey. Air pollution is another risk factor for AD [30, 31], and data pertaining to air pollution from 2013–2016 for all Texas counties from the CDC Wonder environmental dataset. This reports the measures of fine particulate matter in the outdoor air per cubic meter. County-level data are aggregated from 10 km2 spatial resolution grids. A recent systematic review also revealed that individuals living in rural areas within the U.S. are more prone to developing AD than those living in urban areas [32]. The percent of population living in rural areas for each county from 2011–2015 was obtained from the Census Bureau’s Population Estimated Program. Obesity, type 2 diabetes, and physical inactivity have been linked to AD development [33–36], and the prevalence of adult (>20 years) obesity and diabetes, as well as estimates on physical inactivity were obtained from the National Diabetes Surveillance system. Physical inactivity was defined as the percentage of adults reporting no leisure-time physical activity (ie. running, calisthenics, golf, gardening, or walking for exercise). Obesity was defined as having a body mass index >30 kg/m2. Respondents were considered to have diagnosed diabetes if they responded, “yes” to the question, “Has a doctor ever told you that you have diabetes?” Gestational diabetes was excluded from the dataset. The surveillance system does not distinguish between types of diabetes, but because type 2 diabetes accounts for 90–95% of the cases of diagnosed diabetes, trends in type 2 diabetes are likely to be similar to trends documented by the surveillance system, and therefore referred to herein as type 2 diabetes. For obesity, type 2 diabetes, and physical inactivity, data were obtained and averaged from 2011–2015.
Statistical analyses
Similar to previous studies examining the effects of trace lithium and suicide mortality [15, 21], trace lithium concentrations were log-transformed prior to correlational analyses. The prevalence of obesity, type 2 diabetes, and the percent of those physically inactive across the Texas counties were also log-transformed. Tests for normality were conducted using a Kolmogorov-Smirnov test and a Pearson or Spearman correlation was then performed. Partial correlational analyses were used to examine the association between trace lithium and changes in AD mortality while controlling for gender, race, education, rural living, air pollution, physical inactivity, obesity, and type 2 diabetes. A paired t-test was used to assess the change in AD mortality between time periods. A student’s t-test was used to determine whether changes in AD mortality would be different between counties below and above the median lithium concentration level of 0.04 mg/L. A non-parametric Mann-Whitney tests was used to determine whether lithium concentrations between counties with more than 20 AD deaths in the time periods examined would differ from those counties with less than 20 AD deaths. All statistical tests were performed using SPSS (IBM Corporation, NY, US), and a p value≤0.05 was considered statistically significant.
RESULTS
Descriptive statistics and changes in AD mortality through time
Table 1 lists the descriptive statistics for the average lithium concentrations found in the Texas water supply and the controlling variables used in our partial correlations. Table 2 reveals a 27% average increase in age-adjusted AD mortality across the Texas counties that had reliable AD mortality data from 2000–2006 and from 2009–2015.
Descriptive statistics for lithium concentrations and controlling factors in the state of Texas
Age-adjusted AD mortality rates over time
Average age-adjusted mortality rates represent the average AD mortality rates across all counties with reliable data; p-value represents the results from a paired t-test examining the change in age-adjusted mortality rates; n represents the number of pairs examined or the number of counties with reliable age-adjusted mortality rates in both time periods examined.
Changes in age-adjusted AD mortality and lithium levels in tap water
We next sought to determine whether changes in age-adjusted AD mortality across the Texas counties would be negatively associated with lithium levels in drinking water. Our results show that log lithium levels were negatively correlated with changes in AD mortality (Fig. 1A). In turn, dividing the counties in half via the median lithium concentration of 0.04 mg/L show that, on average, counties with less than 0.04 mg/L had significantly higher increases in age-adjusted AD mortality compared with counties with greater than 0.04 mg/L (Fig. 1B). Importantly, the negative association between log lithium and changes in AD mortality remained significant while controlling for various risk factors including: gender, race, education, rural living, and air pollution (Table 3). However, statistical significance was lost after controlling for physical inactivity, type 2 diabetes, and type 2 diabetes and obesity combined (Table 3).
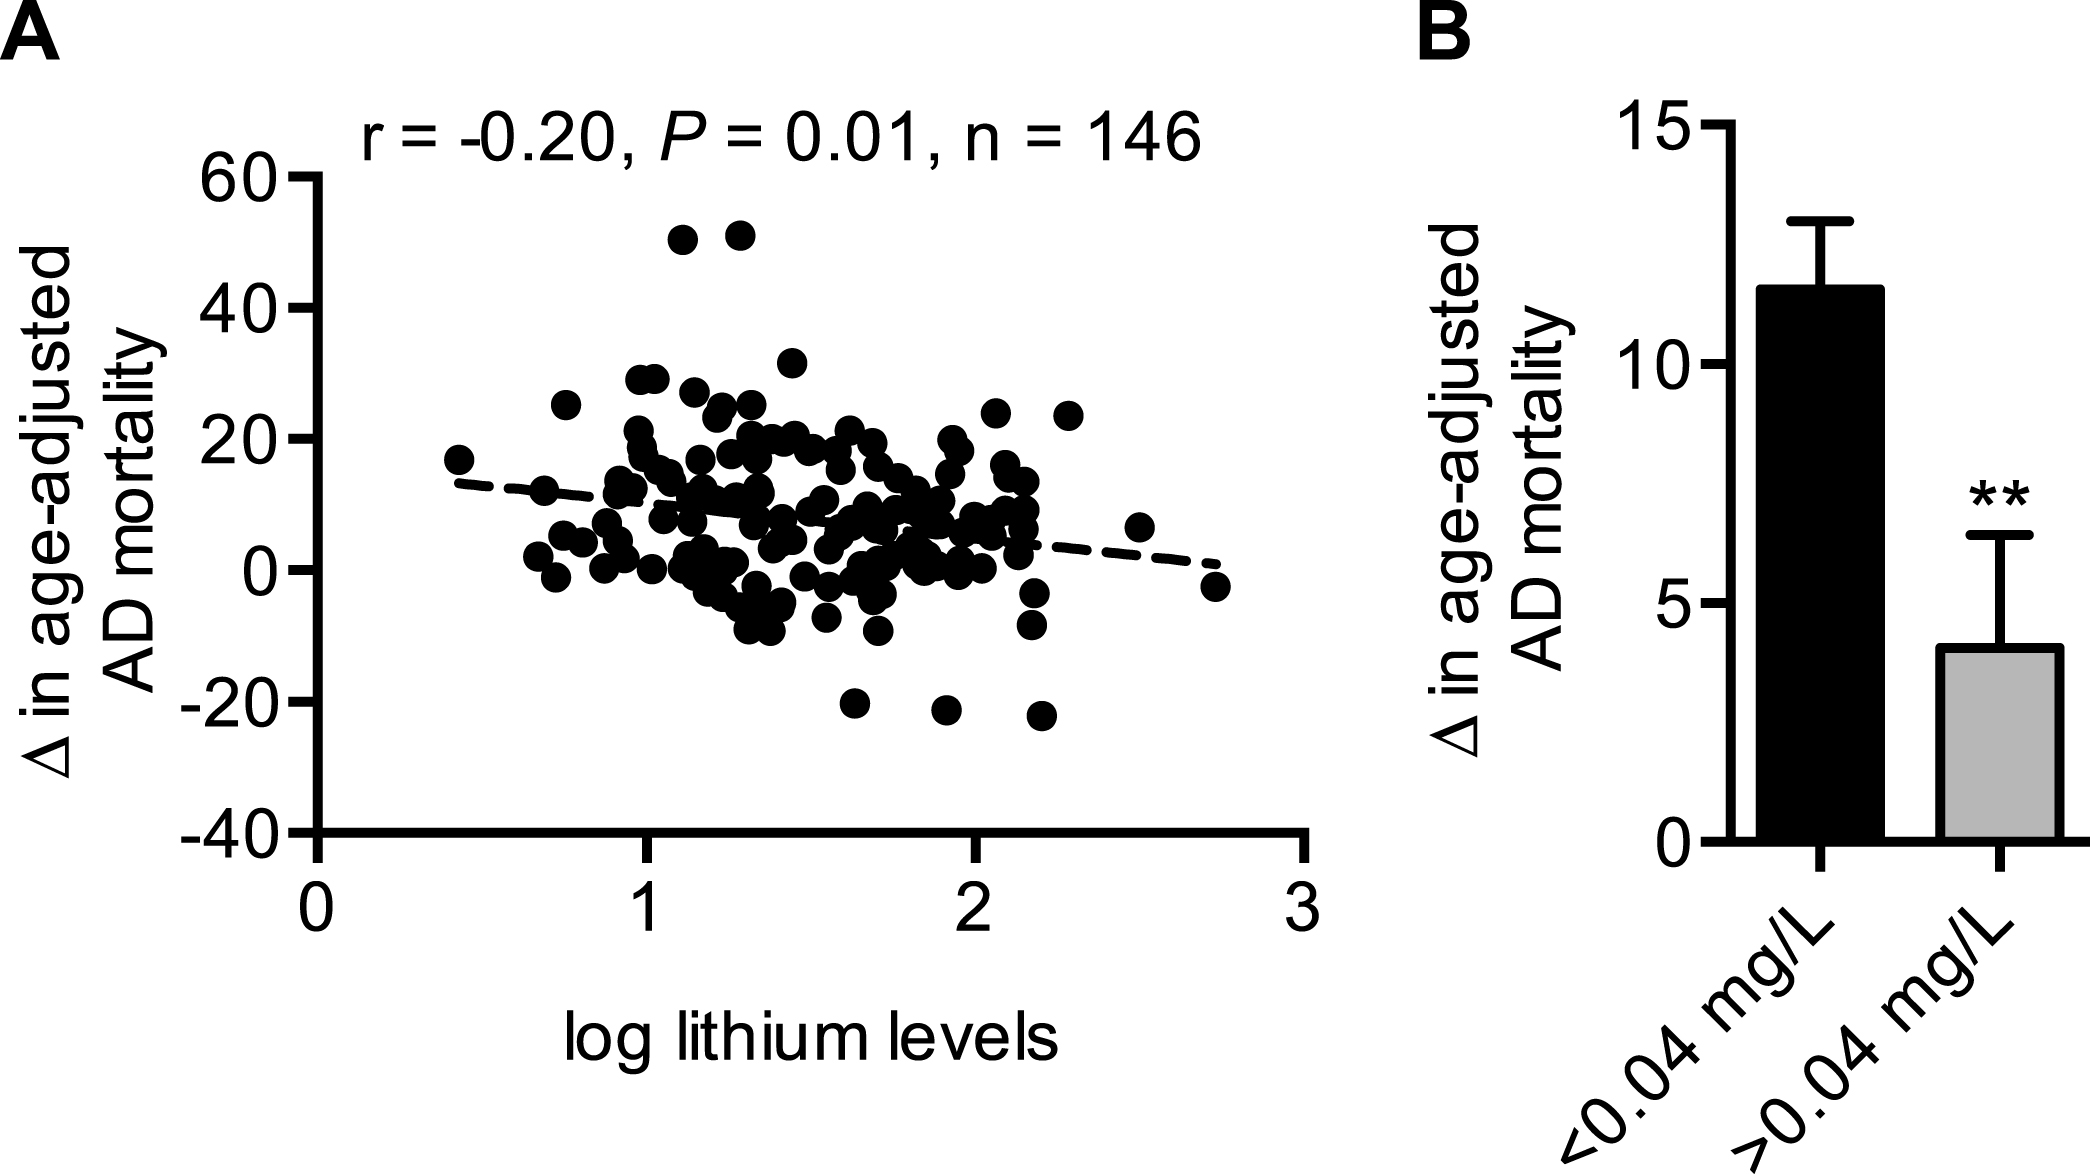
A) Trace levels of lithium in the Texas public water supply is negatively linked with changes in AD mortality. B) Texas counties below the median level of lithium concentration (0.04 mg/L) have greater increases in AD mortality over time. *p≤0.05 using a Student’s t-test. For (B), values are means±standard error.
Adjusted correlations between log lithium levels in tap water and changes in age-adjusted AD mortality in Texas
Prevalence of obesity and type 2 diabetes are positively associated with changes in AD mortality and negatively linked with lithium in drinking water
We then determined whether the prevalence of obesity and type 2 diabetes and the percent of physical inactivity would be associated with changes in age-adjusted AD mortality. Our results show that obesity, type 2 diabetes, and percent physical inactivity were all positively associated with changes in AD mortality (Fig. 2). Interestingly, further correlational analyses between trace lithium in Texas drinking water and the prevalence of obesity and type 2 diabetes also revealed significant negative associations (Fig. 3). As we were able to obtain data on the prevalence of obesity and type 2 diabetes from all Texas counties, we were able to perform correlational analyses with all counties (n = 234) that had lithium concentration data.
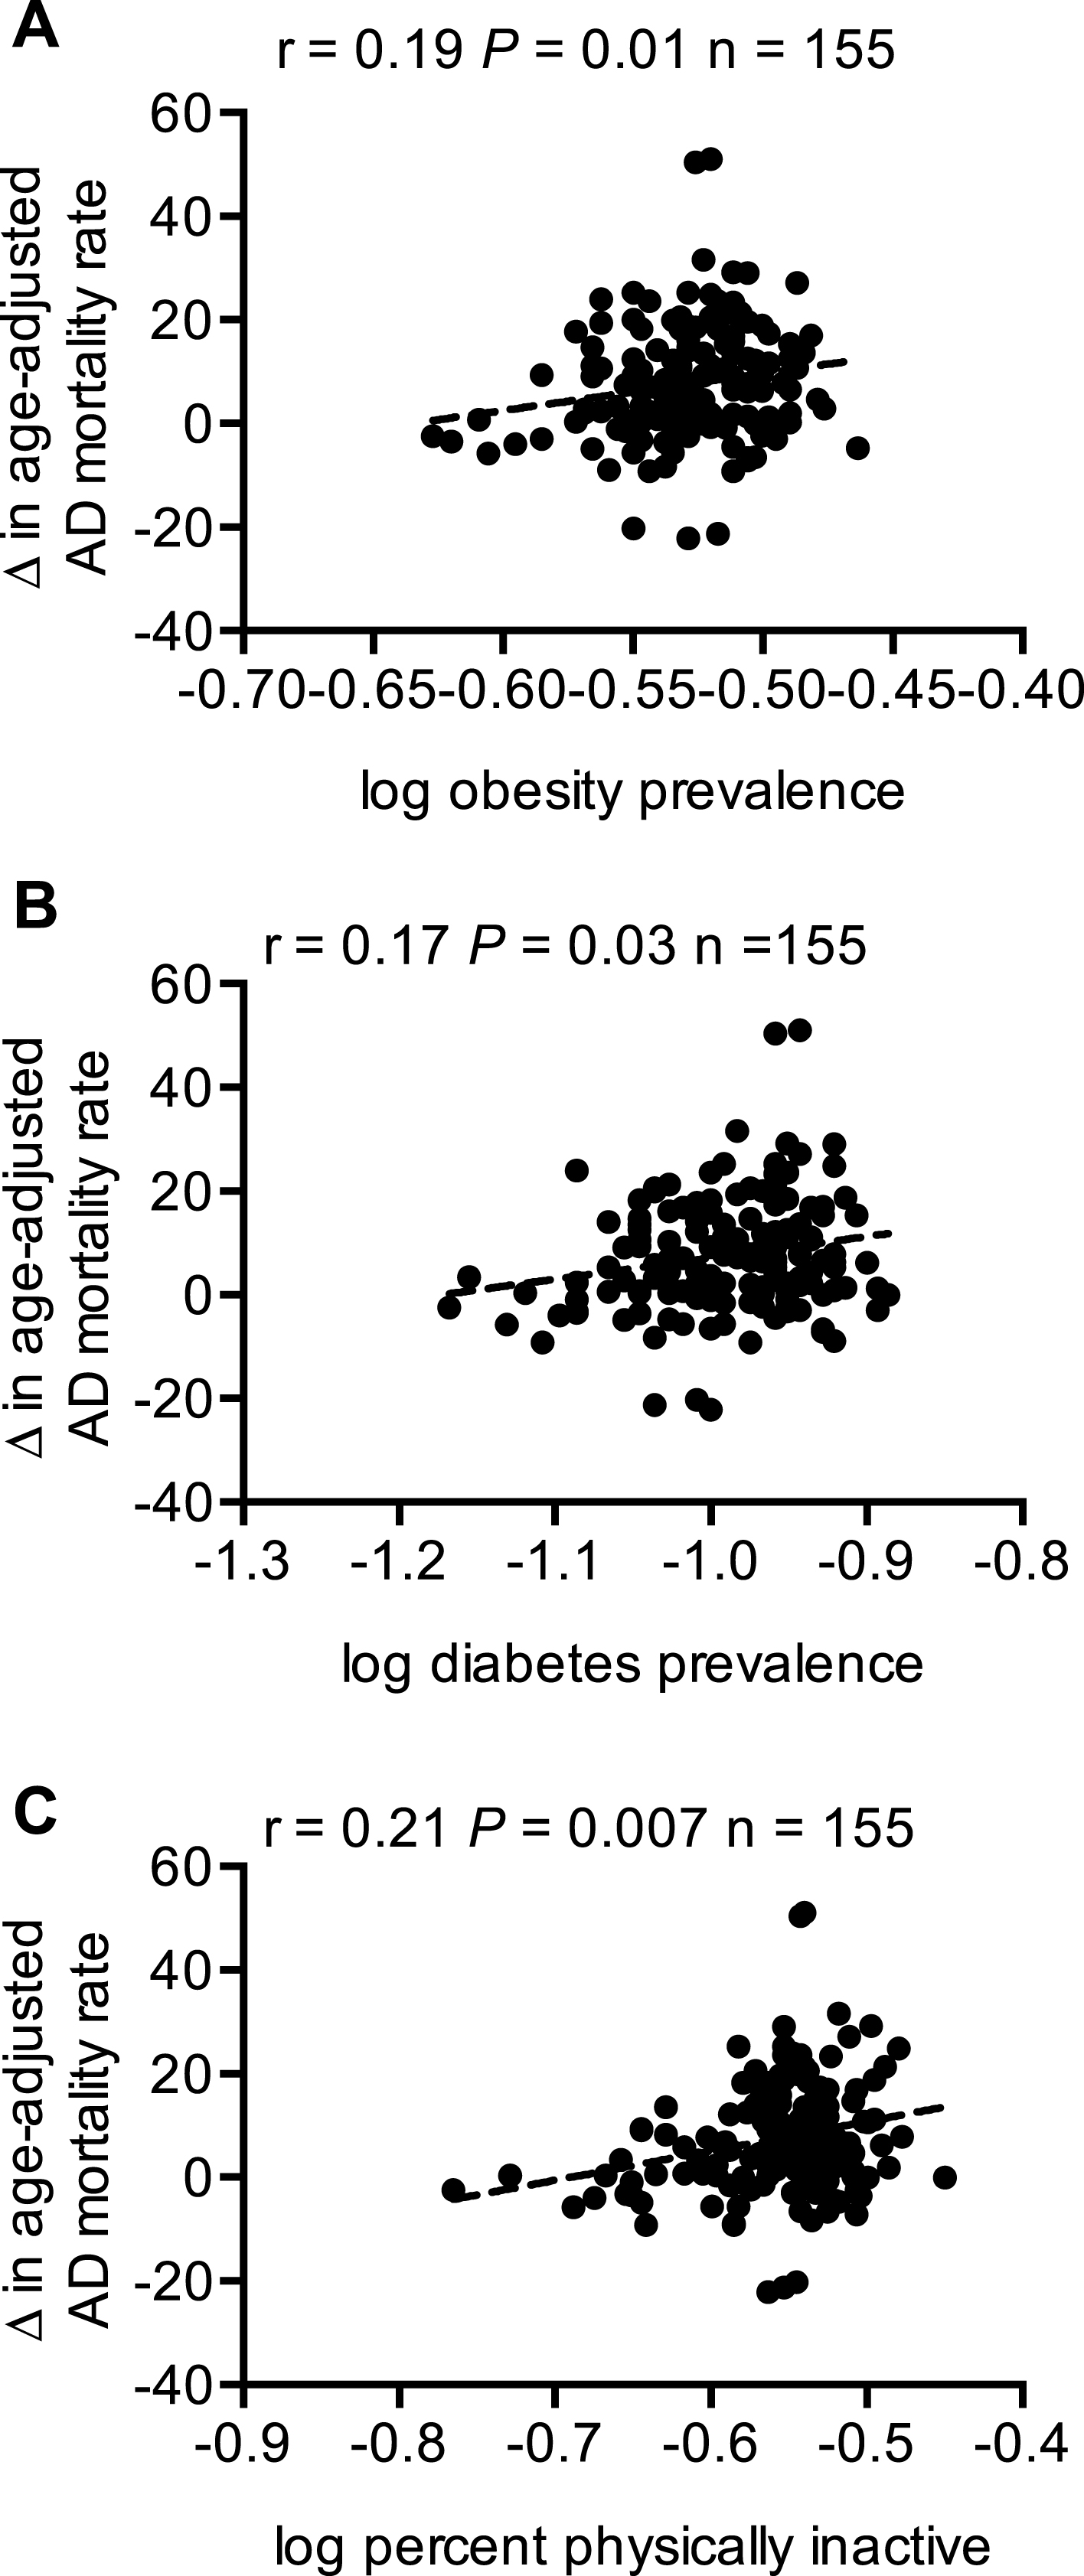
Changes in age-adjusted AD mortality are positively associated with the prevalence of obesity (A) and type 2 diabetes (B) and the percent of population that are physically inactive (C).
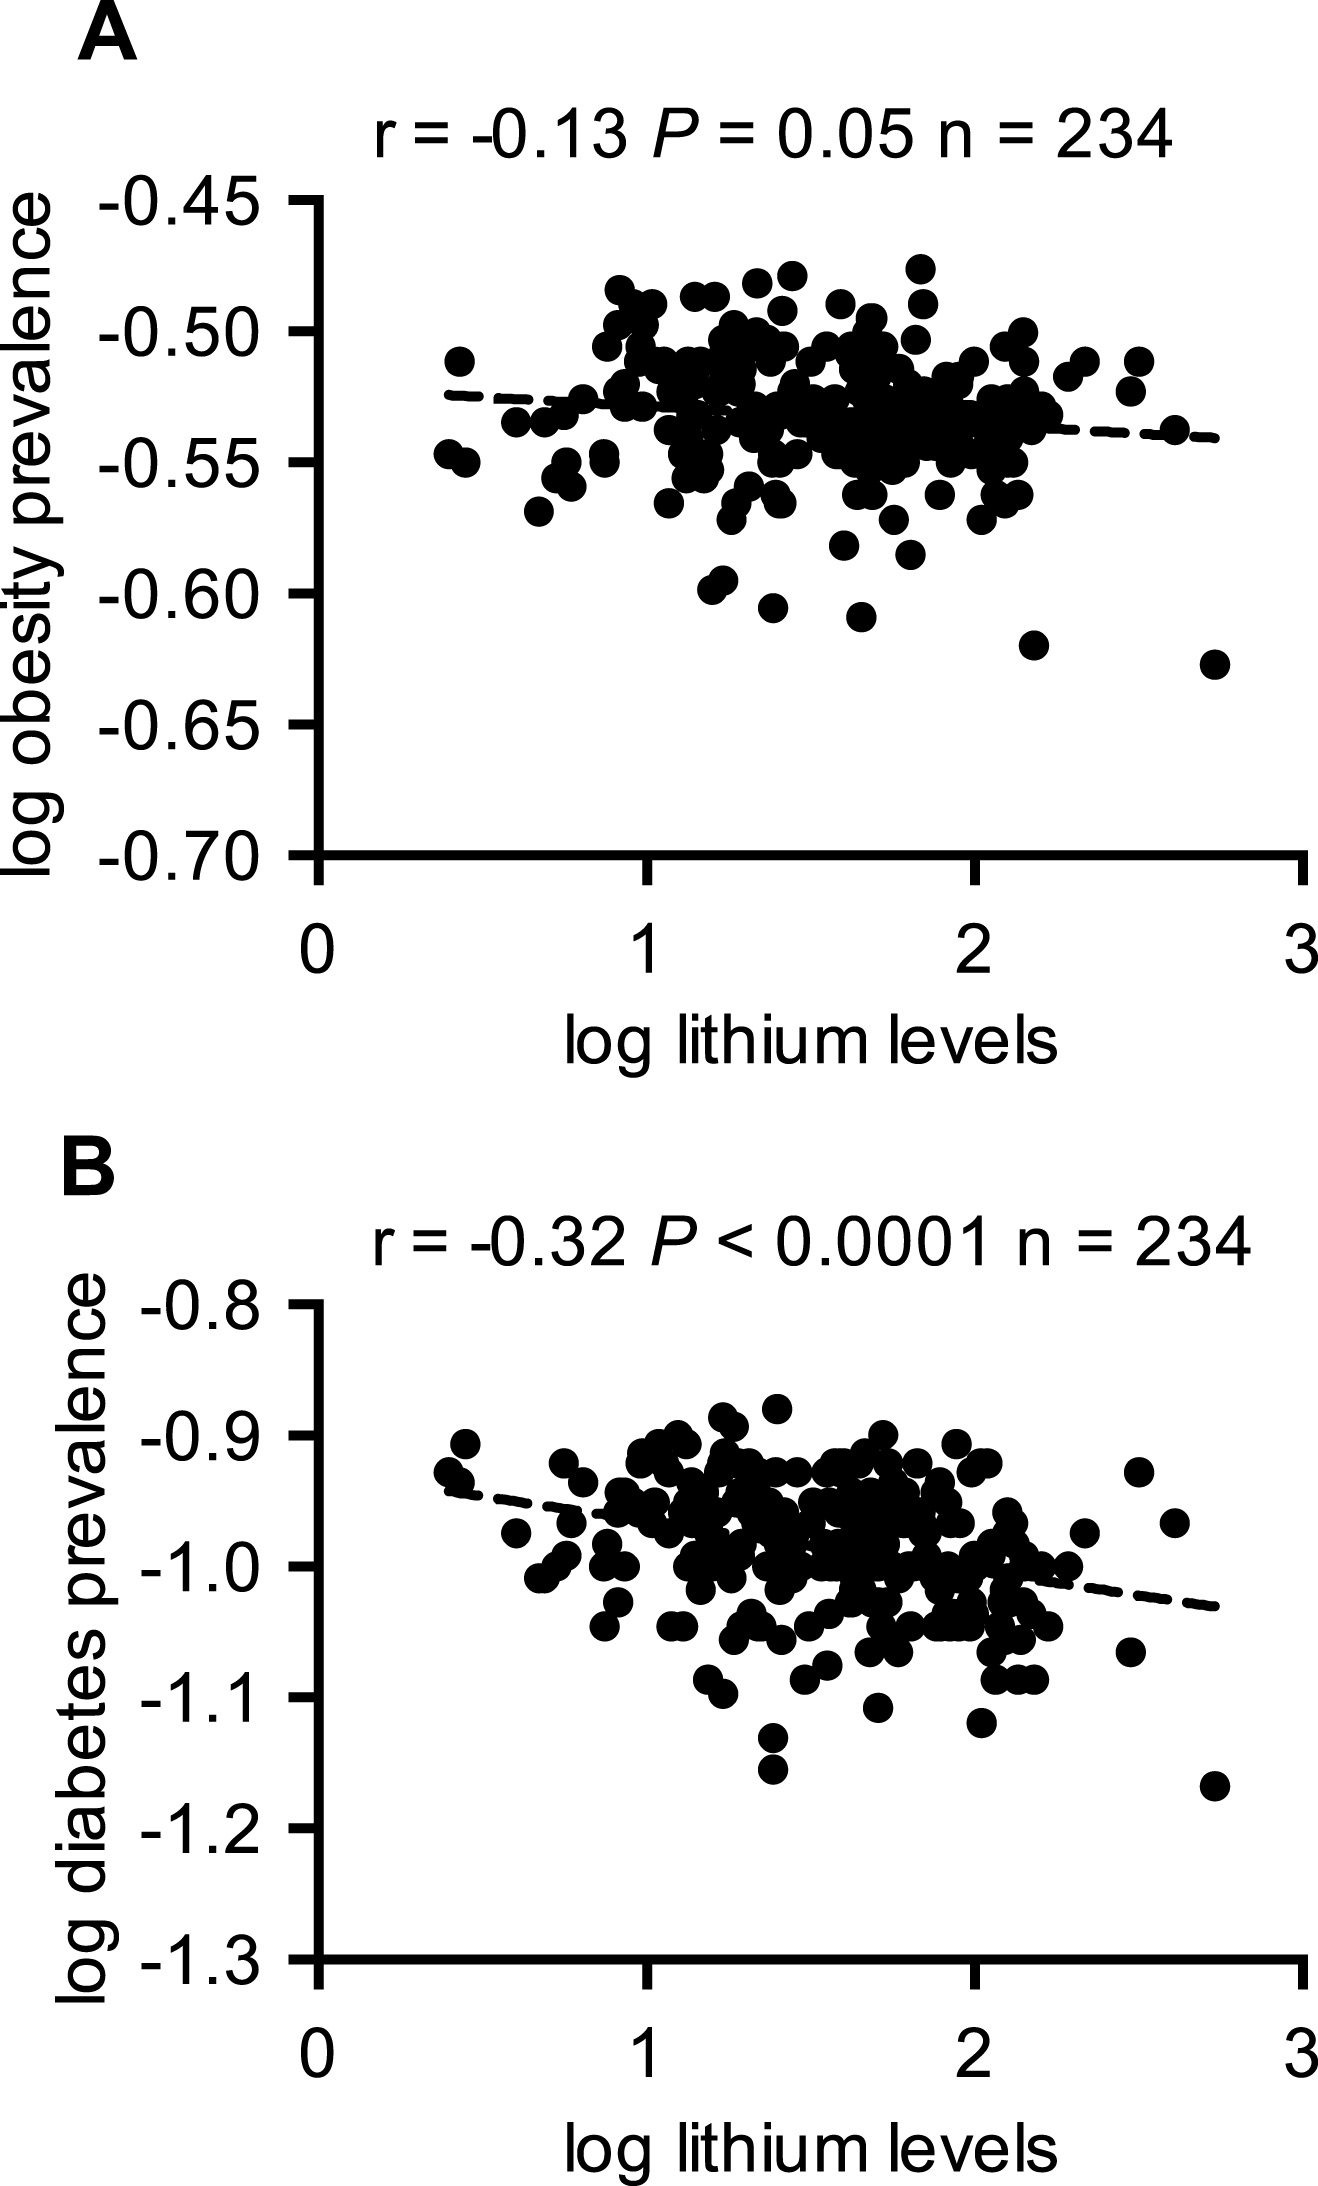
Trace lithium levels in drinking water is negatively associated with the prevalence of obesity (A) and type 2 diabetes (B).
Trace lithium concentrations in counties with less than 20 AD deaths are greater than those with more than 20 AD deaths
Finally, we tested whether lithium concentrations would differ between counties that were flagged as unreliable or had less than 20 deaths due to AD versus those counties that had reliable AD mortality data or more than 20 deaths due to AD. Our results show that counties with less than 20 deaths due to AD in both time periods examined had an average lithium concentration of 0.068±0.007 mg/L in their water, whereas those with more than 20 deaths due to AD in both time periods had an average lithium concentration of 0.050±0.0005 mg/L. As these data were non-normally distributed we performed a non-parametric Mann-Whitney test, which revealed a significant difference between the ranks of lithium concentration in counties with less than 20 deaths compared with those counties with greater than 20 deaths (Fig. 4).
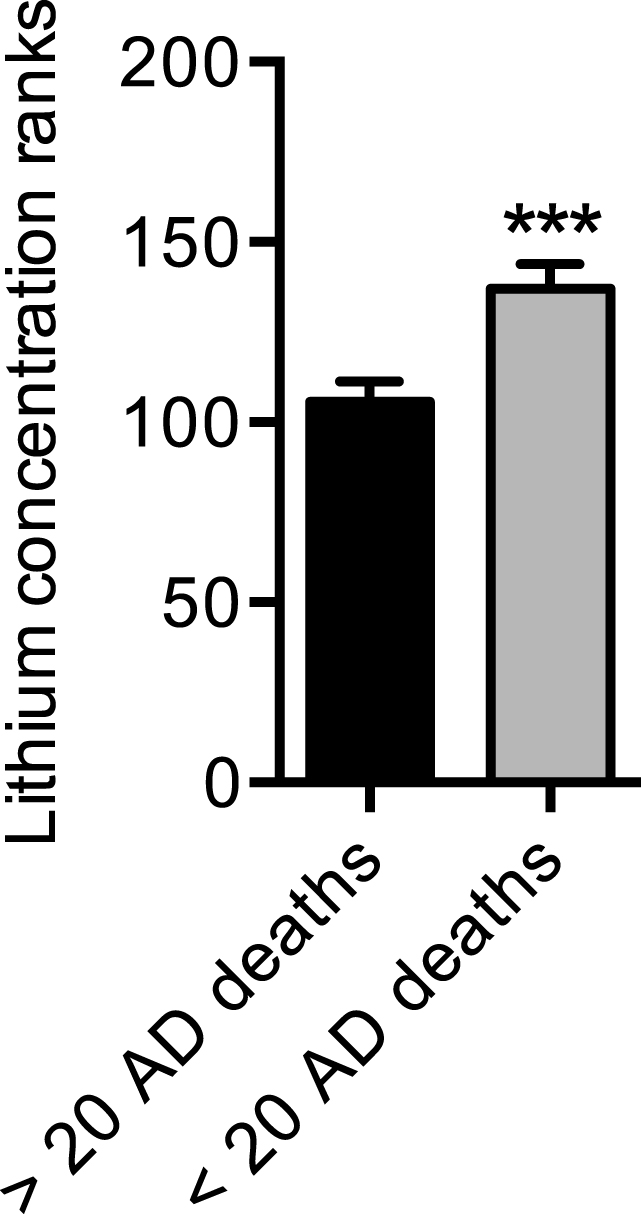
Trace lithium levels are higher in counties with less than 20 AD deaths compared with counties with more than 20 AD deaths. Counties with less than 20 AD deaths across both time periods were flagged as unreliable in the CDC Wonder Database; counties with more than 20 AD deaths across both time periods were flagged as reliable in the CDC Wonder Database. ***p≤0.001 using a non-parametric Mann-Whitney test to compare ranks. Values are means±standard error.
DISCUSSION
In the present study, we sought to determine whether natural variations in trace lithium levels in the Texas public water supply would be negatively associated with changes in AD mortality obtained between the periods of 2000–2006 and 2009–2015. Our results show that on average, Texas counties exhibited a 27% increase in age-adjusted AD mortality over time. Consistent with our hypothesis, trace lithium levels in water were found to be negatively associated with changes in AD mortality, and counties with less than the median level of 0.04 mg/L of lithium in their water experienced significantly greater increases in age-adjusted AD mortality when compared with counties above the median level.
Lithium is a well-established and highly effective treatment for patients with bipolar disorder and has recently been examined for its protective effects on neurodegenerative diseases [37–39]. Long-term pharmaceutical use of lithium has been associated with a lower risk of dementia in several observational studies for bipolar patients [25, 38, 40]. One double-blind randomized controlled trial reported improved cognitive abilities of elderly people with mild cognitive function after 1 year of low dose lithium treatment. Specifically, participants were given daily doses of 150 mg, 300 mg, 450 mg, or 600 mg of lithium carbonate to reach a target serum lithium concentration of 0.25–0.50 mM [39], which is on the low end of the typical therapeutic dose of 0.50–1.5 mM [41]. As many adverse events have been linked to high dose lithium therapy [12–14], it is important that researchers and clinicians find the safest and most effective dose.
In a recent cross-sectional study using data from NHANES 2005–2010, it was found that the average American adult (>20 years) consumes 1.1 L of water as a beverage per day, with 56% (0.644 L) consumed from tap water and the other 44% (0.502 L) consumed from bottled water [42]. Based on the average amount of tap water consumed, we estimate that Texas residents may be consuming 0.002 to 0.347 mg of lithium from tap water per day. Furthermore, given that counties above the median lithium concentration of 0.04 mg/L experienced significantly less increases in AD mortality over time, we estimate that individuals residing in these counties consume at least 0.03 mg of lithium per day from tap water. Indeed, the estimated median (0.03 mg) and maximum (0.347 mg) levels of lithium consumed from tap water are hundreds to thousands below the doses used to treat bipolar disorder (900–1200 mg/day), and therefore should be considered safe. Interestingly, a recent study found that treating AD patients with a similar microdose of 0.3 mg per day prevented cognitive loss with significant differences observed only three months after the start of treatment [26]. Thus, our results demonstrating a negative association between trace lithium and changes in AD mortality extend and reinforce the therapeutic potential of microdose lithium for AD/dementia.
At the cellular level, lithium can protect against AD by reducing apoptosis, inflammation, oxidative stress, and activating neurotrophic and neuroprotective cellular cascades [10, 11]. In addition, lithium is a natural inhibitor of glycogen synthase kinase 3 (GSK3), which has been largely implicated in AD pathology for several reasons [43]. First, GSK3 can phosphorylate tau leading to the formation of neurofibrillary tangles [10]. Second, in vitro studies have shown that GSK3 can phosphorylate amyloid-β protein precursor (AβPP) at threonine 688 [44, 45]. Phosphorylation of AβPP at this domain enhances proteolysis by β-secretase (BACE1) [46], which represents the rate-limiting step in amyloid-β production [47]. Third and in this respect, GSK3 can also increase expression of BACE1. Correspondingly, inhibition of GSK3 in vivo has been shown to improve cognitive function in AβPP transgenic mice via reductions in AβPP phosphorylation and amyloid-β production [46]. Moreover, lithium treatment in an adult Drosophila model of AD resulted in lowered amyloid-β protein synthesis and was suggested to be perhaps partly due to its inhibition of GSK3 [24]. Fourth, lithium is an effective chelator of aluminum [48], and aluminum toxicity has been implicated in AD with high aluminum concentrations in drinking water being linked to the incidence of AD [49]. Finally, GSK3 is a well-known inhibitor of insulin signaling, and insulin resistance and AD are so tightly associated that researchers are beginning to recognize AD as type 3 diabetes [50]. Indeed, we found that changes in AD mortality were positively associated with the prevalence of type 2 diabetes, as well as obesity and physical inactivity. This is not surprising since obesity and physical inactivity have established roles in the development of insulin resistance and type 2 diabetes [51, 52]. While type 2 diabetes, obesity, and physical inactivity were the only risk factors that affected the negative association between trace lithium and changes in AD mortality, it should be noted that the relationship was still trending towards significance (p < 0.10).
Upon further examination, our results also revealed that trace lithium in water was negatively associated with the prevalence of obesity and type 2 diabetes. Along with its effects on mental health and cognitive function, studies in cellular and rodent models have revealed lithium’s insulin mimetic effects with improved insulin signaling and glucose homeostasis in insulin-sensitive tissues such as liver [53], skeletal muscle [54], and adipose tissue [55, 56]. In addition, GSK3 negatively regulates insulin secretion in the pancreas [57], and therefore, lithium may also act to improve glucose homeostasis by improving pancreatic β-cell function. With respect to obesity, mice overexpressing GSK3 present with larger body weights and greater adiposity [58], and low dose (0.25–0.3 mg per day based on a 25–30 g mouse) lithium supplementation in mice offsets the obesogenic and atherosclerotic effects of a high fat diet [59]. In all, our findings of a negative association between trace lithium and the prevalence of obesity and diabetes is supported by several years of research, and is important since they are risk factors for AD [33–35].
A mounting number of studies have focused on the relationship between obesity, diabetes, and AD. While our understanding of the underlying mechanisms linking the disorders is in its infancy two mechanisms appear to play sizeable roles: 1) the induction of inflammatory cytokines; and 2) the onset of insulin resistance (for review see reference [60]). Obesity is considered to be an environment of chronic low-grade inflammation, and insulin resistance is commonly found in patients with obesity, resulting in diabetes and hyperinsulinemia [61]. Together these factors can contribute to neuroinflammation and central insulin resistance, thus accelerating the cognitive decline observed in AD [62–64]. Furthermore, the impairments in insulin signaling would result in blunted protein kinase B activation, which phosphorylates and inhibits GSK3 [10, 45, 65], thereby exacerbating the AD-like pathologies described throughout this manuscript. Thus, lithium’s putative insulin mimetic and anti-obesogenic effects may also contribute to its neuroprotective effect against AD, and our lab is currently investigating this with cellular and animal models.
With the projected increase in the aging population, whereby the next 20 years will show a dramatic increase with 16.7% of the total world population being aged 65 or older by 2050, AD will have a growing economic impact with annual costs already exceeding $100 billion in the U.S. [66]. Thus, the need for innovative treatments to prevent, delay onset, or alleviate symptoms of AD are at the forefront of public health concerns. Although more epidemiological and large-scale intervention clinical trials are required to further demonstrate the therapeutic effect of microdose lithium therapy for AD prevention and alleviation, supplementing tap water with low levels of lithium has already been considered to improve mental health across communities [15–22, 67, 15–22, 67]. Although purely speculative, lithium supplementation may be a very cost-effective intervention against AD, mental illness, obesity, and type 2 diabetes; however, future cost-benefit analysis studies are required to substantiate this claim.
There are a few limitations to our study that must be considered. First, our study is ecological in its design, and thus we cannot make any individual associations regarding lithium and AD. Second, our study does not account for the mobility of individuals and thus, the length of exposure to lithium in tap water across the Texas counties. Third, the use of deaths due to AD may not be the best indicators of prevalence as they may suffer from under recognition [68]. AD mortality is presumed to be in line with the incidence of AD; however, there are insufficient data on the trends of AD incidence [8]. Finally, although an increase in age-adjusted AD mortality has been consistently observed, increased reporting of AD as the cause of death is thought be a major confounder to the rising rates in AD mortality [4–8]. Nonetheless, we believe that this is less likely to confound the negative association between trace lithium levels and changes in AD mortality given the abundance of evidence found within the published literature revealing lithium’s neuroprotective effects.
While our study was under review, another study was published that demonstrated a negative association between lithium in water and the incidence of dementia across several municipalities in Denmark [69]. Although Kessing et al. [69] reported a similar negative association between trace lithium in drinking water and the incidence of AD; the authors noted that the validity of the dementia subtypes was lower. Furthermore, the range of lithium levels in Danish groundwater reported by Kessing et al. (0.002 to 0.03 mg/L) are lower and narrower than what is reported here across the Texas counties. Thus, our findings with trace lithium in water and changes in AD mortality compliment and extend the recently reported findings with trace lithium and the incidence of AD [69] while emphasizing lithium’s anti-obesogenic and insulin mimetic effects. Together, our study in Texas and the study by Kessing et al. in Denmark [69] enhances the generalizability of the neuroprotective effects of trace lithium in water against AD.
In our study, we used a 7-year aggregation to obtain AD mortality rates across the Texas counties over time, which we consider to be a strength. Doing so increased the number of counties with reliable mortality data for both time periods examined. In comparison, 5 and 6-year aggregation models displayed a 32% and 34% increase in AD mortality over time; however, there were less counties with reliable AD mortality data (n = 132 and 143, respectively; Supplementary Table 1). Conversely, an 8-year aggregation model only displayed a 24% increase in AD mortality over time; however, there were more counties with reliable AD mortality data (n = 163; Supplementary Table 1). Thus, we chose a 7-year aggregation model not only to increase the number of counties with reliable mortality data, but also to maintain the magnitude with which AD mortality increases over time. In any case, we observed similar negative associations between log lithium and changes in AD mortality in the 5-, 6-, and 8-year models (Supplementary Figure 1). Although the 5- and 6-year models were only trending towards significance, this was likely due to the lower number of pairs used in the correlational analyses.
Furthermore and since the CDC Wonder Database flags mortality rates as unreliable if they were based on fewer than 20 AD deaths, we then questioned whether lithium concentrations in these counties with ‘unreliable’ AD mortality rates or less than 20 deaths due to AD would be higher than those counties with ‘reliable’ AD mortality rates or those with greater than 20 deaths due to AD. Our results show that counties with less than 20 AD deaths in the time periods examined, had significantly higher lithium concentrations when compared with counties that had greater than 20 AD deaths. These findings correspond well with our correlational analyses and the notion that trace lithium may protect against AD.
In conclusion, our study reports for the first time that trace levels of lithium in tap water is negatively linked with changes in AD mortality despite controlling for many risk factors including gender, race, education, rural living, and air pollution. However, statistical significance was lost after controlling for obesity, type 2 diabetes, and physical inactivity. Although the prevalence of obesity and diabetes were positively associated with changes in AD mortality, we also found that trace lithium levels were negatively associated with the prevalence of obesity and type 2 diabetes. In all, our findings present evidence suggestive of a novel and innovative community-based intervention strategy for slowing/preventing AD, obesity, and type 2 diabetes, thereby warranting future investigation.