
Abstract
We perform a large-scale meta-analysis of 51 peer-reviewed 3xTg-AD mouse publications to compare Alzheimer’s disease (AD) quantitative clinical outcome measures, including amyloid-β (Aβ), total tau, and phosphorylated tau (pTau), with cognitive performance in Morris water maze (MWM) and Novel Object Recognition (NOR). “High” levels of Aβ (Aβ40, Aβ42) showed significant but weak trends with cognitive decline (MWM: slope = 0.336, R2 = 0.149, n = 259, p < 0.001; NOR: slope = 0.156, R2 = 0.064, n = 116, p < 0.05); only soluble Aβ or directly measured Aβ meaningfully contribute. Tau expression in 3xTg-AD mice was within 10–20% of wild type and not associated with cognitive decline. In contrast, increased pTau is directly and significantly correlated with cognitive decline in MWM (slope = 0.408, R2 = 0.275, n = 371, p < < 0.01) and NOR (slope = 0.319, R2 = 0.176, n = 113, p < 0.05). While a variety of pTau epitopes (AT8, AT270, AT180, PHF-1) were examined, AT8 correlated most strongly with cognition (slope = 0.586, R2 = 0.521, n = 185, p < < 0.001). Multiple linear regression confirmed pTau is a stronger predictor of MWM performance than Aβ. Despite pTau’s lower physical concentration than Aβ, pTau levels more directly and quantitatively correlate with 3xTg-AD cognitive decline. pTau’s contribution to neurofibrillary tangles well after Aβ levels plateau makes pTau a viable treatment target even in late-stage clinical AD. Principal component analysis, which included hyperphosphorylation induced by kinases (pGSK3β, GSK3β, CDK5), identified phosphorylated ser9 GSK3β as the primary contributor to MWM variance. In summary, meta-analysis of cognitive decline in preclinical AD finds tauopathy more impactful than Aβ. Nonetheless, complex AD interactions dictate successful therapeutics harness synergy between Aβ and pTau, possibly through the GSK3 pathway.
INTRODUCTION
The hallmarks of Alzheimer’s disease (AD) pathology are marked by accumulation of extracellular amyloid-β (Aβ) plaques in the brain followed by intracellular neurofibrillary tangle (NFT) growth [1, 2]. Aβ upregulates the generation of NFTs by increasing glycogen synthase kinase-3 (GSK-3) activity, leading to the phosphorylation of tau [3, 4]. Phosphorylated tau (pTau) begins to self-assemble to form NFTs. Aβ plaques, soluble Aβ oligomers, and NFTs interfere with normal neuronal cell function by disrupting synaptic signaling at neural junctions. Each protein’s accumulation leads to neuron damage, eliciting diminished brain mass and cognitive function [5]. pTau is linked to retarding Aβ growth establishing a negative feedback loop where increases in pTau slows rate of Aβ accumulation [3]. As the disease progresses in late stages, pTau continues to form NFTs while Aβ plaque accumulation plateaus. Soluble Aβ oligomers, rather than Aβ plaques or soluble Aβ monomers, have emerged and continue to attract attention as the main toxic form of Aβ [6–8]. These oligomers may continue to accumulate as Aβ plaques plateau, and they may create a crucial link in explaining the connection between Aβ and pTau.
The removal of Aβ plaques does not influence elimination of NFTs after NFTs have been established in the brain, but early intervention can prevent pTau development [9, 10]. Therefore, targeted late stage treatments may specifically eliminate Aβ without impacting pTau levels that have already accumulated, which enables NFTs to continue amplifying cognitive deficits. Comparison of differences in pTau and Aβ levels in treated mice illuminate differences between the proteins’ impact on cognitive function. For example, pTau levels were reduced by chemical treatment as Aβ levels continued to increase, yet cognitive function improved [11]. This result implies that there is a quantitative difference between how the two proteins effect cognitive deterioration, and moreover, that decreasing pTau may ultimately be more important than reducing Aβ in the quest to successfully treat AD.
The Amyloid Cascade Hypothesis states that Aβ is the center piece in AD pathology leading to hyperphosphorylation of tau and numerous neurotoxic pathways causing cell death [12]. Since its inception, Aβ has been the main focus of AD research, but there have been no definitive AD treatments or cures found to date [12]. The only FDA approved treatments are cholinesterase inhibitors, which increase acetylcholine levels to simply suppress the cognitive symptoms of AD, and memantine, which regulates glutamate to elicit neuroprotective effects but only mild cognitive improvement [13]. These drug treatments simply mitigate the cognitive symptoms of AD without slowing disease progression, and treatments targeting Aβ and Aβ precursors have failed to pass clinical trials to improve patient outcomes [13, 14]. The presence of Aβ is associated with a decrease in cognitive performance; however, the quantitative level of Aβ inconsistently predicts the amount of cognitive decline [15]. Instead, it is suggested that other contributors, such as the hyperphosphorylation of tau, are the functional cause of degeneration after the initial onset of AD [5].
The present study compares the effects of Aβ and pTau levels on cognitive performance in the Morris water maze (MWM) and Novel Object Recognition (NOR) through a large-scale meta-analysis of 3xTg-AD mouse model experiments. The triple-transgenic mouse model (3xTg-AD) of AD expresses tangle and plaque pathology as well as synaptic dysfunction [16]. The 3xTg-AD mouse model pathology resembles human patients, and it has similar total tau levels in the cerebrospinal fluid unlike other tau pathology models (P301L and Tg4510) [17, 18]. Aβ deposits first appear by 6 months of age while the first definitive detection of pTau occurs around 12 months of age; therefore, cognitive deficits due to tau pathology are expected to begin between 8 and 12 months of age [16, 19]. The MWM reliably reflects how degradation of the hippocampus, striatum, basal forebrain, cerebellum, and neocortical areas affect cognitive function [20]. Meta-analysis was focused on correlations between cognitive ability measured by MWM or NOR and Aβ or pTau levels. The primary goal was to determine which clinical outcome measures most directly correlate with statistically significant cognitive decline in 3xTg-AD mice. Specific analyses were conducted to analyze the different Aβ forms and pTau epitopes. We also consider the interactions between pTau and Aβ to identify promising research targets for understanding the intertwining pathology of AD.
Methods
Systematic review process
We perform a systematic review, which quantitatively analyzes studies in a consistent manner to provide an over-arching view of a field’s aggregated work. First, a series of database searches identified peer-reviewed publications that are likely to meet the study’s criteria. These publications are then examined individually to determine whether they meet the inclusion criteria (see below). All quantifiable experimental data from figures and tables are extracted into an organized database in a process overseen by stringent quality control teams, resulting in transcription accuracy greater than 98.8% [21]. Comparable data are compiled to assess overall trends.
Inclusion criteria
Key term searches in PubMed were used to identify publications likely to meet the inclusion criteria. Search terms included “Alzheimer’s Disease”, “3xTg-AD”, “amyloid-β”, “tau”, “phosphorylated tau”, and “glycogen synthase kinase-3” as well as numerous synonymous combinations, variations, and abbreviations of these terms. For inclusion, peer-reviewed scientific studies must contain quantifiable data for either pTau or Aβ levels and data for either MWM escape latency or NOR. Only papers utilizing the 3xTg-AD treated and control groups and published in English were included. Resultant searches led to the construction of a transcribed database [21] of 3,102 peer-reviewed preclinical AD articles that were assessed for inclusion. A total of 51 peer-reviewed journal articles met the required criteria for final inclusion (see Table 1).
Breakdown of data pools and corresponding included peer-reviewed data sources and mice sample sizes. The bracketed numbers in the study citations column correspond to the references
3xTg-AD mouse model
The 3xTg-AD mouse model is a complex model with transgenic amyloid-β protein precursor (AβPP), presenilin-1 (PS1M146V), and tauP301L gene replacements [18]. As in human AD pathology, both Aβ and tau formation show age- and region-dependence with Aβ plaques forming before the accumulation of NFTs [22]. 3xTg-AD mice have concentrations closer to human levels than P301L and Tg4510 transgenic AD mouse models [17]. Aβ, total tau, and pTau measurements were used from the mouse hippocampus (see Data Sources), which is the most direct morphological site of learning ability and memory. While other neuroanatomical sites are still of interest, the overwhelming preponderance of data is recorded from the hippocampus. Functional cognitive deficits appear as early as 4 months of age in the 3xTg-AD mice, a timeline that aligns with the formation of intracellular deposits of Aβ in the hippocampus [23]. Both Aβ and pTau accumulate in significant levels in the brain after 8–12 months to contribute to cognitive deficits. 3xTg-AD is one of the few models containing both Aβ and pTau pathologies in transgenic form, which allows for manipulation of protein development through treatment utilizing numerous pathways across a full lifespan. The development of AD in 3xTg-AD mice also mimics that in humans, so accumulation of pTau can be influenced upstream by Aβ; therefore, Aβ treatments early in life can be studied for impact on pTau. The complex pathology in 3xTg-AD mice enables quantitative comparisons of Aβ and NFTs, making it an ideal and unique model for full AD assessment.
Morris Water Maze
The MWM, which tests spatial memory, was used as the primary measure of cognitive performance. The MWM is the de facto industry standard for cognitive tests for mouse models and was chosen because of its prevalence in AD experimental studies. A mouse is placed into a pool of water and trained to search for a visible platform in an open, cold (13°C) bath [24, 25]. After one day of training with the platform visible above water, the mouse is again placed in the maze with the platform hidden below the water and uses visual cues outside of the bath to find the platform location. Training with the hidden platform continues four times a day for five to seven days. The time it takes for the mouse to find the platform is measured as the mouse’s escape latency [26]. Escape latency data from day five was analyzed because it most highlights differences in learning within the standard practice of five days of training. Moreover, overtraining (too many trials per day or too many days of training) can result in all mice performing at a disproportionately high level and thus, preventing discernable quantitative learning differences [27]. The first two trials on day one serve as a control between mice for swimming performance and ability; mouse groups should not significantly differ on day one escape latency [25].
Novel Object Recognition
Due to the perceived limitations of the MWM (e.g. mice are less suited to the task than rats, the stress caused by cold water may affect the results, it only tests spatial memory, etc.), NOR was used as a second measure of cognitive performance [28, 29]. NOR introduces mice to a new object and a familiar object to which the mouse had previously been exposed. Memory is then tested by the relative amount of time spent exploring the new object based on remembering the familiar object [30]. We chose recognition index (time spent exploring the novel object/ total time exploring) as the standard measurement for NOR. In cases where only percent time spent with novel object or discrimination index was provided, recognition index was calculated. NOR avoids stress on the mice and other factors such as swimming capability inherent to the MWM. However, the disadvantage of the NOR compared to the MWM is the inability to differentiate between the spatial and non-spatial conditions of the task [31].
Data sources
The 3xTg-AD mouse model was developed in the Laferla Laboratory [16] and later commercially made available by the Jackson Laboratory. As such, most studies cited their mouse source as a gift from a colony originating from the Laferla laboratory or as purchased from the Jackson Laboratory. The included studies range from the years 2007 to 2016, with the majority from 2014 to 2016. When stated, the mouse background was listed as 129/C57BL6. Supplementary Table 1 lists all included studies and their corresponding year and available source information. Nonetheless, full reference citations for the included studies, broken down by their inclusion in each sub-analysis, is listed in Table 1 of the main article. Neuroanatomical location of source data is limited to the hippocampus, which ensured sample sizes of sufficient statistical power.
Data normalization
All data was normalized against untreated control 3xTg-AD mice within the same study to achieve a consistent baseline. In a single peer-reviewed article, muscarinic M1 receptor deficient (M1R–/–) mice bred with 3xTg-AD were taken as the experimental group rather than a treatment to 3xTg-AD mice for the other articles in this study; data was still normalized to untreated control 3xTg-AD mice [32]. Aβ and pTau were rarely measured in wild type mice, so wild type mice could not serve as the primary control. A few comparisons of untreated wild type mice normalized to untreated 3xTg-AD mice are displayed in the Results figures (i.e., Figs. 1 and 4) as red targets. They provide examples of relative differences in escape latency and lower pTau and Aβ levels in a non-transgenic model compared to the consistent untreated 3xTg-AD control. pTau is usually measured in arbitrary units, so a percent control calculation expresses a normalized data value: (Day 5 Escape Latency of treated 3xTg-AD experiment group) / (Day 5 Escape Latency of untreated 3xTg-AD control group)×100%. Protein level can substitute for escape latency in the example above to attain equivalent percent control values for Aβ and pTau. There were no significant differences in variance (F-test p = 0.8453) or mean (t-test p = 0.5008) between MWM data normalized to day one compared to the non-normalized counterpart. Day 1 MWM training on a visible platform is consistent for all mice, so escape latency data was not normalized to day 1 to minimize data processing and alteration.
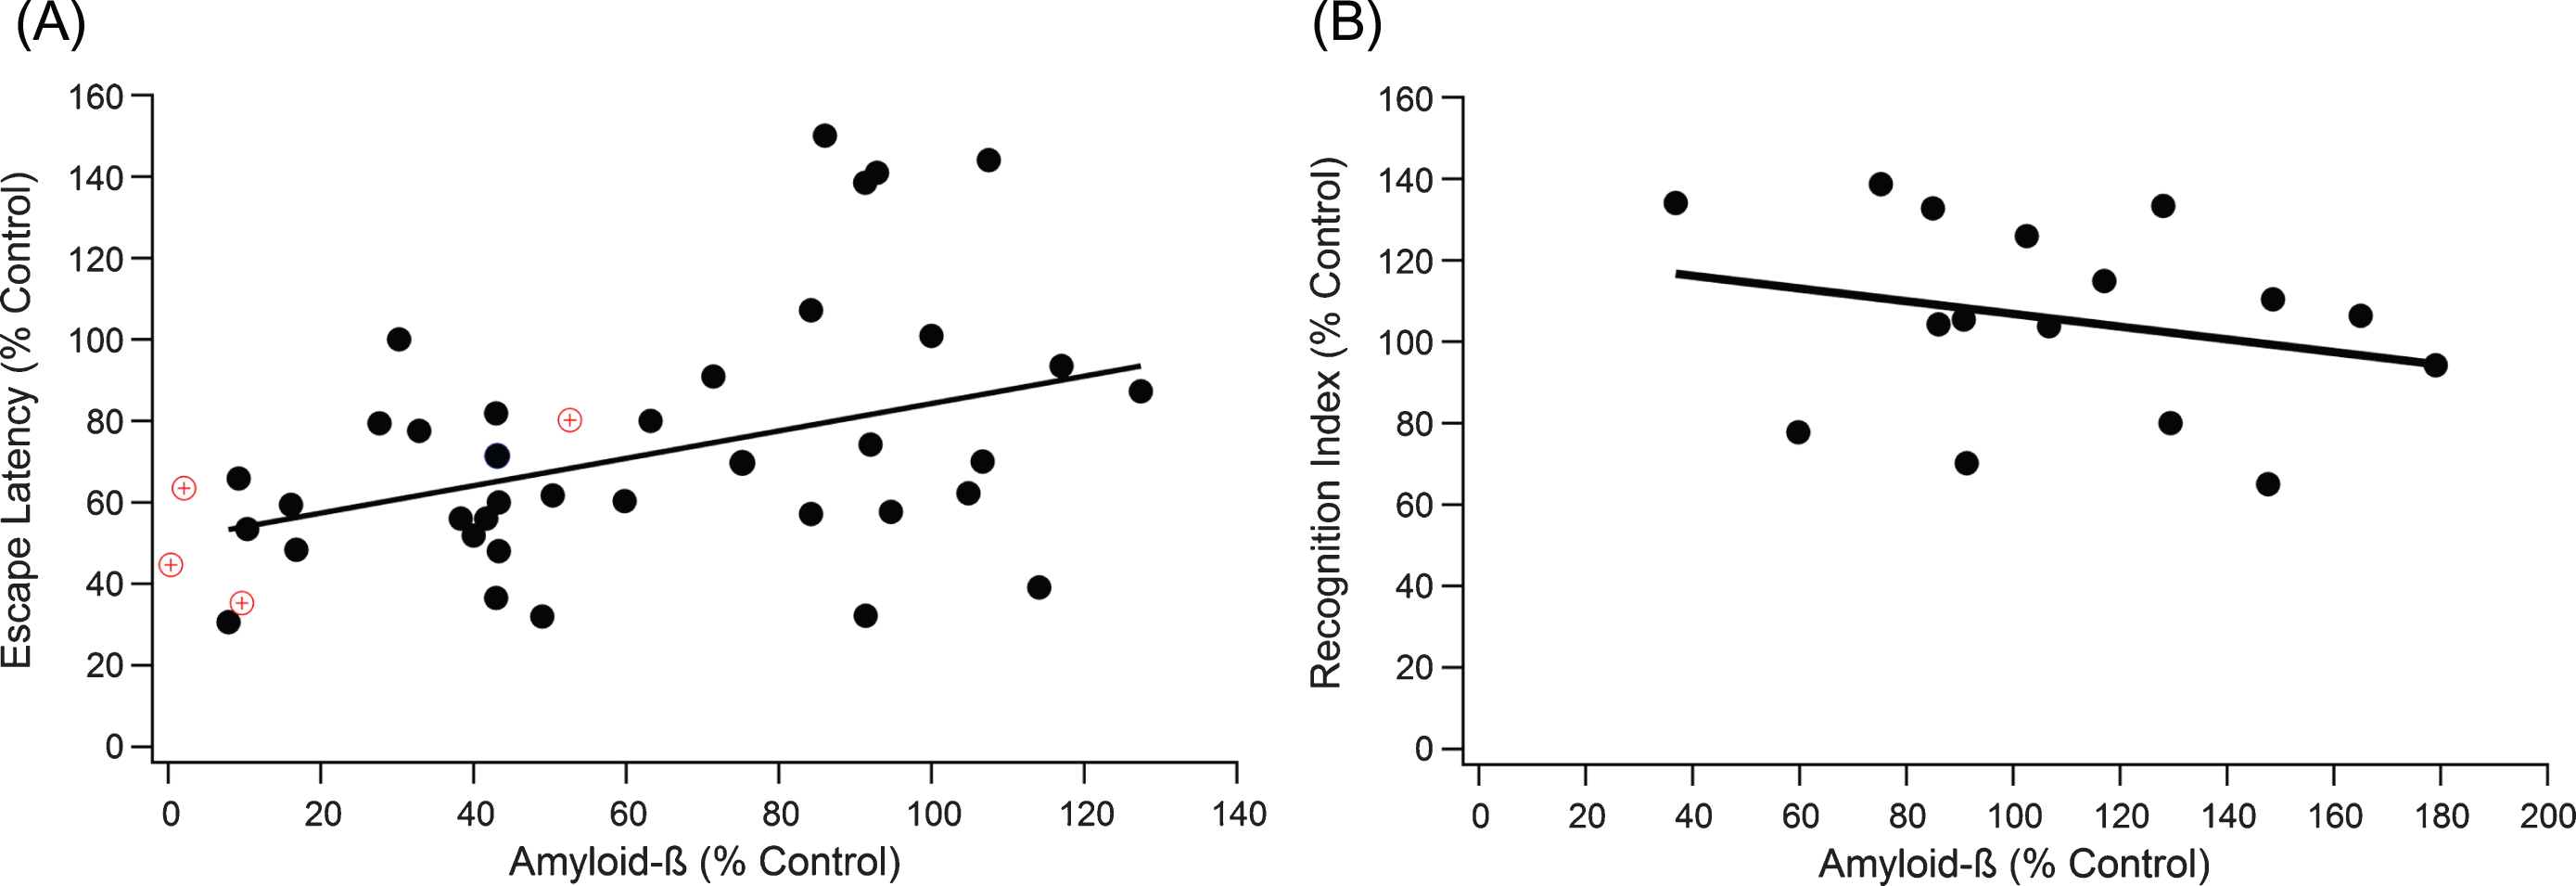
Increases in Aβ plaque level weakly correlates with decline in performance in both the MWM and the NOR test. A) A positive trend indicates that as Aβ increases, cognitive performance declines (slope = 0.336, R2 = 0.149, n = 259, p < 0.001). The red target markers provide a visual reference for untreated wild type mouse measurements in comparison to 3xTg-AD control mice. B) NOR correlation results in similar significant, weak trends, where a negative trend indicates decreased cognitive function with increased Aβ (slope = –0.156, R2 = 0.064, n = 116, p < 0.05).
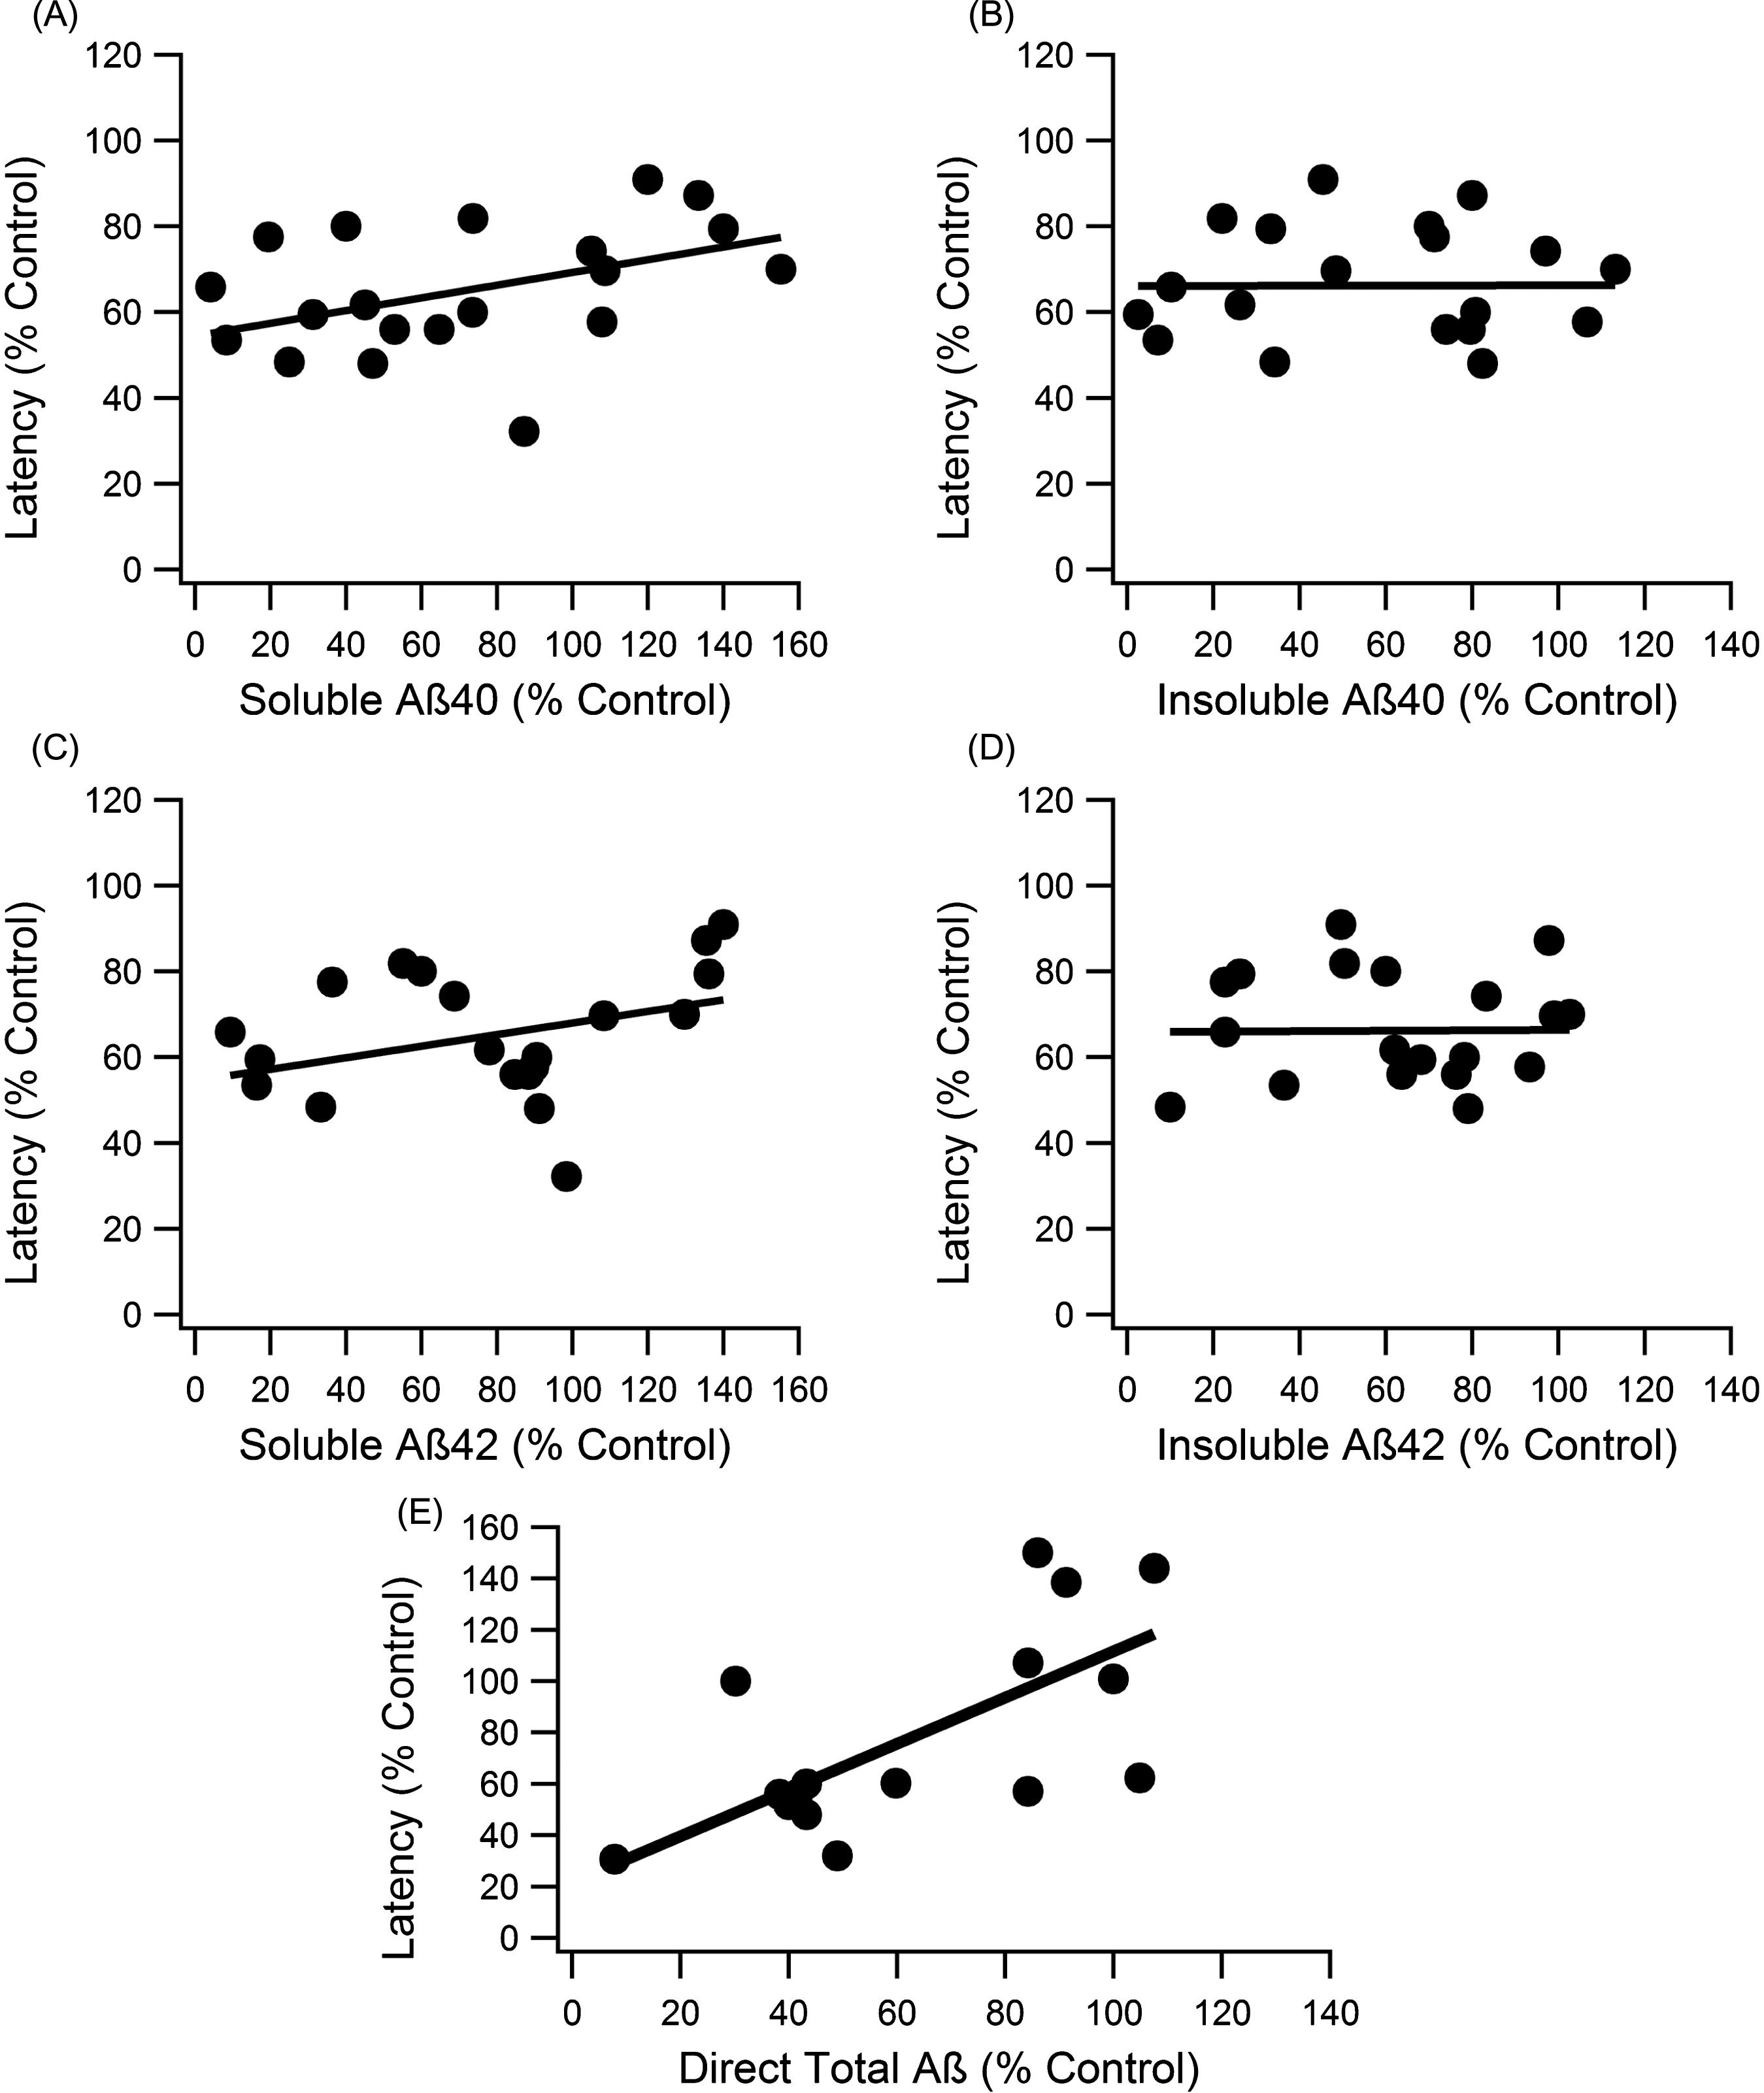
Correlation analysis of each major Aβ form to MWM escape latency. A, C) The soluble forms of Aβ showed significant correlation with escape latency performance, and the slope of the trend was similar to total Aβ (slope = 0.148, R2 = 0.247, n = 148, p < 0.001; slope = 0.135, R2 = 0.1667, n = 148, p < 0.001, for Aβ40 and Aβ42, respectively). B, D) Neither insoluble Aβ40 nor Aβ42 displayed significant trends with cognitive function (slopes < 0.005, R2 < 0.001, n = 144, p > > 0.05). E) Direct Aβ had a significant trend with cognitive function (slope = 0.901, R2 = 0.464, n = 93, p < < 0.001).
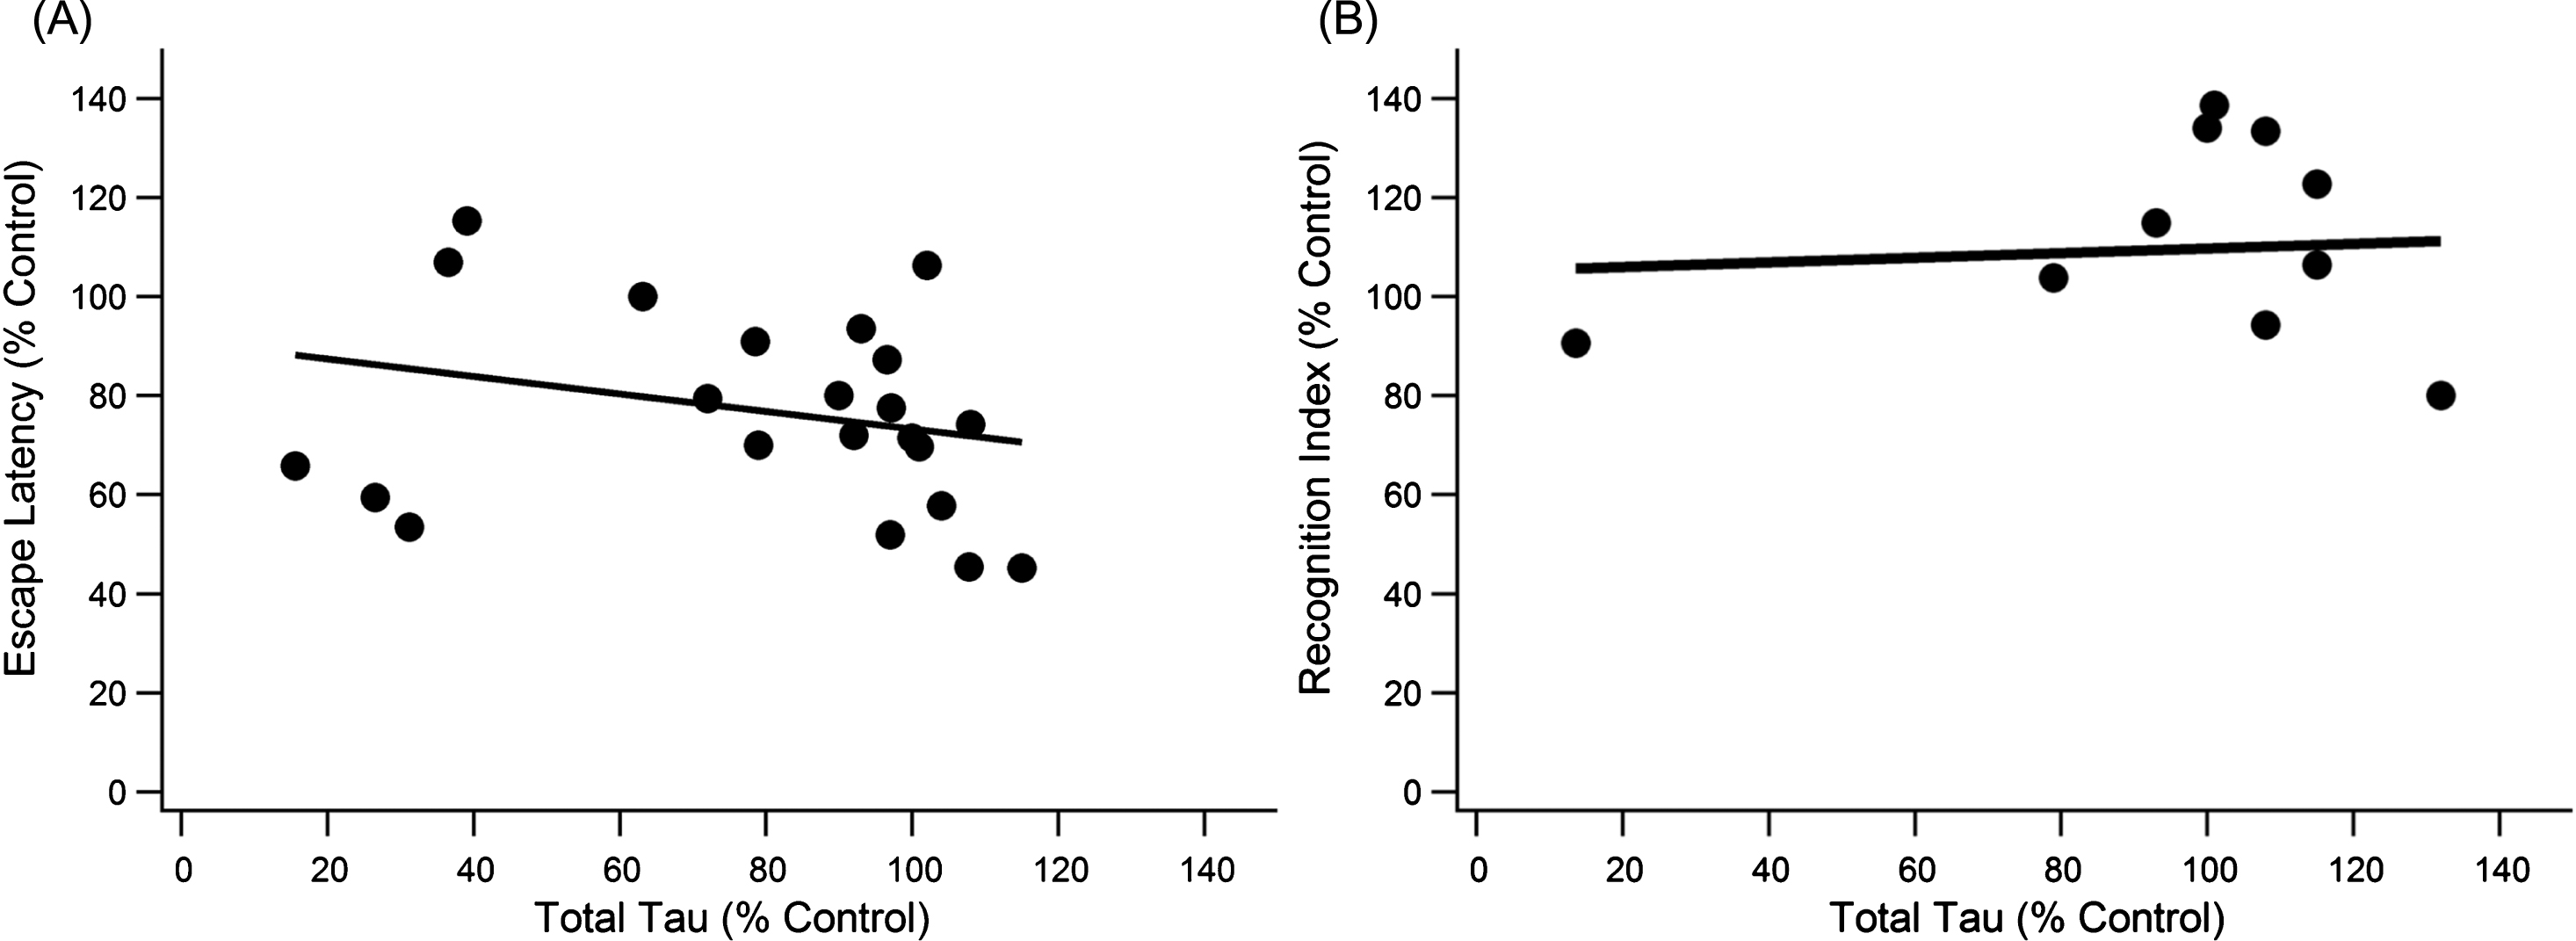
Total Tau does not significantly correlate with cognitive decline measured by the MWM or NOR. A) There was a weak, significant trend for day five escape latency with total tau levels (slope = –0.1768x, R2 = 0.071, n = 152, p < 0.001). B) Tau levels did not correlate significantly with performance in the NOR test (n = 85, p > > 0.05).
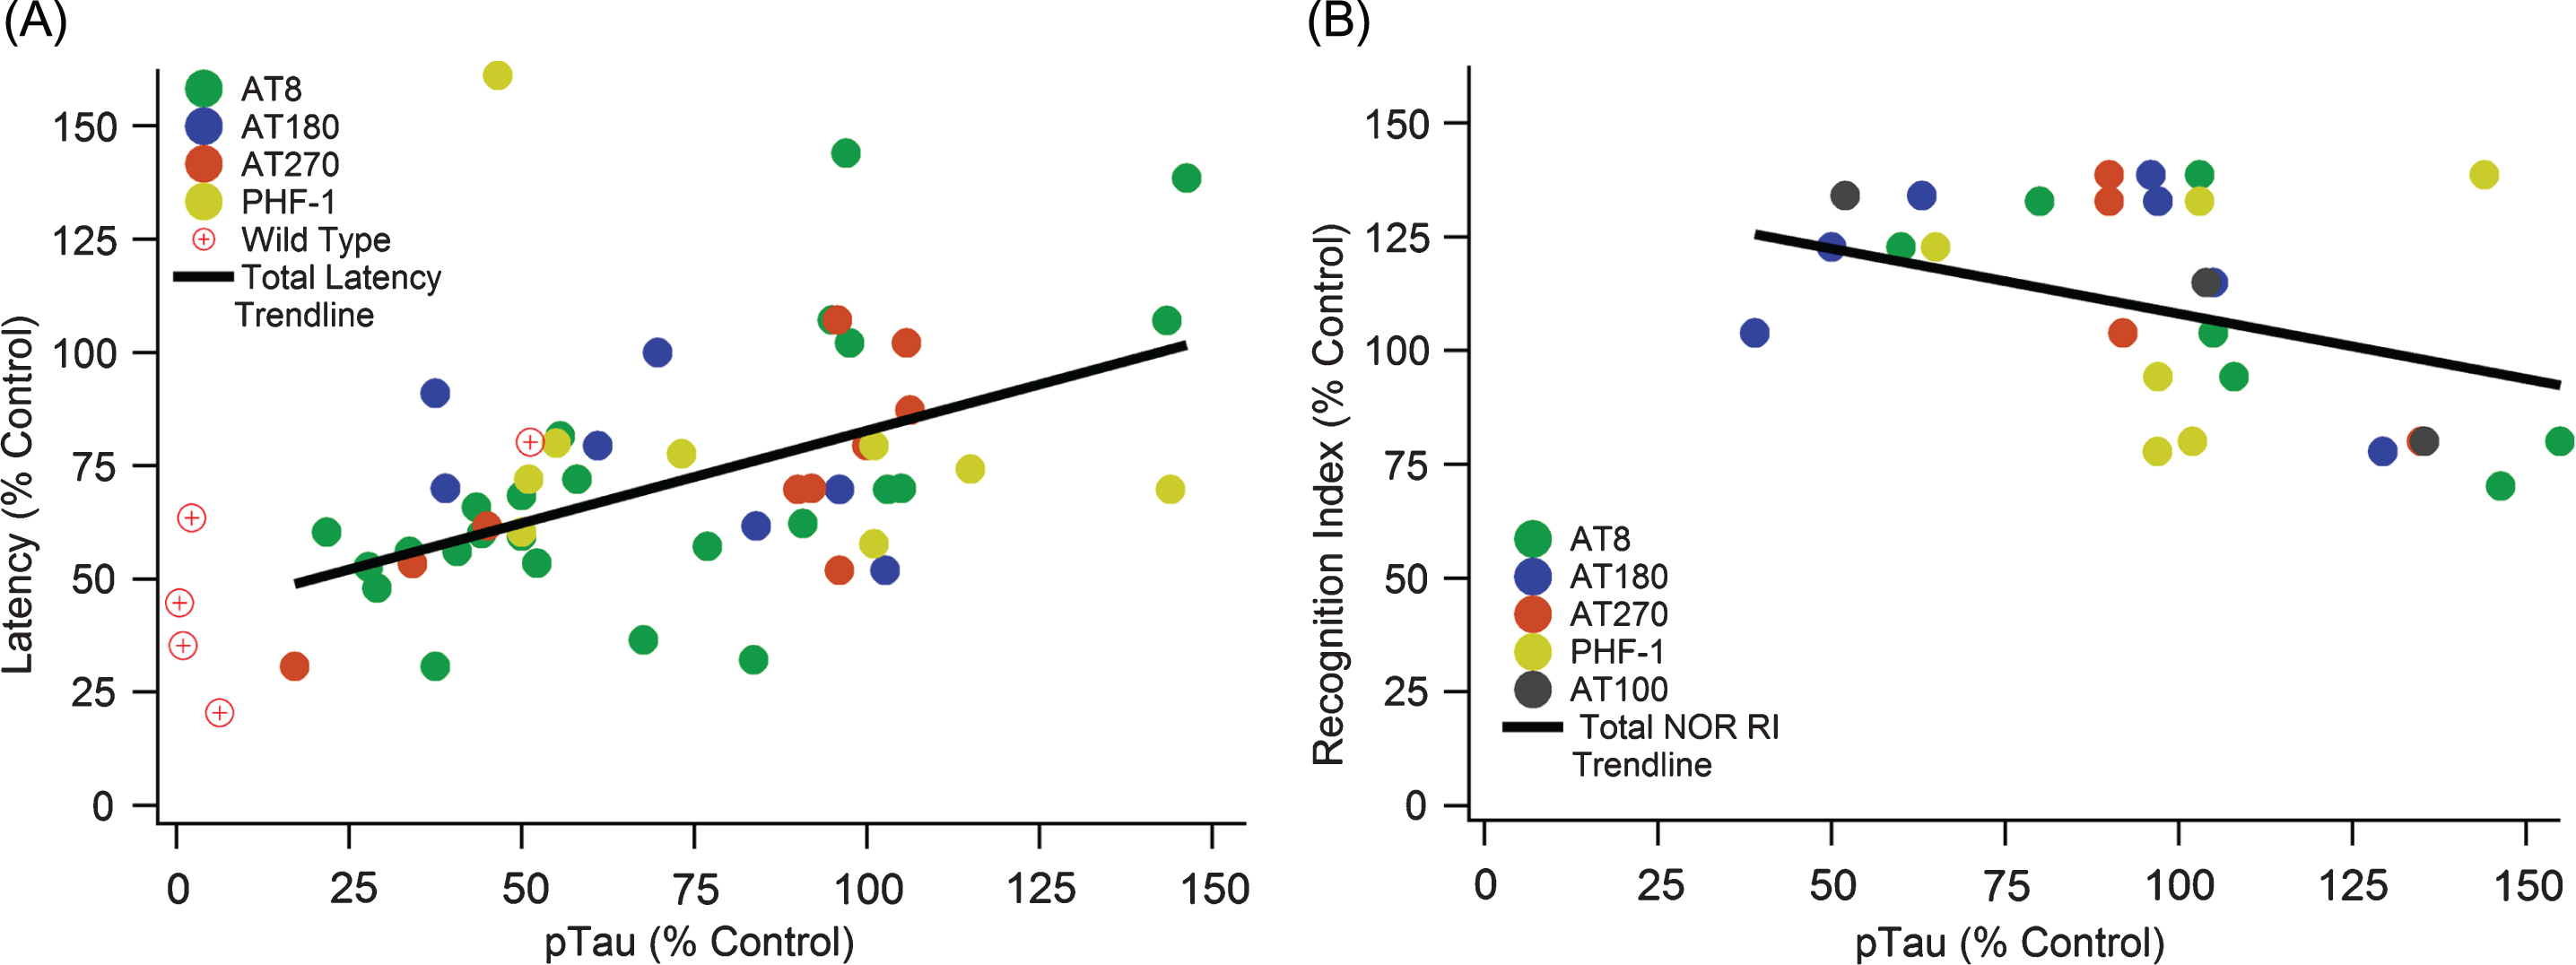
Increased pTau correlates with cognitive decline in both MWM and NOR cognitive tests. A) A significant positive slope with escape latency indicates cognitive function decreases as pTau levels increase (slope = 0.408, R2 = 0.275, n = 371, p < < 0.01). B) A significant negative slope with NOR indicates cognitive function decreases as pTau levels increase (slope = –0.3196, R2 = 0.176, n = 113, p < 0.05).
Statistical analysis
We examined the correlation of escape latency or NOR recognition index against tau, pTau, and Aβ levels by performing a Pearson coefficient correlation analysis at alpha level 0.05. After determining significance, Pearson coefficient and slope allows comparison of the strength of the correlation. The Igor analytical software (Wavemetrics, Inc.) was used to calculate the line of best fit and the corresponding R2 values. A principle component analysis (PCA) was used to evaluate variance among kinases involved in the phosphorylation of tau; results were generated utilizing the built-in PCA function in MATLAB (The MathWorks, Inc.). A multiple linear regression also directly compared pTau and Aβ in studies that analyzed both protein levels; the MATLAB stepwise function established correlation factors between cognitive performance and protein variables at α= 0.05 for significance. Clear outliers (9 data points) were eliminated by the Grubb test; graphical depiction and statistical analysis presented in the Results are without outliers.
RESULTS
This systematic review and meta-analysis compares experimentally assessed cognitive function (e.g., MWM escape latency or NOR recognition index) in 3xTg-AD mice with clinical outcome measures for Aβ, total tau, and pTau. A total of 528 mice from 51 peer-reviewed scientific papers [19, 32–82] were included in the analysis. Table 1 illustrates the included peer-reviewed study and mouse sample sizes, as well as study citation references, for each aggregated data pool. Additional details on the data sources can be found in Supplementary Table 1. Unless specified otherwise, stated “n” within the Results text and figure captions is the included mice sample size.
Cognition versus amyloid-β levels
Correlation of the relationship between total Aβ plaque levels and day five MWM escape latency was measured by meta-data analysis (Fig. 1A). Data points represent the aggregated average of a group of mice from a single experiment, where the line of best fit is weighted based on sample size for each aggregate point. Data point weighting and hippocampal protein measurements was consistent across all correlation analysis within our study. As expected from large experimental variance in data across the field [15], the Grubb outlier test identified 9 definitive aggregate data points as outliers, which were ultimately removed to insure integrity of the analysis. We plotted the experimentally treated mouse escape latency normalized to a 3xTg-AD control mouse versus the normalized total Aβ levels (Fig. 1A). Total Aβ had a statistically significant correlation to MWM escape latency, but it was a rather weak trend (slope = 0.336, R2 = 0.149, n = 259, p < 0.001). To support results in the MWM, an equivalent test and set up was run for NOR (Fig. 1B). NOR recognition index scores supported the results in MWM, revealing a statistically significant but very weak trend with cognition (slope = –0.156, R2 = 0.064, n = 116, p < 0.05).
To compare levels of each Aβ form (soluble Aβ42, soluble Aβ40, insoluble Aβ42, and insoluble Aβ40), individual analysis on the relationship between cognitive function and levels of each Aβ was completed. Percent control escape latency in the MWM at day five was plotted against each individual percent control in Aβ (Fig. 2). Both soluble Aβ forms showed weak, but nonetheless statistically significant trends with cognitive function (slope = 0.148, R2 = 0.247, p < 0.001, n = 148; slope = 0.135, R2 = 0.1667, p < 0.001, n = 148, for Aβ40 and Aβ42, respectively) (Fig. 2A, C). Insoluble Aβ40 and Aβ42 showed no statistically significant correlation with MWM escape latency (Fig. 2B, D). The nearly flat trendlines with very low R2 values indicate that insoluble Aβ levels did not correlate with cognitive function (slopes < 0.005, R2 < 0.001, p > > 0.05, n = 144).
Aβ data measurements fell into two main categories: direct measurement (staining and imaging of plaques or western blot with total Aβ marker like 6E10) and indirect calculations (combination of soluble and insoluble Aβ40 and Aβ42 measurements). When assessed separately, the direct measurements of Aβ have a stronger correlation with cognition, which is statistically significant (slope = 0.901, R2 = 0.464, n = 93, p < < 0.001) (Fig. 2E).
Overall, our assessment of the 3xTg-AD mouse model supports previous results shown in the Tg2576 mouse model [15], which indicate that Aβ and its subforms only weakly correlate with cognitive function. Moreover, the weak trend with cognition is predominantly tied to soluble Aβ that has been directly experimentally measured.
Cognition versus total tau levels
Both total tau and pTau were analyzed for their contributions to the 3xTg-AD pathology. Total tau (unphosphorylated + phosphorylated tau) showed no trend in either MWM or NOR (Fig. 3). Total tau, also referred to as simply “tau” in the present study, is measured by anti-human tau antibody HT7 or Tau-5, which bind to a location on tau that allows recognition of both unphosphorylated and phosphorylated tau [83, 84]. The trend slopes of the present study indicate increases in total tau mildly improve cognitive function in the 3xTg-AD mouse. Of note is that most data were centralized around 100% of control for total tau indicating total tau levels in treated mice did not change much compared to the control. Pearson coefficient analysis for MWM escape latency versus total tau produced a statistically significant but very weak trend (slope = –0.176, R2 = 0.071, p < 0.001, n = 152). NOR performance had a nearly flat trendline (slope = 0.0467, R2 = 0.006, p > > 0.05, n = 85) with most total tau data once again clustered at 100% of control.
Cognition versus phosphorylated tau levels
Although analysis of total tau showed no association with cognitive decline, pTau has a statistically significant and strong association with cognitive decline (Fig. 4). A significant positive slope with MWM escape latency (Fig. 4A) illustrates that cognitive function significantly decreases as pTau levels increase (slope = 0.408, R2 = 0.275, n = 371, p < < 0.01). Similarly, a significant negative slope with NOR (Fig. 4B) indicates cognitive function decreases as pTau levels increase (slope = –0.3196, R2 = 0.176, n = 113, p < 0.05). Recall that standard field definitions denote the performance sign for cognitive decline oppositely in MWM and NOR; thus, increased MWM escape latency (positive slope) and decreased NOR recognition index (negative slope) both correspond to increases in cognitive decline. Therefore, the visualized slopes and calculated statistically significant p-values indicate a consistent and definitive correlation of pTau with 3xTg-AD mouse cognitive decline.
pTau was measured through western blot, imaging of the hippocampus, or ELISA. In all cases, expression units were presented as relative to a 3xTg-AD control. Imaging of immunohistologically marked pTau provides direct measurement of NFTs. The other measurements also indicate hyperphosphorylation and accumulation of NFTs.
pTau correlation with MWM escape latency surpassed Aβ with a steeper slope of 0.408 and R2 = 0.275. To confirm the comparison between pTau and Aβ, the proteins were used as variables to predict escape latency performance in a multiple linear regression. Using the MATLAB stepwise function on data points where both pTau and Aβ were available, it was determined that pTau was a stronger variable input for predicting cognitive function than Aβ. Both variables considered alone were significant factors for improving correlation, but adding the Aβ variable to the pTau trendline did not significantly improve the resulting correlation (data not shown).
pTau epitopes are expressed inconsistently between studies as well as within the same study. There is not a definitive epitope that is considered the most impactful or completely irrelevant. AT8, AT270, AT180, and PHF-1 monoclonal antibody markers were compared to determine if one had a more consistent measurement and correlation with MWM performance (Fig. 5). The major kinases involved in pTau pathology contribute to phosphorylation at multiple sites including all the sites detected by AT8, AT180, AT270, and PHF-1 (Table 2). Additionally, the major phosphorylation sites of pGSK3β and CDK5 are captured by these antibodies. Both AT8 and AT270 were significant and had relatively strong, positive correlations. PHF-1 and AT180 had no significant trends with escape latency, and they even have slightly negative slopes.
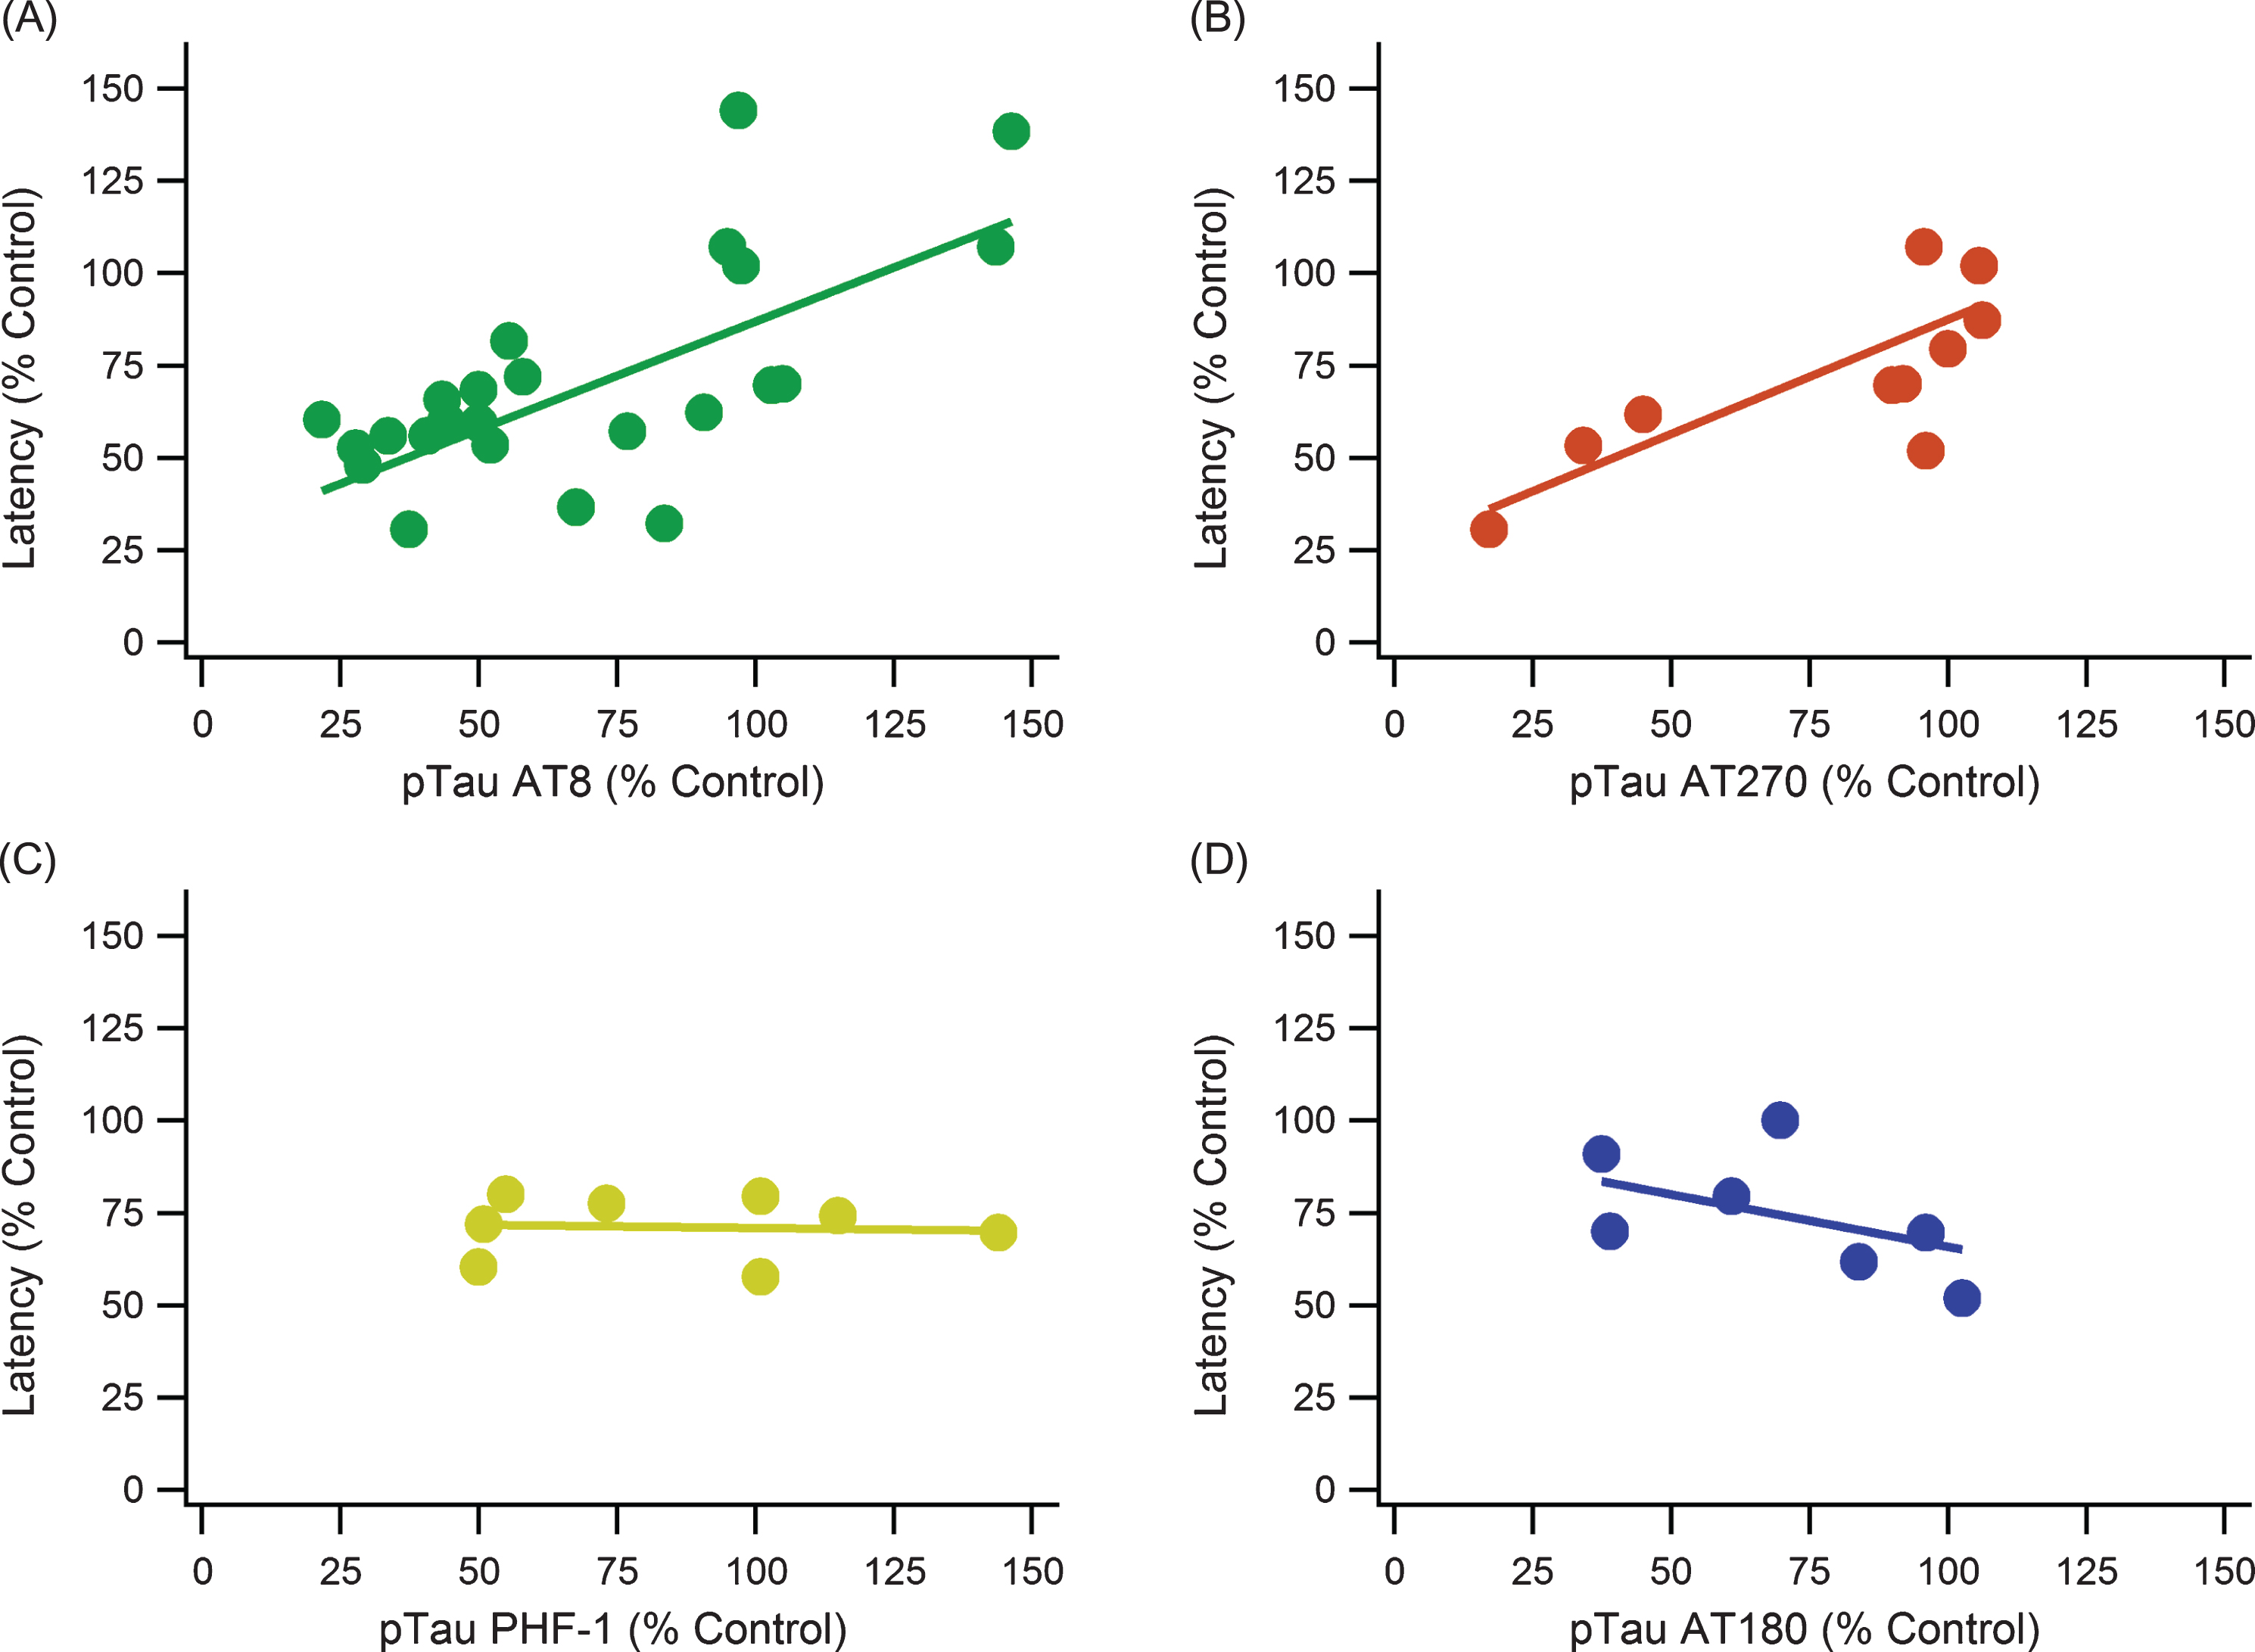
pTau epitope analysis comparing different phosphorylation locations. pTau epitope breakdown shows strong positive correlations with AT8 and AT270 while showing no trend or a weak, negative trend with PHF-1 and AT180, respectively. A) AT8: slope = 0.586, R2 = 0.521, n = 185, p < < 0.001. B) AT270: slope = 0.619, R2 = 0.686, n = 88, p < < 0.001. C) PHF-1: slope = –0.017, R2 = 0.004, n = 48, p > > 0.05. D) AT180: slope = –0.285, R2 = 0.242, n = 44, p < 0.001. Note that sample sizes noticeably decreased from A to D due to a lack of data and measurements using the AT180 and PHF-1 markers.
Phosphorylated tau antibody reference guide for phosphorylation location
Assessment of variance and disease complexity
A PCA calculated contribution of individual components to variance in the data and provided an overall assessment of disease complexity. In addition to the clinical outcome measures discussed so far, kinases and kinase activators involved in tau phosphorylation (pGSK3β, GSK3β, CDK5, p25, and p35) were analyzed to identify possible targets for future research (Fig. 6, Table 2). PCA calculates components that explain the largest amount of variance, whereas a biplot displays how much variables contribute to variance for the predominant two PCA-identified components. Six outlier data points, which were included in the full PCA analysis in Fig. 6A-C (analysis including outliers) were removed for the PCA analysis illustrated in Fig. 6D-F (analysis excluding outliers). Note that the important considerations for comparison are the orthogonality of the variables and overall contribution to variance explained. Correlating variables cluster together on the biplot(s) (Fig. 6A,D) and contribute similarly to variance of the pathological “system”.
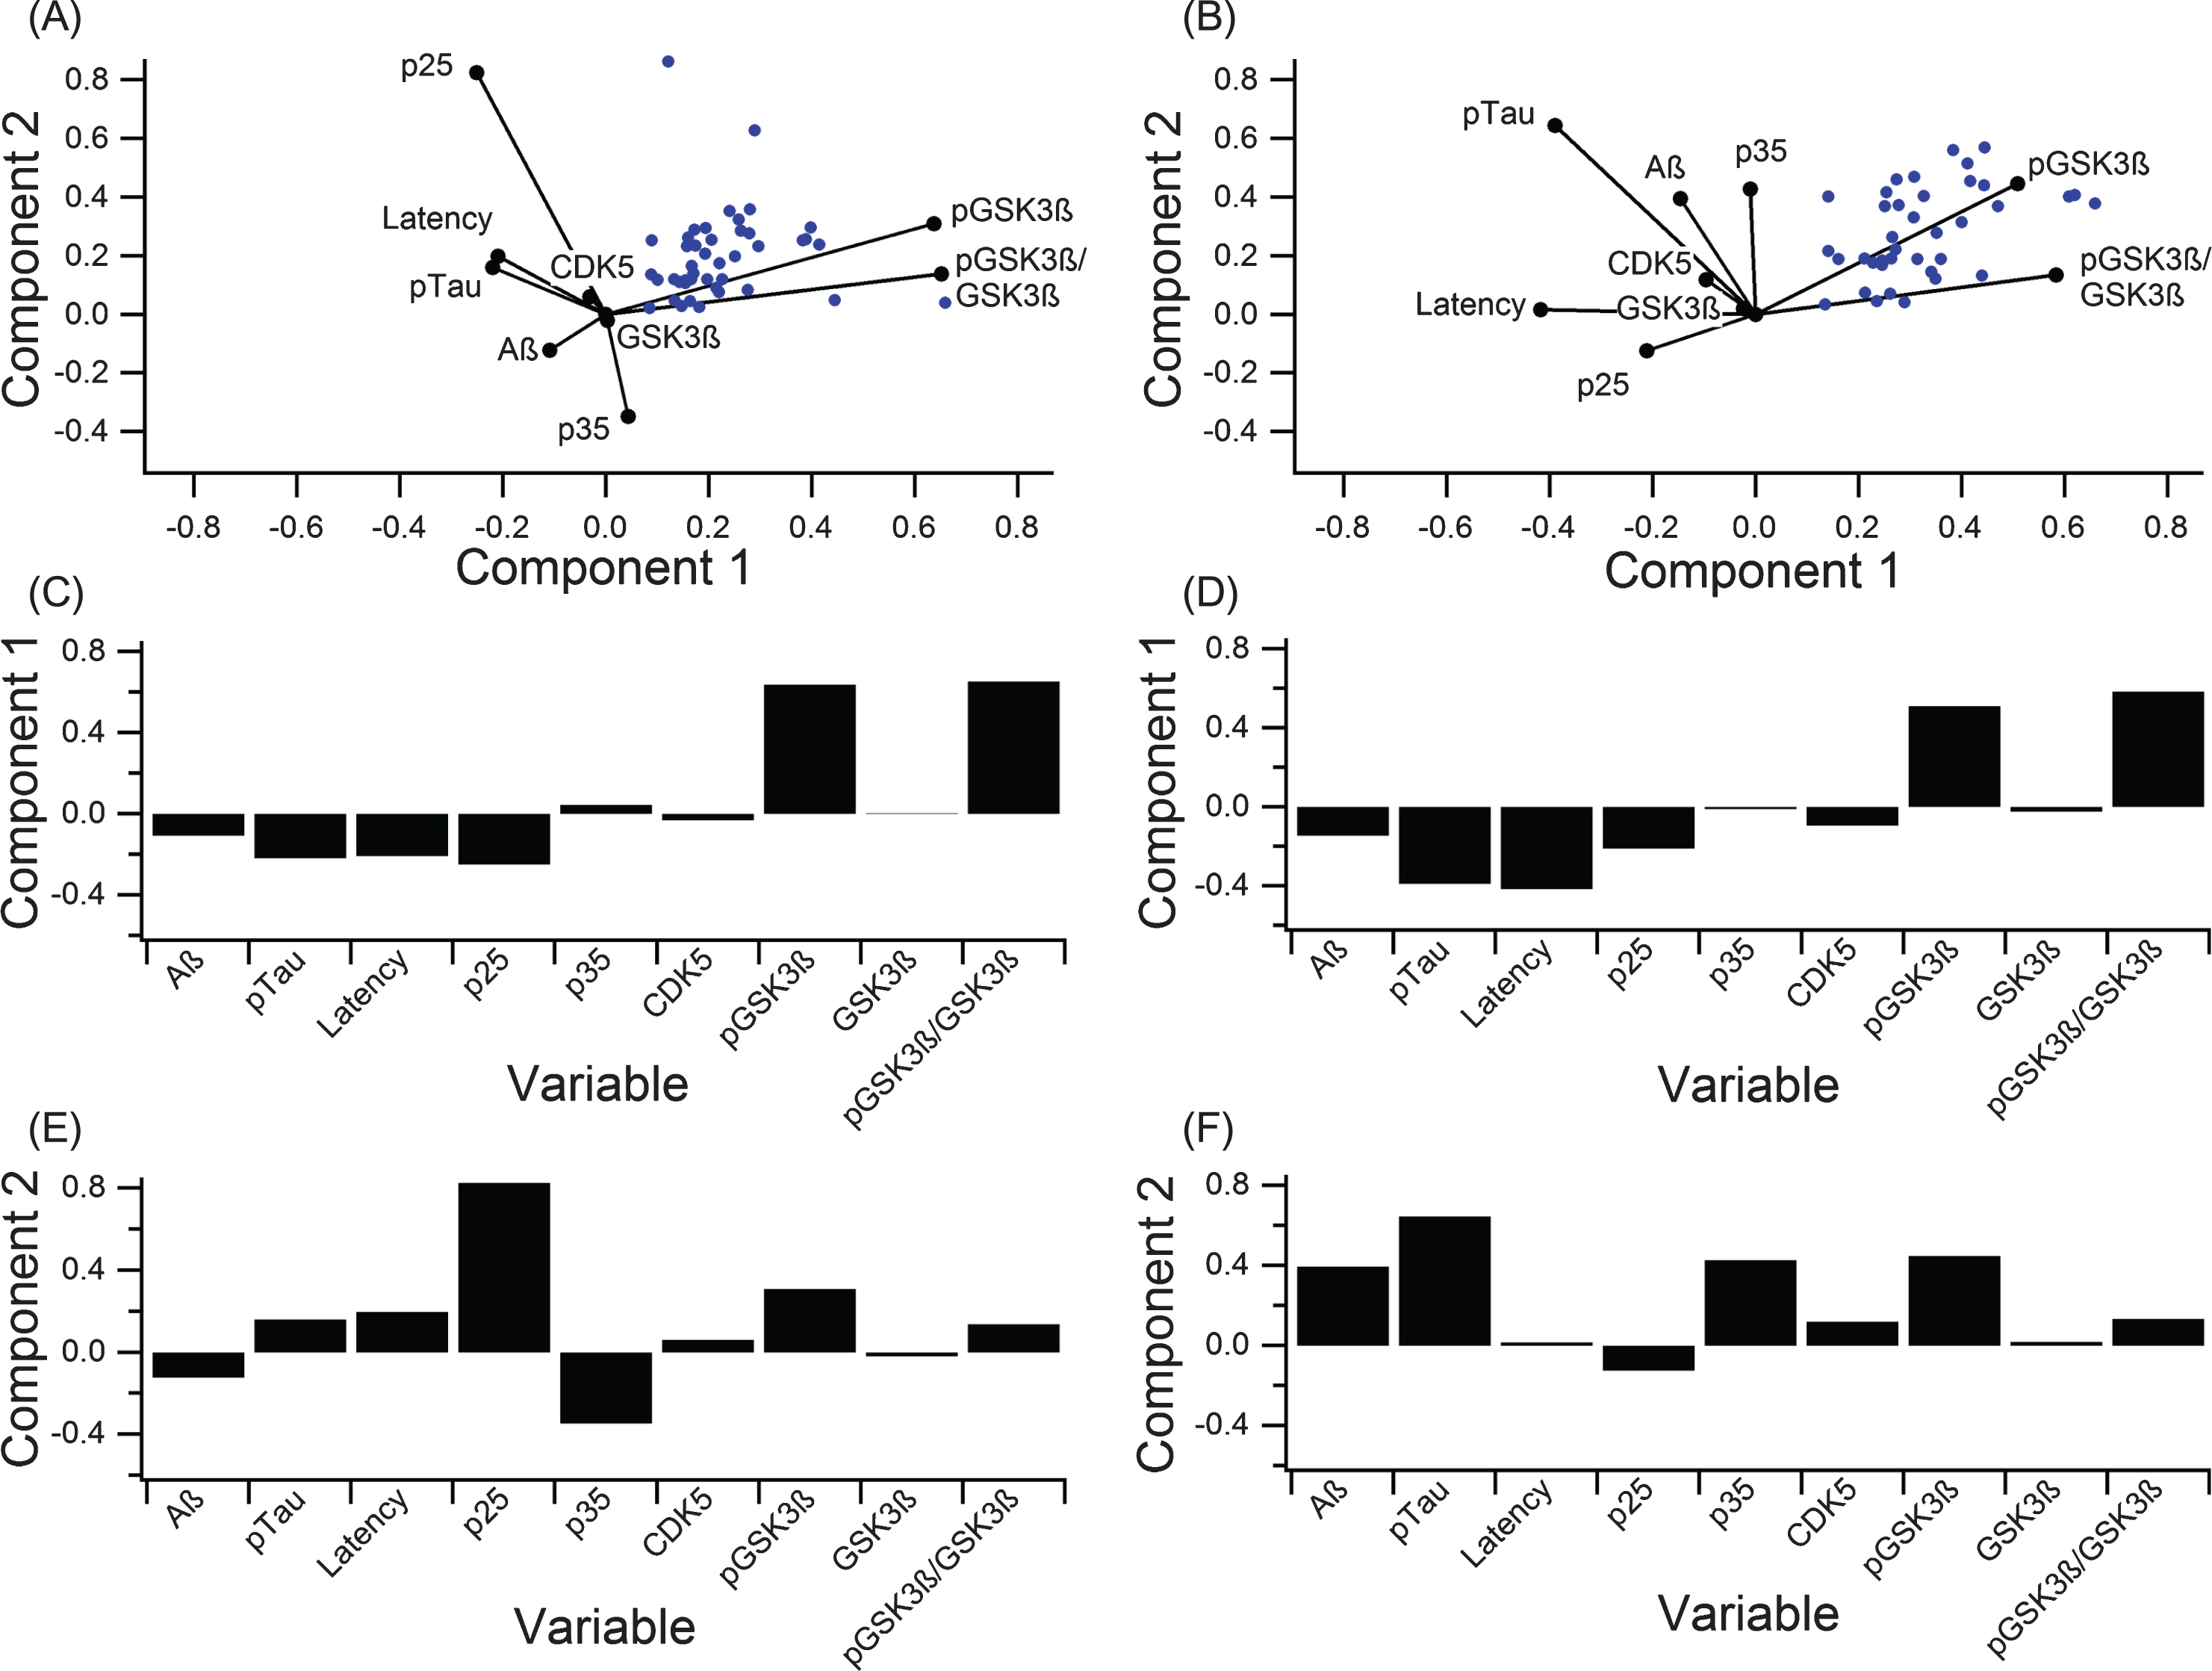
PCA to determine variance contribution of the key components in tau phosphorylation. A-C) PCA on all data with no outlier removal graphed in the biplot (A) and broken down to clearly show the first two components (B, C). Component 1 accounted for 63.6% of the variance, and component 2 accounted for 27.9%. D-F) PCA on data with six outliers removed displayed in a biplot (A) and broken down to show the first two components (E, F). Component 1 accounted for 86.6% of the variance, and component 2 accounted for 13.4%.
In both PCA analyses (including and excluding outliers), phosphorylated (ser 9) GSK3β (pGSK3β) contributed most strongly to variance in the “system”, and pTau and MWM escape latency contribute to variance in a nearly collinear manner. In the analysis excluding outliers (Fig. 6D-F), Component 1 of PCA accounted for 86.6% of the variance and was mostly comprised of pGSK3β (Fig. 6E) while component 2 accounted for 14.4% of the variance and was dominated by pTau (Fig. 6F). In the analysis including outliers (Fig. 6A-C), component 1 of PCA accounted for 63.6% of the variance and was mostly comprised of pGSK3β (Fig. 6B) while component 2 accounted for 26.9% of the variance and was dominated by p25 (Fig. 6C), which is a crucial activator of CDK5.
DISCUSSION
Total levels of directly measured Aβ, as well as pTau both correlated with cognitive decline in the MWM and NOR. However, pTau had a stronger and more definitive trendline, indicating that despite its lower overall concentration, pTau has a stronger connection to cognitive ability in 3xTg-AD transgenic mice than does Aβ [85]. Individual Aβ subform analysis supports previous findings that Aβ correlates weakly with cognitive decline and has a limited effect on cognitive changes [15]. Inconsistent trends amongst the pTau antibodies presents an interesting discussion on the quality of pTau epitope markers and phosphorylation location influence on self-assembly into NFTs. PCA emphasized the need for further investigation of tau phosphorylation mechanisms and the intricate complexity of AD pathology, which suggests the need for combinatorial therapeutic strategies to target synergy between Aβ and pTau in NFT formation, possibly via pGSK3β.
Relative comparison of wild type affirms 3xTg-AD model validity
Relative pTau and Aβ protein levels of wild type mice to 3xTg-AD control mice coincided with relative escape latencies of treated 3xTg-AD mice with a similar reduction in pTau and Aβ. A 50% level of pTau compared to an untreated 3xTg-AD control led to a 30–50% reduction in escape latency for both treated 3xTg-AD and untreated wild type mice. The alignment of wild type data supports the validity and consistency of using 3xTg-AD control mice. Moreover, wild type mice provide the lower limit on how fast the mice can swim and find the platform with no AD pathology [27].
Amyloid-β displays weak trends with cognitive decline
Increases in total Aβ showed only weak trends with cognitive decline, which was supported by the individual analysis of the four main forms of the Aβ components. As similarly shown in prior work in meta-analysis of other preclinical AD mouse models [15], the trends with insoluble Aβ were insignificant, and thus were not an indication of cognitive decline. Despite insoluble Aβ typically having higher concentrations in the brain, relative changes in the soluble Aβ levels had a larger impact on cognitive function [39, 78]. The diffuse nature of soluble Aβ allows it to have a more direct impact on neurons by surrounding the cell surface and synapses leading to neurotoxicity [86–88]. The connection between Aβ and tau phosphorylation is not well defined, but significant trends could indicate soluble Aβ oligomers have a stronger influence in activating kinases for tau phosphorylation [89]. In contrast to other Aβ assessments, direct Aβ experimental measurements moderately correlated with escape latency (R2 = 0.464) (Fig. 2E), but pTau correlated even more strongly with escape latency for studies where both Aβ and pTau measurements were available (9 out of 12 studies; R2 = 0.847). The present analysis supports the indirect role that Aβ plays in the Amyloid Cascade Hypothesis, but the variance and weak overall trendlines of Aβ with cognition reinforce the complexity of the interaction. Thus, while Aβ may be the most physically visible marker of AD, its actual role in the disease etiology, and namely, cognitive decline, is neither independent nor direct, but rather, intertwined with mechanisms like pTau and GSK-3β. For these reasons, Aβ is likely not the best primary treatment target— a conclusion supported by the mounds of failed clinical trials specifically targeting Aβ in AD [13, 14].
Total tau is insignificant to cognitive decline
Total tau, often referred to simply as “tau”, did not have a clear impact on cognitive decline, and qualitative trends even indicated that it may improve cognitive ability. The aforementioned result is rather unsurprising considering tau is a normal and prevalent protein in the brain that is needed for microtubule stabilization and proper neuron function [90, 91]. Additionally, even when overexpressed, tau does not aggregate into NFTs because of its naturally high solubility [92]. Moreover, tau trends were not definitive in large part because the tau in treated mice did not differ from the control mice substantially in many of the experiments; the measurements tended to be within 10–20% of the control value. Such a sensitive range may not allow meaningful assessment of cognitive impact with MWM and/or NOR, especially in a complex disease with numerous other contributing factors.
Phosphorylated tau levels strongly correlate with cognitive decline
pTau showed statistically significant and very strong quantitative trends with cognitive performance in both the MWM and NOR cognitive tests. The overall impact of tau phosphorylation by kinases had similar impact in the MWM and NOR tests, reinforcing results of the impact of pTau on the hippocampus and cognitive function. Individual breakdown of pTau epitopes (AT8, AT180, AT270, and PHF-1) revealed there were differences in predicting cognitive function. AT8 and AT270 had a strong correlation between increasing levels and cognitive decline; however, AT8 had more supporting data promoting a strong correlation between increased pTau levels and increased latency in the MWM. Therefore, AT8 could be the most effective and consistent method in measuring pTau level. Both PHF-1 and AT180 resulted in very low correlation between escape latency and pTau levels, but their trends were likely distorted by insufficient sample size. Further research on tau epitope binding characteristics is needed to understand accuracy of measurement, impact on variance, and standard experimental error. The presented results of our aggregated analysis beg the question, “Is there a lack of consistency between the experimental antibodies, or does phosphorylation location impact the ability to self-assemble into NFTs?”
Phosphorylated tau more directly influences cognitive decline than Aβ
The overall impact of pTau in 3xTg-AD cognitive decline is consistent and clear: p-Tau has a statistically significant and strong correlation with cognitive function that outweighs that of Aβ as shown in multiple forms of analysis in the present study, including side-by-side analytical comparisons of aggregated data from studies examining both Aβ and pTau versus cognition, aggregated analysis of studies separately assessing Aβ and pTau versus cognition, multiple linear regression assessing the ability of Aβ and/or pTau to predict cognitive decline, and PCA examining contributors to variance in MWM escape latency.
pTau’s greater impact on cognition than Aβ is all the more impressive considering pTau deposits are not as substantial, in terms of visual surface area prevalence and concentration in cerebrospinal fluid in the brain [85, 93]. The present study’s results suggest that pTau is most likely the primary factor in cognitive decline, though Aβ may play an indirect role in AD pathology in the development of NFTs. Based on the 3xTg-AD mouse model, Aβ is the first pathology to develop in AD, suggesting that it may serve as the first link in the chain leading to neurodegeneration by influencing tau phosphorylation; as such, its maximal treatment efficacy is likely limited to very early stages of disease well before onset of cognitive decline. Our conclusions affirm findings of previous studies, including Foley et al. [15], lending further support that while Aβ may contribute to cognitive decline when highly concentrated, quantitative levels of Aβ do not correlate with cognitive decline. In contrast, levels of pTau do significantly, directly, and quantitatively correlate with cognitive decline; therefore, pTau could be a key functional treatment target even in later stages of the AD pathology. The connection between pTau and Aβ requires further research to precisely and mechanistically define. It is likely, however, that Aβ indirectly promotes tau phosphorylation through upregulation of kinases such as GSK-3β and CDK5, which phosphorylate tau.
Complexity analysis highlights GSK3 interactions
Glycogen synthase kinase-3 (GSK-3) and CDK5 are kinases involved in the phosphorylation of tau as an important step in AD pathology [4, 94–96]. Our analysis focused around GSK-3 due to its dominance as a tau phosphorylation kinase and prevalence in literature; specifically, the GSK-3β isoform is linked more closely with tau pathology [94]. Additional kinases (PKA, p38 MAPKs, CAMKII, Dyrk1A) were considered, but there was a lack of available data with corresponding pTau and Aβ measurements for substantial meta-analysis [97]. In both analyses, pGSK3β contributes substantially to variance, which highlights it as prime future research targets to assess mechanisms directly related to escape latency. The large variance in the activator proteins p25 and p35 highlights the need to account for CDK5 involvement in AD. While CDK5 may have had small comparative variance, CDK5 is linked to regulation of Aβ development and pGSK3β activity [95–97]. Therefore, even small changes in activity could be having large downstream effects more directly attributable to pGSK3β, pTau, and Aβ.
In both PCA analyses, the MWM escape latency variance is low in both components; this finding is somewhat expected because there is an inherent limit to the variance in escape latency. pTau and latency closely align in the PCA analysis with outliers and very closely in PCA component 1 in the analysis with outliers removed (Fig. 6E). These findings suggest the presence of collinearity and provide corresponding additional support that pTau more directly influences cognitive decline than Aβ in the 3xTg-AD pathology. Finally, the lack of one predominant factor contributing to overall variance underlines the vast complexity and degree of interactions involved in AD. Thus, AD will likely require a multi-faceted or combination treatment strategy to achieve clinically meaningful efficacy.
Alzheimer’s disease overlap with other neurological diseases
The complexity that AD shares with other multi-factorial neurological diseases does suggest the existence of a spectrum of disorders (i.e., Alzheimer’s disease, amyotrophic lateral sclerosis (ALS), Pick’s disease, Parkinson’s disease, frontotemporal lobar degeneration, etc.) that lay within a continuum, as evidenced by clinical biomarker overlap identified in ALS clinical patient autopsies [98]. In fact, more than 20% of sporadic ALS patients in a recent biomarker autopsy study [98] met CERAD (Consortium for Established Registry for Alzheimer’s Disease) criteria for AD; moreover, over 35% had excessive Aβ, 78% had NFTs, 17% had clinical tauopathy, 80% had TDP-43, and 4% α-synuclein. This example of overlap within ALS illustrates shared etiology across various neuropathologies, irrespective of whether the specific pathology is accompanied by clinically measurable cognitive decline in every patient. Such an intricate neuropathological continuum requires addressing overlapping pathology dynamics [99, 100] and targeting synergistic interactions in order to return to neural system homeostasis [101, 102]. Additional informatics [102] and computational assessments (e.g., [21, 103]) to further explore underlying complexity, system dynamics, and system stability could expedite combination treatment identification.
Conclusions and future directions
The present systematic review, which compares Aβ and tau pathology in the 3xTg-AD mouse model, concludes that pTau has the strongest correlation to cognitive decline than any of the other assessed clinical outcome measures, including Aβ. Thus, particularly in sporadic or non-familial cases of clinical AD, Aβ should not be the sole therapeutic target to improve AD symptoms. Future research should focus on eliminating pTau to reverse AD symptoms, rather than focusing solely on Aβ elimination (Fig. 7). Preventing Aβ accumulation, even before onset, can reduce NFT build up and reduce the corresponding protein accumulations in the brain, but such prophylactic treatment is only well-suited in cases of known familial lineage or history, where treatment can begin well before the onset of cognitive decline [10]. Alternative options for sporadic AD could include protein regulator treatments to moderate the activity of kinases like pGSK3β to prevent hyperphosphorylation of tau, which would allow normal pGSK3β function without complete elimination. The large variance in all aspects of the trendlines and in the PCA suggest that many additional factors are affecting the AD pathology and the overall outcome of cognitive ability. Due to the complex interactions between multiple proteins in a disease with distinctive emergent properties, a multifaceted and synergistic treatment approach is needed that aligns with the temporal and functional AD disease stages and corresponding pathology dynamics. We conclude that a larger research focus on higher-level interactions among key proteins, including Aβ, GSK-3β, and pTau, will give a better understanding of the complex dynamics that must be addressed for the development of effective clinical remedies.
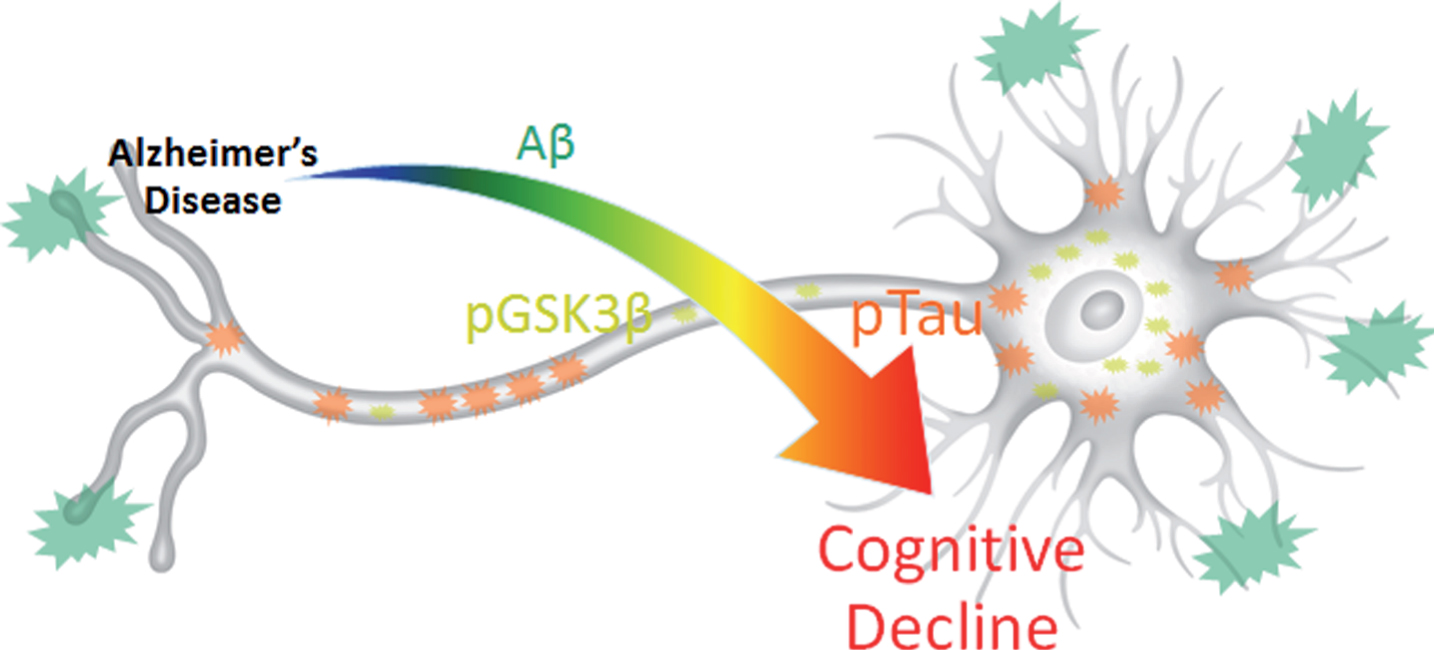
Results summary figure highlighting the physical levels of biomarkers and their corresponding correlation intensity with cognitive decline. pTau is most directly and quantitatively linked to cognitive decline despite its overall lower physical concentration and lower visual presence compared to Aβ. pGSK3β, which contributes the most to data variance in 3xTg-AD MWM escape latency, may provide the key to harnessing synergistic complex interactions between Aβ and pTau that result in cognitive decline.