
Abstract
Genetically modified mice have provided insights into the progression and pathology of Alzheimer’s disease (AD). Here, we have examined two mouse models of AD: the rTg4510 mouse, which overexpresses mutant human Tau gene, and the APP/PS1 mouse, which overexpresses mutant human genes for amyloid precursor protein and presenilin 1. Both models exhibit deficits in hippocampal function, but comparative analyses of these deficits are sparse. We used extracellular field potential recordings in hippocampal slices to study basal synaptic transmission (BST), paired-pulse facilitation (PPF), and long-term potentiation (LTP) at the Schaffer collateral-CA1 pyramidal cell synapses in both models. We found that 6-7, but not 2-3-month-old rTg4510 mice exhibited reduced pre-synaptic activation (fiber volley (FV) amplitude, ∼50%) and field excitatory post-synaptic potential (fEPSP) slope (∼40%) compared to wild-type controls. In contrast to previous reports, BST, when controlled for FV amplitude, was not altered in rTg4510. APP/PS1 mice (2-3 mo and 8-10 mo) had unchanged FV amplitude compared to wild-type controls, while fEPSP slope was reduced by ∼34% in older mice, indicating a deficit in BST. PPF was unchanged in 8–10-month-old APP/PS1 mice, but was reduced in 6-7-month-old rTg4510 mice. LTP was reduced only in older rTg4510 and APP/PS1 mice. Our data suggest that BST deficits appear earlier in APP/PS1 than in rTg4510, which exhibited no BST deficits at the ages tested. However, FV and synaptic plasticity deficits developed earlier in rTg4510. These findings highlight fundamental differences in the progression of synaptic pathology in two genetically distinct models of AD.
INTRODUCTION
Alzheimer’s disease (AD) is a neurodegenerative disease, resulting in a severe and progressive memory impairment, deterioration of cognitive abilities, changes in behavior, and loss of language and, in late stages, a production of motor deficits similar to parkinsonism [1, 2]. Pathologically, AD is characterized by formation and accumulation of extracellular amyloid plaques and intracellular neurofibrillary tangles (NFTs) in cortical and sub-cortical brain regions [3, 4]. Investigations of familial forms of AD led to discoveries of genetic mutations in amyloid precursor protein gene (APP) on chromosome 21 [5–10], presenilin-1 (PSEN1) on chromosome 14 [11, 12], and presenilin-2 (PSEN2) on chromosome 1 [13, 14], which cause autosomal dominant forms of AD. Additionally, genetic studies of patients with an autosomal dominant frontotemporal dementia and parkinsonism (FTDP-17) identified several mutations of tau gene on chromosome 17 [15, 16]. Tau gene encodes a microtubule-associated protein tau (MAPT). NFTs detected in AD and other tauopathies are aggregates of filamentous hyperphosphorylated tau [17–20]. Subsequently, several transgenic mouse models have been developed that overexpress human AD-associated mutations. These models partially recapitulate AD pathology and its progression and are useful tools in both studies of genotype-to-phenotype relationships and the development of therapeutic agents.
One extensively utilized model is a double transgenic mouse (APPswe/PS1M146L), which overexpresses mutated human amyloid precursor protein and presenilin-1, resulting in accelerated Aβ deposition [21–23]. A newer model of tauopathy is the rTg(tauP301L)4510 mouse, which overexpresses mutated human tau protein [24, 25]. Generally, these and related lines of mice exhibit an age-dependent and region-specific progression of neuropathology [26–28]. In the APPswe/PS1M146L mouse, amyloid-β (Aβ) deposition begins at 3-4 months of age in frontal cortex and hippocampus and progressively increases with age [22, 29]. This mouse also exhibits abnormal tau phosphorylation, but lacks NFTs [30]. Neuronal loss, however, was detected only in aged mice at about 22–24 months [31–33]. rTg(tauP301L) 4510 mice develop phosphorylated tau pretangles by 2-3 months of age, with NFTs appearing in the cortex by 4 months and in the hippocampus by 5.5 months. Additionally, significant hippocampal neuronal degeneration is already present at about 5 months of age and continues to progress rapidly. Ten-month-old mice exhibit gross brain atrophy [24, 25].
There are relatively few studies that systematically examine electrophysiological deficits in these mice [30]. Moreover, to our knowledge, there are no studies that make side-by-side comparisons of the same electrophysiological parameters in different models. Additionally, the differences in the extent and time course of changes in basal synaptic transmission (BST) and synaptic plasticity in these and other AD models [26–28, 35] may be due to differences in the nature of mutations, mouse strains, or experimental conditions. Therefore, it is important to examine progression of functional deficits utilizing a standardized approach, as we did in this work.
In this paper, we compared electrophysiological phenotypes and their progression between APPswe/PS1M146L and rTg(tauP301L)4510 mice. We focused on basal synaptic transmission, and short- and long-term plasticity in CA1 area of the hippocampus.
MATERIALS AND METHODS
Animals
We utilized rTg(tauP301L)4510 mice (catalog # 024854 – Tg(Camk2a-tTA)1Mmay Tg(tetO-MAPT*P301L)#Kha/J) that were purchased from the Jackson Laboratory (Bar Harbor, ME, USA) and APPswe/PS1M146L mice (APP KM670/671NL (Swedish), PSEN1 M146L) [21, 36] bred at Psychogenics (Tarrytown, NY, USA). After receipt, mice were housed in cages in same-genotype groups of 5 animals each and maintained on a 12/12-h light/dark cycle. The room temperature was maintained between 20°C and 23°C with a relative humidity maintained between 30% and 70%. Chow and water were provided ad libitum.
Electrophysiology
All procedures were performed in accordance with institutional IACUC guidelines. Mice were sacrificed by decapitation under isoflurane anesthesia. Procedures for slice preparation and electrophysiological recordings using interface slice chambers followed a well-established practice in the field [37–43]. The brains were dissected and immediately cooled in ice cold oxygenated (95% O2/5% CO2) ACSF with the following composition (in mM): NaCl 124, KCl 3.5, NaH2PO4 1.2, NaHCO3 26, CaCl2 2.5, MgSO4 1.2, glucose 11, pH 7.4. Hippocampi were dissected from the forebrain; transverse hippocampal slices (400 micron) were prepared with a tissue chopper (Stoelting tissue slicer, Stoelting Co., IL, USA) [41–45] and maintained at 32°C in a dual interface chamber (Scientific Systems Design, Mississauga, Ontario, Canada) continually oxygenated (95% O2/5% CO2) and perfused at 1-2 ml/min with ACSF and allowed to recover for 90 min prior to any recordings. A platinum/iridium recording electrode and a concentric bipolar stimulating electrode (FHC, Bowdoinham, ME, USA) were positioned on the surface of the slice in the stratum radiatum region of CA1 (inter-electrode distance: 300–500μm). Field excitatory post-synaptic potentials (fEPSPs) were evoked by biphasic square wave stimuli with increasing amplitudes (0–400μA; Δ= 20μA; duration: 120μs) at a frequency of 0.066 Hz with an STG 4004 stimulator (Multichannel Systems, Reutlingen, Germany). fEPSP signals between 0.1 Hz and 1 kHz (filtered using high-pass and low-pass Bessel filters of the amplifier) were amplified using a DP-311 differential amplifier (Warner Instruments, Hamden, Connecticut, USA) and acquired at 20 kHz sampling rate with Axon Digidata 1550A (Molecular Devices, Sunnyvale, California, USA). Waveforms were averaged (n = 3) per stimulus level. The initial linear slope of fEPSPs was used as a measure of the post-synaptic response and fiber volley (FV) amplitude as a measure of the strength of the pre-synaptic activation (i.e., axonal depolarization). Figure 1 depicts a typical example of the recorded waveform and measurements obtained from such waveforms for each slice. Synaptic function was evaluated by constructing input-output relationships in which the fEPSP slope measures were plotted against either stimulus intensity or fiber volley amplitude. BST, as defined in this study, refers to measures of post-synaptic output (fEPSP) as a function of a given input (FV). Paired pulse facilitation (PPF) was tested using 50 ms inter-pulse interval, which is a commonly used interval. Long-term potentiation (LTP) experiments were performed at a stimulus intensity that elicited approximately 40% of the maximal response (fEPSP slope), and a 20-min stable baseline was recorded prior to inducing LTP. LTP was induced with three 1-s duration 100 Hz tetanus trains (high frequency stimulation, HFS), with 5-min inter-train intervals [45]. Responses were followed for an hour following the last tetanus.
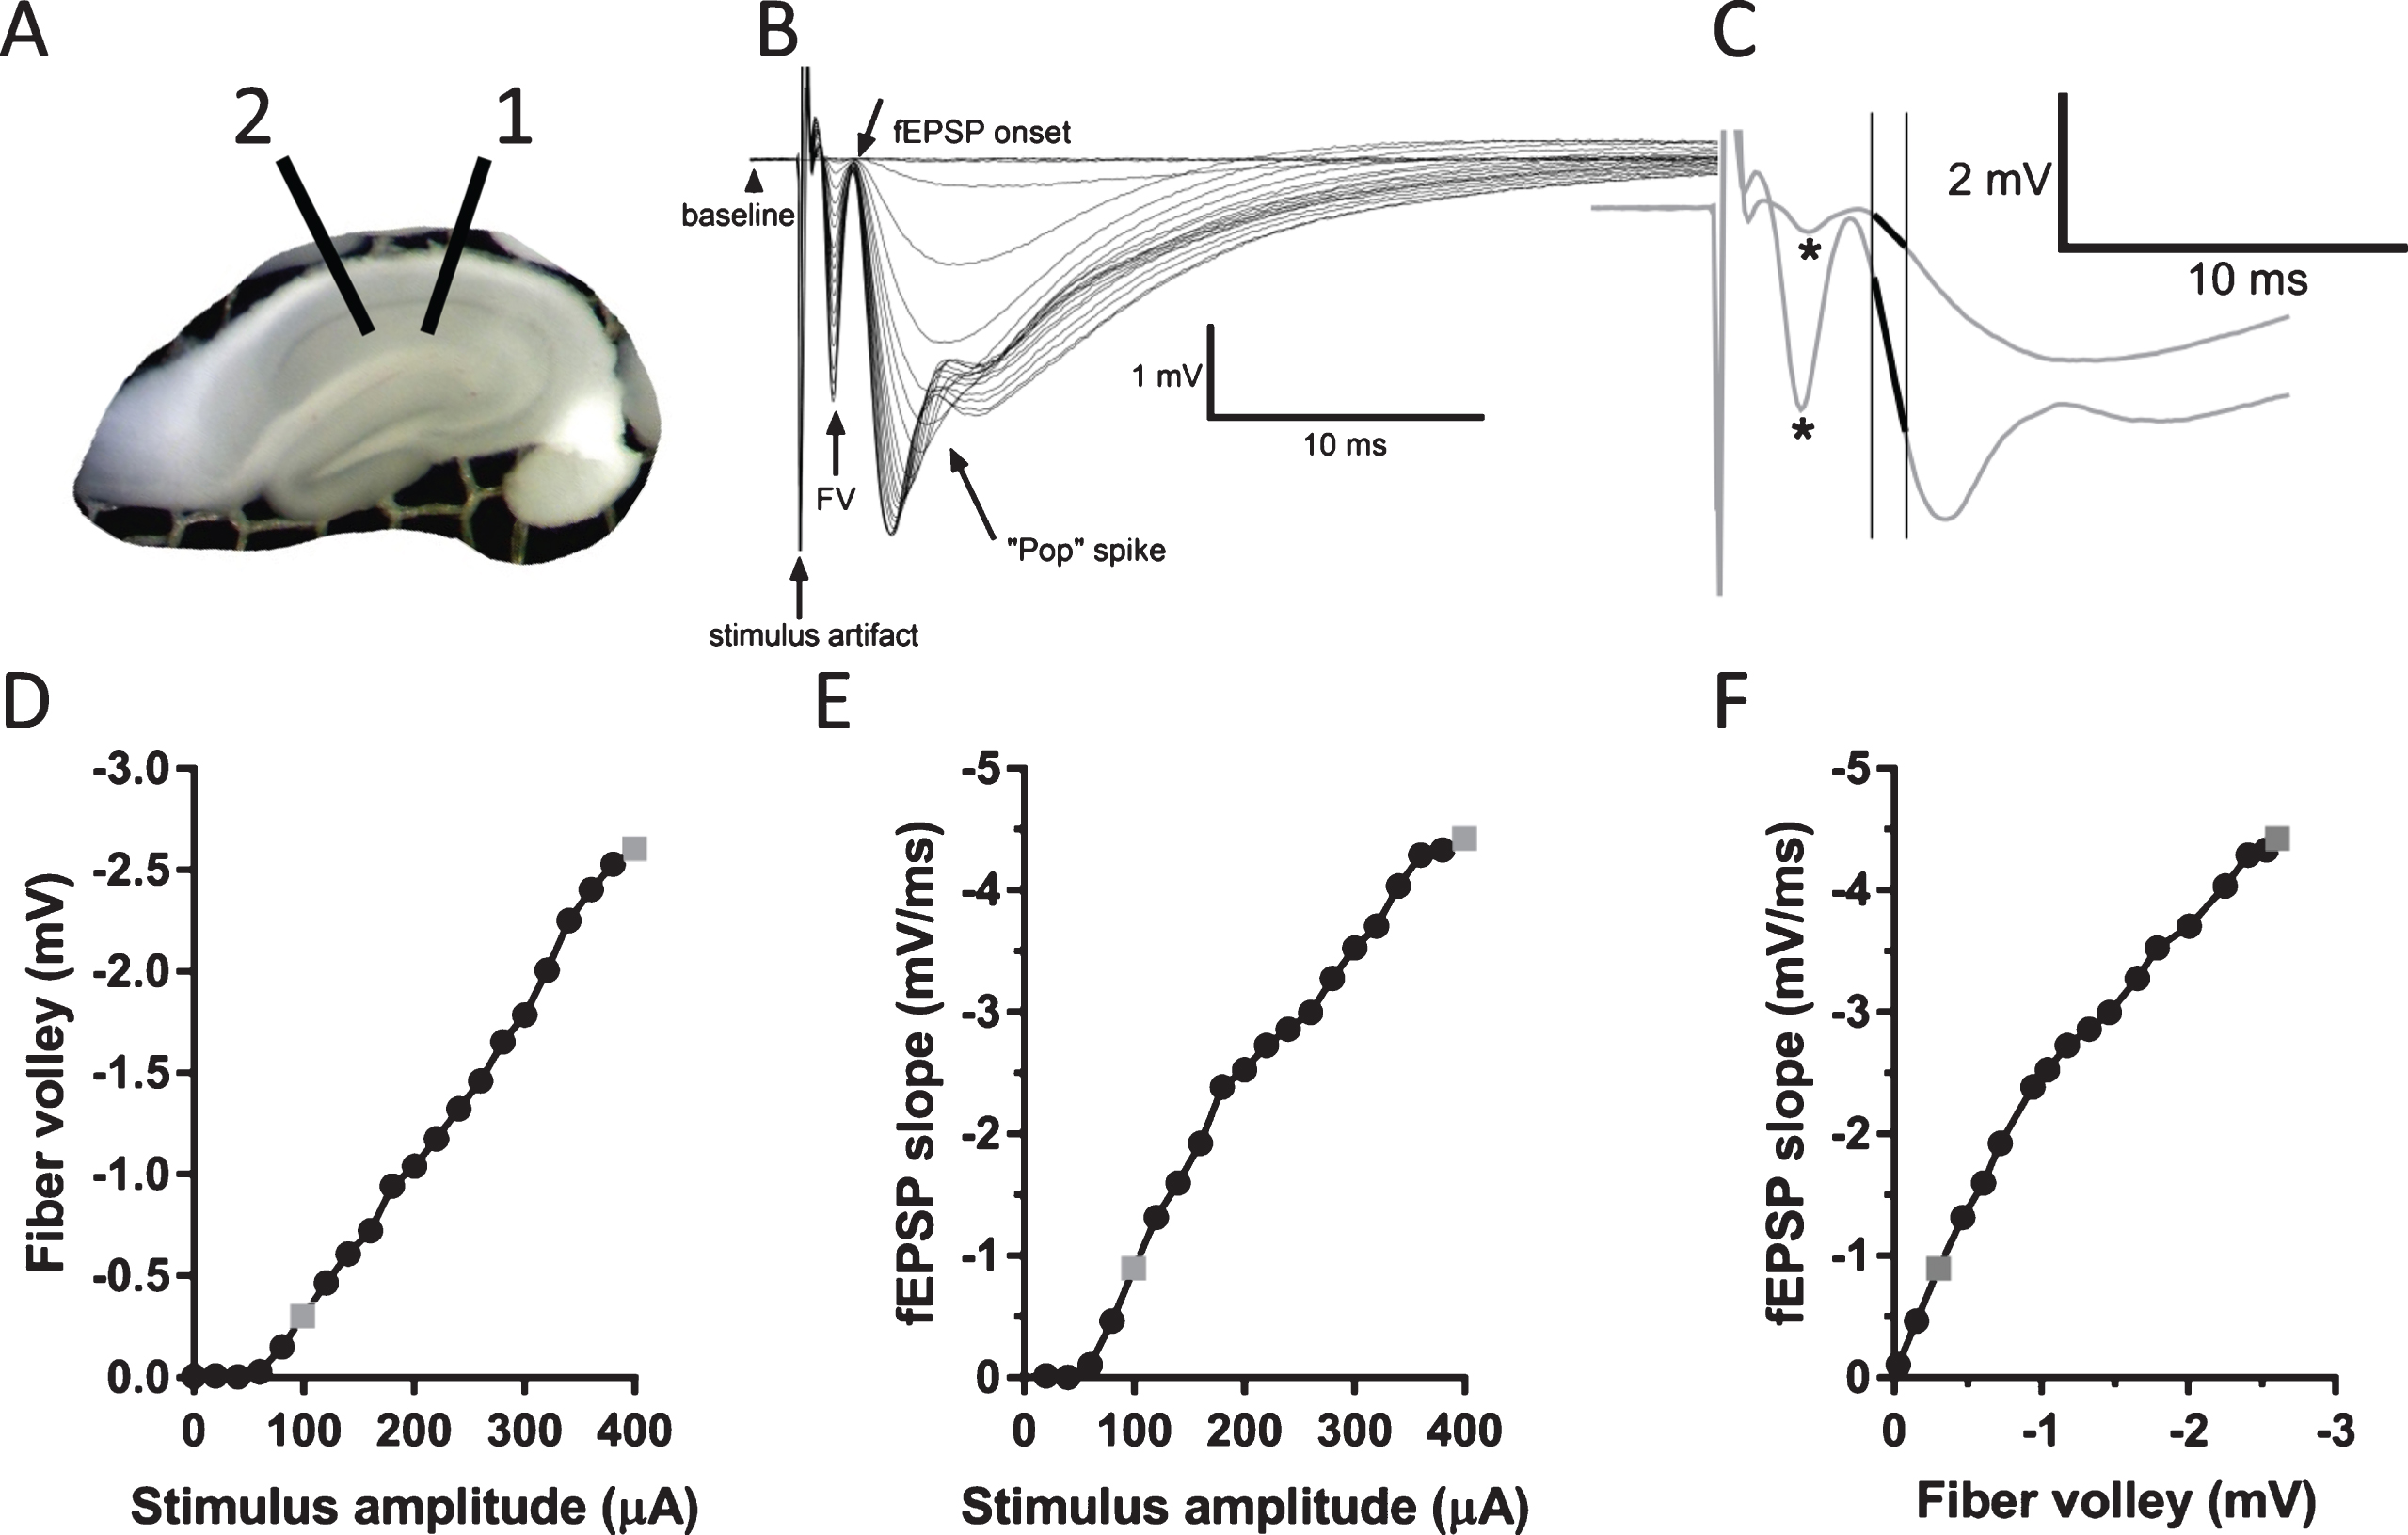
Measurement of several parameters of response in CA1 area elicited by stimulation of Schaffer collaterals. A) A photograph of an interface slice preparation, depicting placement of stimulating (1) and recording electrode (2). B) Example of typical responses evoked in CA1 area to a series of stimuli with increasing stimulus intensities. Note a clearly distinguishable fiber volley, fEPSP onset, and a “pop” spike that appears at larger stimulus intensities. C) Two enlarged traces from (B) showing responses to stimuli of 100 and 400μA. Asterisks depict peaks of fiber volleys (FV). FV amplitude was defined as a difference between the peaks and baseline for each trace. fEPSP slope was measured as a slope of the initial linear portion of the fEPSP (depicted as bold lines). D) Graph depicting measurements of FV amplitude versus stimulus amplitude from the data traces shown in (B). E) Graph depicting measurements of fEPSP slope versus stimulus amplitude from the data shown in (B). F) Graph depicting measurements of fEPSP slope versus FV amplitude from the data shown in (B). Points rendered as gray symbols in (D), (E), and (F) represent measurements of the enlarged traces in (C).
Statistical analysis
Raw data were analyzed with pClamp10 (Molecular Devices, Sunnyvale, California, USA). Statistical analysis included two-way ANOVA followed by a multiple comparison tests, unpaired t-test, or Kolmogorov-Smirnov (K-S) test, where appropriate. LTP time-course data (fEPSP slope) were expressed as a percent of baseline for each slice. Data are presented as the mean and standard error of the mean (s.e.m.).
RESULTS
Basal synaptic transmission in young and old APP/PS1 and rTg4510 mice
We examined basal synaptic transmission and the strength of pre-synaptic Schaffer collaterals activation at different ages in rTg4510 and APP/PS1 mice (rTg4510 : 2-3 mo and 6-7 mo; APP/PS1 : 2-3 mo, 8–10 mo, and 24 mo). fEPSP slope was not altered in 2-3-month-old rTg4510 mice compared to wild-type (WT) controls, as can be seen from the input-output curves depicted in Fig. 2A. Further analysis of cumulative distributions of fEPSP slopes at 50% (200μA) and 100% (400μA) of stimulus amplitude revealed no difference between transgenic and WT animals (Fig. 2B, C). At 6-7 months of age, analysis of input-output relationship revealed a significant reduction of fEPSP slopes in rTg4510 mice compared to WT controls (Fig. 2D). Likewise, cumulative distributions of rTg4510 fEPSP slopes at 50% (200μA) and 100% (400μA) of stimulus amplitude were shifted to smaller values compared to WT controls (Fig. 2E, F). Activation of Schaffer collaterals spanning almost entire range of stimulus amplitudes in 2-3-month-old rTg4510 mice was not different from WT controls, as can be seen from fiber volley input-output curves and cumulative distributions at 50% (200μA) of stimulus amplitude (Fig. 3A, B). However, at the largest stimulus amplitude (400μA), we observed a 21% reduction in fiber volleys in rTg4510 mice (–2.17 mV±0.23 SEM; n = 51 slices) compared to WT controls (–2.73 mV±0.19 SEM; n = 61 slices; Fig. 3A). Cumulative distribution at 100% (400μA) of stimulus amplitude of rTg4510 fiber volleys was shifted to smaller values (p = 0.0260, Kolmogorov-Smirnov test; Fig. 3C). At 6-7 months of age, analysis of input-output relations revealed a significant reduction of fiber volley amplitudes in rTg4510 mice compared to WT controls (Fig. 3D). Likewise, cumulative distributions of rTg4510 fiber volley amplitudes at 50% (200μA) and 100% (400μA) of stimulus amplitude were shifted to smaller values compared to WT controls (Fig. 3E, F).
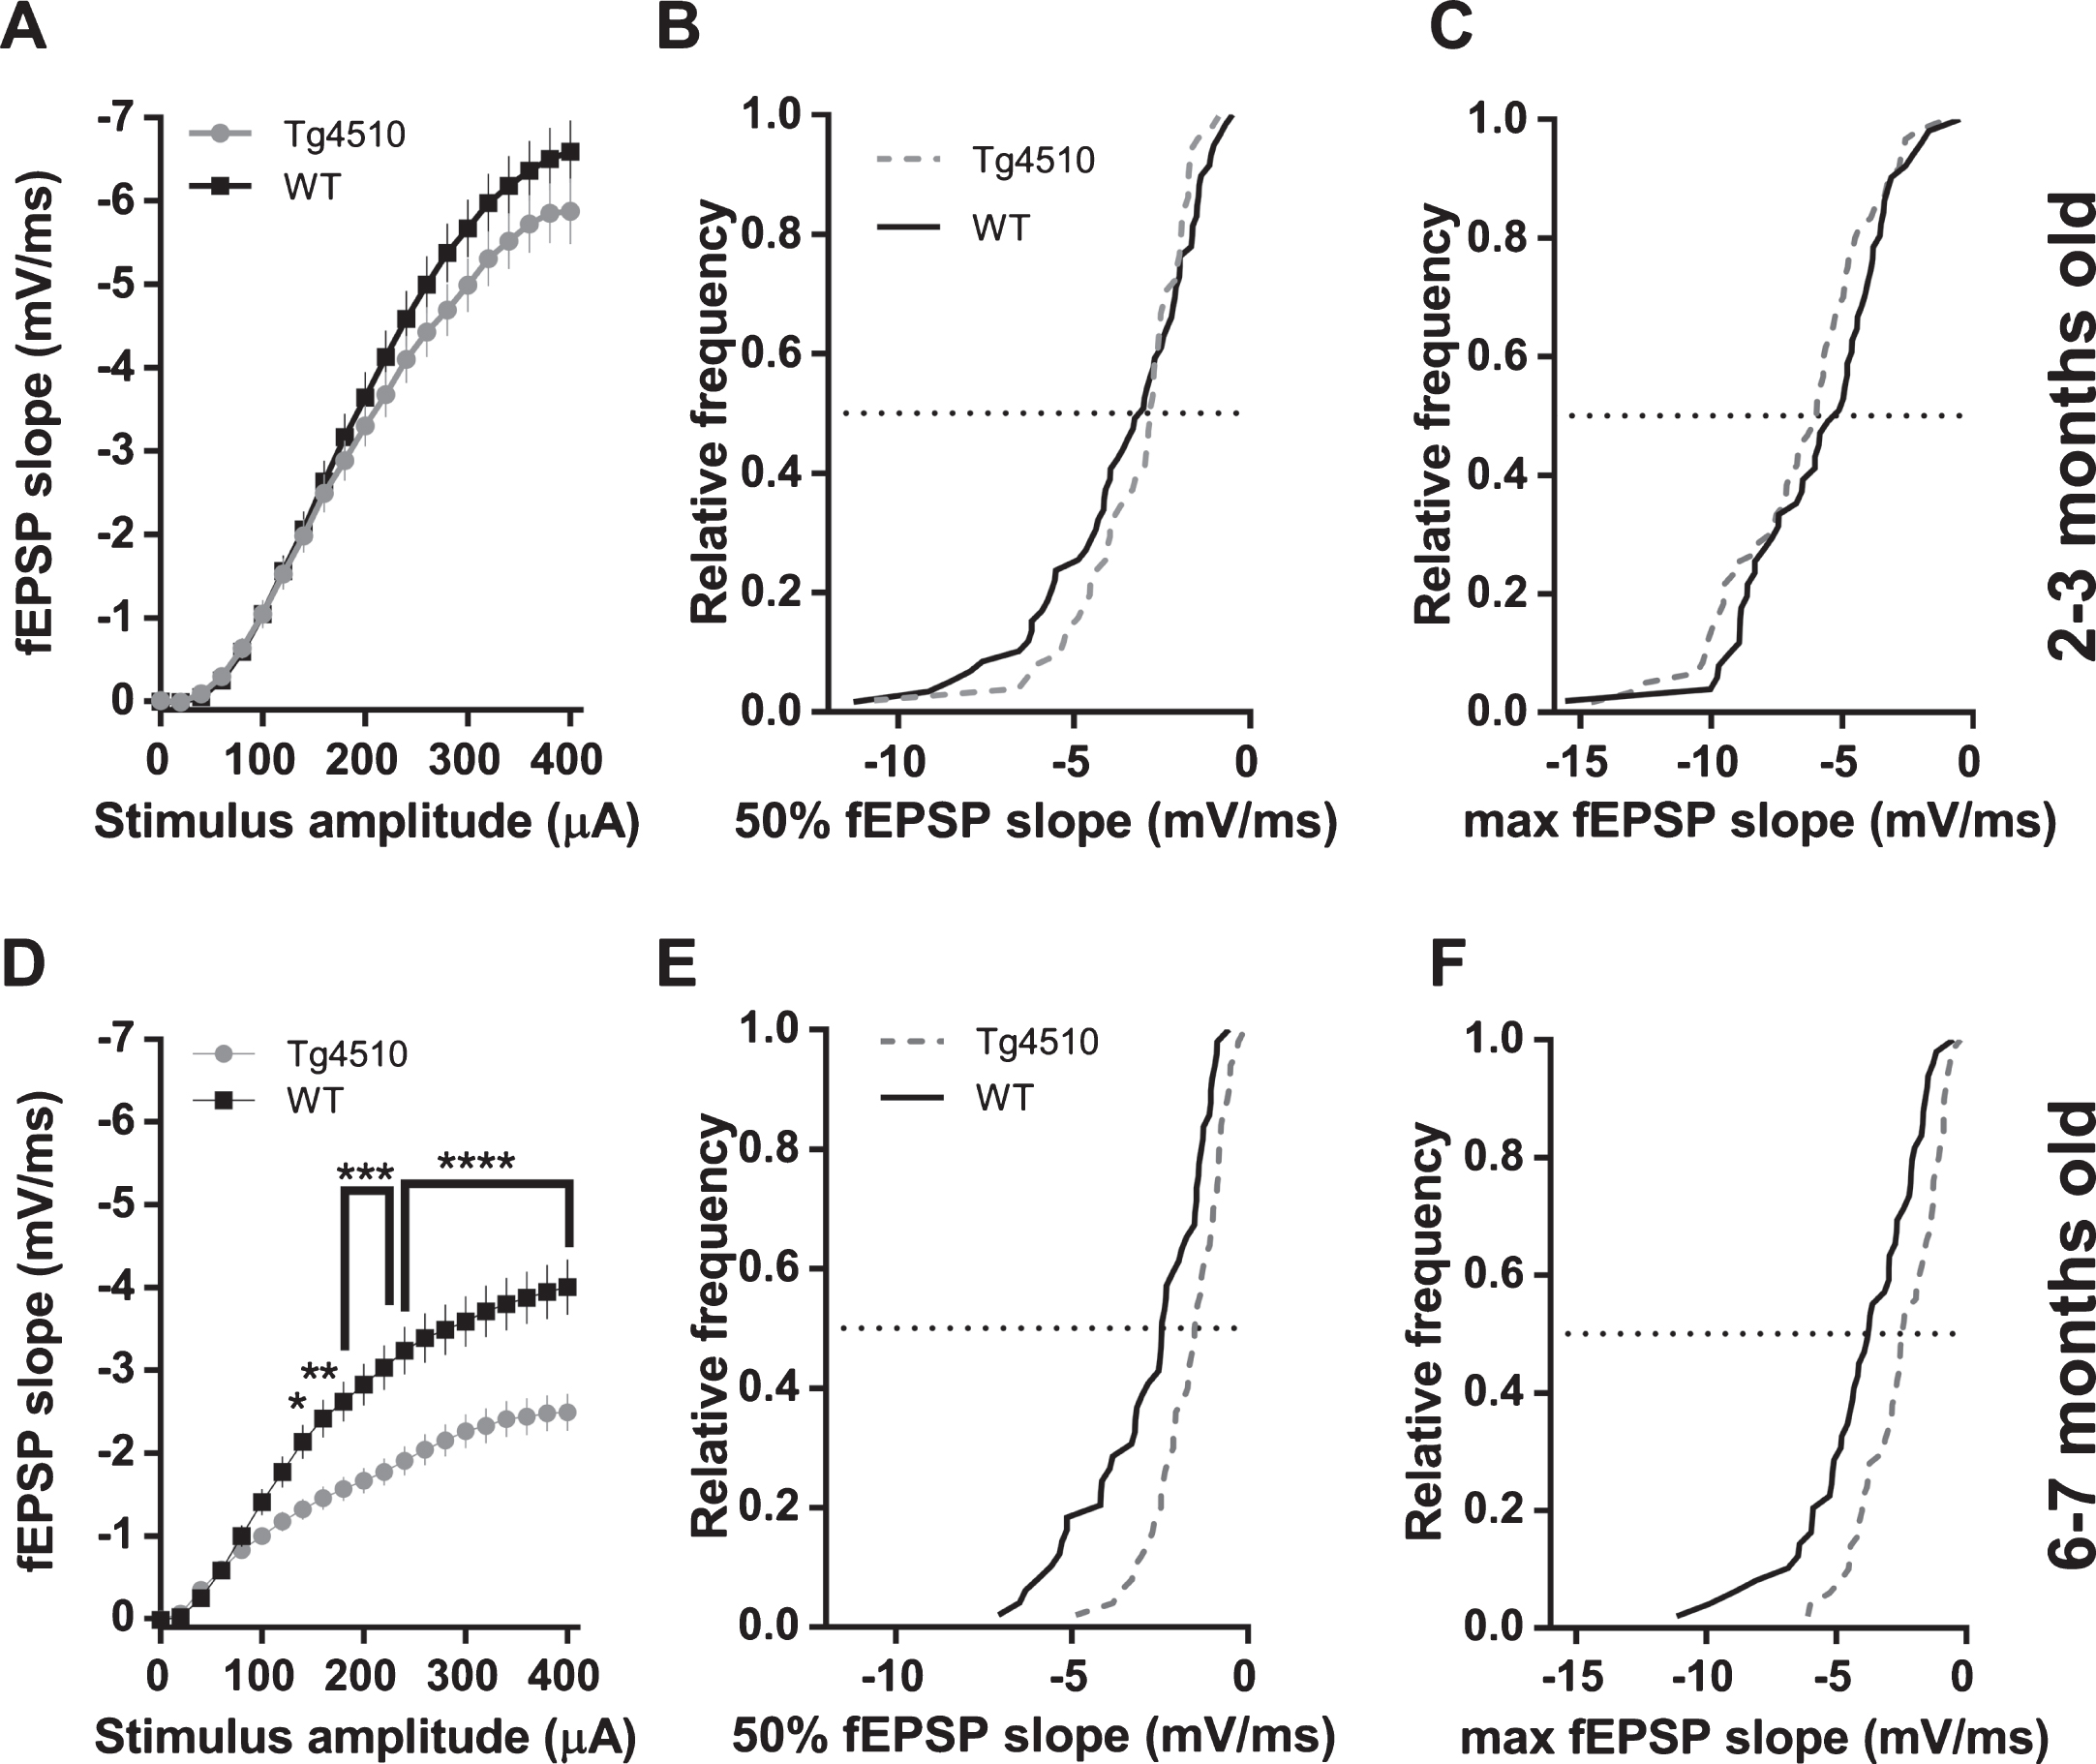
Post-synaptic responses in CA1 pyramidal cells of hippocampus elicited with Schaffer collaterals stimulation in rTg4510 mice. A) fEPSP slopes plotted against stimulus amplitude from 2-3-month-old mice (WT n = 60 slices from 9 animals; rTg4510 n = 51 slices from 8 animals; 2-way ANOVA; genotype: F(1, 2289) = 16.5, p < 0.0001; stimulus amplitude: F(20, 2289) = 152.7, p < 0.0001; interaction: F(20, 2289) = 0.67, p = 0.8590;). B) Cumulative distribution histogram of responses (fEPSP slopes) elicited with a 50% stimulus amplitude (200μA) in 2-3-month-old animals (K-S test, D = 0.1785, p = 0.3483). C) Cumulative distribution histogram of responses (fEPSP slopes) elicited with a 100% stimulus amplitude (400μA) in 2-3-month-old animals (K-S test, D = 0.2039, p = 0.2018). D) fEPSP slopes plotted against stimulus amplitude from 6-7-month-old mice (WT n = 49 slices from 9 animals; rTg4510 n = 50 slices from 8 animals; (2-way ANOVA; genotype: F(1, 2037) = 209.2, p < 0.0001; stimulus amplitude: F(20, 2037) = 60.1, p < 0.0001; interaction: F(20, 2037) = 4.251, p < 0.0001; asterisks indicate result of Bonferroni’s multiple comparisons test). E) Cumulative distribution histogram of responses (fEPSP slopes) elicited with a 50% stimulus amplitude (200μA) in 6-7-month-old animals (K-S test, D = 0.3118, p = 0.0162). F) Cumulative distribution histogram of responses (fEPSP slopes) elicited with a 100% stimulus amplitude (400μA) in 6-7-month-old animals (K-S test, D = 0.309, p = 0.0177).
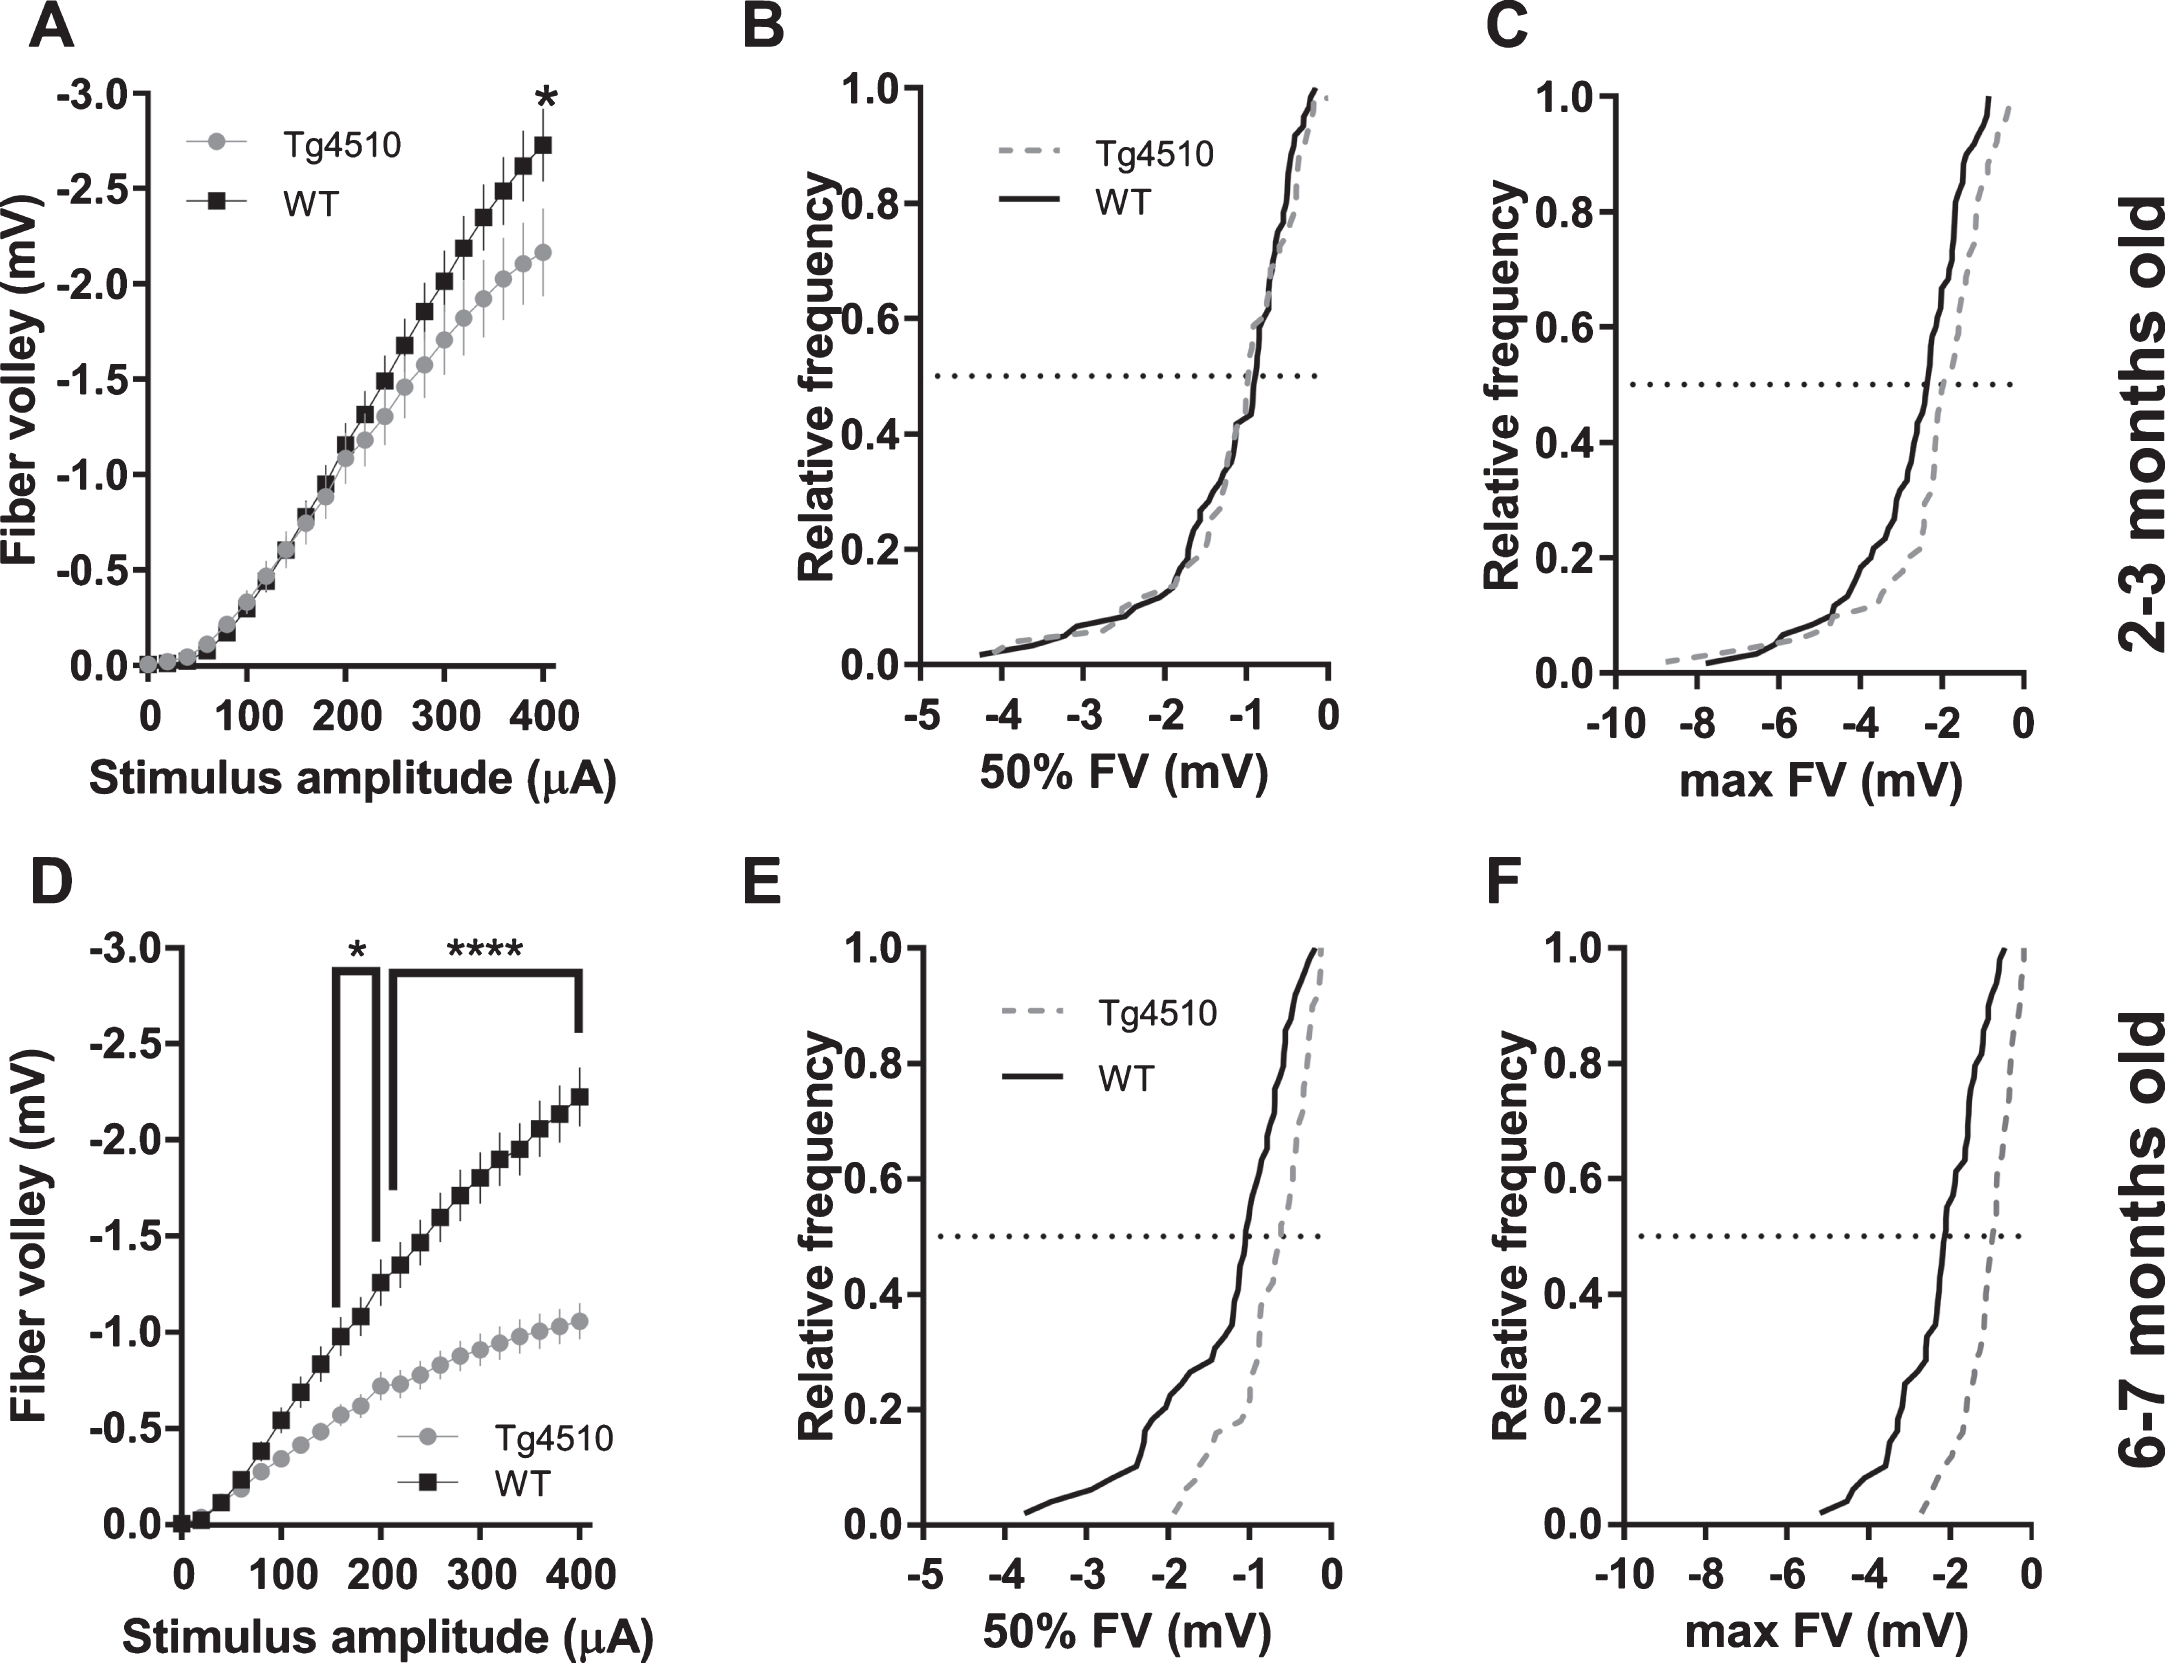
Activation (fiber volley amplitudes) of Schaffer collaterals in CA1 area in rTg4510 mice. A) FV amplitudes plotted against stimulus amplitude from 2-3-month-old mice (WT n = 60 slices from 9 animals; rTg4510 n = 51 slices from 8 animals; (2-way ANOVA; genotype: F(1, 2289) = 17.06, p < 0.0001; stimulus amplitude: F(20, 2289) = 88.61, p < 0.0001; interaction: F(20, 2289) = 1.249, p = 0.2037; asterisk indicates result of Bonferroni’s multiple comparisons test). B) Cumulative distribution histogram of FVs elicited with a 50% stimulus amplitude (200μA) in 2-3-month-old animals (K-S test, D = 0.1353, p = 0.6939). C) Cumulative distribution histogram of FVs elicited with a 100% stimulus amplitude (400μA) in 2-3-month-old animals (K-S test, D = 0.2725, p = 0.0333). D) FV amplitudes plotted against stimulus amplitude from 6-7-month-old mice (WT n = 49 slices from 9 animals; rTg4510 n = 50 slices from 8 animals; (2-way ANOVA; genotype: F(1, 2037) = 410.3, p < 0.0001; stimulus amplitude: F(20, 2037) = 78.24, p < 0.0001; interaction: F(20, 2037) = 10.55, p < 0.0001; asterisks indicate result of Bonferroni’s multiple comparisons test). E) Cumulative distribution histogram of FVs elicited with a 50% stimulus amplitude (200μA) in 6-7-month-old animals (K-S test, D = 0.351, p = 0.0045). F) Cumulative distribution histogram of FVs elicited with a 100% stimulus amplitude (400μA) in 6-7-month-old animals (K-S test, D = 0.5371, p < 0.0001).
Synaptic transmission in 2-3-month-old APP/PS1 mice was not different from WT controls, as can be seen from fEPSP slope input-output curves and cumulative distributions of responses elicited by stimulus amplitudes of 50% and 100% of maximum (Fig. 4A-C). Older mice (8–10 mo) showed ∼34% reduction in fEPSP slope at maximum stimulus amplitude (Fig. 4D, see figure legend for statistical details). Cumulative distributions of APP/PS1 fEPSP slopes at 50% (200μA) and 100% (400μA) of stimulus amplitude were shifted to smaller values compared to WT controls (Fig. 4E, F). In stark contrast to rTg4510 mice, APP/PS1 mice exhibited no change in fiber volley amplitude either at 2-3 months or 8–10 months of age (Fig. 5).
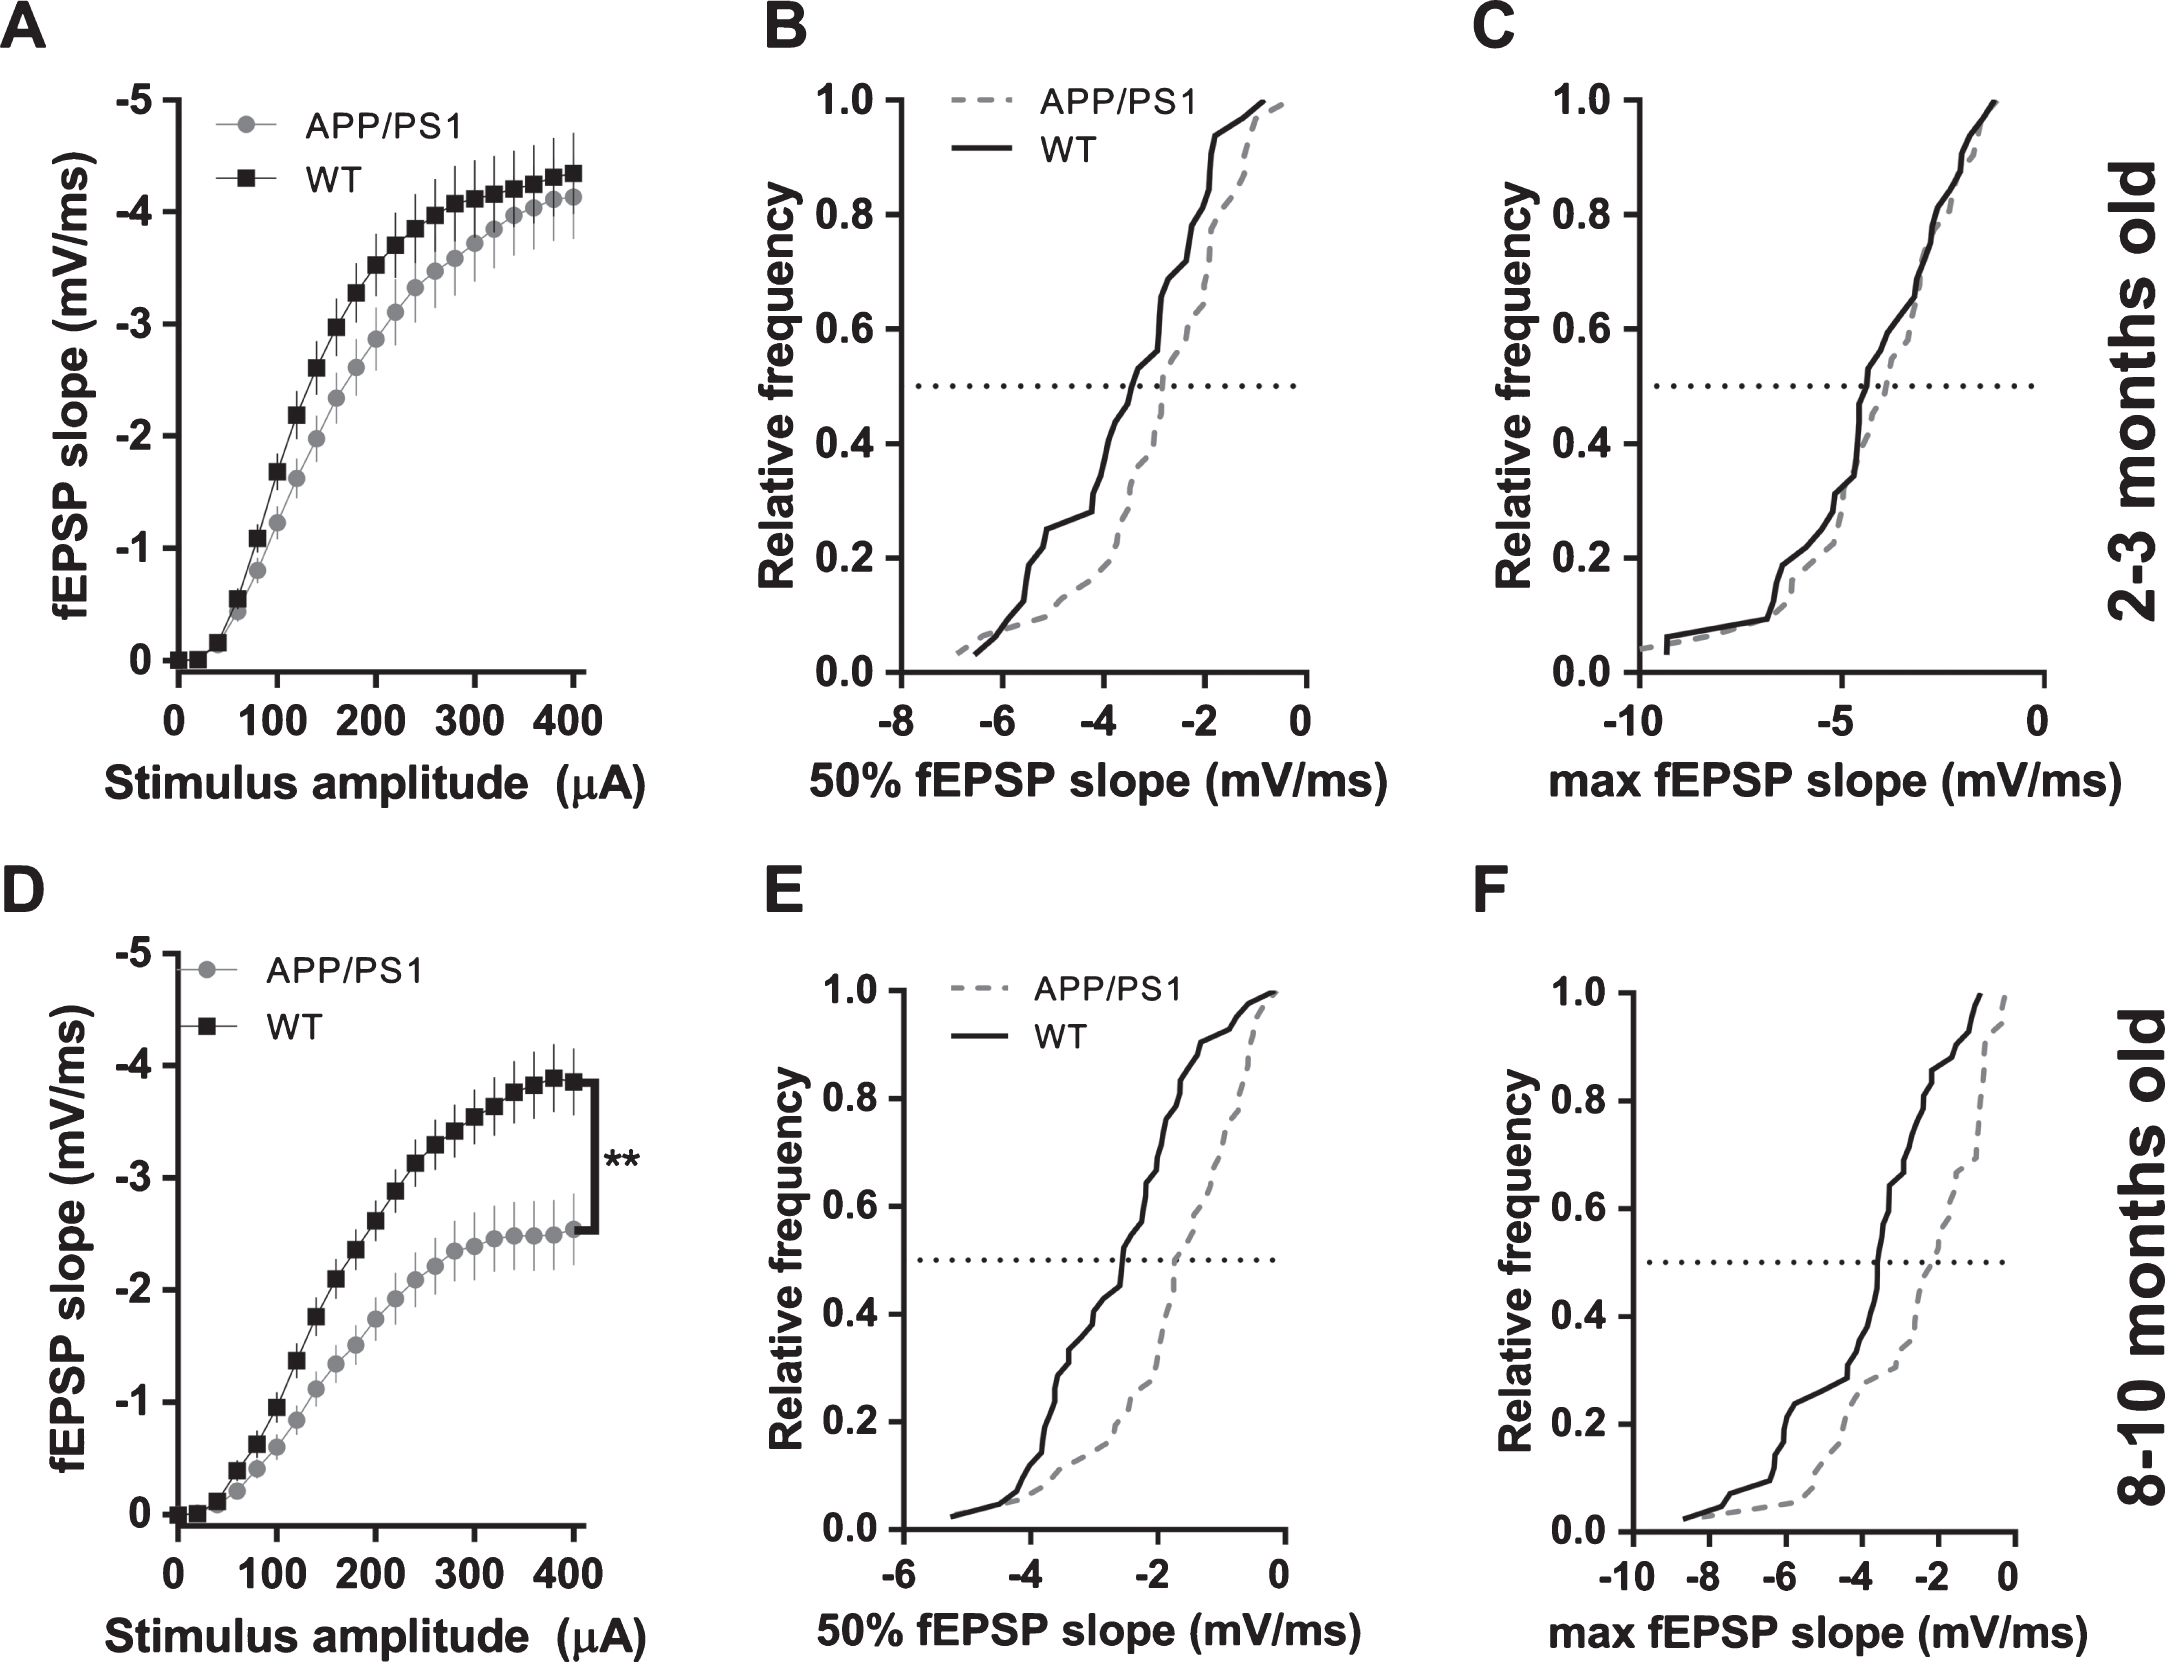
Post-synaptic responses in CA1 pyramidal cells of hippocampus elicited with Schaffer collaterals stimulation in APP/PS1 mice. A) fEPSP slopes plotted against stimulus amplitude from 2-3-month-old mice (WT n = 32 slices from 10 animals; APP/PS1 n = 30 slices from 10 animals; 2-way ANOVA; genotype: F(1, 1281) = 20.45, p < 0.0001; stimulus amplitude: F(20, 1281) = 67.81, p < 0.0001; interaction: F(20, 1281) = 0.3723, p = 0.9948; asterisk indicates result of Bonferroni’s multiple comparisons test). B) Cumulative distribution histogram of responses (fEPSP slopes) elicited with a 50% stimulus amplitude (200μA) in 2-3-month-old animals (K-S test, D = 0.245, p = 0.3012). C) Cumulative distribution histogram of responses (fEPSP slopes) elicited with a 100% stimulus amplitude (400μA) in 2-3-month-old animals (K-S test, D = 0.1442, p = 0.8990). D) fEPSP slopes plotted against stimulus amplitude from 8–10-month-old mice (WT n = 42 slices from 10 animals; APP/PS1 n = 36 slices from 9 animals; (2-way ANOVA; genotype: F(1, 1596) = 148.8, p < 0.0001; stimulus amplitude: F(20, 1596) = 67.45, p < 0.0001; interaction: F(20, 1596) = 2.692, p < 0.0001; asterisks indicate result of Bonferroni’s multiple comparisons test). E) Cumulative distribution histogram of responses (fEPSP slopes) elicited with a 50% stimulus amplitude (200μA) in 8–10-month-old animals (K-S test, D = 0.3929, p = 0.0050). F) Cumulative distribution histogram of responses (fEPSP slopes) elicited with a 100% stimulus amplitude (400μA) in 8–10-month-old animals (K-S test, D = 0.4048, p = 0.0035).
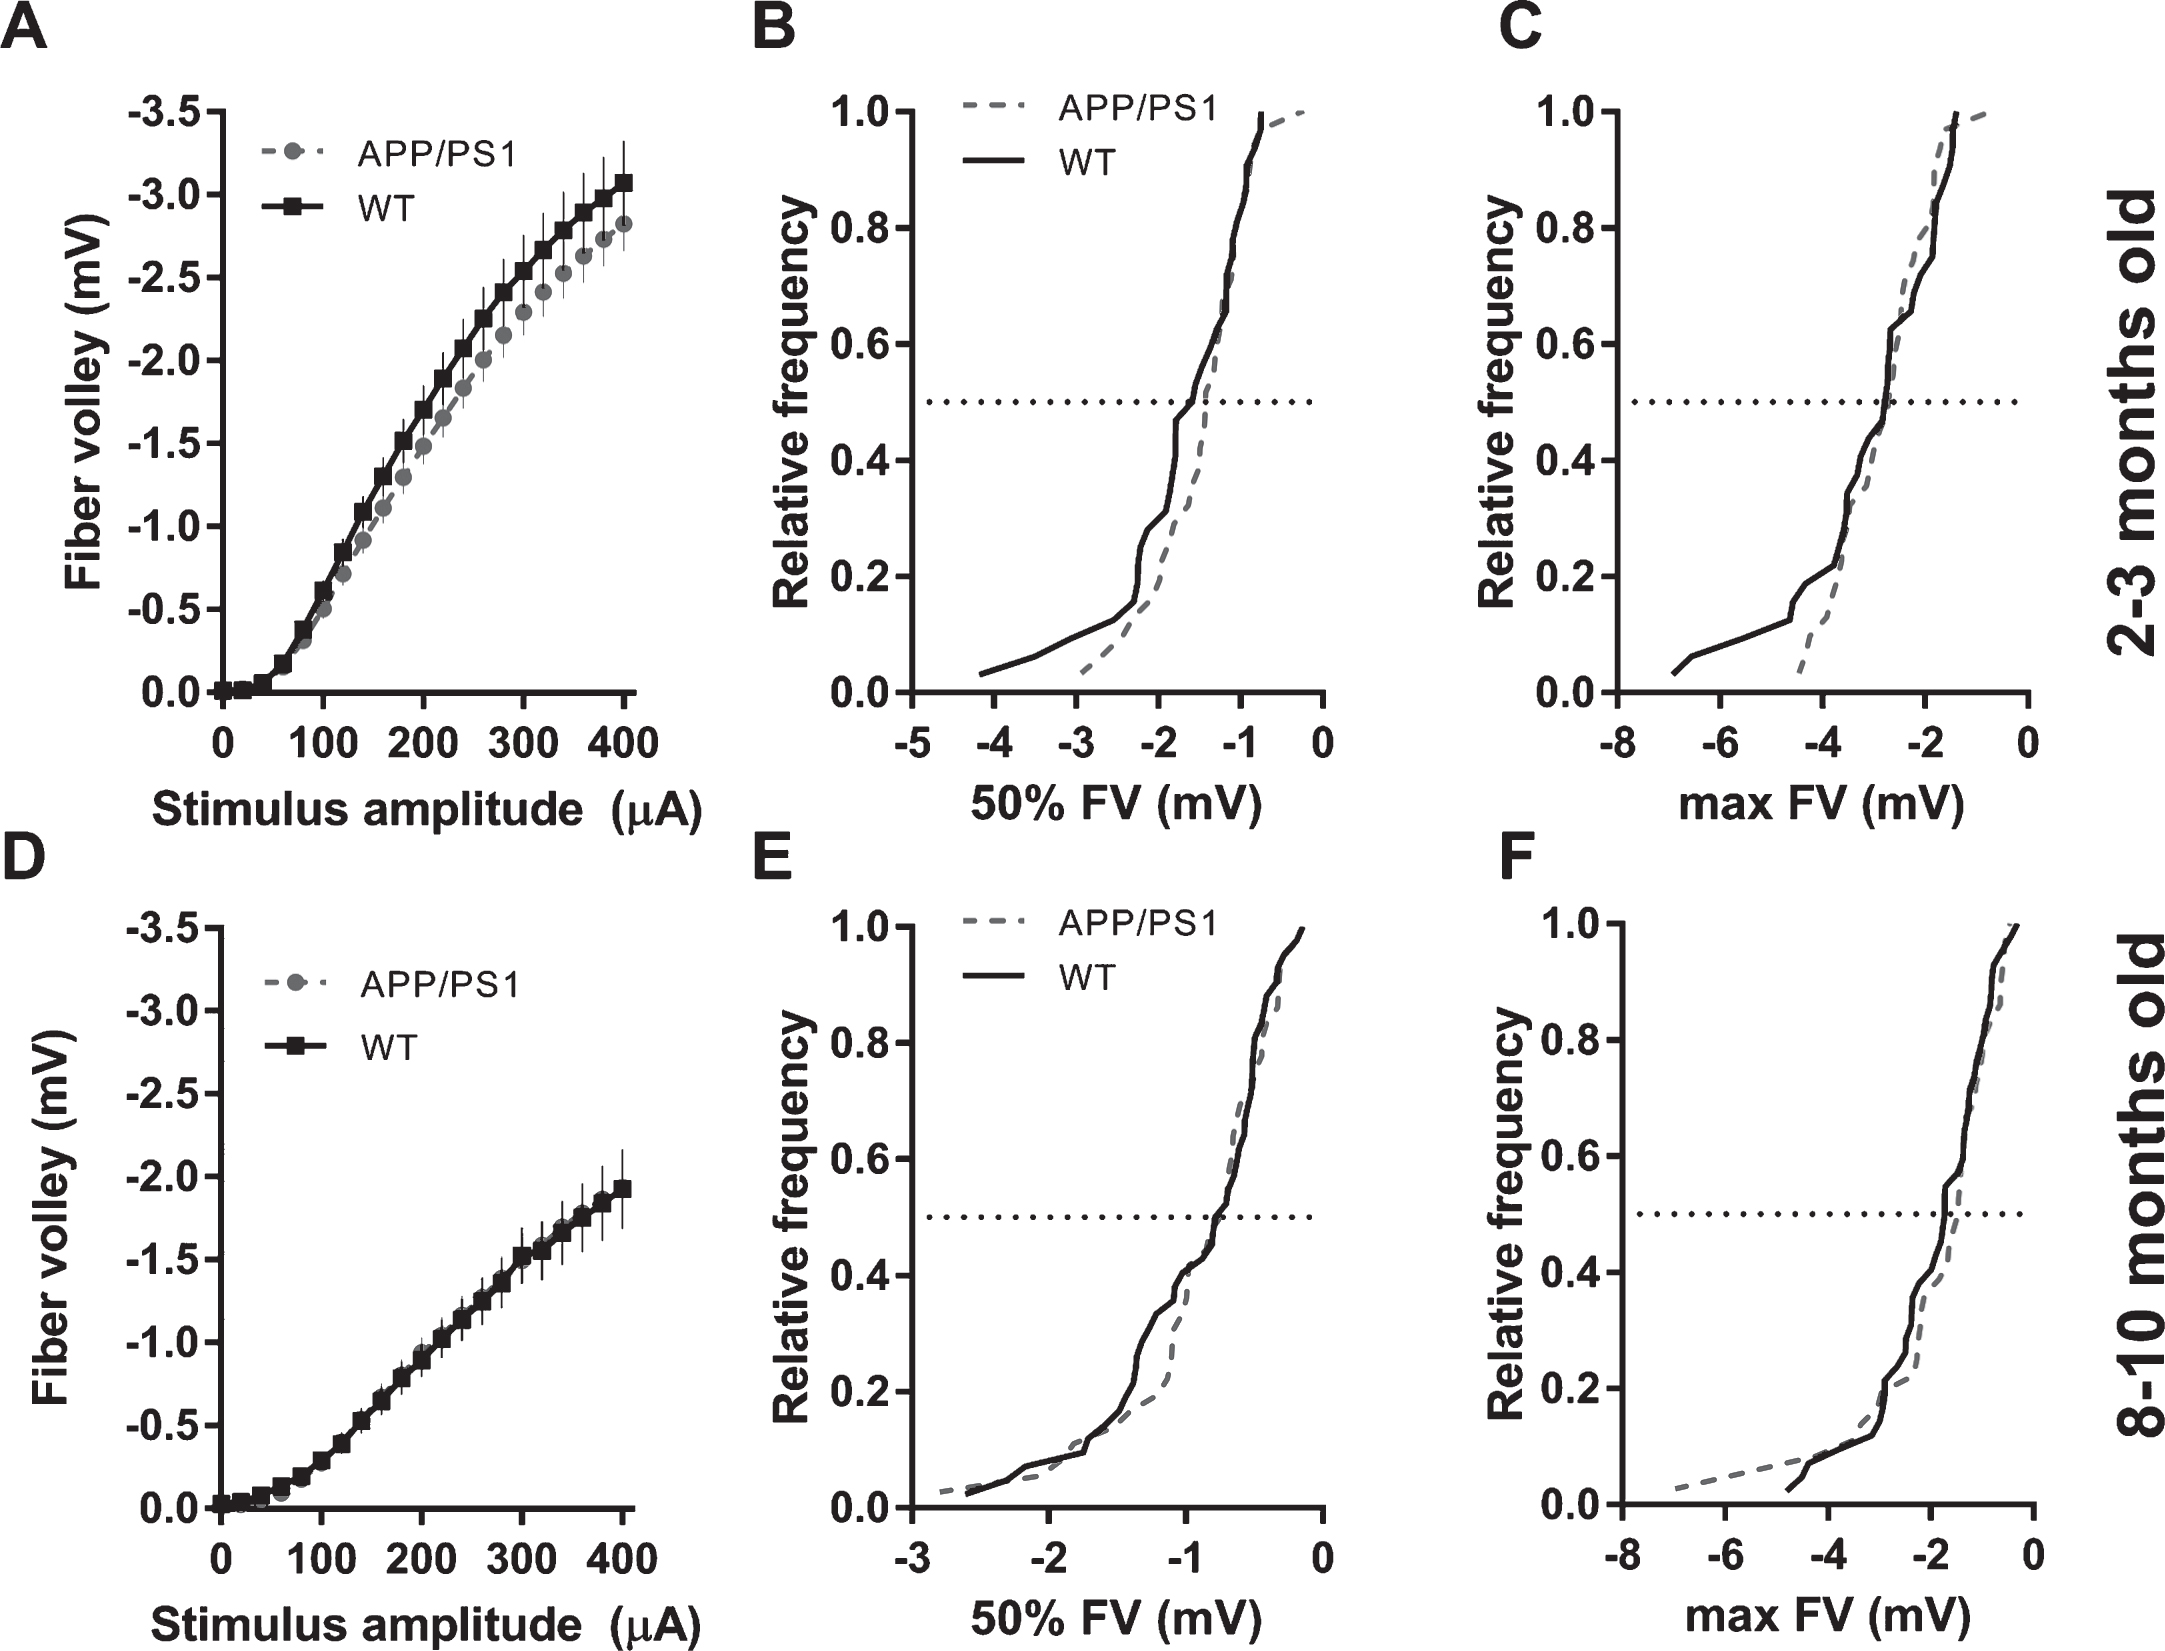
Activation (fiber volley amplitudes) of Schaffer collaterals in CA1 area in APP/PS1 mice. A) FV amplitudes plotted against stimulus amplitude from 2-3-month-old mice (WT n = 32 slices from 10 animals; APP/PS1 n = 31 slices from 10 animals; (2-way ANOVA; genotype: F(1, 1281) = 1728, p < 0.0001; stimulus amplitude: F(20, 1281) = 114.2, p < 0.0001; interaction: F(20, 1281) = 0.267, p = 0.995;). B) Cumulative distribution histogram of FVs elicited with a 50% stimulus amplitude (200μA) in 2-3-month-old animals (K-S test, D = 0.1784, p = 0.6978). C) Cumulative distribution histogram of FVs elicited with a 100% stimulus amplitude (400μA) in 2-3-month-old animals (K-S test, D = 0.1563, p = 0.8367). D) FV amplitudes plotted against stimulus amplitude from 8–10-month-old mice (WT n = 42 slices from 10 animals; APP/PS1 n = 36 slices from 9 animals; (2-way ANOVA; genotype: F(1, 1592) = 0.068, p = 0.7943; stimulus amplitude: F(20, 1592) = 64.19, p < 0.0001; interaction: F(20, 1592) = 0.0241, p > 0.9999;). E) Cumulative distribution histogram of FVs elicited with a 50% stimulus amplitude (200μA) in 8–10-month-old animals (K-S test, D = 0.1667, p = 0.6545). F) Cumulative distribution histogram of FVs elicited with a 100% stimulus amplitude (400μA) in 8–10-month-old animals (K-S test, D = 0.1627, p < 0.6839).
A clear difference of the effect of P301L (rTg4510) and APP/PS1 mutations on basal synaptic transmission emerged, when fEPSP slopes were plotted against fiber volley amplitudes. At 2-3 months of age, basal synaptic transmission was not effected in rTg4510 and APP/PS1 mice (Fig. 6A, C). However, 8–10-month-old APP/PS1 showed marked reduction of basal synaptic transmission, in contrast to unchanged BST in rTg4510 mice (Fig. 6B, D). In 6-7-month-old rTg4510 mice, observed reduction in fEPSP slope was correlated with the reduction of fiber volley amplitude (Figs. 2D and 3D). Controlling for this reduction by plotting fEPSP slope versus fiber volley amplitude eliminated an apparent deficit in BST (fEPSP slope versus fiber volley) (Fig. 6B). However, in 8–10-month-old APP/PS1 mice, reduction of fEPSP slope was not correlated with fiber volley amplitude, which was not changed, and therefore, when fEPSP slope was plotted against fiber volley amplitude, a genuine deficit in BST was observed (Fig. 6D). This deficit was increased in 24-month-old APP/PS1 with both reduction in fEPSP slope and FV amplitude (Fig. 7). Additionally, we compared the time course of the effects of APP/PS1 and rTg4510 mutations on fEPSP slopes, fiber volley amplitudes and basal synaptic transmission (i.e., fEPSP slopes controlled for fiber volley amplitudes). Figure 8A shows a comparable reduction with age of fEPSP slopes normalized to an age-corresponding WT controls in APP/PS1 and rTg4510 mice. However, as seen in Fig. 8B, fiber volley amplitudes exhibited a much faster decline in rTg4510 mice compared to APP/PS1 mice. When fEPSP slopes were controlled for fiber volley amplitudes, a clear distinction in time course of basal synaptic transmission deterioration emerged between APP/PS1 and rTg4510 mice (Fig. 8C). The initial decline in BST between 3 and 10 months of age is much faster in APP/PS1 mice compared to rTg4510 mice, as indicated by linear fits to the first two age points (Fig. 8C).
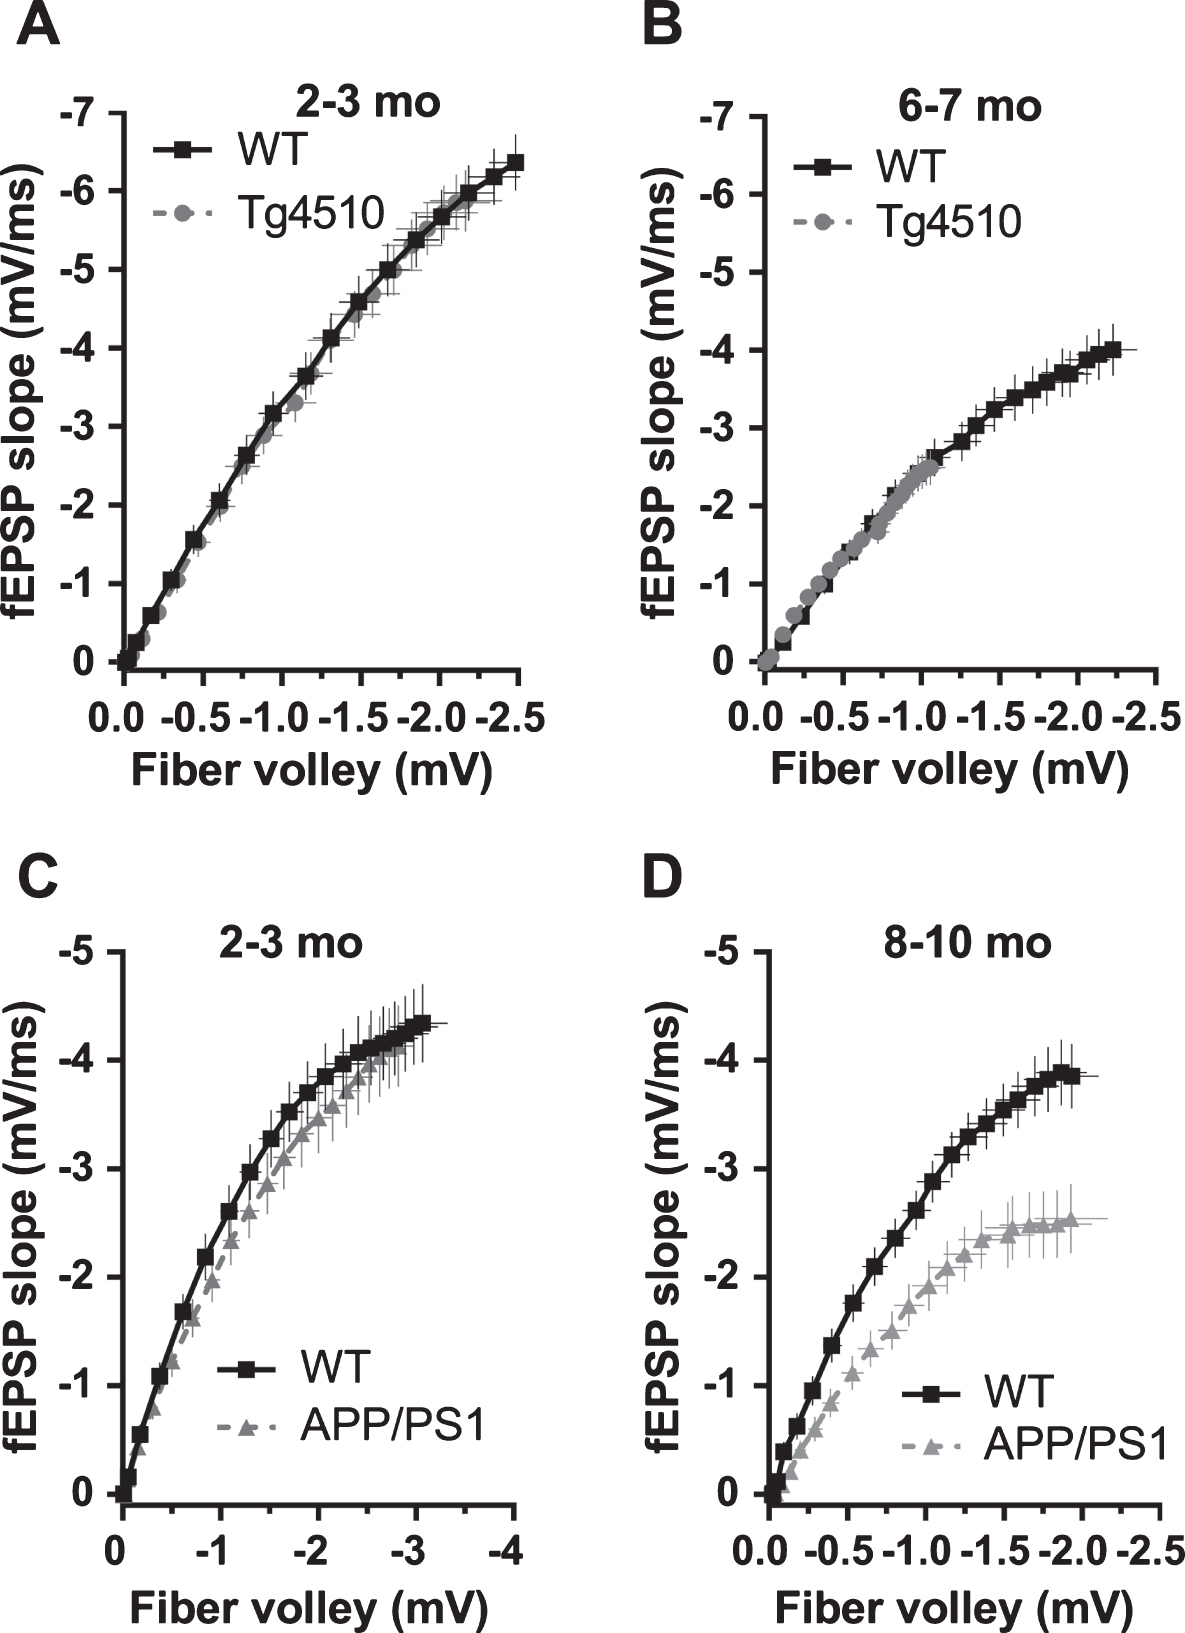
Effect of rTg4510 and APP/PS1 mutations on basal synaptic transmission. fEPSP slopes were plotted against fiber volley amplitudes. A) 2-3-month-old rTg4510 and WT controls. B) 6-7-month-old rTg4510 and WT controls. C) 2-3-month-old APP/PS1 and WT controls. D) 8–10-month-old APP/PS1 and WT controls. Note that only 8–10-month-old APP/PS1 mice exhibit a genuine reduction in basal synaptic transmission when post-synaptic responses (fEPSP slopes) were controlled for the strength of the pre-synaptic fiber activation (FV amplitude). Data comes from Figs. 1–4. Data is presented as mean±s.e.m.
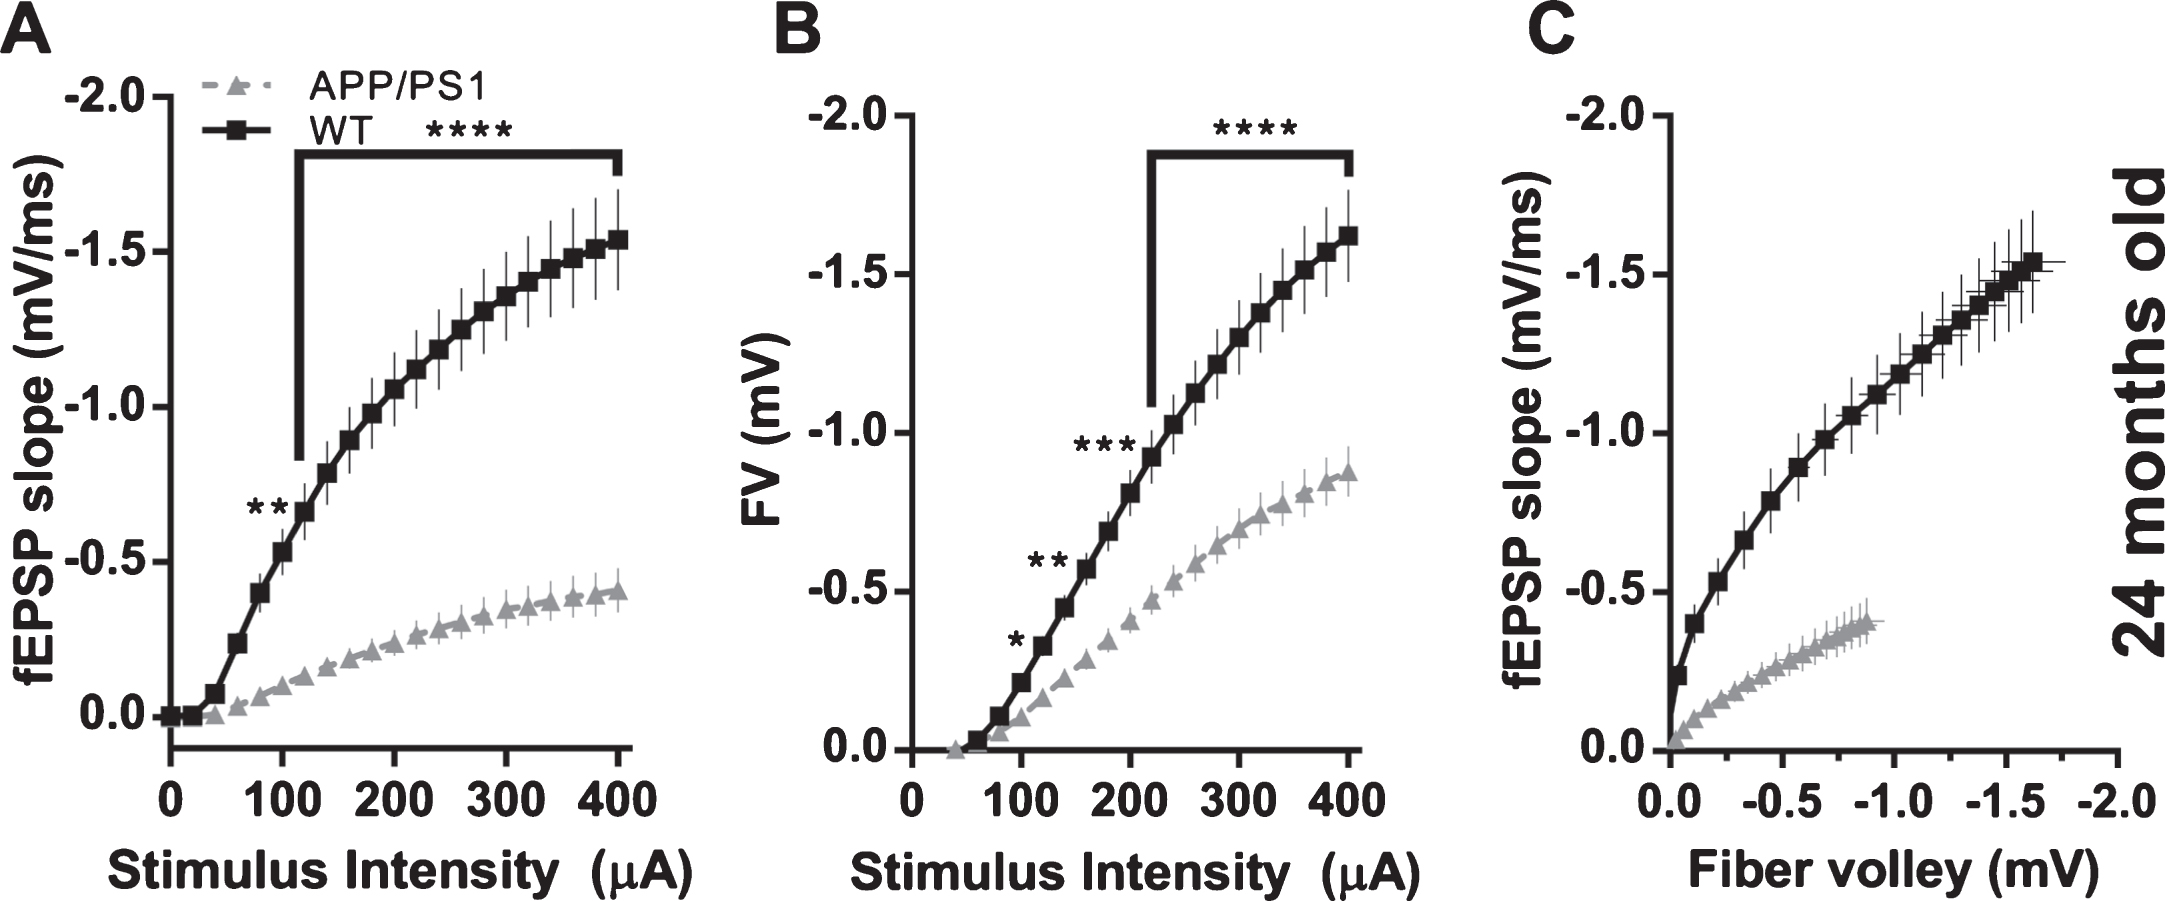
Effect of APP/PS1 mutations on basal synaptic transmission in 24-month-old mice. A) fEPSP slopes versus stimulus intensity (WT n = 33 slices from 3 animals; APP/PS1 n = 41 slices from 4 animals; 2-way ANOVA; genotype: F(1, 1512) = 778.5, p < 0.0001; stimulus amplitude: F(20, 1512) = 33.96, p < 0.0001; interaction: F(20, 1512) = 11.26, p < 0.0001; asterisks indicate results of Bonferroni’s multiple comparisons test). B) Fiber volley amplitudes versus stimulus intensity (WT n = 33 slices from 3 animals; APP/PS1 n = 41 slices from 4 animals; 2-way ANOVA; genotype: F(1, 1512) = 319.4, p < 0.0001; stimulus amplitude: F(20, 1512) = 93.74, p < 0.0001; interaction: F(20, 1512) = 8.608, p < 0.0001; asterisks indicate results of Bonferroni’s multiple comparisons test). C) fEPSP slopes versus fiber volley amplitudes.
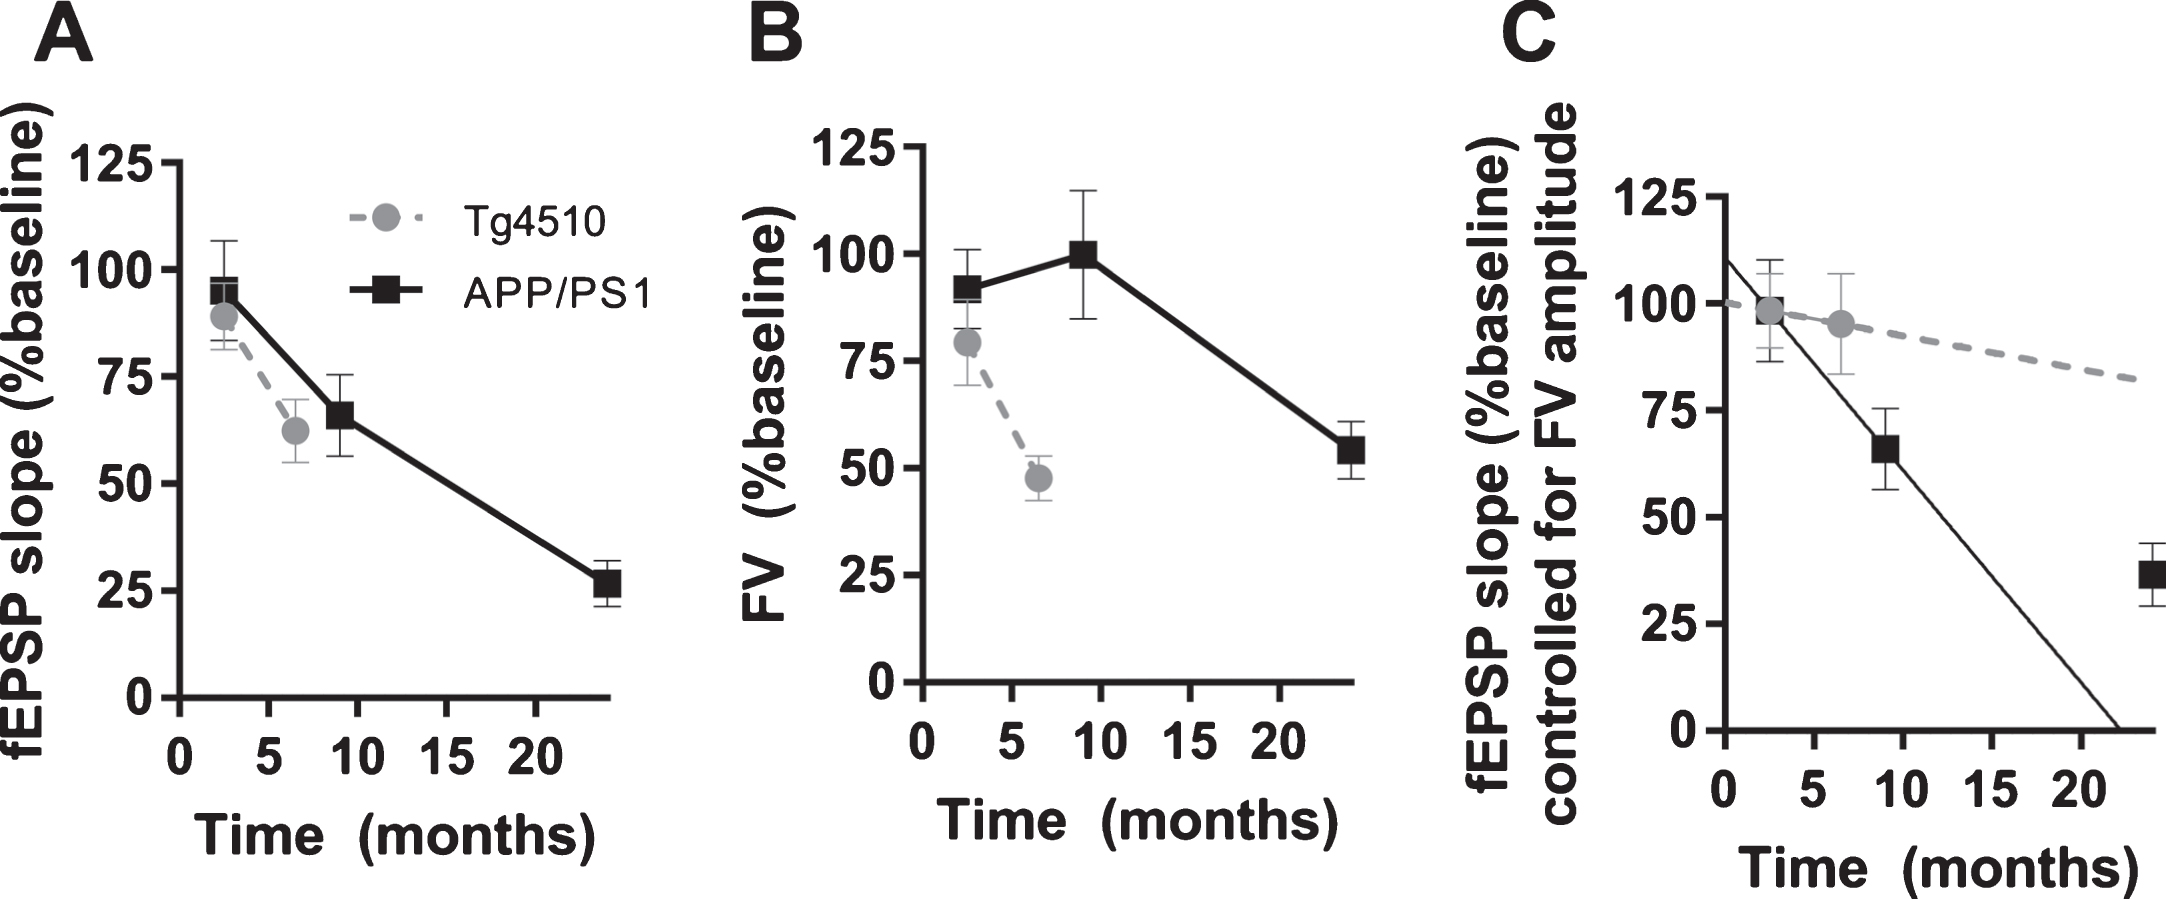
Age-progression of decline in fEPSP slopes, fiber volley amplitudes (FV) and basal synaptic transmission in APP/PS1 and Tg4510 mice. Data is from Figs. 1–4 and 6. A) fEPSP slopes were normalized to age-corresponding WT controls and plotted against age. B) Fiber volley amplitudes were normalized to age-corresponding WT controls and plotted against age. C) fEPSP slopes controlled for fiber volley amplitudes plotted against age. Lines were fitted to the first two age points to compare initial rate of decline in BST between APP/PS1 and Tg4510 mice; APP/PS1, y = –5.0x+110.8; Tg4510, y = –0.8x+100.3; slopes were significantly different, p < 0.05).
Short-term synaptic plasticity in young and old APP/PS1 and rTg4510 mice
Short-term plasticity plays a crucial role in neuronal information processing, relevant to cognitive function. We investigated CA3-CA1 short-term plasticity at different ages in rTg4510 and APP/PS1 (rTg4510 : 2-3 mo and 6-7 mo; APP/PS1 : 2-3 mo and 8–10 mo) mice utilizing paired pulse stimulation protocol. Paired stimuli were delivered with an inter-stimulus interval of 50 ms to excite Schaffer collaterals, and the resulting fEPSPs were recorded in stratum radiatum. In 2-3-month-old animals, we did not observe any genotypic difference in resulting paired pulse ratios (fEPSP2/fEPSP1; Fig. 9A, C; rTg4510, 1.38±0.04 SEM, n = 17 slices versus WT, 1.40±0.04 SEM, n = 17 slices, two-tailed t-test, p = 0.7193; APP/PS1, 1.67±0.09 SEM, n = 13 slices versus WT, 1.70±0.11 SEM, n = 15 slices, two-tailed t-test, p = 0.8550). At 6-7 months of age, rTg4510 mice showed a significant reduction in PPF compared to WT controls (Fig. 9B; rTg4510, 1.17±0.04 SEM, n = 17 slices versus WT, 1.39±0.08 SEM, n = 17 slices, two-tailed t-test, p = 0.0177). Interestingly, 8–10-month-old APP/PS1 mice did not show any deficit in PPF (APP/PS1, 1.39±0.07 SEM, n = 17 slices versus WT, 1.42±0.10 SEM, n = 17 slices, two-tailed t-test, p = 0.7936). These data suggest that P301L mutation reduces or eliminates synaptic facilitation at these synapses. On the contrary, APP/PS1 mutations do not appear to change the magnitude of facilitation at these synapses.
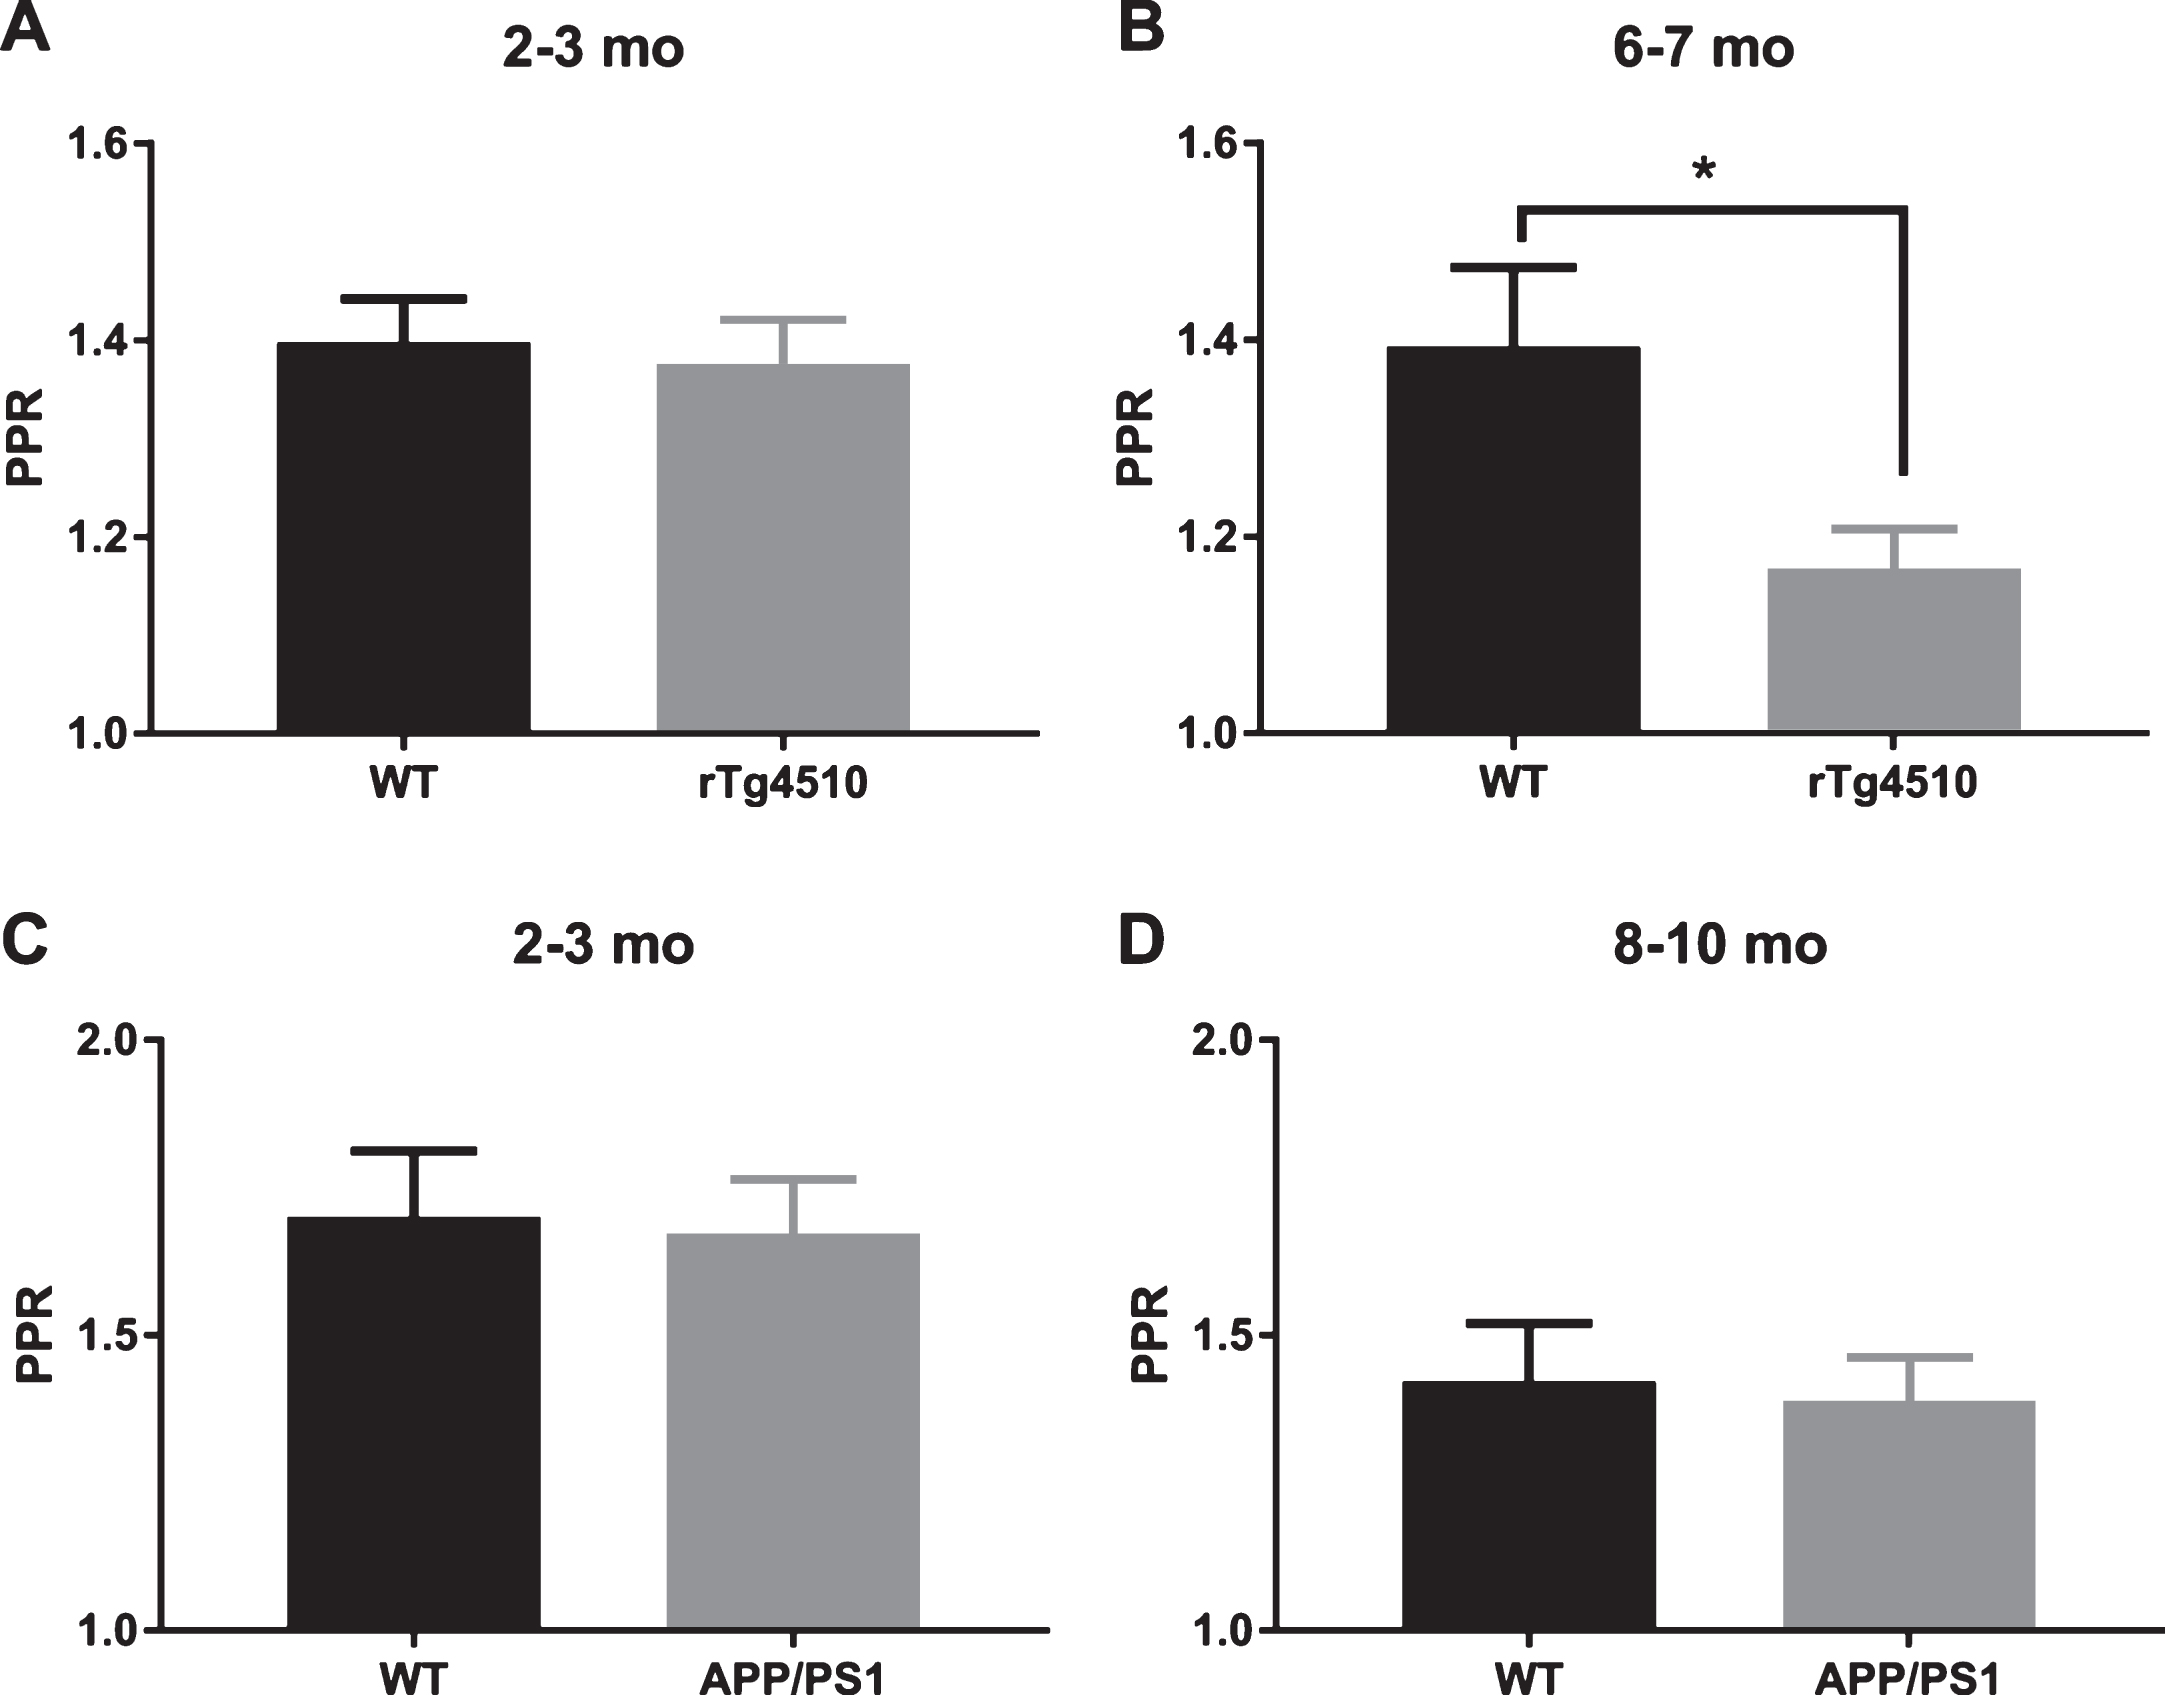
Short term facilitation in rTg4510 and APP/PS1 mice. A) 2-3-month-old rTg4510 mice do not show a deficit in paired pulse facilitation (WT: n = 17 slices from 5 animals, rTg4510: n = 17 slices from 6 animals; two-tailed t-test p = 0.7193). B) 6-7-month-old rTg4510 mice show a deficit in paired pulse facilitation (WT n = 17 slices from 6 animals, rTg4510 n = 17 slices from 5 animals; two-tailed t-test p = 0.0177). C) 2-3-month-old APP/PS1 mice do not show a deficit in paired pulse facilitation (WT n = 15 slices from 3 animals, APP/PS1 n = 13 slices from 5 animals; two-tailed t-test p = 0.8550). D) 8–10-month-old APP/PS1 mice do not show a deficit in paired pulse facilitation (WT n = 17 slices from 6 animals, APP/PS1 n = 17 slices from 5 animals; two-tailed t-test p = 0.7936).
Long-term potentiation in young and old APP/PS1 and rTg4510 mice
Loss of memory is a hallmark of AD. It is widely believed that hippocampal long-term potentiation is a cellular/molecular correlate of memory. We induced CA3-CA1 LTP at different ages in rTg4510 and APP/PS1 (rTg4510 : 2-3 mo and 6-7 mo; APP/PS1 : 2-3 mo and 8–10 mo) mice with high-frequency stimulation protocol (HFS). Slices prepared from hippocampi of 2-3-month-old rTg4510 mice and WT controls exhibited 50% fEPSP slope potentiation after 60 min post last HFS bout, compared to baseline responses (WT: 149.6% ±5.6 SEM, n = 29 slices; rTg4510 : 151.6% ±4.6 SEM, n = 29 slices). At this age, rTg4510 mice did not show any deficit in LTP compared to WT controls (Fig. 10A, two-tailed t-test, p = 0.7527). In contrast to young mice, slices prepared from older (6-7 mo) rTg4510 mice exhibited 30% reduction in LTP after 60 min post last HFS bout, compared to WT controls, which had LTP levels of 50% above baseline (Fig. 10B; WT: 148.4% ±9.3 SEM, n = 18 slices; rTg4510 : 117.5% ±7.0 SEM, n = 13 slices; two-tailed t-test, p = 0.0199). Similarly, slices from young (2-3 mo) APP/PS1 mice did not show LTP deficit compared to WT controls, with both groups potentiating to more than 50% above baseline (Fig. 11A; WT: 159.1% ±7.2 SEM, n = 31 slices; APP/PS1 : 153.0% ±4.9 SEM, n = 30 slices; two-tailed t-test, p = 0.4819). On the contrary, older (8–10 mo) APP/PS1 mice exhibited almost no potentiation after 60 min post last HFS bout (Fig. 11B; APP/PS1 : 108.1% ±8.4 SEM, n = 11 slices). Slices prepared from WT controls of this age group showed a normal (>50%) LTP (Fig. 11B; WT: 158.6% ±15.4 SEM, n = 12 slices; APP/PS1 versus WT: two-tailed t-test, p = 0.0107). Interestingly, 8–10-month-old APP/PS1 mice also showed a reduced post-tetanic potentiation compared to WT, suggesting that LTP reduction could be due to induction deficits. In summary, our data suggest that in young mice (2-3 mo) neither APP/PS1 nor P301L (rTg4510) mutations produce a deficit in LTP. However, with progression of pathology, LTP deficits appear to emerge, though probably due to different underlying mechanisms. The magnitude of the deficit was found to be similar in 6-7-month-old rTg4510 mice and 8–10-month-old APP/PS1 mice.
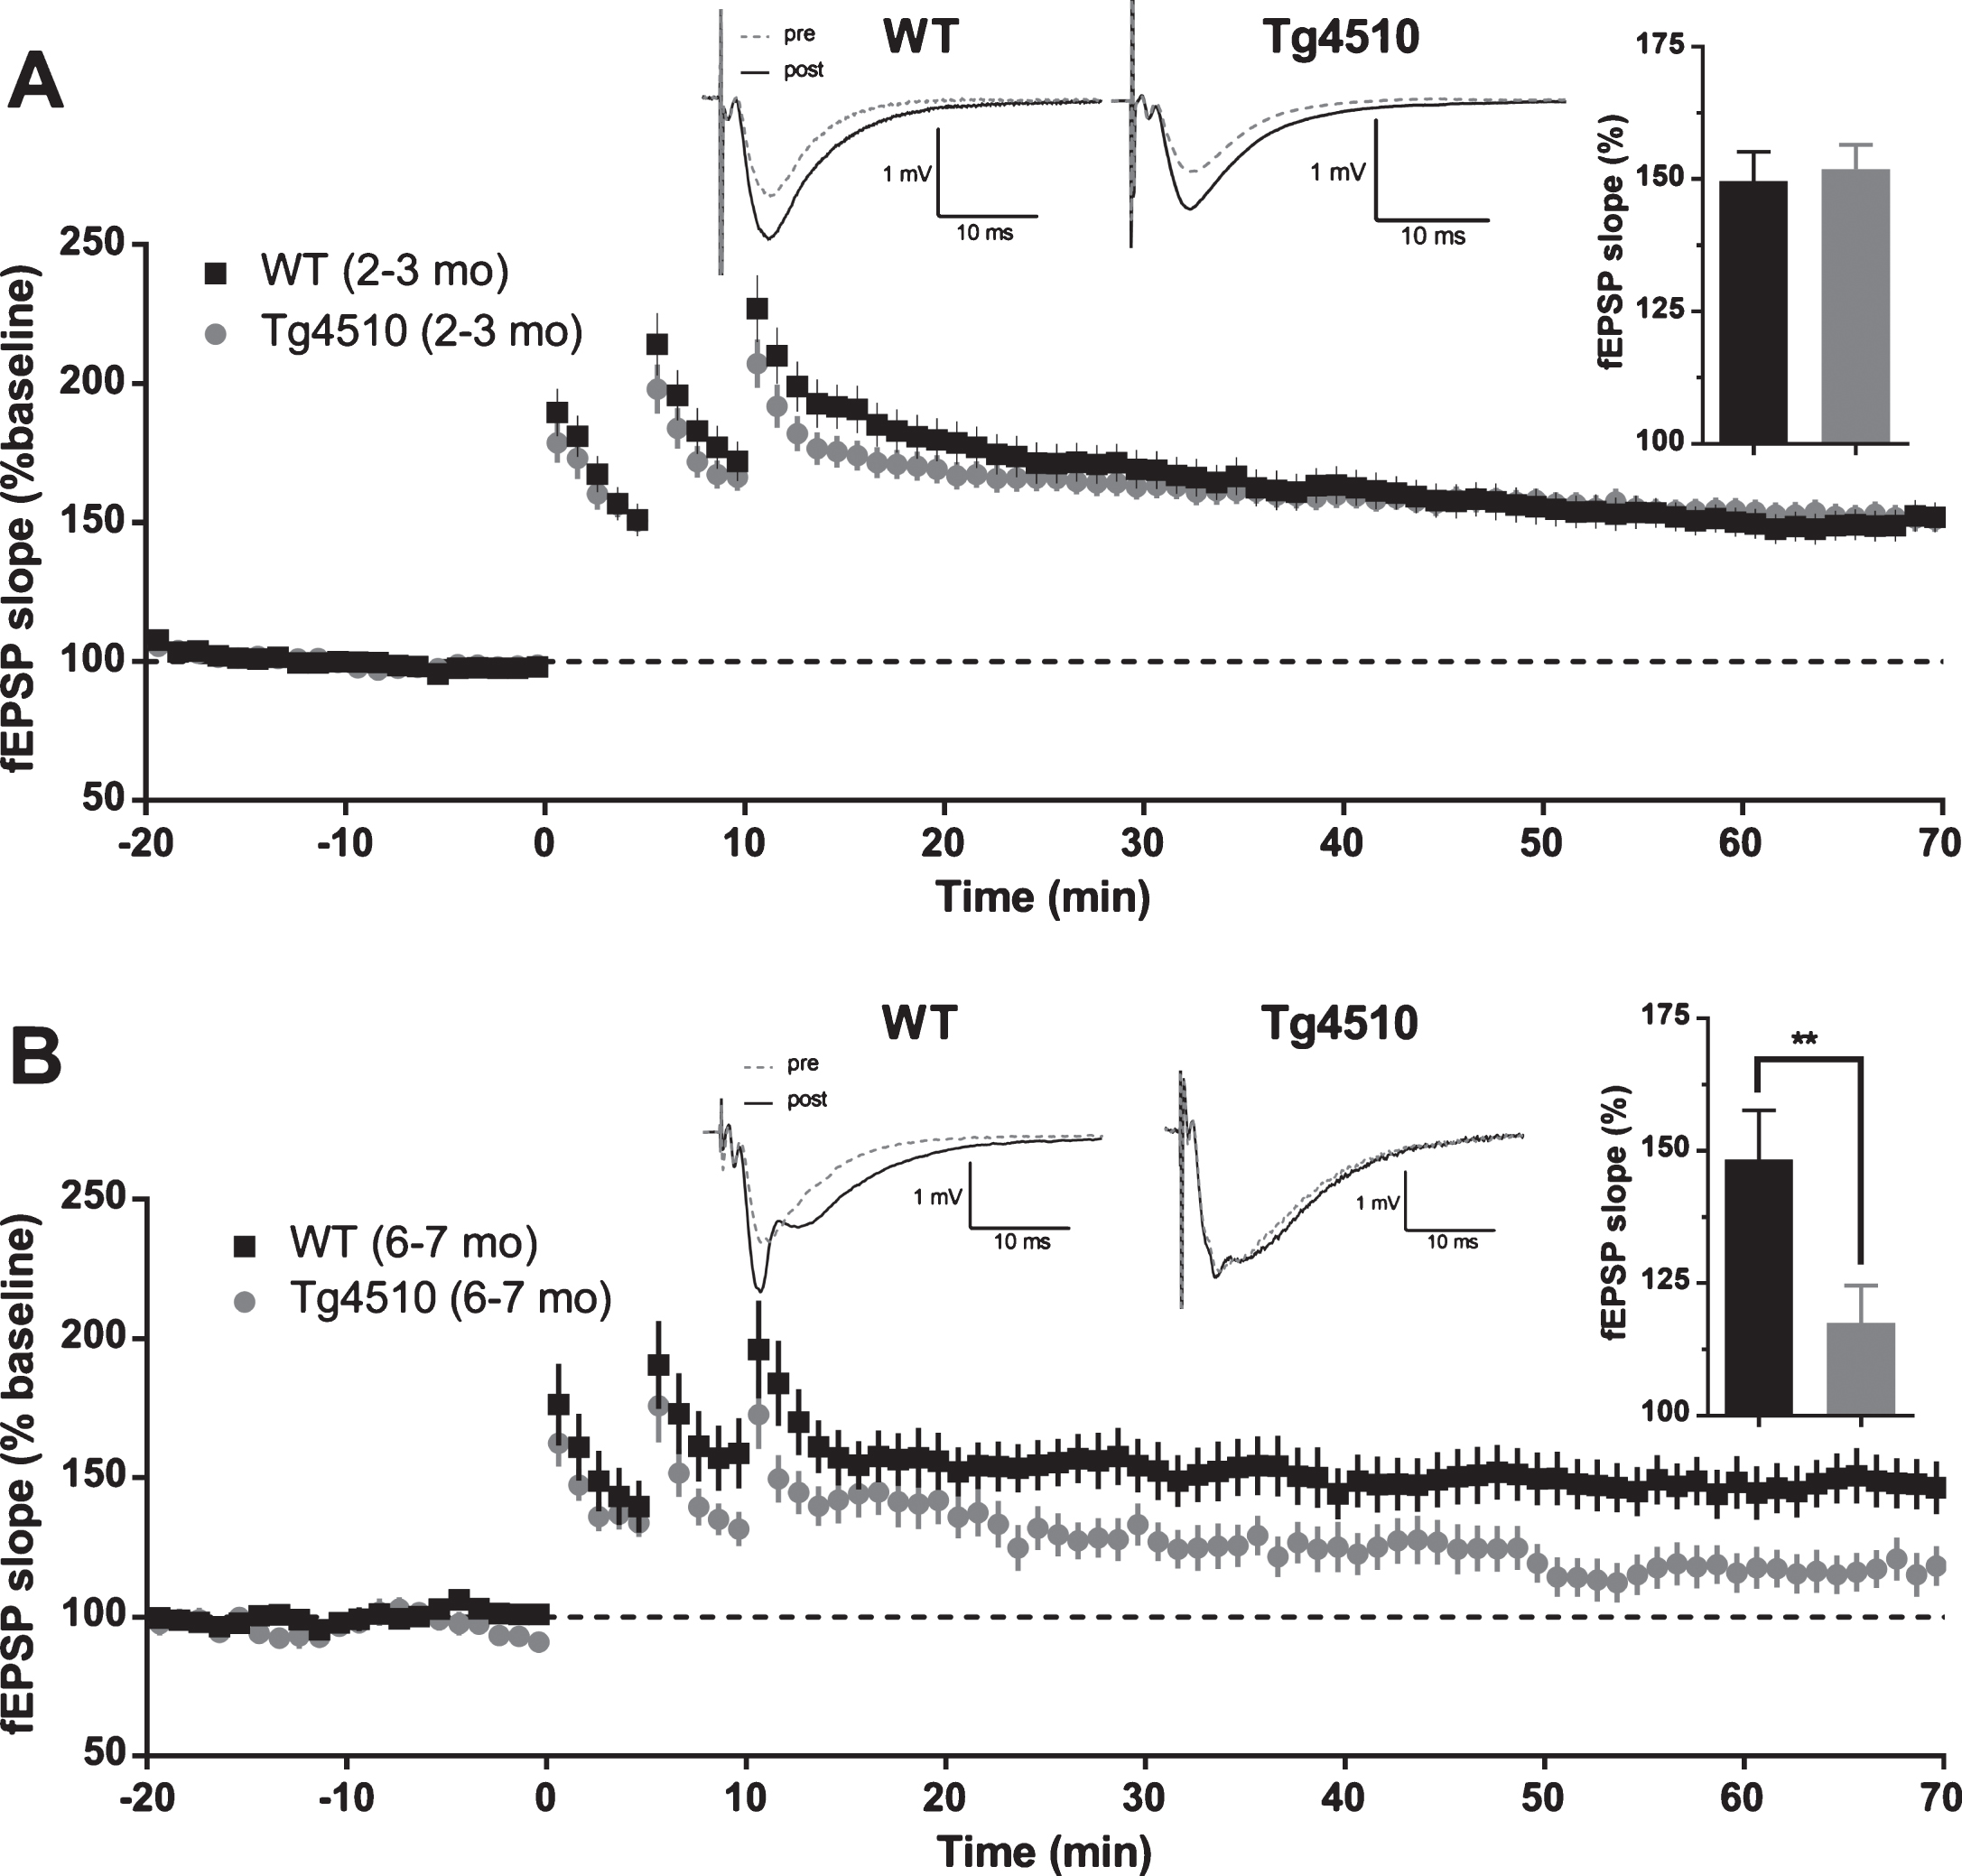
Long-term potentiation (LTP) in rTg4510 mice. A) Average baseline-normalized time course of long term potentiation of fEPSP slope in response to high frequency stimulation in 2-3-month-old rTg4510 mice. Example traces represent averaged responses (4 traces) before HFS and at 60 min post last HFS bout. (Inset). Averaged normalized response from the last 5 min of recordings (WT n = 29 slices from 9 animals; rTg4510 n = 29 slices from 9 animals; two-tailed t-test p = 0.7527). B) Average baseline-normalized time course of long term potentiation of fEPSP slope in response to high frequency stimulation in 6-7-month-old rTg4510 mice. Example traces represent averaged responses (4 traces) before HFS and at 60 min post last HFS bout. (Inset). Averaged normalized response from the last 5 min of recordings (WT n = 18 slices from 7 animals; rTg4510 n = 13 slices from 7 animals; two-tailed t-test p = 0.0199).
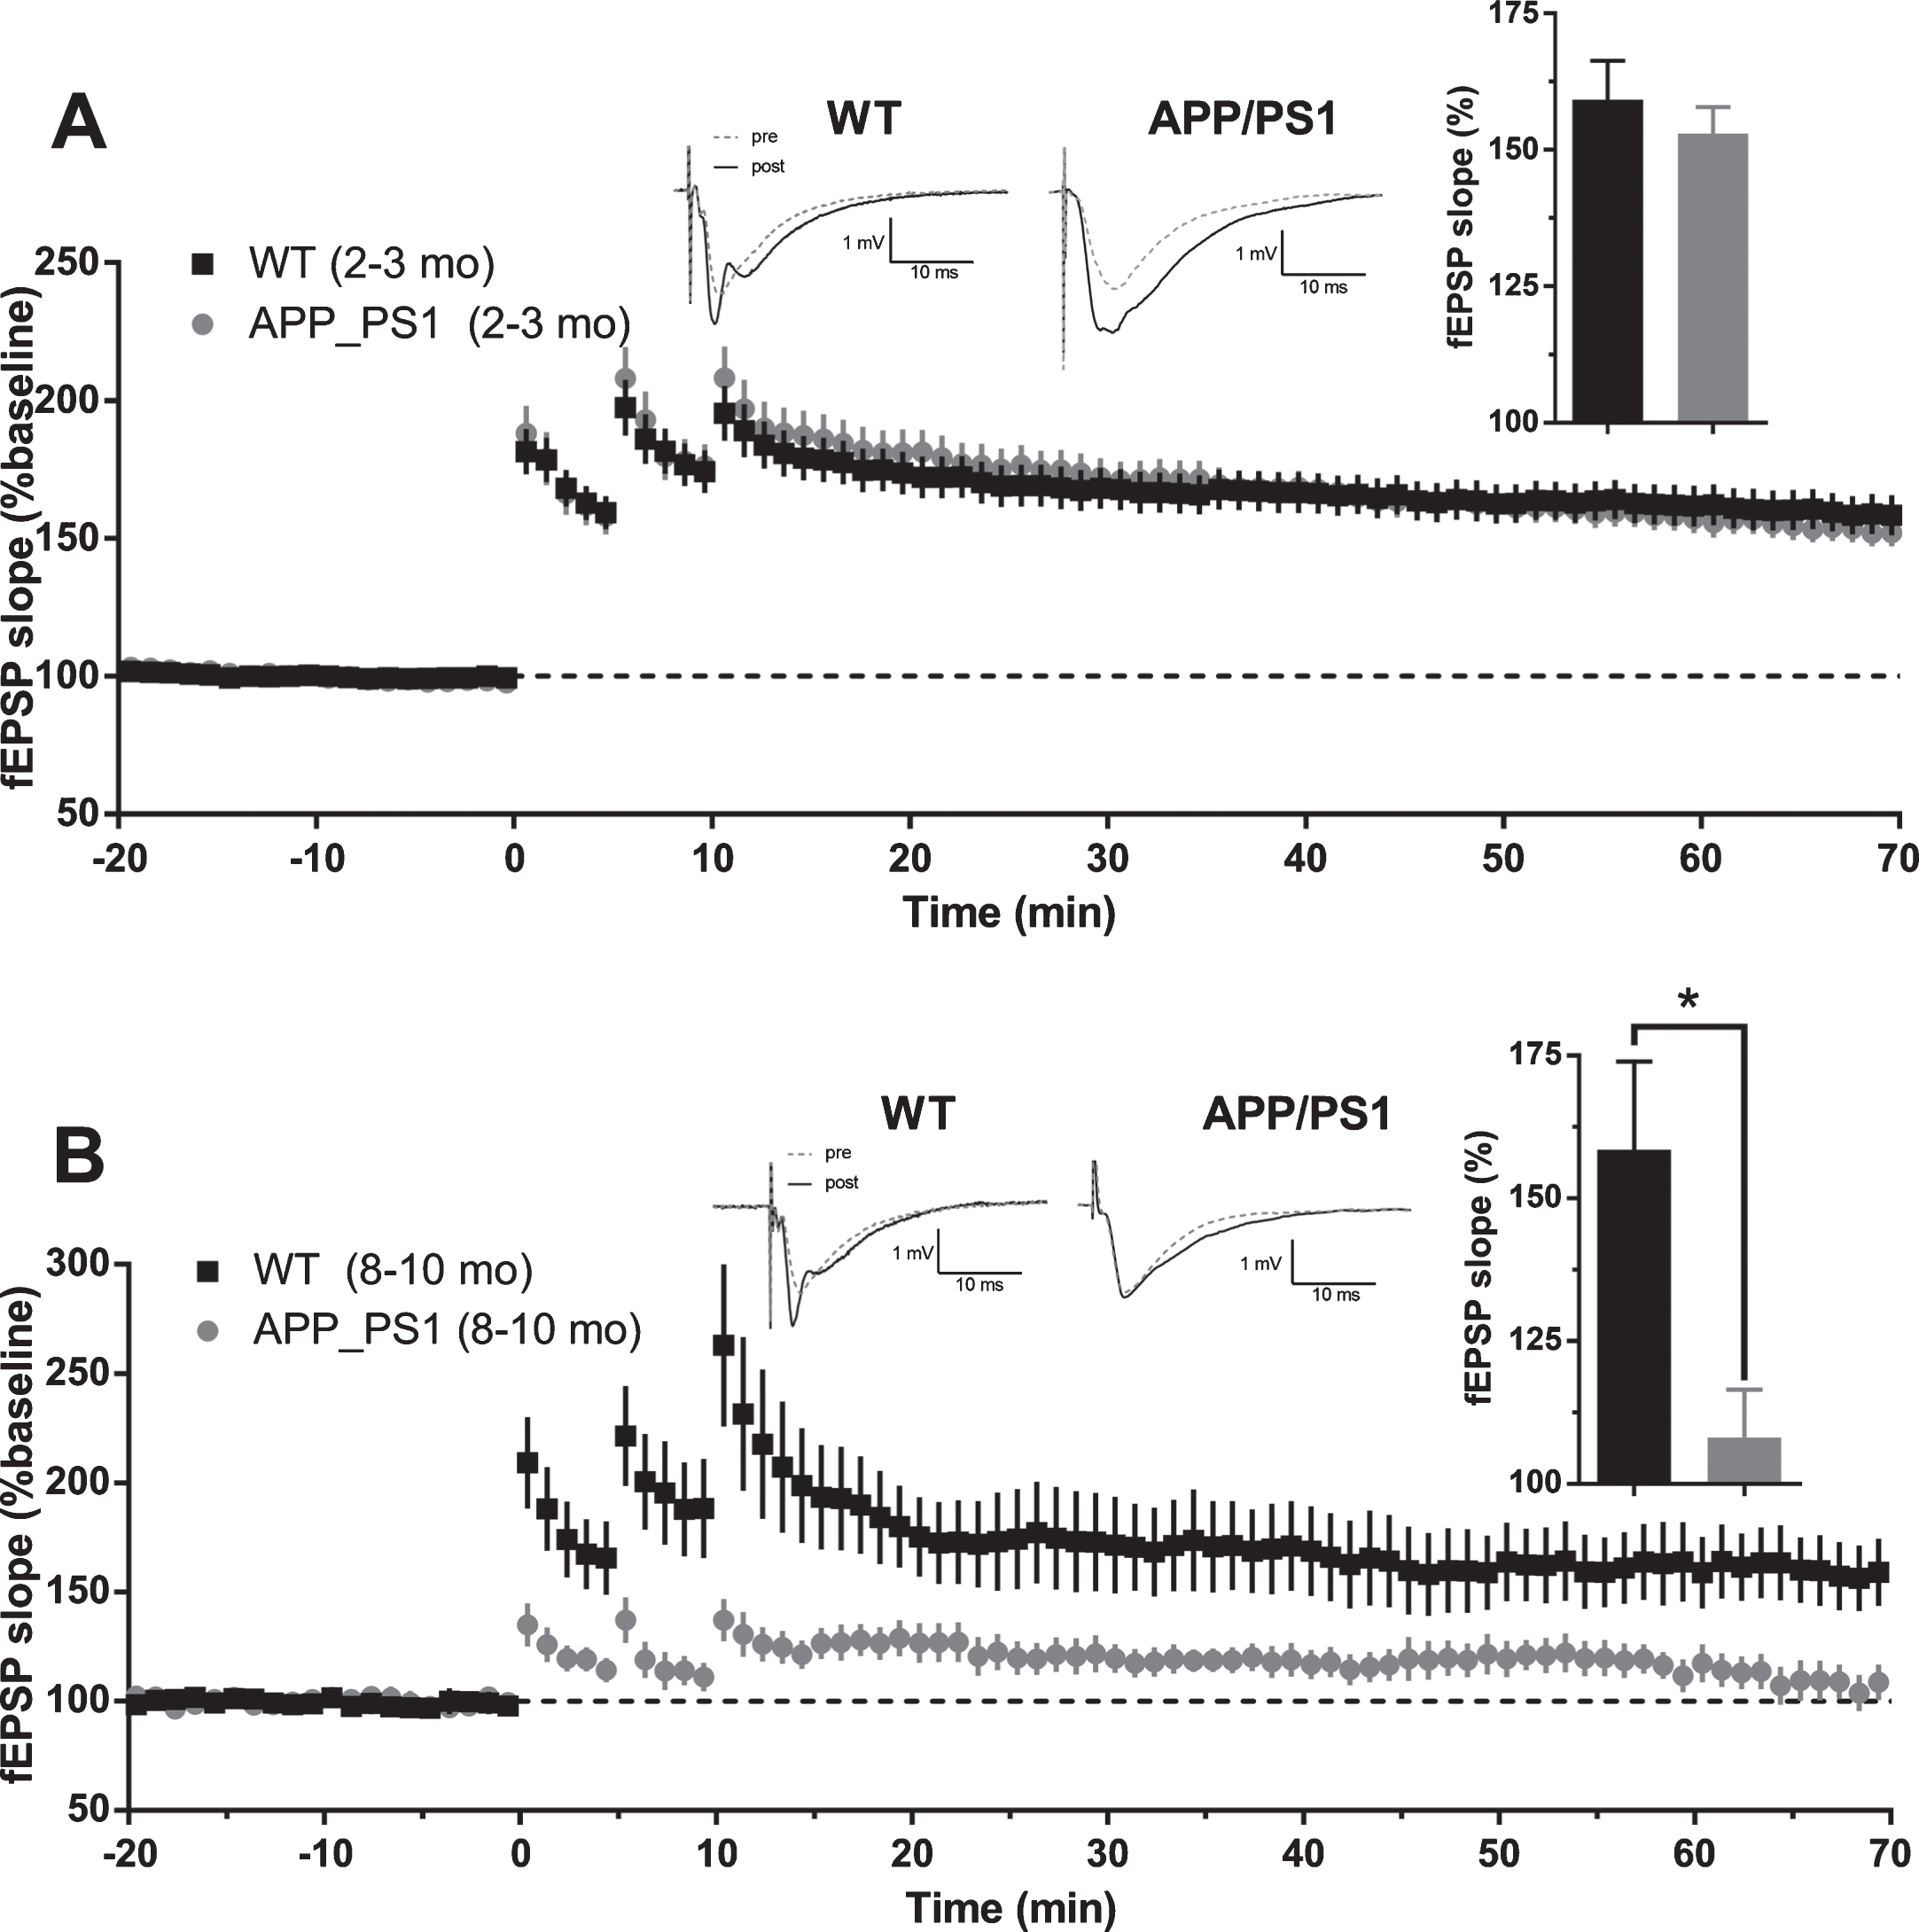
Long-term potentiation in APP/PS1 mice. A) Average baseline-normalized time course of long term potentiation of fEPSP slope in response to high frequency stimulation in 2-3-month-old APP/PS1 mice. Example traces represent averaged responses (4 traces) before HFS and at 60 min post last HFS bout. (Inset). Averaged normalized response from the last 5 min of recordings (WT n = 31 slices from 10 animals; APP/PS1 n = 30 slices from 9 animals; two-tailed t-test p = 0.4819). B) Average baseline-normalized time course of long-term potentiation of fEPSP slope in response to high frequency stimulation in 8–10-month-old APP/PS1 mice. Example traces represent averaged responses (4 traces) before HFS and at 60 min post last HFS bout. (Inset). Averaged normalized response from the last 5 min of recordings (WT n = 12 slices from 6 animals; APP/PS1 n = 11 slices from 7 animals; two-tailed t-test p = 0.0107).
DISCUSSION
In this study, we examined age-related progressive changes of basal synaptic transmission and short- and long-term plasticity in CA1 area of hippocampus that are presumably caused by specific mutations in APP/PS1 and tau genes, utilizing APPswe/PS1M146L and rTg(tauP301L)4510 mouse models of AD. Our main findings, summarized in Table 1, indicate that synaptic transmission in remaining CA3-CA1 connections is not altered in rTg4510 mice at the ages tested, but is reduced in 8–10-month-old APP/PS1 mice. Additionally, rTg4510 exhibits a more accelerated decline in hippocampal function, observed as a correlated reduction in fEPSP slope and FV, which is consistent with the overall neurodegeneration of hippocampus in this model [24, 46]. Concomitantly, FV reduction may reflect changes in pre-synaptic fiber excitability. It is well established that phosphorylated tau disrupts axonal cytoskeleton and axonal transport mechanisms [47–49], which may result initially in a lower levels of Na+ and/or K+ channels, as well as Na+/K+ –ATPases, and axonal mitochondria [50, 51], in addition to general structural abnormalities. All of these changes may lead to a reduction in axonal excitability and eventually to axonal degeneration.
Qualitative summary of electrophysiological measures in young and old APP/PS1 and rTg4510 mice. Equal sign (=) or arrow (↓) denote no difference or a statistically significant decrease, respectively, in mutant mice relative to WT controls
Note: LTP and PPF were not examined in 24-month-old APP/PS1.
We find that in young 2-3-month-old APP/PS1 mice neither pre-synaptic activation (fiber volley amplitude) nor post-synaptic responses (fEPSP slope) were affected. However, young 2-3-month-old rTg4510 mice, already at this age, show a small deficit in fiber volley amplitude, with no concomitant change in post-synaptic response. In 8–10-month-old APP/PS1 mice fEPSP slope was significantly reduced, but fiber volley amplitudes were not different from WT controls. This suggests that at this age APP/PS1 mice show a genuine synaptic dysfunction. At 24 months, a clear reduction in fEPSP slope and FV amplitude was observed in APP/PS1, consistent with neurodegeneration of CA1 area of hippocampus at this age [32]. In 6-7-month-old rTg4510 mice, a concomitant reduction in fEPSP slope and fiber volley amplitude was observed, which is consistent with previous reports [24, 46] of rapid progressive hippocampal neurodegeneration in this model. However, plots of fEPSP slopes versus fiber volley amplitudes indicated no change in basal synaptic transmission. Several previous studies have examined aspects of hippocampal physiology in rTg4510 mice. Dalby et al. [28] performed an electrophysiological analysis of CA3-CA1 area of hippocampus in 2.5-3 and 5.5–6-month-old rTg4510 mice. They reported reduction in BST (fEPSP slope), as early as 2.5–3 months of age. This conclusion was based on input-output relation between fEPSP slope and stimulus intensity. Booth et al. [34] reported similar fEPSP slope deficits in 7-8-month-old mice and also concluded that BST is diminished. However, neither of these authors took into account the strength of pre-synaptic activation (i.e., FV amplitudes). In contrast to their findings, our data indicate no changes in BST in 6-7-month-old mice, when corrected for changes in FV amplitude, suggesting that remaining CA3-CA1 connections may support normal basal levels of neurotransmission.
PPF was reduced in rTg4510 at 6-7 months of age, pointing to potential abnormalities in pre-synaptic release machinery that are relevant to short-term plasticity. This deficit may be due to abnormal calcium homeostasis, which has been shown in cultured cells to co-occur with overexpression, hyperphosphorylation, misfolding, and mislocalization of tau [52–54]. However, in 8-9-month-old rTg4510 mice, cortical neurons exhibit loss of dendritic spines that is calcium-independent [55]. Thus, the possibility of calcium independent mechanisms of PPF reduction in Schaffer collaterals of hippocampus cannot be excluded. Additionally, we cannot rule out alterations in transmitter release in 6-7-month-old rTg4510 mice, since PPF was reduced, however such changes, do not seem to affect BST in this AD model. One might speculate that an increase in release probability in rTg4510 mice could, in principle, have offset reductions in CA3 axon number or excitability, either of which could underlie reduced FV amplitude.
In contrast to 6-7-month-old rTg4510 mice, PPF was not affected in APP/PS1 mice at least up to 8-9 months of age. Given that BST was impaired in APP/PS1, this suggests that the basis of the BST deficit in APP/PS1 mice is largely post-synaptic.
APP/PS1 (8–10 mo) and rTg4510 mice (6-7 mo) both showed deficits in LTP. In rTg4510 mice the capacity for LTP induction, as judged by equivalent levels of early post-tetanic potentiation, is presumably not impaired, which suggests that LTP deficiency in this model is most likely due to altered post-synaptic signaling pathways. In contrast APP/PS1, showed a much-diminished post-tetanic potentiation, suggesting that in this model LTP reduction may be due to induction deficits (either pre and/or post-synaptic), consistent with observed reduced basal synaptic transmission.
Trinchese et al. [27] examined age-dependent progression of Aβ deposition in APP/PS1 mice and attempted to correlate it with electrophysiological and behavioral markers. They reported reduced levels of LTP as early as 3-4 months of age with no reduction in BST at this age. LTP deficit was correlated with plaque appearance, elevated levels of Aβ and abnormal short-term memory. BST was affected only at about 5-6 months of age. Our results are consistent with this timeline, i.e., we did not observe LTP deficits and BST reduction in 2-3-month-old APP/PS1 mice. Additionally, since older mice in our study were 8–10 months old, BST and LTP deficits that we observe are in line with Trinchese et al. Similar to our findings, Trinchese et al. reported no changes in PPF at any age in APP/PS1.
Our comparison of these two mouse models points to a major difference in the effects of their respective mutations on basal synaptic transmission. Our data reveal that in rTg4510 mice, basal synaptic transmission is not affected up to 6-7 months of age, in contrast to APP/PS1, in which a deficit in basal synaptic transmission occurs before 6 months of age. In rTg4510, a small reduction in fiber volley amplitude can be detected as early as 2-3 months of age. In contrast, fiber volley amplitude decline in APP/PS1 mice was detected only by 24 months. Overall, these data suggest that synaptic transmission deficits in these models progress at different rates. These functional distinctions may influence how these models are deployed in evaluating therapeutic compounds.
DISCLOSURE STATEMENT
Authors’ disclosures available online (http://j-alz.com/manuscript-disclosures/17-0457r2).