
Abstract
Keywords
INTRODUCTION
Cognitive interventions may be useful to reduce rates of cognitive decline in people with Alzheimer’s disease (AD) dementia or at risk for AD [1]. Cognitive rehabilitation (CR) is a multimodal cognitive intervention that aims to preserve a patient’s everyday activities, independent living, and quality of life [2]. CR combines the dimensions of individuality (e.g., pursuing personal goals with relevance to the patient’s everyday life), compensation (e.g., maintaining skills and compensating deficits), integration (e.g., applying multimodal methods), and interaction (including the patient’s environment) [3]. Several studies integrating key concepts of CR have shown an improvement of quality of life and a decrease in depressive symptoms in people with dementia, but no significant effects on everyday competence (activities of daily living, ADL) or cognitive functions [3–6].
To develop effective therapies, it is essential to better understand the effects of an intervention on underlying neuronal dysfunction in dementia. Functional connectivity networks comprise a dynamic synchronized activity between functionally coupled brain regions [7]. Researchers have employed imaging techniques [8–10] to study progressive disruption of functional connectivity networks as a possible mechanism underlying the clinical course of AD [11–13]. The most widely studied network so far is the default mode network (DMN), which is characterized by a task-related deactivation in functional magnetic resonance imaging (fMRI). Typically, it shows highest activity in a wakeful resting-state in the precuneus/posterior cingulate cortex (PCC), medial prefrontal cortex (MPFC), lateral temporal and parietal cortex, thalamus, and hippocampus [14]. Resting-state fMRI (rs-fMRI) [15] allows the study of patients who are not able to follow complex activation paradigms during fMRI, and the DMN can be readily reconstructed from rs-fMRI by seed-based connectivity analysis of its principle network nodes, most typically the PCC [16, 17]. The progressive decrease of functional connectivity in the DMN facilitates the differentiation between healthy controls, mild cognitive impairment (MCI), and AD dementia [13, 19] but may also provide a marker to track the disease’s progress. So far, only a few studies have investigated longitudinal changes in the DMN in patients with MCI and AD. Studies indicate a fractionation of the DMN in several subsystems which disintegrate consecutively [20–22]. Longitudinal studies also suggested an increase of connectivity between the PCC and frontal regions in early stages of AD [20, 23], and an increase of connectivity between PCC and precuneus in a group of MCI patients having converted to AD compared to non-converters [24]. These connectivity increases have typically been interpreted in the context of compensatory mechanisms. Even fewer studies have investigated effects of cognitive interventions on rs-fMRI connectivity. Cognitive training in healthy older people led to initial small increases in functional connectivity between the hippocampus and superior temporal gyrus regions after three weeks, which were lost after the complete training of 12 weeks [25]. In people with MCI an eight weeks meditation-intervention resulted in increased connectivity between PCC and MPFC/hippocampus without changes in behavioral parameters [26]. Functional imaging techniques other than rs-fMRI revealed effects of CR in AD and MCI. Using a recognition-task fMRI paradigm, Van Paasschen found that eight weeks of CR in patients with early-stage AD resulted in an increase of activation in the intervention compared to the control group in frontal and parietal regions, but had no significant effects on behavioral performances. The authors suggested that fMRI may be more sensitive to intervention effects than neuropsychological tests [27]. In an [18F]fluorodeoxyglucose (FDG) positron emission tomography (PET) study, six months CR in patients with MCI and AD led to attenuated metabolic decline in both intervention groups compared to the active control group, but the authors found only non-significant correlations between FDG-uptake and cognitive parameters [28]. In summary, functional imaging provides promising endpoints for CR interventions that deserve further study.
The aim of our study was to assess the effect of 12 weeks CR on functional connectivity within the DMN in patients with mild AD compared to an active control group.
We hypothesized that CR, which is thought to mobilize cognitive resources, may alter functional connectivity in the DMN.
METHODS
Subjects
We screened 44 patients in the memory clinic of the University Medical Center Rostock and included 20 subjects with a diagnosis of clinically probable AD or possible AD with concomitant cerebrovascular disease (mixed dementia), according to NINCDS-ADRDA criteria [29]. Cerebrovascular comorbidity was diagnosed according to ICD 10 criteria [30]. Subjects who were taking psychotropic drugs needed to be under stable doses for at least three months. Almost all subjects were taking antidementive medication. In the control group, three subjects took donepezil, two subjects took rivastigmine, and three subjects did not take any antidementive medication. In the intervention group, three subjects took rivastigmine, four subjects took donepezil, and one subject took memantine. All patients received a comprehensive neurological and psychiatric examination. Exclusion criteria consisted of a history of neurological or psychiatric illness (other than AD), or extensive pathological changes in the MRI scan, such as a tumor or evidence of stroke. The study was approved by the ethics committee of the University Medical Center Rostock and registered in the database of clinicaltrials.gov (A 2014–0113). All subjects and their representatives provided written informed consent. The study was conducted in compliance with the Declaration of Helsinki of 1964, last amended by 64th WMA General Assembly, Fortaleza, Brazil, October 2013.
Study design
Our study examined the effects of a three-month cognitive rehabilitation program in a semi-controlled design. Details on the design are described in detail in our companion paper [31]. After screening, 20 patients were partially randomized to either anintervention group (IG) or control group (CG). We conducted an adaptive and partially balanced randomization. As five subjects originated from a pilot trial waiting group and were already predetermined for the intervention group, we were forced to conduct an adaptive randomization at baseline. The remaining subjects (n = 15) passed a computer-based balanced randomization. At baseline, the two groups did not differ significantly with respect to age, sex, education, and MMSE (Table 1). Moreover, they did not differ with respect to severity of AD according to MMSE (Table 1) and CERAD-scores (here not reported in detail). Eight subjects per group completed the study. For details on design and dropouts, please see Fig. 1. The intervention group received a cognitive rehabilitation intervention based on the CORDIAL-program [32], as described in detail in our companion paper [31]. In short, this program includes 6 modules in 12 weekly sessions over three months with contents such as identifying individual problems, defining personal goals, biographical work, implementation of pleasant activities and external memory aids, concluded by an evaluation session with individual plans for the future. The control group received standardized cognitive training [33] with worksheets for homework and monthlymeetings.
Demographical measures at baseline
*Measured by U-test; +measured by chi-square-test; SD, standard deviation; MMSE, Mini-Mental Status Examination.
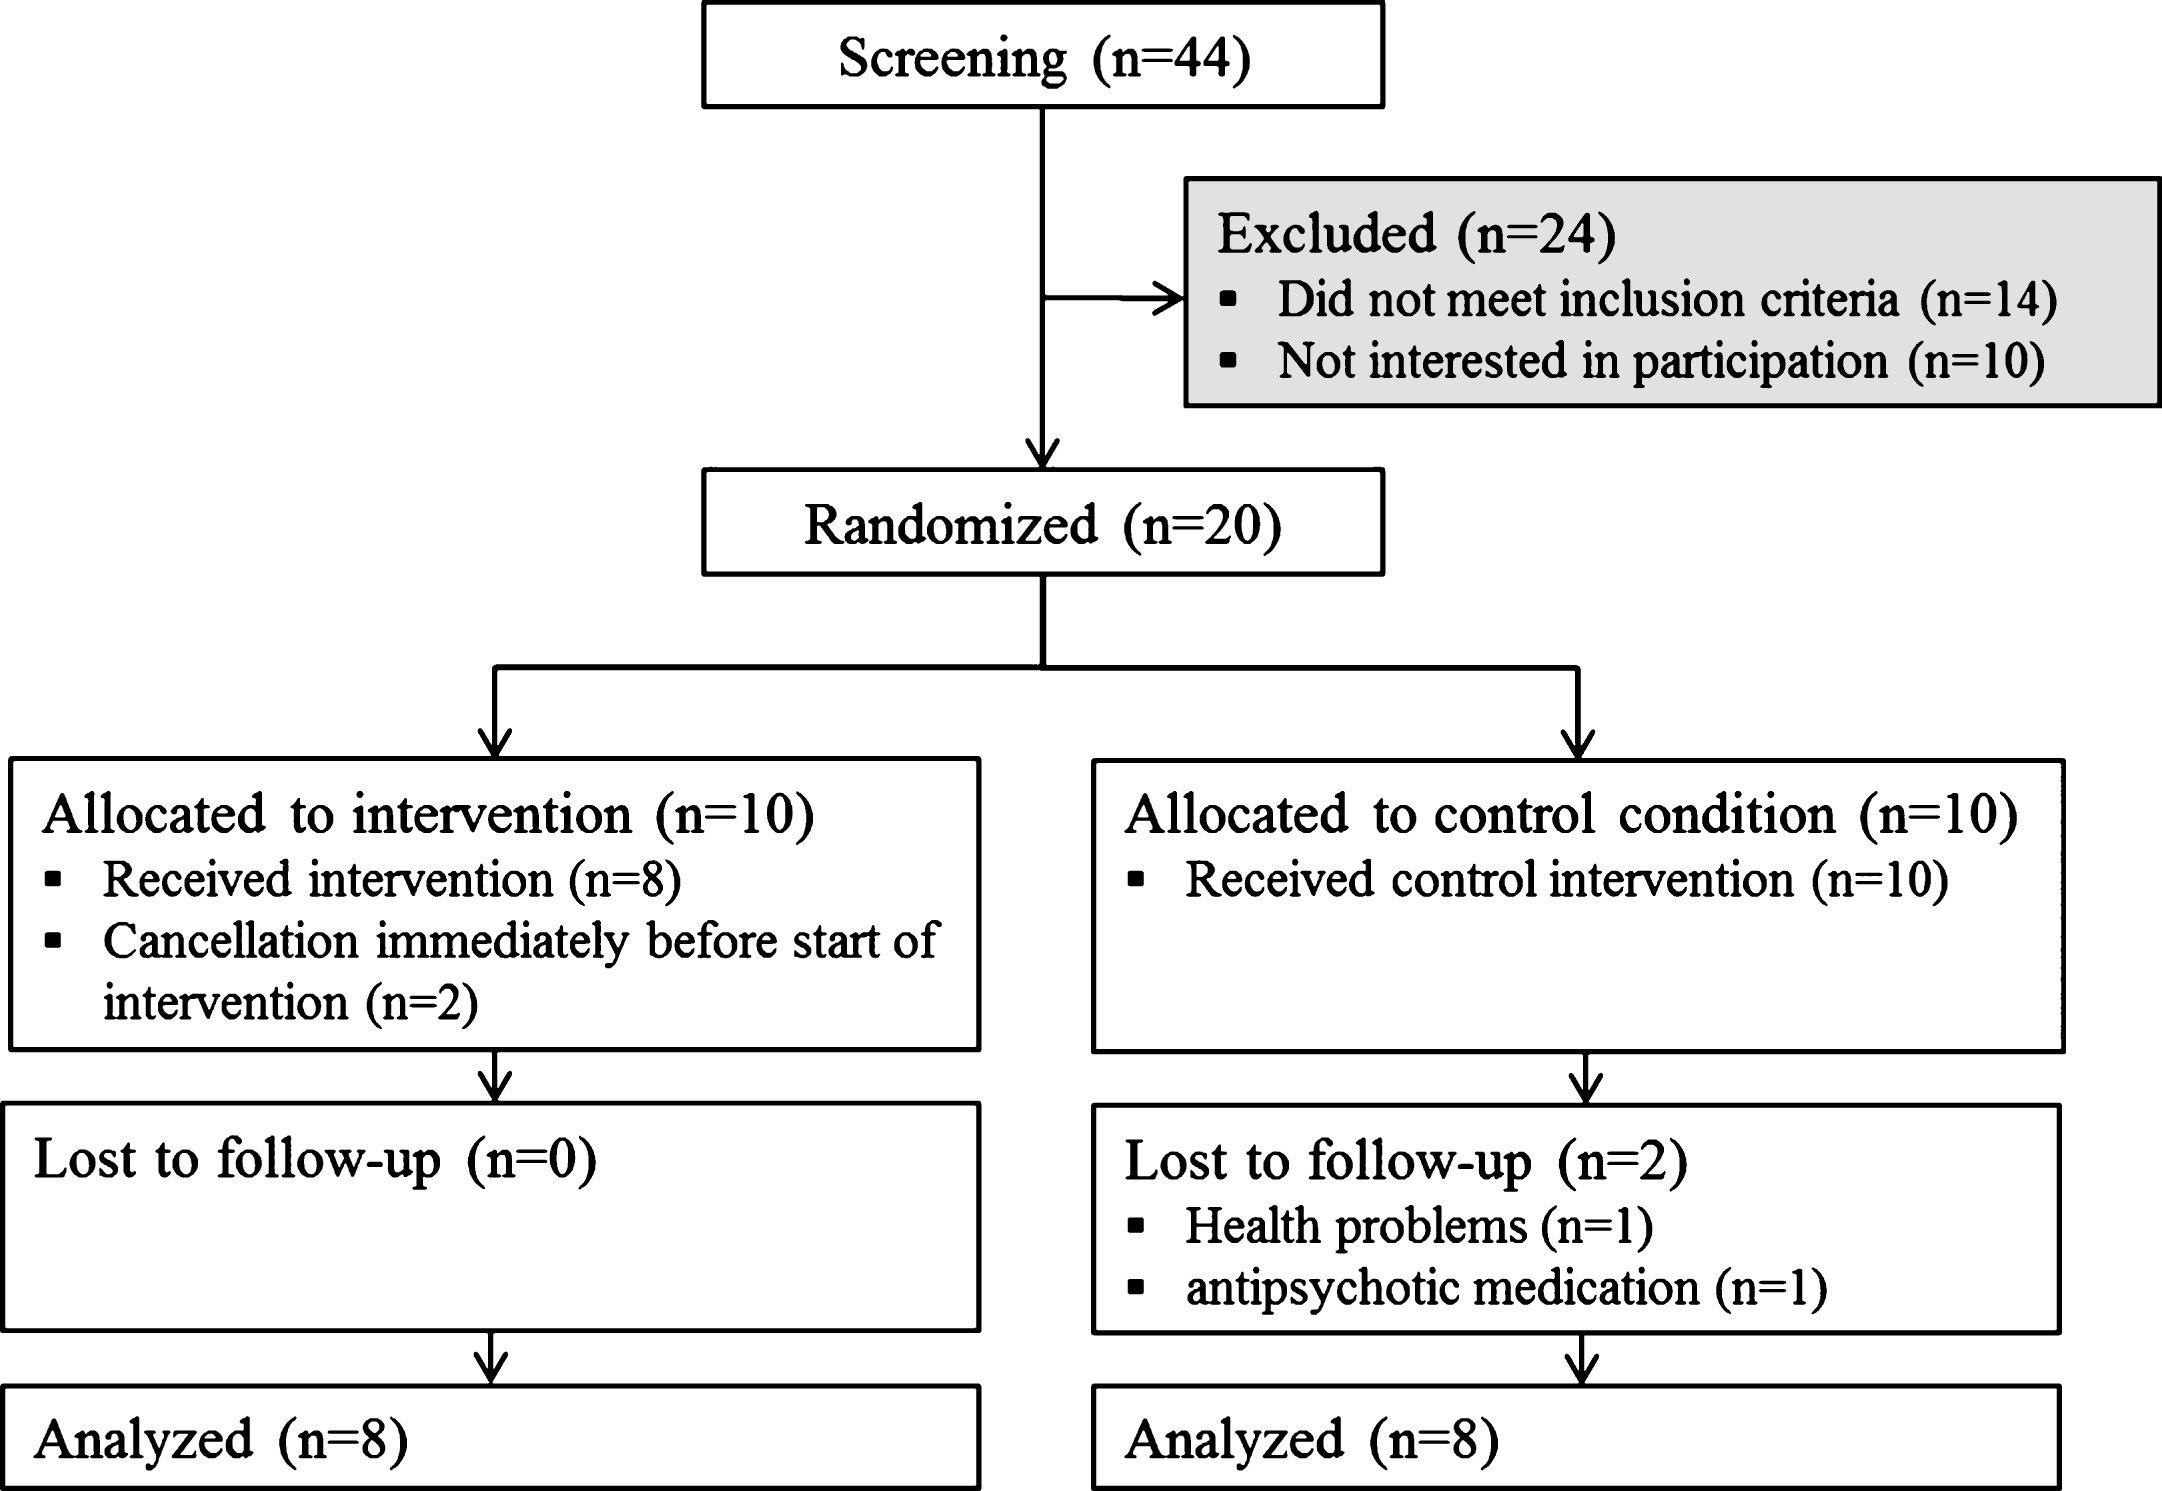
Flowchart of randomization and procedure according to CONSORT criteria [58].
Neuropsychological outcome
As primary outcome, we used two scales, measuring Activities of daily living (ADL-competence). Firstly, we used the Bayer’s Activities of Daily Living Scale: Bayer-ADL [34], addressing everyday competence. Secondly, we employed the Nuremberg Aging Observation Scale (NSL) [35], completed by both the patients (NSL-P) and the caregivers (NSL-C). Secondary outcomes were the cognitive status, measured with the Consortium to establish a registry for AD (CERAD) [36], and non-cognitive domains, for example depression, measured with the Geriatric Depression Scale (GDS) [37], and quality of life, measured by the Health-related quality of life for people with dementia (DEMQOL) [38]. The neuropsychological testing was conducted blinded to the participants’ intervention condition.
Image data acquisition
We used a 3T Siemens Magnetom VERIO scanner (Erlangen, Germany) with a 32-channel head coil. The patients were instructed to lie still, keep their eyes closed and not to fall asleep. The field-of-view (FOV) spanned the whole brain and was aligned along the anterior-to-posterior commissure line. The functional MRI was based on echo-planar imaging using a 64×64 image matrix with 47 axial slices (spacing 3.5 mm, thickness 3.5 mm, no gap, interleaved acquisition). The FOV was 224×224×165 mm, voxel size 3.5×3.5×3.5 mm3, echo time 30 ms, repetition time 2,580 ms, flip angle 80°, and parallel imaging acceleration factor 2. We obtained 180 volumes within 7 min 54 s. During the same session, a high-resolution T1-weighted anatomical image was acquired, applying the magnetization-prepared rapid gradient echo (MPRAGE) sequence with the following parameters: 256×256 image matrix with 192 sagittal slices, FOV 256×256×192 mm, voxel size 1×1×1 mm3, echo time 4.82 ms, repetition time 2,500 ms, flip angle 7° and parallel imaging acceleration factor 2. The duration of the sequence was 9 min 20 s.
Image processing
All functional and anatomical scans were visually inspected to ensure data quality. We used SPM8 (Wellcome Trust Centre for Neuroimaging) implemented in MATLAB R2103a (The MathWorks, Inc.) in conjunction with the Voxel-Based Morphometry toolbox (VBM8, r413 [39]) and the Data Processing Assistant for Resting-State fMRI (DPARSF advanced edition, Version 3.1 [40]) for data processing. The anatomical T1-weighted scans were processed following the longitudinal pipeline of the VBM8 toolbox. Bias-corrected mean images were calculated from the realigned anatomical images of the baseline (BL) and follow-up (FU) time points. The anatomical images were segmented into grey matter, white matter, and cerebrospinal fluid partitions using VBM8. The Diffeomorphic Anatomical Registration Through Exponentiated Lie algebra (DARTEL) algorithm [41] was used to create a standardized template and to normalize the T1-weighted images to the Montreal Neurological Institute (MNI) reference coordinate system [42]. We removed the first six volumes from the functional images to ensure scanner gradient field stabilization; the data underwent slice-time correction and were realigned to the mean functional image of the time series. Then, we co-registered the fMRI images to the anatomical T1-weighted mean image using the temporal mean as reference. We regressed out nuisance signals due to head motion (6 movement parameters + first-order derivatives), as well as the mean time courses for the global signal, white matter signal, and cerebrospinal fluid signal derived from the anatomically segmented maps. We applied temporal band-pass filtering in the frequency range 0.01 to 0.1 Hz. For spatial normalization, we applied the deformation fields, obtained from the anatomical data, to transform the functional data to MNI standard space. As a final step, we smoothed the warped functional images with an 8 mm full-width-at-half-maximum (FWHM) Gaussiankernel.
Statistical analysis
We followed a seed-based approach to evaluate the functional connectivity of the DMN. As implemented in the DPARSF advanced edition toolbox (State Key Laboratory of Cognitive Neuroscience and Learning, Beijing, http://www.rfmri.org [40]), we calculated whole brain correlation maps of the signal time course using a seed sphere placed in the PCC at MNI-coordinates (0, –51, 29) with a radius of 6 mm [16, 43]. In the same step, we applied the Fisher transform to calculate z-score maps from the Pearson correlation coefficients. Using these maps, we conducted the following analyses in SPM8 (Wellcome Trust Centre for Neuroimaging, http://www.fil.ion.ucl.ac.uk):
First, we performed a one-sample t-test to determine the functional connectivity pattern within the whole sample (p < 0.05 corrected for family-wise error, minimal cluster size of 50 voxels). Second, we performed a two-sample t-test to compare the groups at baseline and at follow-up. Third, we conducted a two-way repeated-measures ANOVA, using the flexible factorial design in SPM, on the main effect of group and condition, i.e., time between BL and FU, and the interaction effect for group and condition. Fourth, we performed a paired t-test to assess the main effect of time for each group separately. In addition, we calculated functional difference images, subtracting the BL-image from the FU-image, and assessed associations between the longitudinal differences in functional connectivity and the differences of a significant neuropsychological variable using voxel-wise linear regressions. All voxel-wise effects were assessed at a statistical threshold of p < 0.001, uncorrected, and a minimal cluster size of 50 contiguous voxels. To identify the clusters’ locations, we used the Automated Anatomical Labeling toolbox (2008) for SPM8 with a standard MNI-template.
RESULTS
From the initially included twenty patients, sixteen completed the study. Two subjects in each group dropped out due to various reasons (Fig. 1).
Neuropsychological outcome
There were no significant changes in the primary outcome of ADL-competence after intervention (Bayer-ADL: F = 2.93, p = 0.109; NSL-Caregivers rating: F = 0.02, p = 0.900; NSL-patients-rating: F = 1.11, p = 0.310). Regarding the secondary outcome, we found a significant group×time interaction effect only for the quality of life index (F = 8.15, p = 0.013), with an effect size of Cohen’s d = –1.43. Further details regarding all neuropsychological outcomes can be found in our companion paper [31].
Functional connectivity outcome
The whole sample showed significant PCC functional connectivity in the precuneus, superior parietal cortex, lateral temporal cortex, and medial prefrontal cortex (Fig. 2), representing a typical DMN pattern [44]. A comparison of groups at baseline revealed for the IG, compared to the CG, higher connectivity in the right angular cortex and superior frontal cortex, whereas the CG showed higher connectivity in the left supplementary motor cortex. At follow-up, the IG revealed higher connectivity again in the right angular cortex and the CG showed higher connectivity than the IG in the left superior temporal cortex. Details are shown in Supplementary Table 1.
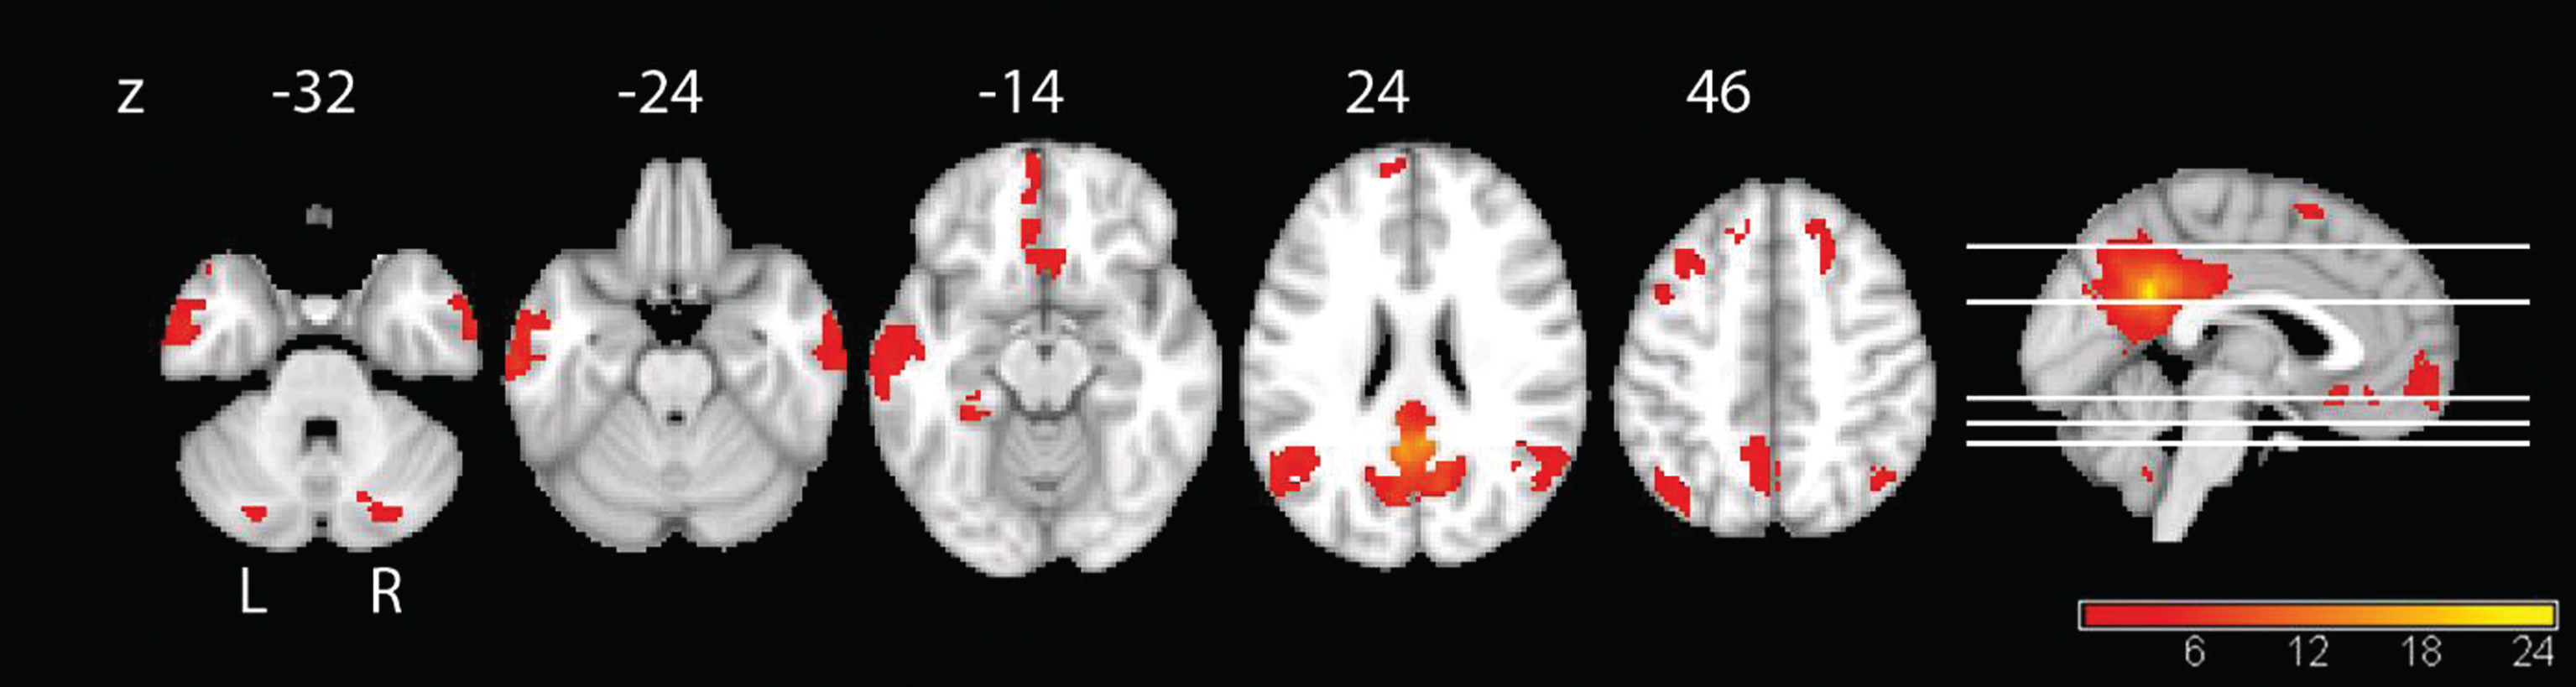
Functional connectivity of the PCC in the full sample at baseline. The connectivity maps reveal the typical pattern of the DMN. We applied threshold of p < 0.05, FWE-corrected with a minimal cluster size of 50.
In the longitudinal analyses, the main effect of time showed an increase of PCC connectivity from BL to FU for the whole group in the left precentral gyrus, and to a lower extent in the precuneus bilaterally, the right PCC, and in the right inferior temporal lobe (Fig. 3). Connectivity decreased from BL to FU between the PCC and left temporal regions and the right middle temporal pole. Smaller clusters of connectivity decrease were located in the left middle occipital cortex and the left caudate nucleus (Fig. 3 and Table 2). The interaction of group by time showed a higher increase of PCC connectivity in IG compared to CG over time primarily in the bilateral cerebellar cortex, with smaller clusters in the left postcentral gyrus, supplementary motor cortex, and orbital frontal cortex (Fig. 4). By contrast, CG showed a higher increase of PCC connectivity over time compared with IG in more widespread areas, including peaks in the left lingual cortex, temporal inferior lobe, orbito-frontal cortex, right precentral cortex, pallidum, and caudate nucleus (Fig. 4 and Table 2). The results of the paired t-test showed an increase of connectivity over time for IG in the following regions: left supplementary motor cortex, left postcentral gyrus, left precuneus, right insula, and left paracentrallobule. The opposite contrast showed a decrease of connectivity over time in IG in the left fusiform gyrus. In the CG, we found an increase of connectivity over time in the left temporal inferior lobe, right crus II of the cerebellum, and the right middle frontal lobe. Also for the CG, we found a decrease of connectivity over time in the regions left middle temporal lobe, left fusiform gyrus, and lobule VI of the right cerebellum(Table 3).
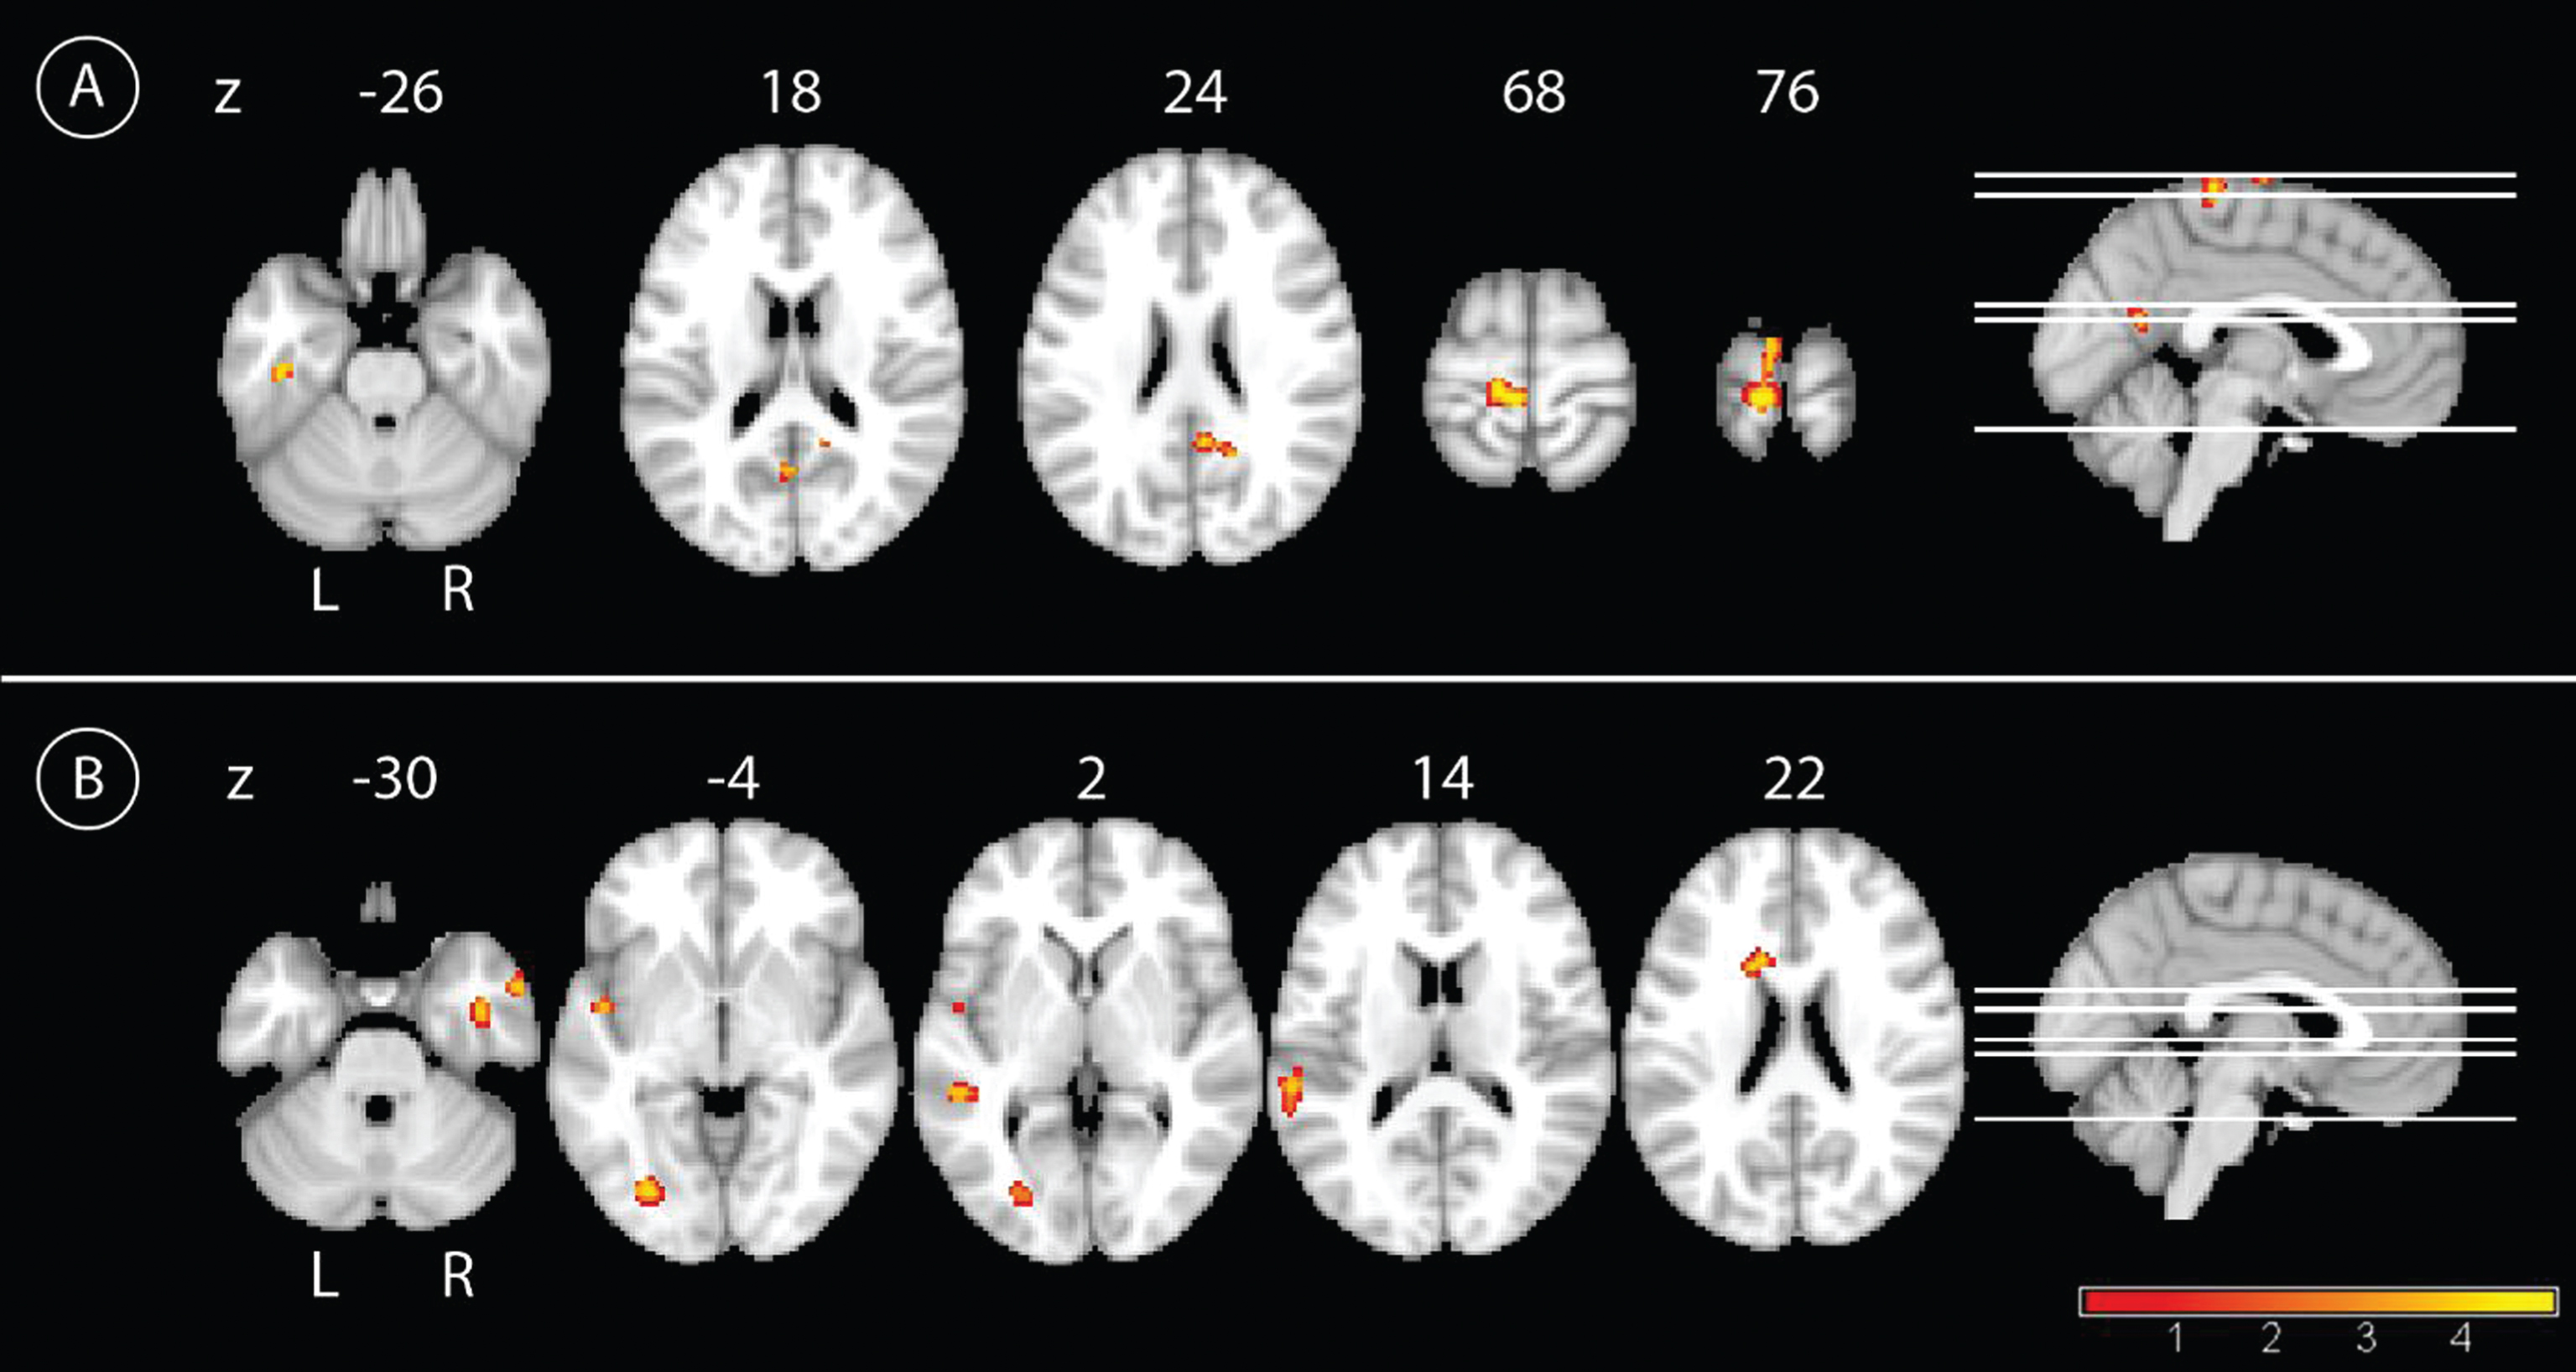
Main effect of time in the whole sample. A) Results for the main effect of time with the contrast follow-up >baseline in the whole sample. Yellow color represents higher connectivity with the PCC at FU compared to BL, p < 0.001, uncorrected, and a minimal cluster size of 50. B) Results for the main effect of time with the contrast baseline > follow-up in the whole sample. Yellow color represents higher connectivity with the PCC at BL compared to FU, p < 0.001, uncorrected, and a minimal cluster size of 50.
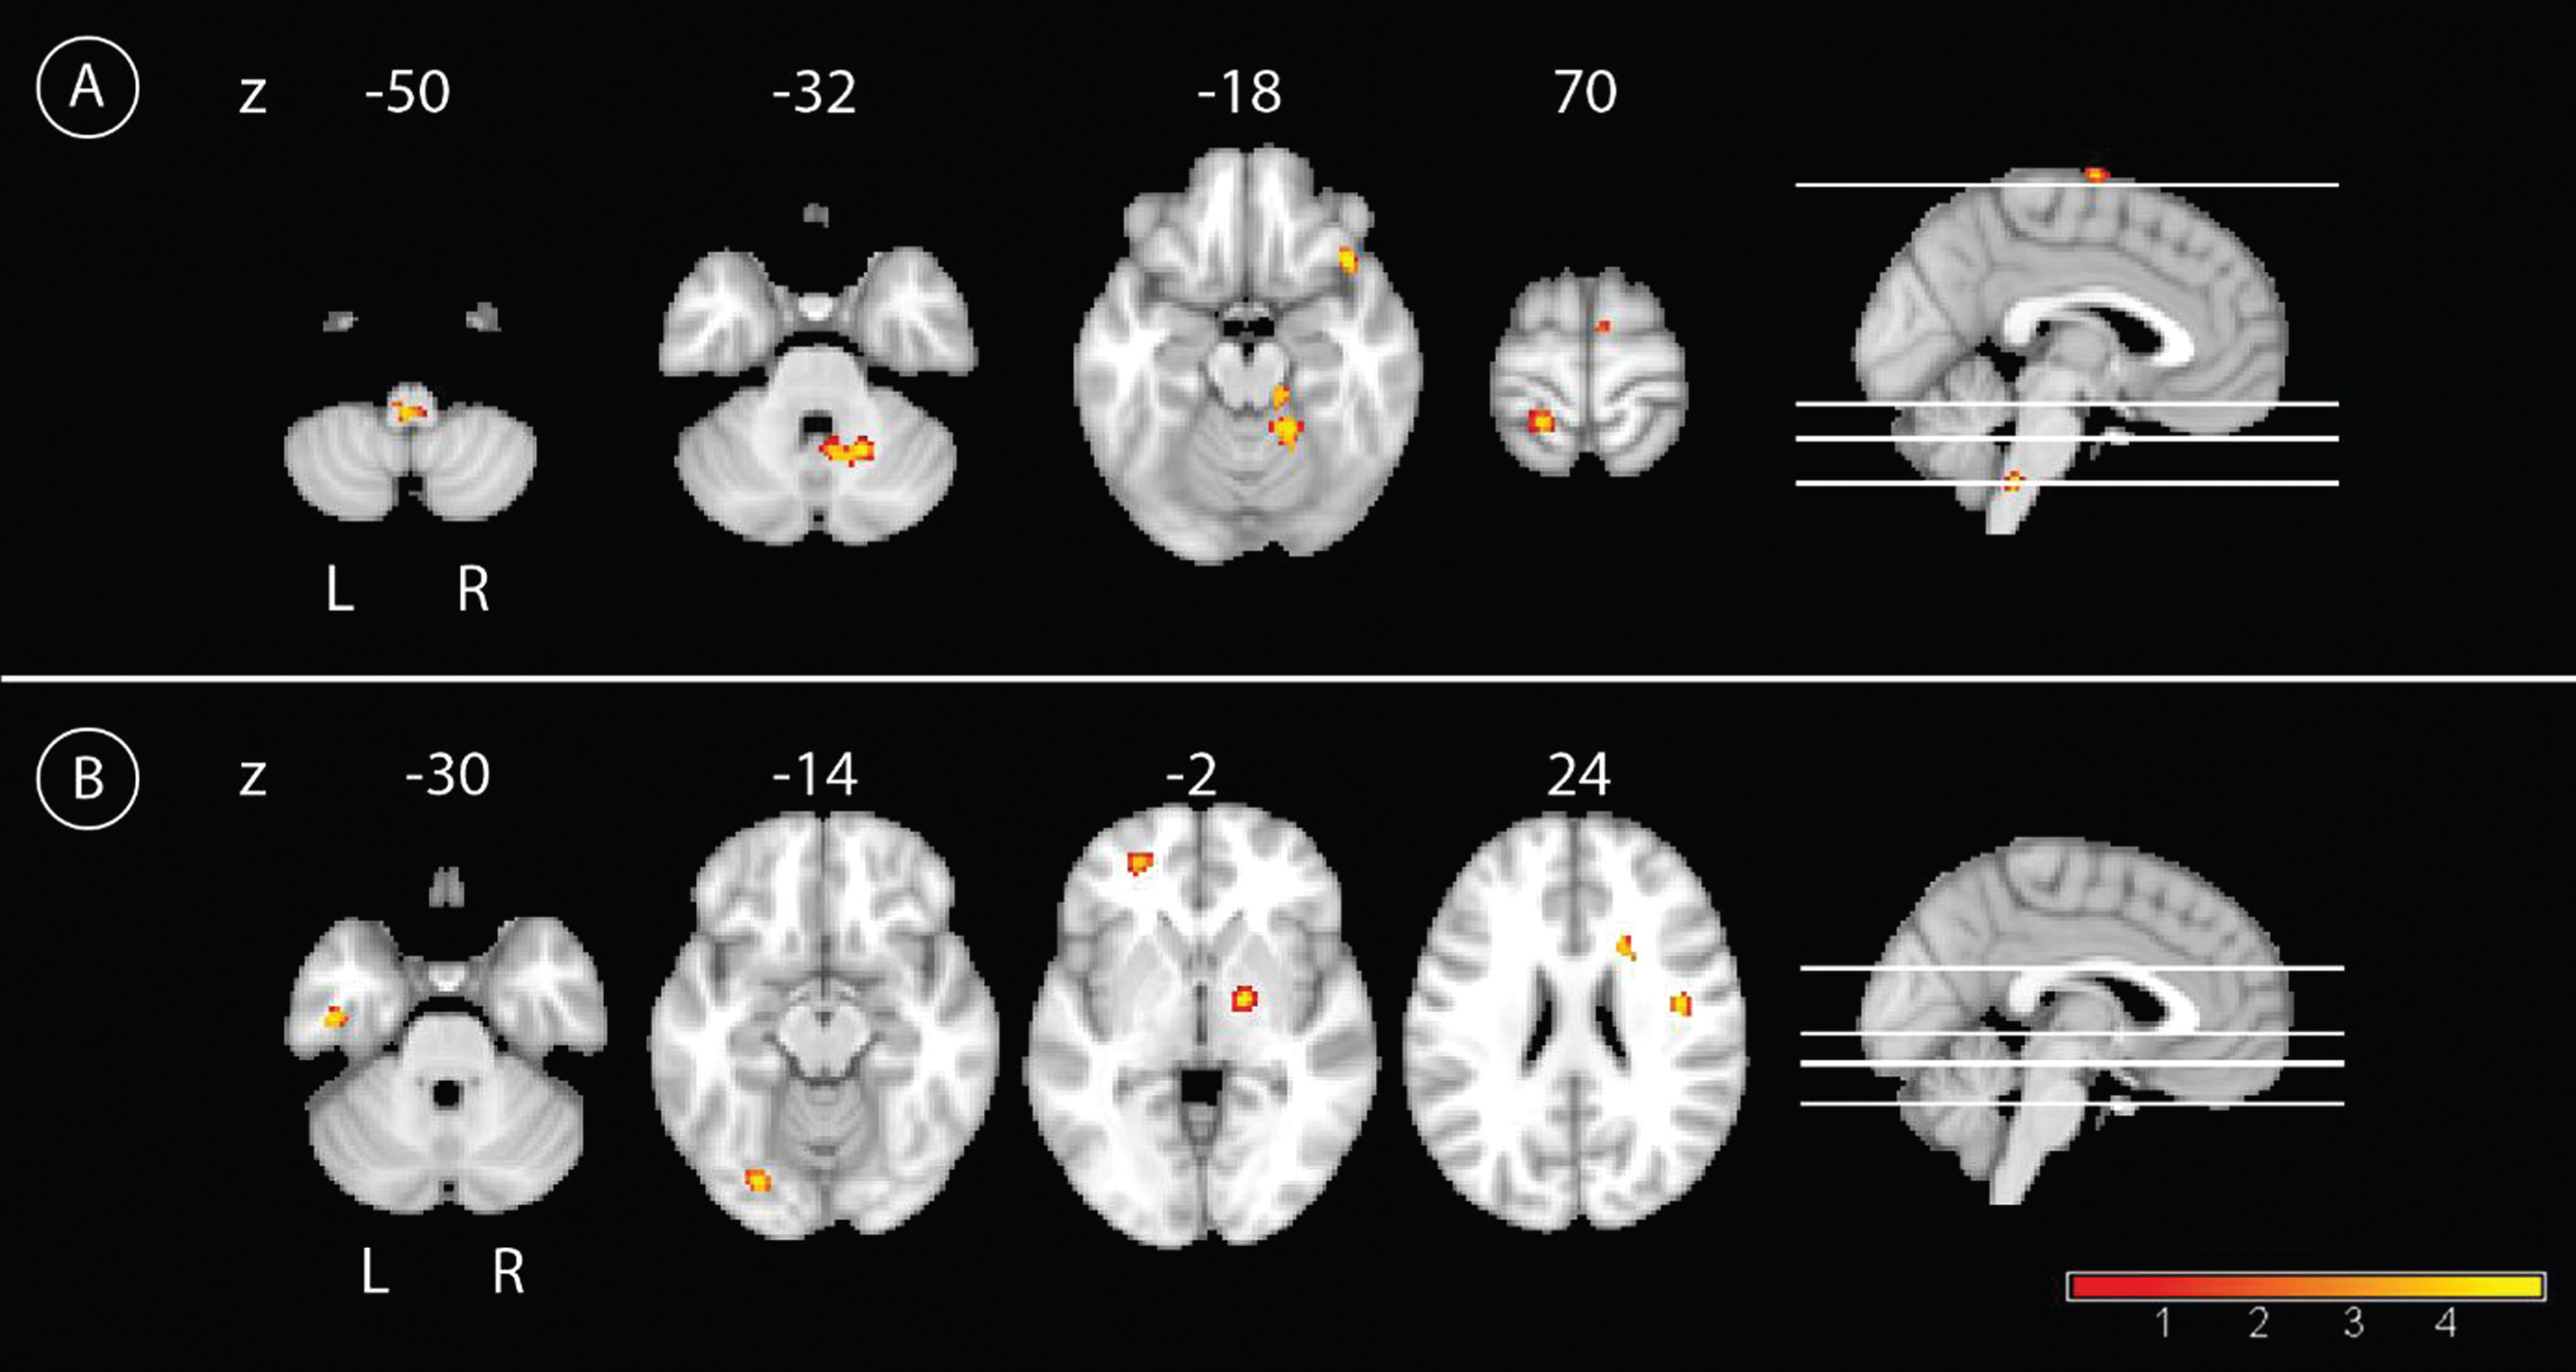
Longitudinal interaction effect. A) Comparison of the longitudinal effect of the CR between groups with the contrast intervention group > control group over time with the yellow color representing higher connectivity with the PCC in the IG compared to the CG, p < 0.001, uncorrected, and a minimal cluster size of 50. B) The results for the interaction effect with the contrast control group > intervention group with the yellow color representing higher connectivity with the PCC in the CG compared to the IG, p < 0.001, uncorrected, and a minimal cluster size of 50.
Longitudinal functional connectivity results
Results of functional data from cross-sectional and longitudinal analysis, thresholded at p < 0.001, uncorrected for multiple comparisons and a minimal cluster size of 50 voxel; IG- intervention group; CG, control group; MNI, Montreal Neurological Institute.
Longitudinal results for each group separately
Results from the paired t-Test comparing both timepoints for each group separately, thresholded at p < 0.001, uncorrected for multiple comparisons and a minimal cluster size of 50 voxel. QoL, Quality of Life; IG, intervention group; CG, control group; MNI, Montreal Neurological Institute.
As quality of life revealed the only significant interaction effect in the behavioral analysis, we correlated this variable with the functional connectivity to reduce the number of comparisons. In the IG group, QoL increase was associated with connectivity increase over time in the bilateral precuneus, particularly on the left side, in the right middle temporal lobe, in the left gyrus calcarinus and in the right inferior parietal cortex (Fig. 5 and Table 4). In the CG group, QoL was not significantly associated with changes in connectivity.
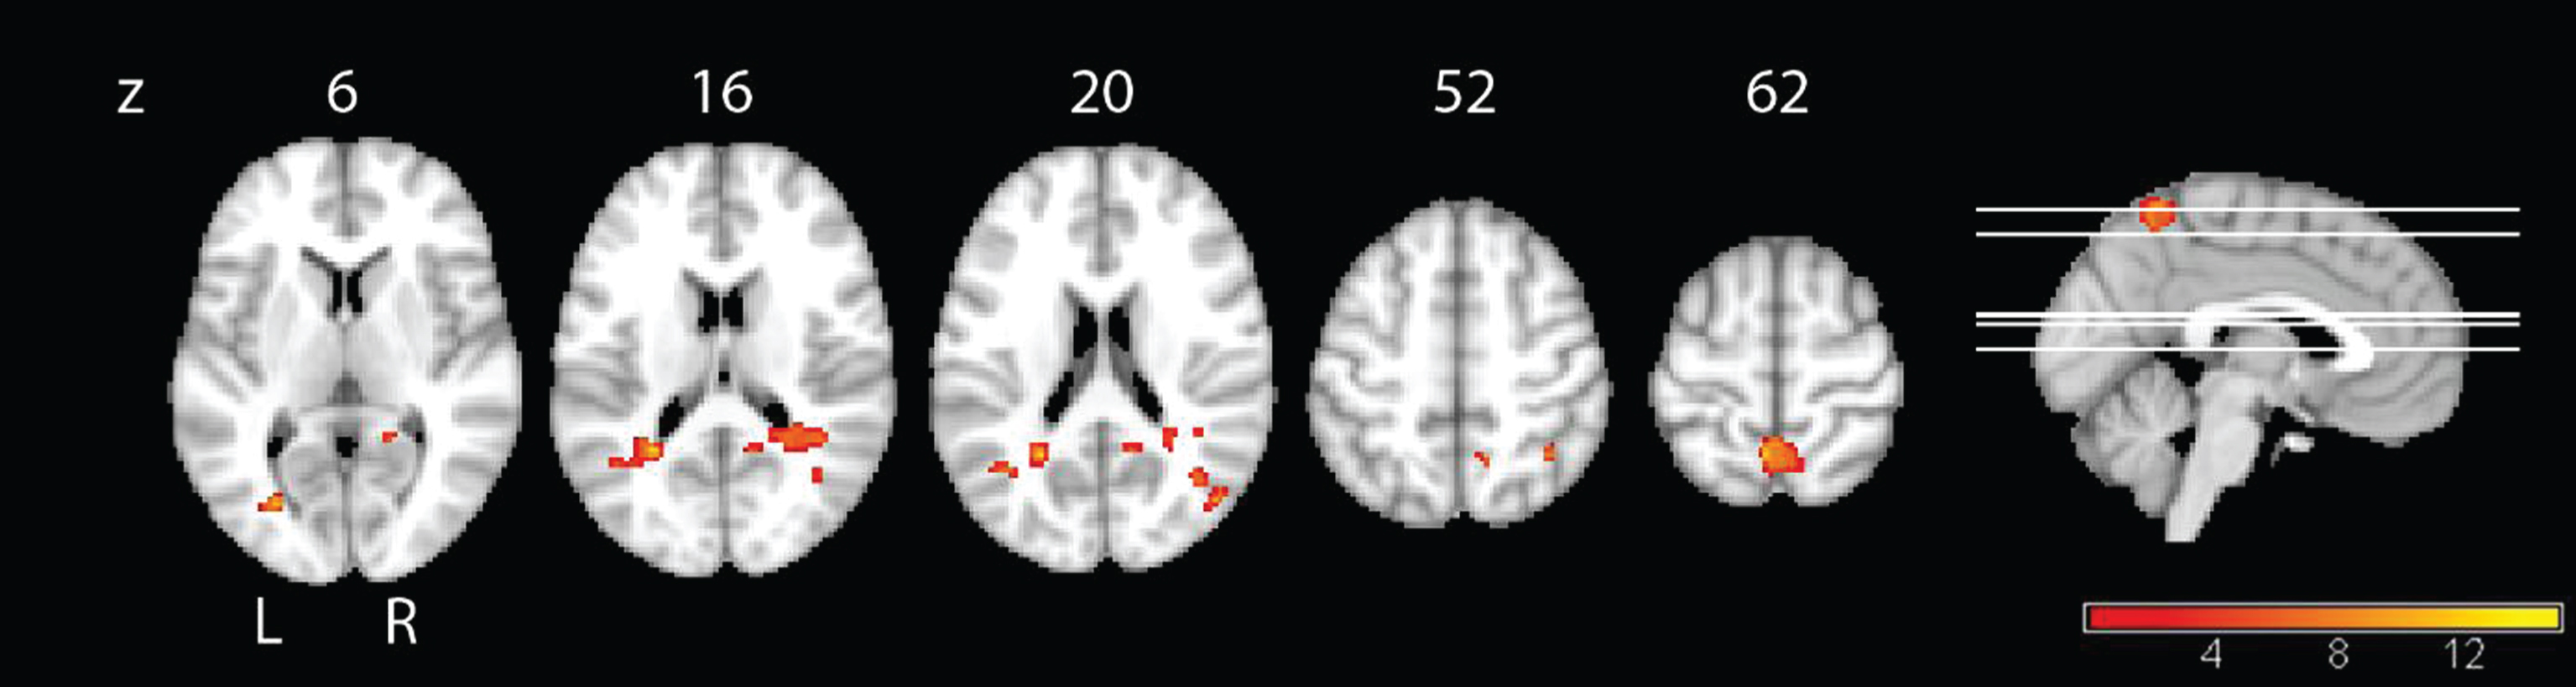
Linear regression analysis of QoL and connectivity. Positive correlation of the QoL and functional difference images for the IG, with the yellow color representing regions that show increased connectivity with the PCC over time that are correlated with increased values in quality of life over time, p < 0.001, uncorrected, and a minimal cluster size of 50.
Longitudinal results of QoL and functional connectivity correlation analysis
Linear regression with the functional difference-images as a dependent and the difference-values of the behavioral parameter QoL as an independent variable (assessed with the DEMQOL), thresholded at p < 0.001, uncorrected for multiple comparisons and a minimal cluster size of 50 voxel. QoL, Quality of Life; IG, intervention group; CG, control group; MNI, Montreal Neurological Institute.
DISCUSSION
Rs-fMRI has been proposed as a promising marker to track changes in functional connectivity throughout different stages of AD [20]. In our study, we assessed effects of CR on functional connectivity in patients with mild AD. Some studies reported small effects of cognitive interventions in functional imaging, such as rs-fMRI [25, 26], task fMRI [45], and FDG-PET [28]. These studies found no significant correlations between functional brain changes and cognitive endpoints. Studies varied in the type of intervention (meditation, cognitive training, CR), design aspects, i.e., duration of intervention (twelve weeks, eight weeks, six months), and the target groups (AD, mild cognitive impairment, healthy elderly subjects) [25, 45].
At baseline, the full sample of our study showed the typical pattern of the DMN, replicating previous findings in similar cohorts [13, 18]. Additionally, we compared both groups at baseline and found differences in a few regions, for instance higher connectivity in the right angular cortex in IG. However, this cluster also showed at follow-up, when comparing both groups, thus we do not expect an interference with other results. The interaction effect over time revealed an increase of connectivity with the PCC in regions of the cerebellum in the IG compared with the CG group. Studies have indicated that the cerebellum is relevant to all resting-state networks including the DMN [46, 47] and that the functional connectivity of the cerebellum also shows decline in AD [48, 49]. Furthermore, the cerebellum has been shown to take part in procedural or implicit memory [50, 51], which is known to be relatively preserved throughout the progress of AD compared to declarative memory [52]. Since our CR aimed at the implementation of routines, an effect on the functional connectivity between the PCC and the cerebellum may be plausible. CG showed increases of functional connectivity over time relative to the IG group in several brain regions, although with smaller clusters when compared to the contrast IG > CG. Still, the fMRI data did not provide unambiguous evidence for IG effects compared with CG. Similarly, a previous rs-fMRI study did not find clear effects of a cognitive intervention [25].
Irrespective of the treatment, connectivity with the PCC increased from baseline to follow-up in the bilateral precuneus and paracentral in the whole sample. We might interpret the increase of connectivity as an unspecific effect of intervention. On the one hand, we would expect that the cognitive intervention improved PCC function, as the region of precuneus and PCC represents a central hub within the DMN [53] with important contributions to the control of attention [21]. On the other hand, our results contradict the classical hypothesis of an early deterioration of this region in the disconnection cascade of the DMN from MCI to AD [20, 54], which would have expected a decrease over time. Possibly, due to the region’s high connectivity, it is still capable to activate cognitive resources. Such compensating processes have been suggested to be part of the network’s deterioration, as several researchers described an increase of connectivity between the PCC/precuneus region and frontal areas [20, 23]. We also noticed a decrease of connectivity over time in the whole sample,especially in temporal regions. Generally, this aligns with the progression of neural degeneration in AD, in which temporal regions are affected already at early stages [16, 55–57]. Analysis within the treatment groups suggest that these effects are mainly driven by the IG sample, but due to the small number of cases in either group, this interpretation requires independent confirmation.
When we assessed the effect of quality of life as the only neuropsychological endpoint that was significantly associated with IG versus CG intervention, we found an increase of quality of life to be associated with an increase of connectivity in the precuneus and the middle temporal lobe, but only in the IG. This was a post hoc comparison, where the independent variable was determined from the most significant behavioral effects. Therefore, we can only speculate on the meaning of such effect. There was a decrease of activity in the temporal lobe from BL to FU in the whole group. Thus the increase of quality of life, which only occurred in the IG group, might facilitate the compensating effects of cognitive rehabilitation on the temporal lobe.
In addition, one needs to consider the influence of medication on the outcome of behavioral and functional connectivity values, especially since the two groups differed slightly with regard to antidementive medication. We attempted to limit this effect, ensuring stable doses in each patient three months prior and during the intervention. Furthermore, we cannot rule out an effect of head motion, since the whole sample consisted of patients with AD. Nevertheless, maximum head motion correction revealed that none of the subjects exceeded 1.5 mm. Only two subjects showed minimal head motion at baseline, one subject from the control group showed 1 mm, and another subject from the control group 0.5 mm. Thus, we expect only minimal interference from headmotion.
The main limitation of our study constitutes the small sample size and therefore, all our results need replication in larger studies.
Conclusions
In conclusion, our results suggest that the analysis of functional connectivity provides valuable insights into the effects of CR on the brain that are worth to be further investigated, i.e., the role of the precuneus in compensatory processes and the function of the cerebellum within the DMN. It is important to further investigate why different concepts of treatment may have different effects on resting-state networks in order to better target vulnerable and compensatory cortical networks, to slow down progression of the disease and to enhance cognitive resources.