
Abstract
Lipids such as ceramides and phosphatidylcholines (PC) have been found altered in the plasma of Alzheimer’s disease (AD) patients in a number of discovery studies. For this reason, the levels of 6 ceramides and 3 PCs, with different fatty acid length and saturation levels, were measured in the plasma from 412 participants (AD n = 205, Control n = 207) using mass spectrometry coupled with ultra-performance liquid chromatography. After this, associations with AD status, brain atrophy, and age-related effects were studied. In the plasma of AD participants, cross-sectional analysis revealed elevated levels of three ceramides (Cer16:0 p < 0.01, Cer18:0 p < 0.01, Cer24:1 p < 0.05). In addition, two PCs in AD plasma (PC36:5 p < 0.05, PC38:6 p < 0.05) were found to be depleted compared to the control group, with PC36:5 also associating with hippocampal atrophy (p < 0.01). Age-specific analysis further revealed that levels of Cer16:0, Cer18:0, and Cer20:0 were associated with hippocampal atrophy only in younger participants (age < 75, p < 0.05), while all 3 PCs did so in the older participants (age > 75, p < 0.05). PC36:5 was associated with AD status in the younger group (p < 0.01), while PC38:6 and 40:6 did so in the older group (p < 0.05). In this study, elevated ceramides and depleted PCs were found in the plasma from 205 AD volunteers. Our findings also suggest that dysregulation in PC and ceramide metabolism could be occurring in different stages of AD progression.
INTRODUCTION
Alzheimer’s disease (AD) is the most common form of dementia accounting for 60–80% of all cases, representing 44 million cases globally with the number of diagnoses expected to triple by 2050 [1, 2]. The neurological disorder results from the cell loss triggered by a not well-understood metabolic cascade that involves numerous extrinsic and intrinsic pathways. Among these, lipid signaling pathways have attracted attention as an important and possibly critical factor in neurodegeneration [3–6].
Ceramides (Cer) have been linked to neurodegenerative disease by a growing body of evidence. Altered ceramide levels have been reported in AD cerebrospinal fluid (CSF) [7] and in AD brain [8]. More recently, Mielke et al. [9] found higher serum Cer16:0 and Cer24:0 levels to be linked with an increased risk of developing AD. In addition to ceramides, phosphatidylcholines (PCs) have been shown to be associated with AD. We previously identified a panel of three PCs, PC (16:0, 20:5), PC (16:0, 22:6), and PC (18:0, 22:6), that were decreased in the plasma of AD patients in comparison to cognitively normal controls and mild cognitive impairment patients [10]. This relatively underpowered study (n = 35–40) showed that a predictive performance of APOE of 67% was increased to 83% by including APOE and PCs as markers [10]. A study by Mapstone et al. in plasma also reported a panel of ten lipids, which included seven PCs, to be predictive of AD phenoconversion [3], although this result was not replicated in serum in a recent follow-upstudy [11].
Together these findings suggest that lipids play a crucial role in AD pathology and may represent a valuable clinical tool for diagnosis and prevention. The untargeted approach is ideal in discovering new lipids associated with AD, as it scans for thousands of lipid molecules in each sample. More targeted analyses achieve better quality data for fewer lipid entities, usually up to 200 lipids. It is also essential to replicate results in larger cohorts when possible [12, 13] and analyze how these effects depend on the other major factors of AD— namely APOE status and age. Here we measured levels of 9 abundant plasma lipids previously linked to AD [8–10], in plasma from AD and elderly control volunteers, and studied whether any trends in the amounts of these lipids were associated to AD, brain atrophy, APOE status and age of participants.
MATERIALS AND METHODS
Patient details and blood collection
This study utilized 412 plasma samples (205 AD and 207 controls) from the Dementia Case Register (DCR) at King’s College London and the EU funded AddNeuroMed study [10, 14]. Of these 412 participants 122 also had structural magnetic resonance imaging (sMRI) data. Normal elderly control subjects were recruited from non-related family members of AD patients, care-givers’ relatives, social centers for the elderly, or GP surgeries, and had no evidence of cognitive impairment. AD individuals were primarily recruited from local memory clinics. Relevant ethics boards approved the studies and informed consent was obtained for all subjects. Each patient was required to fast for two hours prior to sample collection and 10 ml of blood was then collected in tubes coated with sodium ethylenediaminetetraacetic acid (EDTA) to prevent clotting. Whole blood was centrifuged to form a plasma supernatant, which in turn was removed and placed at –80°C until further use. The sample demographics showing health and clinical characteristics of participants, by diagnostic group, are shown in Table 1.
Demographic characteristics of participants in study samples from DCR and AddNeuroMed. p-values are obtained from the comparison between AD and control groups
HDL-c, high density lipoprotein-cholesterol; LDL-c, low density lipoprotein-cholesterol; TC, total cholesterol; TG, triglycerides. 1AD n = 202, CTL n = 206. 2AD n = 52, CTL n = 70. 3AD n = 102, CTL n = 106. 4AD n = 135, CTL n = 142. AStudent t-test. BChi-square test. CLinear regression after adjusting for age, gender, the APOE ɛ4 allele and the center of origin of each sample.
Measurements of lipid levels
Samples from the two clinical cohorts were prepared and analyzed separately. The first cohort (DCR, n = 98) was analyzed in 2012 where depletion of the three PCs was first reported [10]. Meanwhilesample analysis from the second cohort (AddNeuroMed, n = 314) was carried out in 2014 using the identical methodology. Lipid extraction and analysis methods have been described elsewhere [12, 15] and can also be found in the Supplementary Material S1.
The single molecule integrated peak areas under the exact mass chromatographs of the nine lipids and the internal standard (Tripentadecanoin) were obtained by using QuanLynx (MassLynx 4.1, Waters) by setting up an integration parameter file using the average mass charge ration (m/z) and retention time of the 9 lipids and internal standard. The integration parameters used in lipid measurement can be found in the Supplementary Material S2. Tolerances for mass and retention time of 0.1 Da and 5 min, respectively, were typically applied. Lipids with the levels below the limit of quantification were not used for statistical analyses. Lipids PC (16:0, 20:5), PC (16:0, 22:6), and PC (18:0, 22:6) were referred as (PC36:5, PC38:6, PC40:6) and ceramides were referred as (Cer16:0, Cer18:0, Cer20:0, Cer22:0, Cer24:0, and Cer24:1) throughout the manuscript.
sMRI data acquisition and analysis
Volumes of hippocampi, white matter, entorhinal cortices, and entorhinal cortex thickness (ER thickness), normalized by intracranial volume, were obtained from 122 subjects (52 AD patients and 70 Controls) who had undergone sMRI. The volumetric data were not used to aid in the clinical diagnosis of AD. Detailed information regarding data acquisition, pre-processing, and quality control assessment have been described for this cohort elsewhere [16, 17].
Statistical analysis
We applied generalized linear models (GLM) to compare lipid levels in the AD group relative to the Control group, and to study their relationship with brain atrophy. The GLM included covariates to control for center of origin of each sample, gender, age, APOE status, batch effect, and internal standard. When the analysis was segregated according to age, the GLMs were separately applied to two non-intersecting age bins, corresponding to percentiles 0–50th and 50–100th. Each one of these bins therefore contained the same number of samples (ca. n = 170 for status, n = 60 for sMRI). More detailed methodology on the statistical analysis carried out in the Results section can be found in the Supplementary Material S3. Figure 1 shows a schematic workflow of the data used in this study.
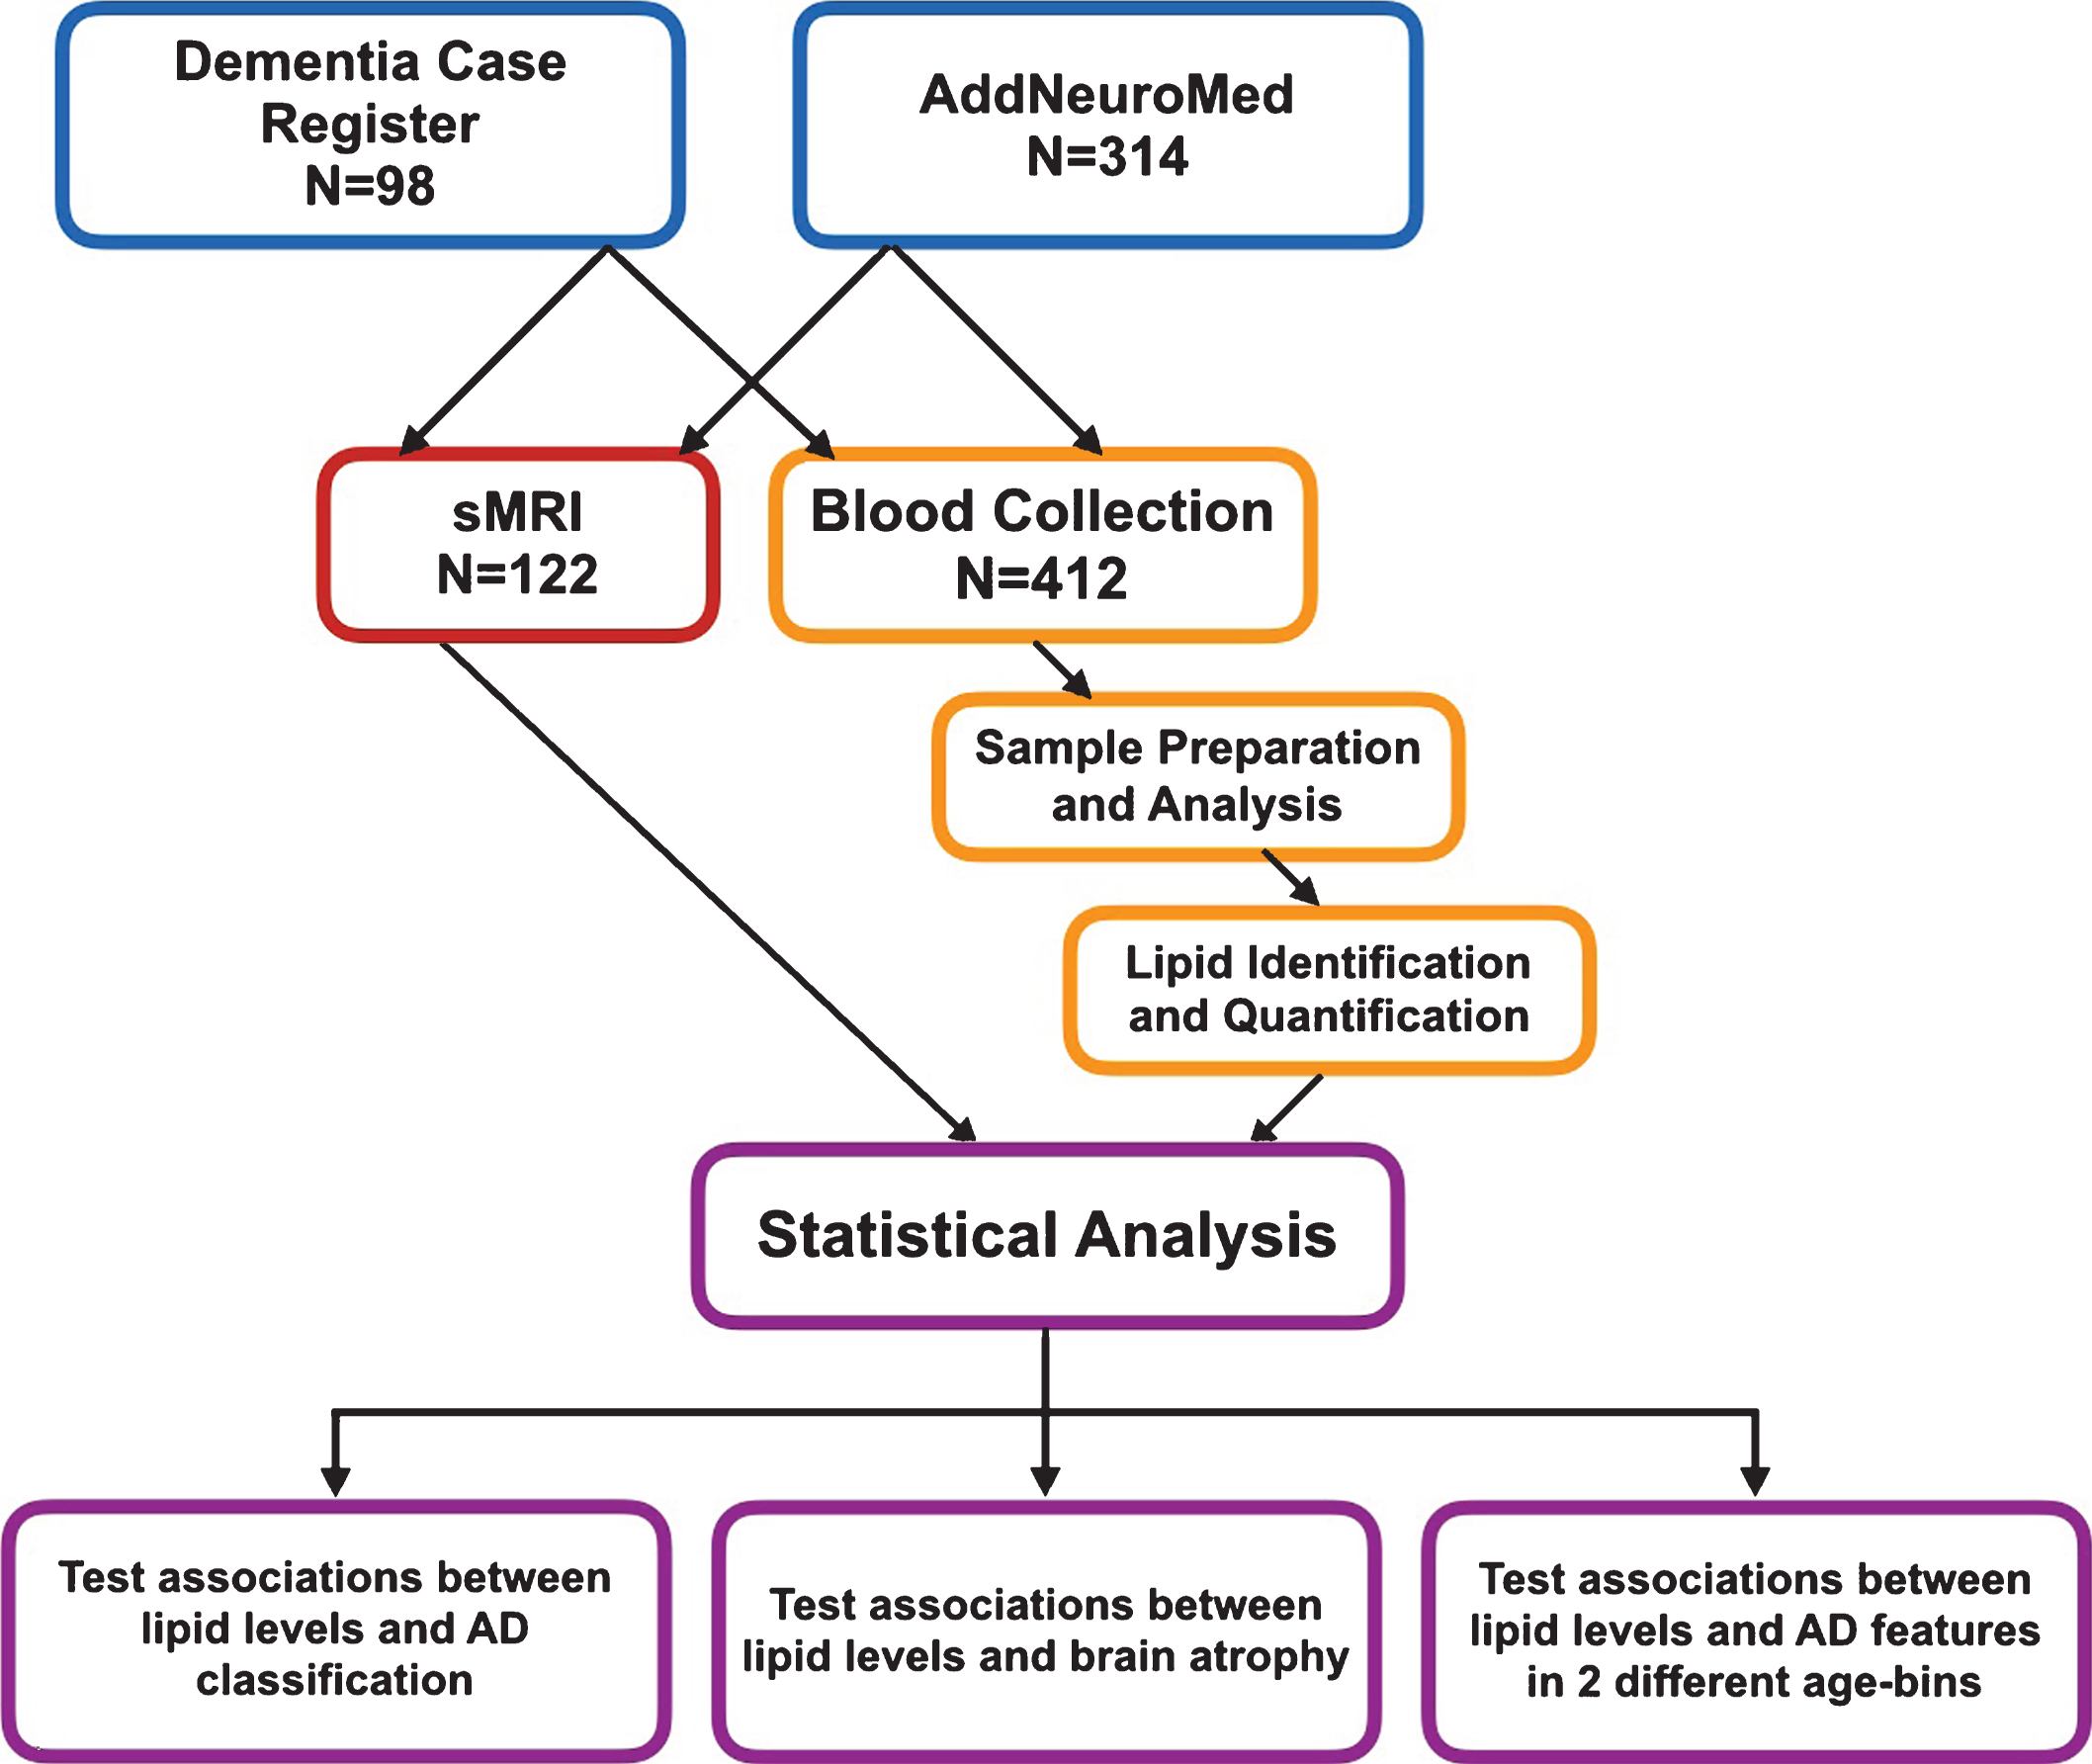
Workflow of this study sMRI, structural magnetic resonance imaging.
RESULTS
Participant characteristics
The demographic characteristics (age, gender, APOE, cholesterol levels, triglyceride levels, and volume in four different brain regions) of participants by diagnostic group, are shown in Table 1. AD participants were slightly older than controls; this is usual in AD studies with a relatively larger sample size [18, 19]. The AD group had a higher percentage of APOE carriers and presence of brain atrophy(p-values <0.001). There were no significant differences between the groups on high density lipoprotein, low density lipoprotein, total cholesterol levels, and total triglyceride levels.
Ceramides
Elevated ceramide levels in AD plasma
Six ceramide levels from 202 plasma samples from the AD group and 207 plasma samples from the cognitively healthy group were compared using GLM. Figure 2 shows the distribution of all ceramides, suggesting that some of them are elevated in the AD group (in red). Table 2 confirms that single molecule plasma levels of Cer16:0 (p < 0.01), Cer18:0 (p < 0.01), and Cer24:1(p < 0.05) in particular were elevated, while no significant differences were observed for Cer20:0, Cer22:0, and Cer24:0. T-values were derived from GLM (Table 2) and showed that the magnitude of the effect was the largest for Cer18:0 (–2.99), followed by Cer16:0 (–2.94) and Cer24:1 (–2.49). T-values for the non-significant ceramides were, following the same order, Cer24:0 (–1.89), Cer20:0 (–1.75), and Cer22:0 (–1.42).
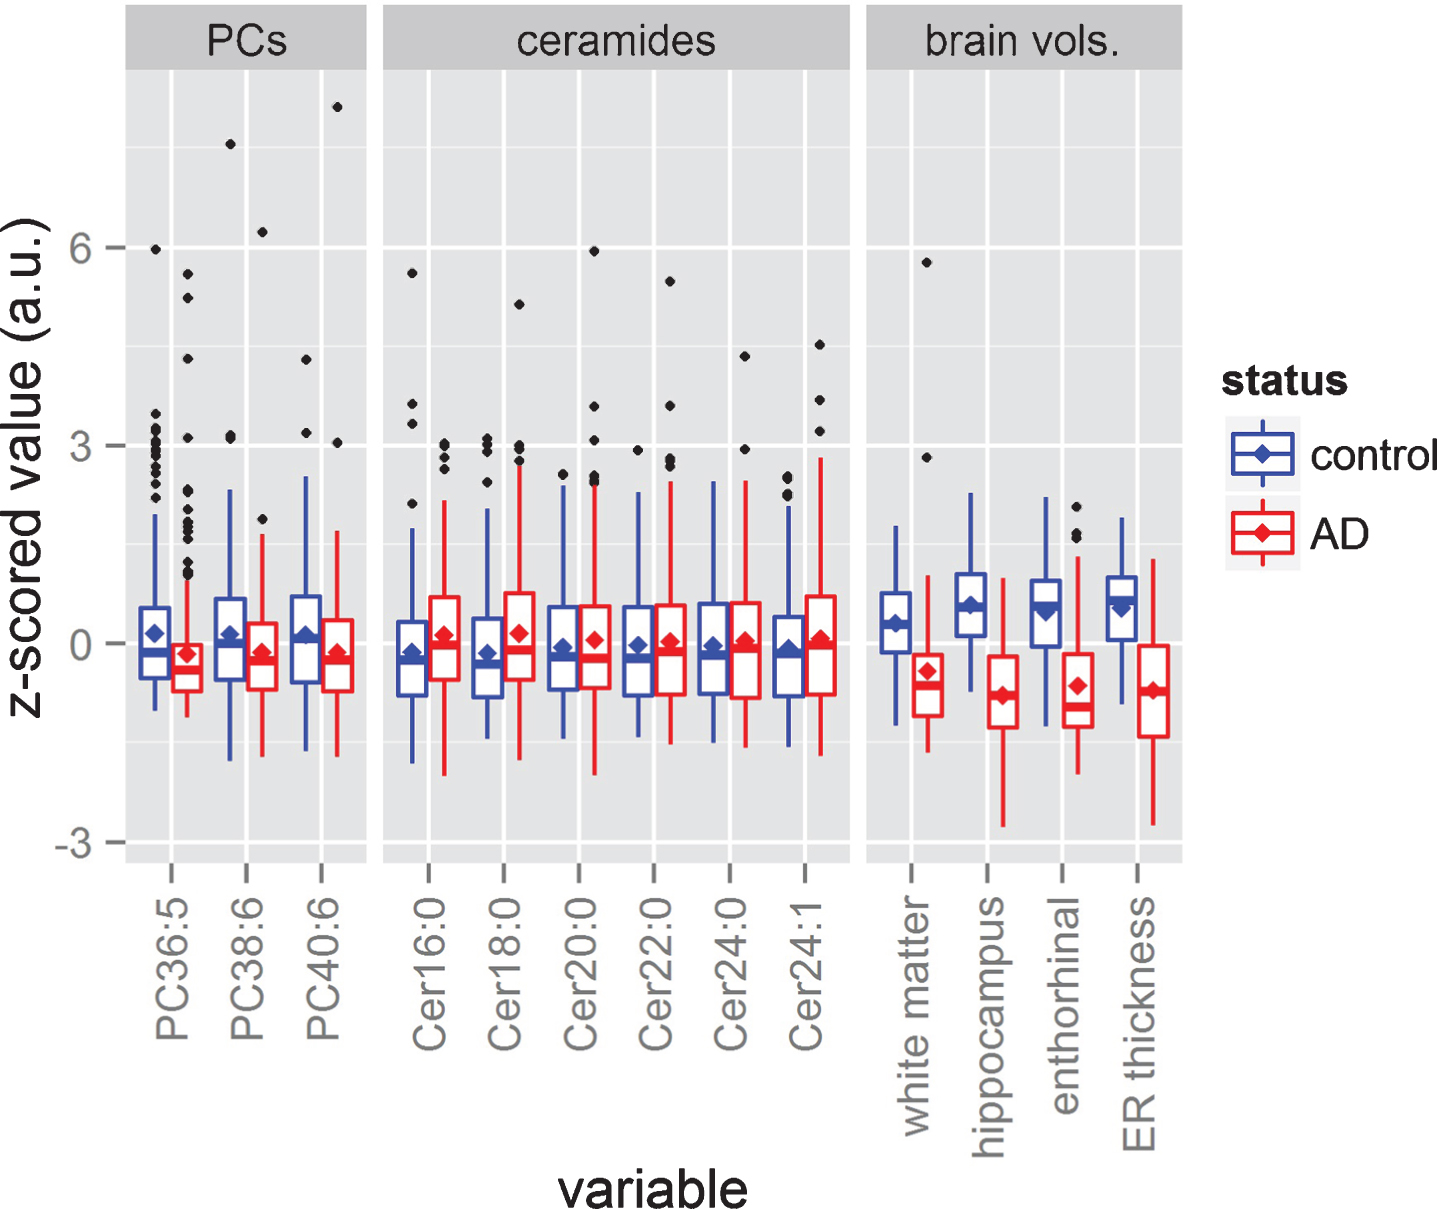
Data distributions. The figure shows the box plots corresponding to each phosphatidylcholine (PC), each ceramide, and each brain volume. All variables have been z-scored to ease visual comparison. The sizes of the boxes represent the 25th and 75th percentiles, while the central horizontal line dividing both boxes represents the median, and the mean is represented as a rhomboid. The length of each whisker extends to 1.5 times the length of the box of its corresponding side. Samples beyond the length of the whiskers are represented as induvial black dots.
Group differences in lipid levels between AD and control group. The table shows the mean and standard deviation for each one of the lipids measured in this study. Second column and third column show mean and standard deviation (SD) values for the control and AD population respectively. The last two columns show the t-values and p-values derived from GLM for pairwise comparison between the groups
1n = 412; 2n = 314.
Using the same GLM approach, we then tested if single ceramide levels would associate with atrophy in white matter, hippocampus, entorhinal, and ER thickness as measured in 122 participants. The statistical results tabulated in Table 3 show that there was no association between the ceramides and atrophy in these four brain regions. Figure 3 summarizes these associations, including ceramides and PCs in the same figure for comparison.
p-values derived from GLM when testing for associations between lipid levels and atrophies of 4 brain regions and APOE status
1n = 412; 2n = 314.
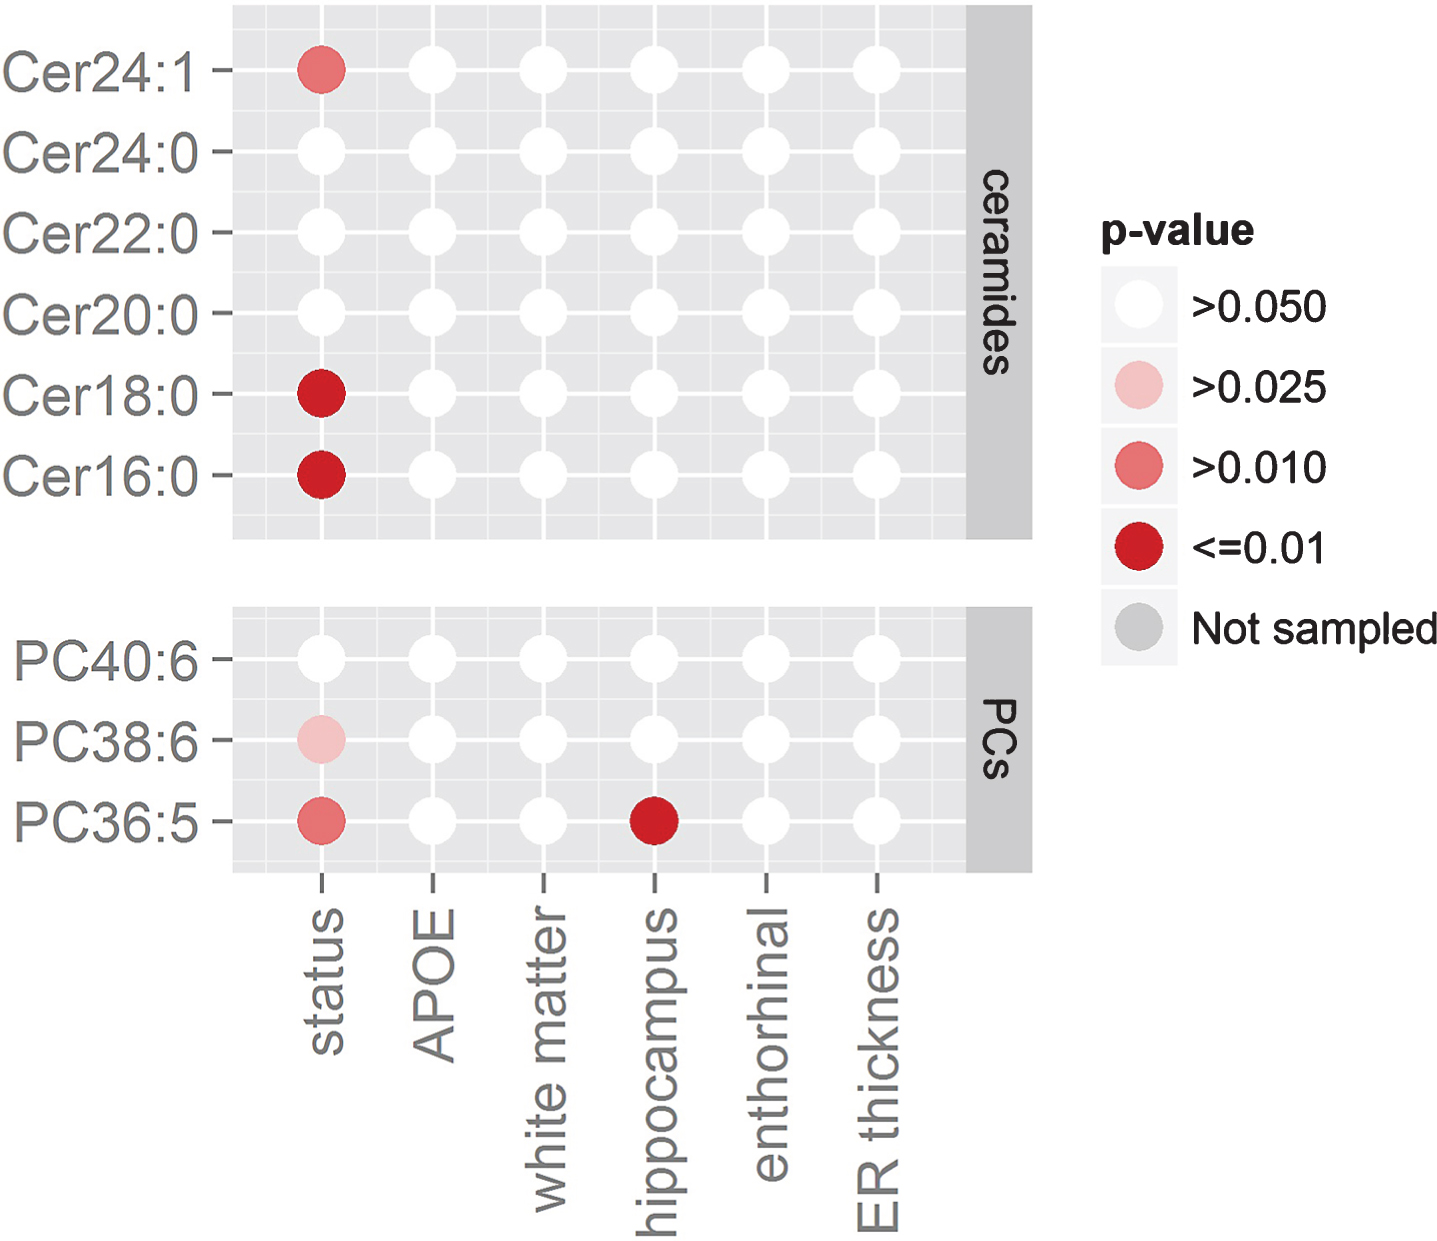
Effects found with generalized linear models (GLM). Statistical results of the GLM on the combined AD cohorts. Columns represent AD demographics variables while rows represent the lipids levels. Different shades of red indicate different standard significance thresholds.
Ceramides in age-bins
Previous GLM analyses (Fig. 3, Table 2) showed Cer16:0, Cer18:0, and Cer24:1 associating with AD status but not with brain atrophy. However, this type of analysis (i.e., pooling all subjects together independently of age) may mask some age-specific associations (age trends of metabolite groups and brain volumes shown in Fig. 4). To investigate for this possibility, we further applied GLM on AD status, brain volume measurements, and APOE status in two non-intersecting age-bins. The results of these analyses are summarized as line plots (Fig. 5 and Supplementary Material S4). The analyses showed no individual ceramides associating with AD classification and APOE status in any age-bins. When we tested the ceramide levels on brain atrophy in these same age-bins, ceramide levels were associated with greater hippocampal volume loss in relatively younger participants (Cer16:0, Cer18:0, and Cer20:0; p-value <0.05 for age <75; see Fig. 5). In this age bin, associations were also found with entorhinal volume (Cer16:0, Cer18:0, Cer20:0, Cer22:0, and Cer24:0), ER thickness (Cer16:0 and Ceer20:0), and white matter (Cer20:0; see Supplementary Material S4). In other participants (age >75), only white matter atrophy was significantly associated with Cer18:0, Cer20:0, and Cer22:0. There were no associations between ceramides and entorhinal volume, ER thickness, or hippocampal volume for olderparticipants.
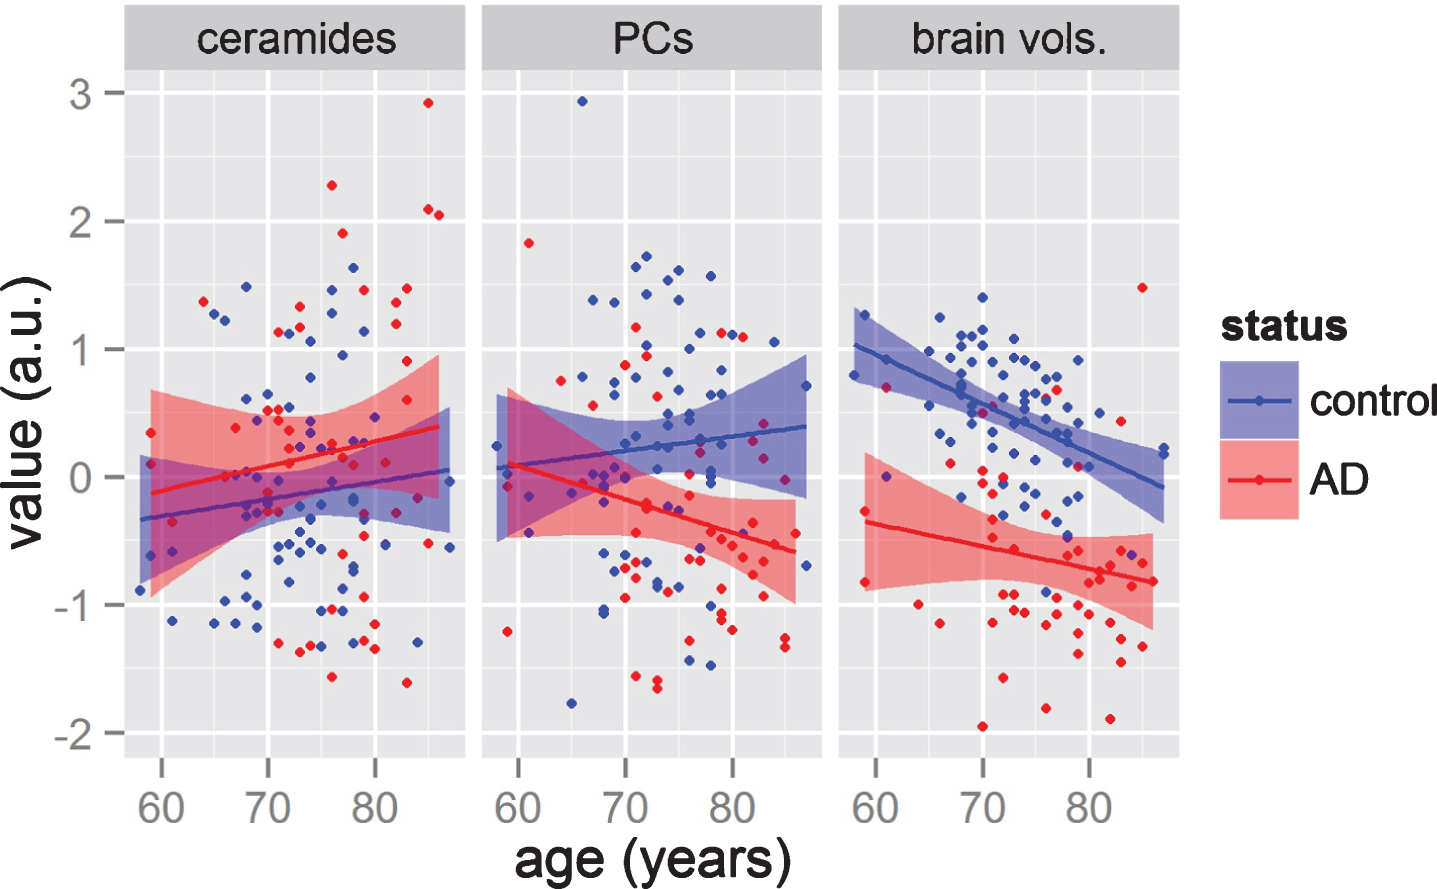
Comparisons on how variable groups (lipids and brain volume measurements) change with age in AD and control groups. The y-axis represents the averages of three groups of variables, namely: the six ceramides; the three phosphatidylcholines (PCs); and the four brain volumes (from left panel to right panel). The x-axis represents age. Each point presents a subject, while color represents the diagnosis of each patient. Solid line represents simple linear regression for each group, while the shaded area represents the 0.95 confidence interval.
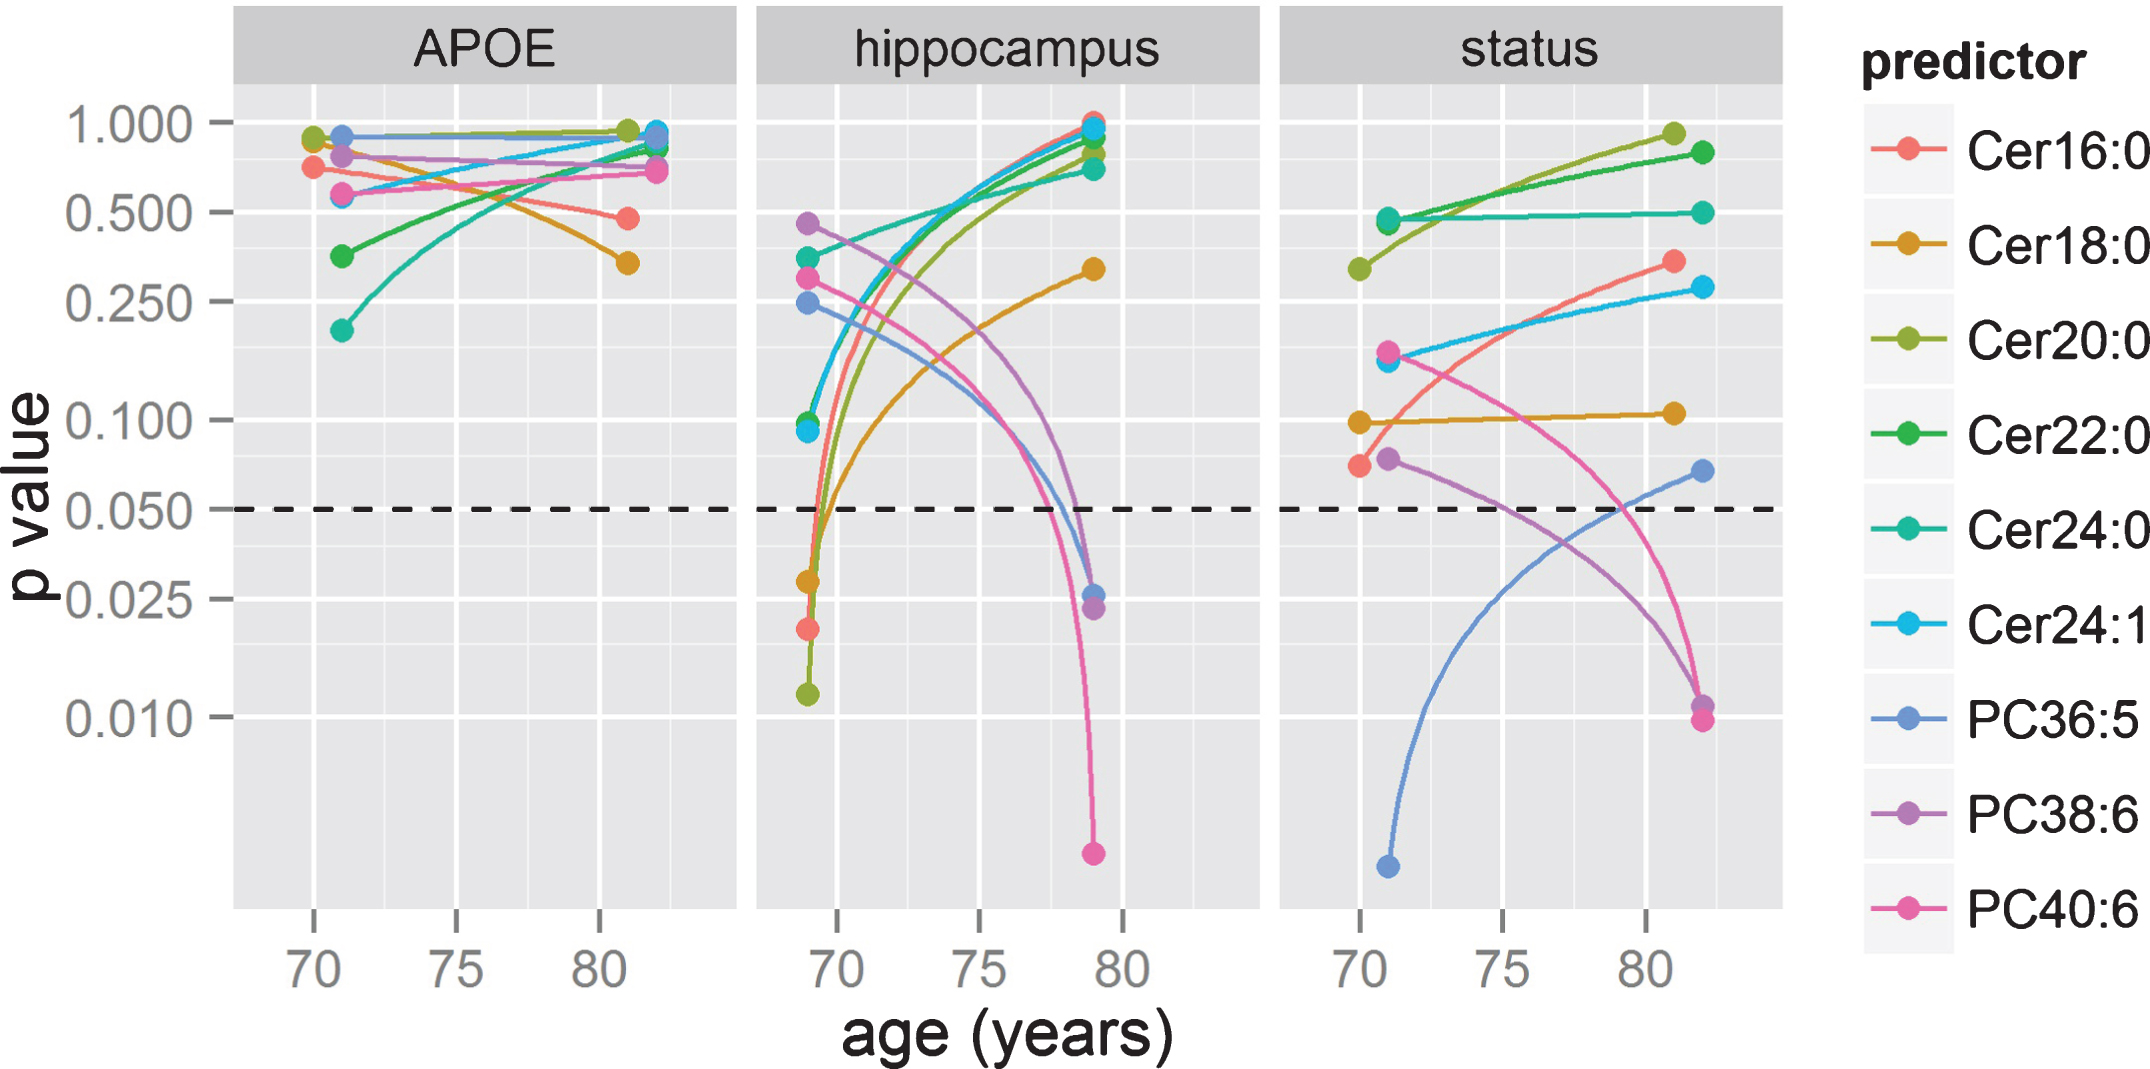
Time or age-bin analyses. GLM were applied in two age bins to statistical significance of effects between lipids and three target variables (APOE status, hippocampal volume, and AD diagnosis) based on GLM models. p-values are shown in log scale, with dotted lines representing the p = 0.05 threshold.
Phosphatidylcholines
Diminished phosphatidylcholine levels in AD plasma
Three PC levels from 202 plasma samples from the AD group and 207 plasma samples from the cognitively healthy group were compared using GLM. Figure 2 shows the distribution of all 3 PCs for ADs and controls. Table 2 confirms that single molecule measurements plasma levels of PC36:5 and PC38:6 were significantly reduced in abundance in the AD group compared to healthy control group (p < 0.05 for both PCs), while PC40:6 did not show a significant change between the groups.
In Fig. 3, brain volume measurements in 122 participants showed PC36:5 positively associated with hippocampal volume (p < 0.01). All other PC associations failed to show significance (hippocampus, entorhinal cortex thickness, and white matteratrophy).
PCs in age-bins
We applied the same analysis in non-intersecting age-bins, where PC36:5 revealed a strong association with AD status in younger participants (age <75), while PC38:6 and PC40:6 did so in the older age bin (age >75, all p < 0.05). Associations of all PCs with hippocampal volume, and of PC36:5 with entorhinal volume, were found only in the older age bin. No other associations were found with PCs when segregating into older and younger participants (Fig. 5 and Supplementary Material S4).
DISCUSSION
A number of reports have implicated lipid dysregulation in AD pathology [8–10]; to explore these findings further, six ceramide and three phosphatidylcholine species were measured and compared between AD and a cognitively healthy volunteers. We tested whether lipid levels were associated with AD diagnosis and brain atrophy, and after this, we divided the samples into two non-intersecting age-bins, each bin represented by the same number of participants, and tested whether the associations between lipid levels and AD would be significant in any of these age-bins.
This study found that from the six abundant ceramides measured in plasma and previously shown to be implicated in AD, three ceramides, Cer16:0, Cer18:0, and Cer24:1, were elevated in the plasma of AD patients compared to cognitively healthy group. As mentioned previously, there are several studies that have reported ceramide elevation in AD brain [5, 20] and others, which report increased expression of sphingomyelinase, the enzyme that synthesizes ceramides [21, 22]. Ceramide involvement in neuronal death is likely to be related to its capability to activate caspase 3 [23, 24]. Another possible factor is that in neurons, oxidative stress induced by amyloid-β accumulation can cause overexpression of sphingomyelinase, this in turn causing elevated ceramides. Interestingly, ceramides have also been found to stimulate amyloid-β production, which again would result in an increased rate of neuronal death [25].
With aging representing the greatest risk factor for late-onset AD [26], we explored how associations between ceramides and AD classification varied with age. In doing this, we found no associations between ceramides and AD status in any of the two age-bins. This result contrasted with the GLM models when calculated with all the participants in the study (Table 2 and Fig. 3) that showed three ceramides associating with AD status. However this difference can be attributed to the smaller sample size used in the age-bins. As a reference, the minimum effect size detectable (at 80% power) by a paired t-test when using the full sample would vary between 0.14 and 0.26 standard deviations (depending on the number of patients where lipids and imaging were measured), with age-bin segregation increasing this minimum by ca. 50% (see Table 4).
Statistical power associated with each analysis. In this study, different numbers of samples were available depending on the variables that were compared (metabolites and demographics). The temporal analysis of Fig. 5 further reduced the number of samples by a factor of 2 for each age bin. The table indicates what is the minimum effect size (in numbers of standard deviations) that could be detected with a t-test for the available number of samples corresponding to each comparison
*Effect size corresponding to power 80%.
Despite the power limitations of segregating into two bins, upon testing how relationships between ceramide levels and hippocampal volume loss varied with age, we observed levels of Cer16:0, Cer18:0, and Cer20:0 elevated in the plasma of younger participants (in ages below 75). Ceramides were also frequently associated with entorhinal volume and thickness in these younger participants (see Fig. 4 and Supplementary Material S4). Hippocampal and entorhinal atrophy is known to occur before symptoms of cognitive decline during AD development [27] and accumulation of ceramides have been linked with a higher risk of developing AD [9, 28]. Our data suggests that higher levels are also detected in younger individuals with hippocampal atrophy, potentially adding evidence to a role in phenoconversion. This is very interesting since it could mean that ceramides have an important role in early diagnosis or as proposed by Mielke et al. [28], in phenoconversion.
In addition to ceramides, we also measured PC36:5, PC38:6, and PC40:6. These molecules were linked to AD when they were found associated with decline in AD cognitive function [10] and memory loss in healthy aging [29]. After comparing the PC levels in 412 plasma samples, we observed diminished PC36:5 and PC38:6 levels in AD plasma, partially replicating our previous findings. The lower PC levels reported here could be as a result of upregulation of PC hydrolysis induced by increased phospholipase A2 (PLA2) activity and amyloid accumulation [30]. These PCs also contain omega-3 poly-unsaturated fatty acids (ω-3 PUFA). PC36:5 contains an eicosapentaenoic acid (EPA) as part of its molecular structure, while PC38:6 contains a docosahexaenoic acid (DHA) [10]. These fatty acids are thought to be absorbed into the brain when contained in molecules of another lipid family, lysophosphatidylcholines, which are direct metabolic products of PCs [31]. ω-3 PUFAs are well known for their neuroprotective properties in brain with higher omega-3 content being associated with lower incidence of dementia [32, 33]. Higher PCs in plasma (i.e., assuming higher ω-3 PUFA in plasma) could have neuroprotective properties by increasing ω-3 PUFA present in the brain. This hypothesis could be supported by a report which demonstrated that a ω-3 PUFA containing PC diet resulted in increased anti-inflammatory activity in the brain [34] and a recent study examining 2,000 healthy patients that found that during healthy-aging plasma shows an increasing trend for PC levels [35]. We also observed lower level of EPA containing PC36:5 associating with hippocampal atrophy, these initial finding may be explained by EPA acting as an competitive inhibitor of arachiodonic acid (AA) thus resulting in down-regulation of pro-inflammatory AA-derived metabolites such as eicosanoids [36, 37].
When we assessed how associations between PCs and AD varied in different age-bins, we found that PCs showed no associations with APOE, white matter, or entorhinal cortex thickness atrophy in the two age-bins. However, all three PCs were associated with hippocampal volume in older participants, while PC36:5 was also marginally associated with entorhinal volume in this same age group. PC36:5 was strongly associated with AD in younger participants, while PC38:6 and 40:6 were so in the older age bin, suggesting changes in peripheral PC levels may be also age-related or related to the AD severity stage.
In conclusion, we found the levels of two PCs and three ceramides altered in AD plasma when compared to cognitively healthy plasma. Ceramides were found to be increased in AD and associated with hippocampal and entorhinal atrophy in younger participants (age <75). PCs were found decreased and associated with status, especially in older participants for PC38:6 and 40:6 (age >75), but in younger participants for PC36:5. These results contribute to the growing body of evidence that peripheral lipids are implicated in AD pathology. More work is needed to understand the relationships between plasma lipids and AD progression, and importantly, to decipher if they should be considered as biomarkers for diagnosis or targets for AD therapies.
Footnotes
ACKNOWLEDGMENTS
We thank the individuals and families who took part in this research. We would also like to thank the support provided by the National Institute for Health Research (NIHR) Mental Health Biomedical Research Centre and Dementia Unit at South London and Maudsley NHS Foundation Trust and [Institute of Psychiatry, Psychology & Neuroscience] King’s College London and the 7th Framework Programme of the European Union (ADAMS project, HEALTH-F4-2009-242257). AddNeuroMed was funded through the EU FP6 programme. Petroula Proitsi is an Alzheimer’s Society Post-Doctoral Fellow. Richard JB Dobson and Cristina Legido-Quigley are partially supported from the Innovative Medicines Initiative Joint Undertaking under EMIF grant agreement No. 115372, resources of which are composed of financial contribution from the European Union’s Seventh Framework Programme (FP7/2007-2013) and EFPIA companies’ in-kind contribution. This research was also supported by researchers at the National Institute for Health Research University College London Hospitals Biomedical Research Centre, and by awards establishing the Farr Institute of Health Informatics Research at UCLPartners, from the Medical Research Council, Arthritis Research UK, British Heart Foundation, Cancer Research UK, Chief Scientist Office, Economic and Social Research Council, Engineering and Physical Sciences Research Council, National Institute for Health Research, National Institute for Social Care and Health Research, and Wellcome Trust (grant MR/K006584/1). The funding bodies had no role in the design, collection, analysis, interpretation of the data, writing of the manuscript and the decision to submit the manuscript.