
Abstract
Recently ubiquitous cities have been developed all over the world. They aim at embedding information and communication technology, information services and digital content in the urban landscape to make the citizens’ everyday lives easier. One of these future-oriented cities is Oulu in Finland. It makes part of the most “intelligent” communities in the world. Oulu offers an information and communication infrastructure based on the UbiOulu project. Interactive screens offer different services and free WLAN is accessible at several places. As information services become more and more complex these days, new evaluation methods need to be developed. The offered services are examined with the help of the ISE Model that will be introduced in this paper. The study will answer the fundamental research questions “Do the citizens of Oulu accept and use the touch screen monoliths of the media poles?” and “Do the citizens of Oulu accept and use the city-wide free WiFi?” The main results are: In times of smartphone use, touch screen monoliths are more or less needless, but city-wide WiFi is essential. Furthermore, it is very important to create appropriate city-specific information content to be distributed by city-specific apps or through social media channels.
Introduction
U-city services
For Mark Weiser [50], ubiquitous computing is “the idea of integrating computers seamlessly into the world” [49, p. 94]. In a ubiquitous city (or, in short, a u-city), ubiquitous computing is realized on city-level. Information is omnipresent and everyone should be able to create and to retrieve information whenever and wherever a need arises.
You can find u-cities and approaches to construct them all over the world. Especially in Korea there are lots of projects of such information-rich cities [19,40]. U-city services consist, for instance, of services delivered via media poles such as the touch screen monoliths in Seoul’s Gangnam district, of services created for the use of smartphones (apps), and of services which depend on sensors (Fig. 1). The services are oriented on the city-region and are context-aware (with regard to the user and the place and time she or he stays). The services are pull services (when the user is asking the system) as well as push services (when the system actively informs the user). There are specific services for and by companies, administrations, citizens and other user groups, e.g. tourists. “A u-city…includes a sensory network and context-aware information management systems with a variety of distributed devices and autonomously working software” [18, p. 151]. If the city additionally refers to sustainability and livability, some authors speak of “smart cities” [4,13].
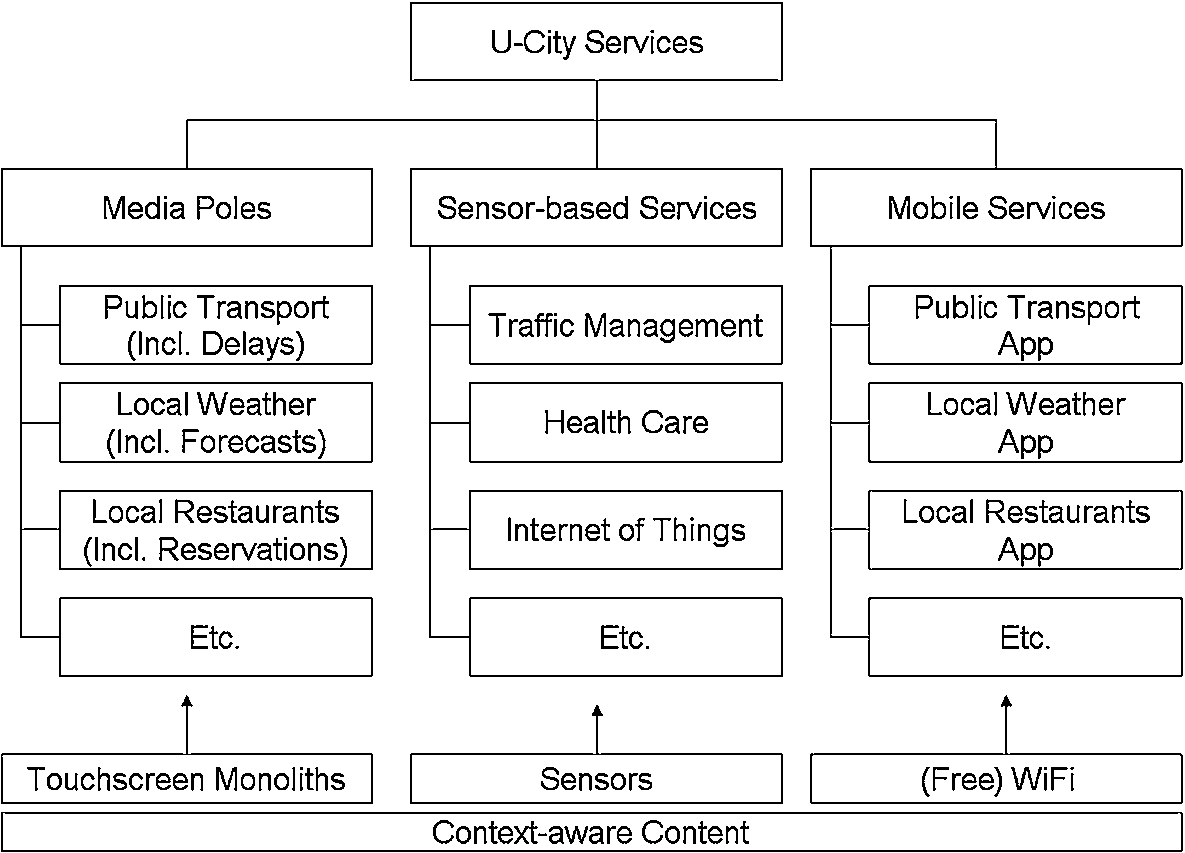
Exemplary services of a ubiquitous city.
U-city services are highly complex. Do users accept such large systems? The construction and maintenance of u-cities is expensive. So we are in need of identifying successful services for u-city development [18]. What service is or will be accepted by the users? There are only few empirical studies on the adoption, use, impact and diffusion of u-city services. In the literature we found a model of ubiquitous computing acceptance [41], but no comprehensive model of the acceptance of u-city services.
In the light of the literature and of the complexity of the u-city services, it becomes clear that it is not possible to apply the classical Technology Acceptance Model (TAM) [6]. So, for instance, it does not make much sense to ask users for the ease of use of free WiFi. And the TAM has been applied to study acceptance of information services in companies. When we analyze u-city services the scope must be much broader: We have to consider all members of a society, including children, students, households, social communities, etc. “This is also attributable to Information Technology becoming a ubiquitous part of daily life ever since the introduction of ICTs” [3, p. i].
Our Information Service Evaluation (ISE) model.
This article is part of a research project on prototypical cities of the knowledge society (the so-called “informational cities”) [25,43] and focuses on a case study that analyzes the u-city of Oulu, a city in Northern Finland considered as the smartest city in Europe, which is justified by ranking top seven in the Intelligent Community Forum (ICF) Finals 2012 in New York.
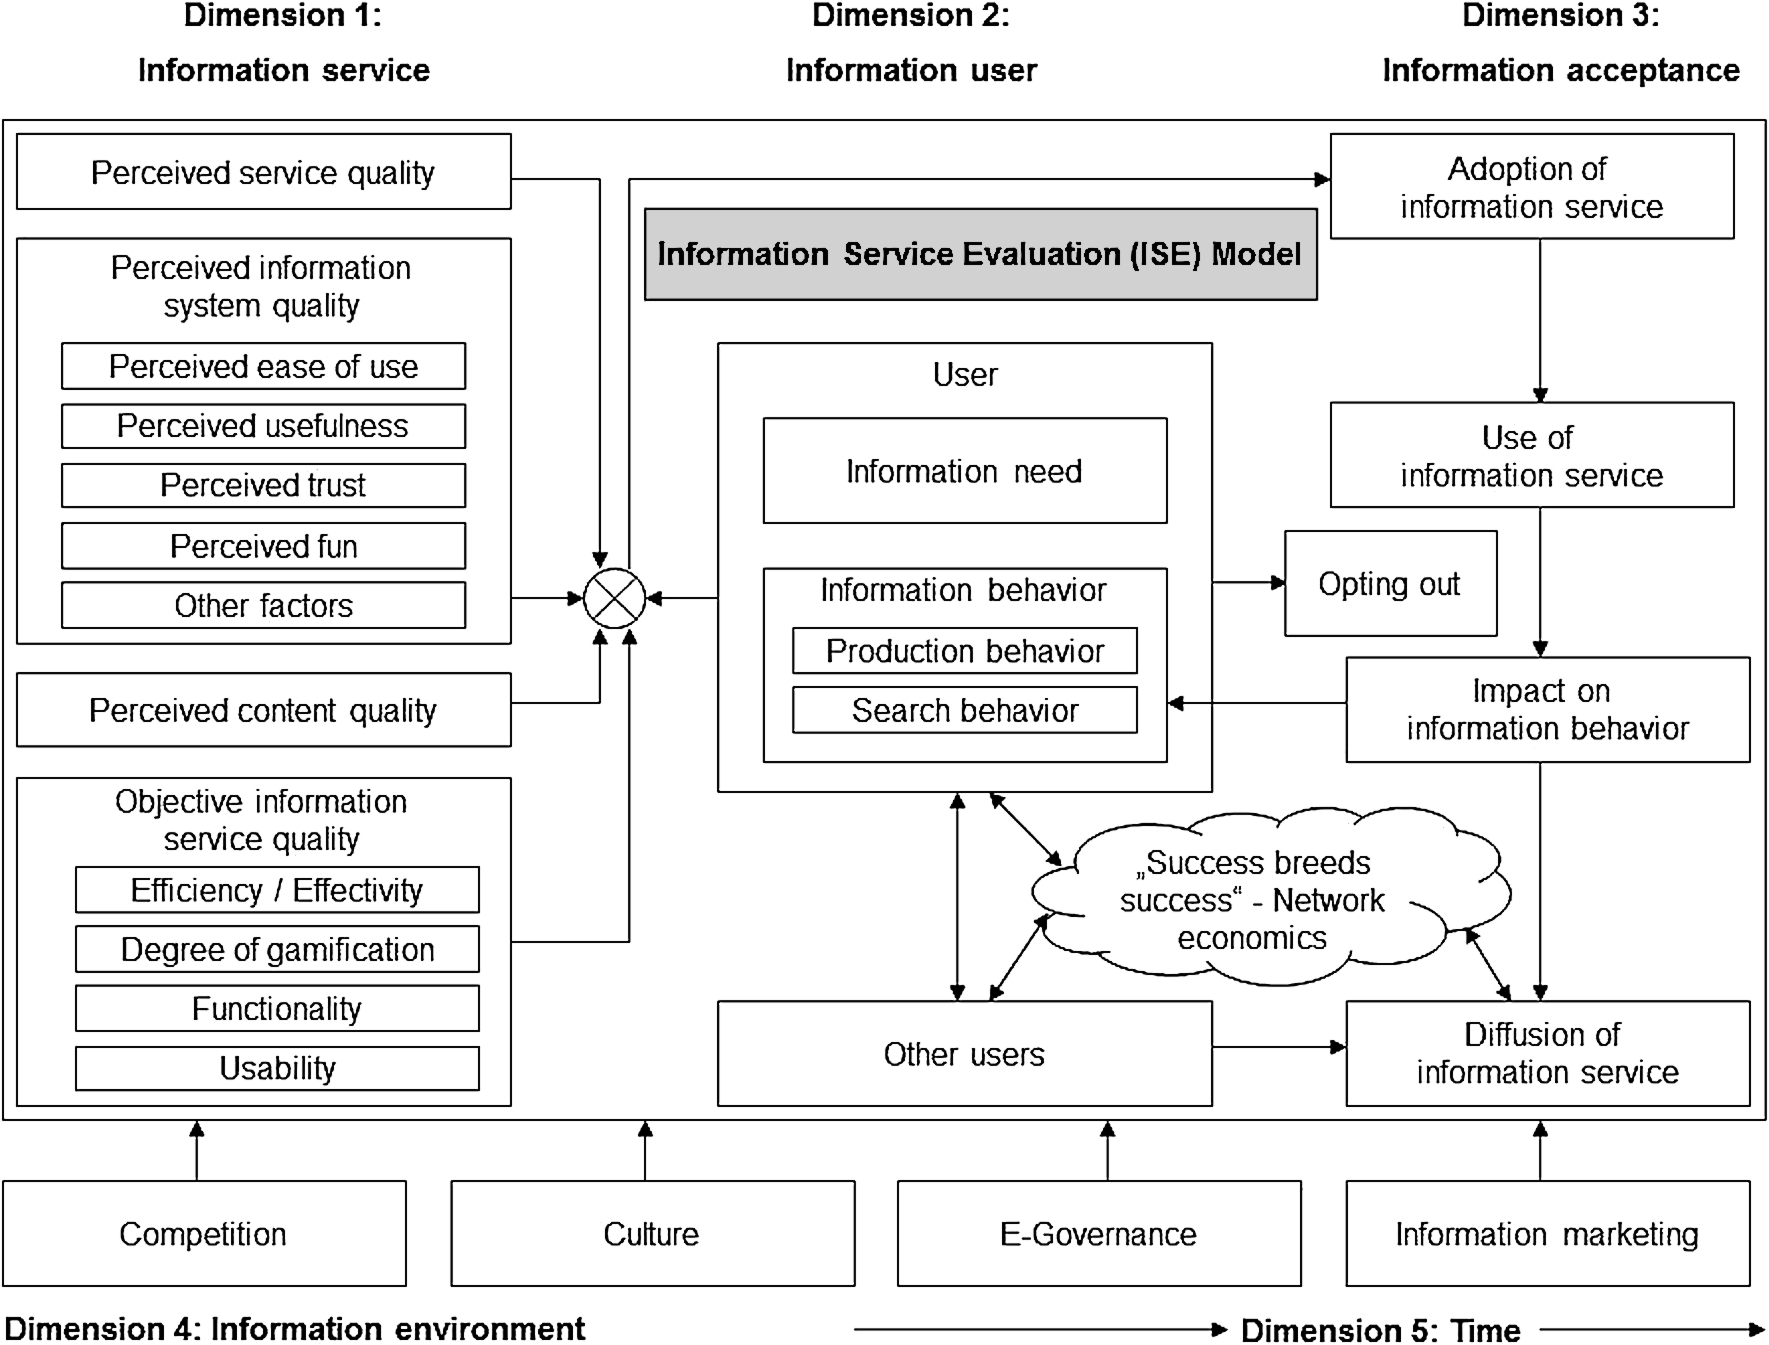
We introduce a comprehensive model that allows us to span a theoretical framework for all aspects of the evaluation of (even large) information services. It is valid for the study of information services in companies and other institutions as well as in everyday life, for instance in households, in schools or in social communities. The Information Service Evaluation (ISE) Model (Fig. 2) consists of five dimensions:
Information service, information user, information acceptance, information environment, and time. A historical point of origin for the evaluation of information systems in general is the registration of technology acceptance in the workplace [6,47], which uses subdimensions (initially: “perceived ease of use” and “perceived usefulness”, later supplemented by “perceived trust” and “perceived fun”) in order to measure the quality of the information service’s technical make-up. The trust dimension is particularly significant in e-commerce systems [11]; while the fun dimension is most important in Web environments [27] and in digital games [46]. In the model proposed by DeLone and McLean [7], the technical dimension is joined by information quality. The perceived content quality concentrates on the knowledge that is stored in the system. DeLone and McLean [8] as well as Jennex and Olfman [15] expand the model via the dimension of service quality. When analyzing perceived service quality, the objective is to inspect the services and the way they are perceived by the users. Venkatesh et al. [48], in their Unified Theory of Acceptance and Use of Technology (UTAUT), included further factors such as social influences and facilitating conditions into the model. Meta-analyses of TAM [16,20] show the usefulness of this model (in organizational settings as well as in household, residential and consumer contexts [9]), but they show also, that TAM has to be integrated into a broader model. Especially in environments, where information services are ubiquitously available [38], TAM and UTAUT only reflect parts of the whole story. The quality of an information service depends not only on the perception of its quality, but upon objective (user-independent) measures of the service’s quality. Aspects of objective service quality include the range of functions it offers [44, pp. 486–488], its usability [30], and the system’s effectiveness (offering the “right” services) and efficiency (touch screen sensibility and speed of system reactions, amongst others). Some information systems adopt elements of gamification, i.e. the use of game mechanics in non-game contexts, to motivate the users to continue using the system. Information science separates three groups of users [44, pp. 467–468]. An information professional is an expert in working with information systems. The professional end user is a specialist in an institution who processes, ad hoc, simple information needs that arise in the workplace. The layman end user, finally, usually is applying some Web 2.0 services (e.g., Facebook and YouTube), email and perhaps some digital games. Depending on the level of their level of information literacy [44, Chapter A.5], users from the three groups will interact in different ways with information services. A central point for using or non-using an information service is the information need of a person. Fundamental human needs are of physiological nature (food, water, sex, etc.), and aim for safety, love, esteem and self-actualization (e.g., problem-solving or creativity) [26]. Information needs are not featured in Maslow’s classical theory of needs. However, many fundamental human needs require information in order to be satisfied. It starts with information seeking in order to locate sources of food, water and sex, and ends with problem-solving, which can only be achieved via knowledge (to be sought and retrieved). For Wilson [51, p. 8], the object is “information-seeking towards the satisfaction of needs”. The information-related motives that result from our fundamental human needs could be abbreviated to “information needs”. An individual’s information need is the starting point of any information behavior (information production and information search behavior) [5]. In addition to the user’s information behavior and his or her information needs, we have to study further person-related factors such as gender, age, digital native/digital immigrant [1,37], nationality, ethnos, etc. Without user research, no serious evaluation of information services is possible [12]. If the “right” person in an appropriate situation meets the “right” information service, she or he will adopt and use this service. Adoption has two faces. Supplier-side adoption means that a service-provider realizes a certain service. If the company is the first one which introduces this service, it is a “first-mover” or an “innovator”; if not, it is a “second-mover” or an “imitator” [21, pp. 361–375]. In contrast, consumer-side adoption means that a user applies the supplied service for the first time [10]. Adoption does not mean use. One can adopt a service and stop to use it. And one can adopt it and use it permanently. In the case of use it is possible that the user’s information behavior will change. This aspect will be called “impact”. Of course, a user is able to stop using the information service and opts out. Finally, an information service will diffuse into a society (or, in our case, into a city), when many people use it and it has impact on their information behavior. Diffusion is a typical phenomenon of network economics following the principle of “success breeds success”. The more users an information service is able to attract the more its value will increase. More valuable services will attract further users. If an information service passes the critical mass of users, network effects will start. This leads to positive feedback loops for direct network effects (more users–higher value–even more users) and indirect network effects (more complementary products–more valuable service–even more complementary products) and in the end to a standard [21, pp. 51–61]. Diffusion is a social process depending on the extent to which friends, family members, peers, colleagues, club members, etc. influence a user’s information behavior [29]. Information services and information users are embedded in contexts. Important aspects of the information environment are cultural influences [2], governance [52], the market situation (including competitive services) and marketing for the information services [45]. Information services have their own history. A new service shows different adoption, usage, impact and diffusion figures than a well-established service. So it is necessary to conduct longitudinal studies to evaluate an information service [47].
(Information service).
(Information user).
(Information acceptance).
(Information environment).
(Time).
Case study: Oulu
With over 143,900 inhabitants [42] and the fastest growing region in Finland, Oulu is the largest city in Northern Finland and the sixth largest city of the country. It covers a surface area of 1,513 km2 and is home to 800 high-tech companies such as Nokia. Oulu has a labor force of 89,000, with 17,400 being in the area of ICT. Most important employers are the city administration of Oulu, the Northern Ostrobothnia Hospital District, the University of Oulu and the Nokia Group. Oulu is the most popular place for study in Northern Finland. The University of Applied Sciences has 8,700 students and the University of Oulu with its six faculties (humanities, education, science, medicine, economics and technology) has 15,864 students [42]. Oulu has an own airport with the second-largest passenger number in Finland. Oulu is internationally known as a city of technology and has a highly developed technical infrastructure and the largest regional research and development (R&D) expenditure per capita in Finland [31]. Within the scope of the Intelligent Community Forum (ICF) Oulu is considered as the smartest city of Europe by ranking top seven of the intelligent communities of the year. The ICF defines their top seven by following characteristics: “The Top Seven represent models of economic and social transformation in the 21st Century. They are not the most advanced technology centers, the most wired cities or the fastest growing economies in the world. Instead, each exemplifies best practices in broadband deployment and use, workforce development, innovation, digital inclusion and advocacy that offer lessons to regions, cities, towns and villages around the world. They are charting new paths to lasting prosperity for their citizens, businesses and institutions” [14].
U-city services: UbiOulu
The Open UBI Oulu initiative is led by the UBI (UrBan Interactions) research program coordinated by the University of Oulu [36,39]. The project is funded by various public sources, industry and 3rd parties which use UbiOulu for commercial purposes and work in close collaboration with the City of Oulu. The official definition of the UbiOulu project is the following: “The Open UBI(quitous) Oulu has many facets. It is a functional prototype of a future ubiquitous city where ICT infrastructure is embedded invisibly into the urban space, turning it into a smart environment, a smart city. There different actors employ the infrastructure to provide the general public with services improving the everyday life” [36].
A great number of services appertain to the UbiOulu project. The biggest are the integration of so called UBI-hotspots which are interactive public displays that provide various information services via different interaction modalities including mobile or RFID [22] and a freely usable WiFi internet access network which is accessible in most of the public places in Oulu, called panOULU. Inherent are modules like panOULU Bluetooth (BT), panOULU wireless sensor network (WSN) and UBI-middleware which complement the UBI-hotspots and the panOULU network.
Media poles: UBI-hotspots
The beginning of the UBI-hotspots (from now on hotspots) can be considered in October 2008, when the official confirmation of the funding for the hotspot infrastructure was confirmed. Ojala et al. [34] defined a long-term vision of urban space populated with hotspots, which provide rich interaction between the physical, virtual and social spaces. Furthermore the aspect of long-term large-scale real-world studies in a dedicated pervasive computing infrastructure was a motivating aspect [31]. Before the first displays were deployed user needs that could and should be satisfied with the hotspot services and potential locations were identified by conducting in situ interviews around downtown Oulu in September 2008. With positive feedback various wanted services could be successfully identified. Some of them were public transportation schedules, municipal and commercial services, current and upcoming events in the city, news headlines, micro-weather forecast, free parking spaces around downtown and status of queues at taxi stops [34]. With the gathered experiences the first 12 displays were deployed in summer 2009 at locations which were considered the most suitable. While six of them were installed in public buildings such as the youth and culture centre, the swimming hall or the main library, six were constructed outdoors, most of them around downtown Oulu near the pedestrian area and the market area. While the indoor versions are movable and have one 57″ Full HD LCD panel in landscape orientation, the outdoor models are installed permanently on streets and have 2 adjacent LCD panels with separate control PC’s on each side. The displays are equipped with various accessories such as internet connection, quad core control PC, 500 MB RAID1 disk, 2 overhead video cameras, NFC (=Near Field Communication)/RFID (=Radio-Frequency Identification) reader and loudspeakers. They also contain panOULU WLAN, BT (=Bluetooth) and WSN (=Wireless Sensor Network) access points [31]. The panel is protected by a 6 mm safety glass. Behind the glass is a projected capacitive touch screen foil. The LCD panels and other components are confined in a weather proof aluminum casing with heating and cooling systems as Fig. 3 shows [34].
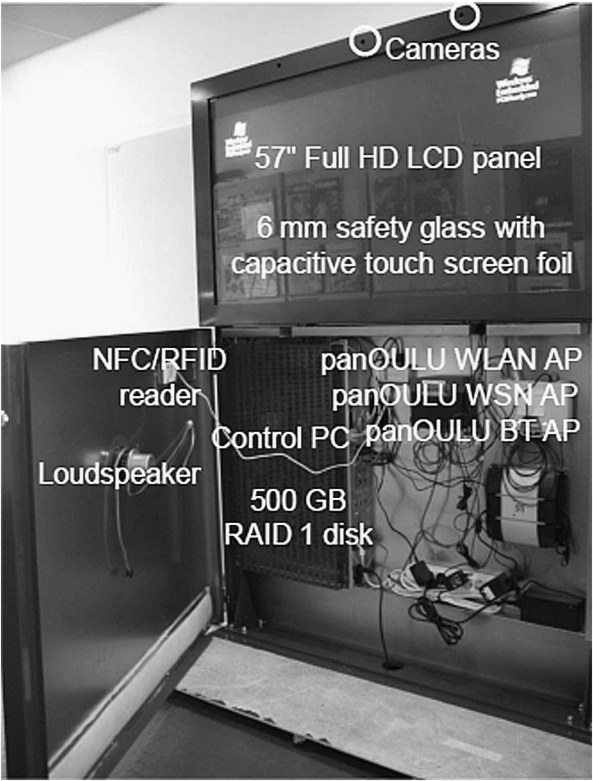
The internal structure of an indoor UBI-hotspot [34, p. 2].
Every hotspot has 2 different modes. An idle hotspot is in a passive broadcast mode where the whole screen shows the so-called UBI-channel, a customizable playlist of videos, animations and still photographs. The transition to the interactive mode is triggered if a face is detected from the video feed of the 2 overhead cameras, the screen is touched or a user presents a RFID tag to the RFID reader. Once entered the transition mode the big UBI-channel is squeezed into the upper left hand corner of the screen. Additionally 2 separate virtual screens are created. One is in the size of the UBI-channel, positioned in the bottom left corner. It gives the possibility to use different mobile services if a mobile phone is connected to the screen via Bluetooth. The second one takes most of the space of the panel and is a touch screen portal named UBI-portal which offers various information and leisure services which are referenced by their URLs and can reside on any web server in the public internet. The UBI-portal can be configured on per hotspot basis [35].
The services which are provided over the UBI-portal are accessible since May 2009. They are divided into the categories of News, Services, City, 3rd Party, Fun and games, Multimedia and New cool stuff. The category News contains relevant information about the city itself. This could be upcoming events or political aspects. Services involves public transport schedules, information about restaurants by category, location or opening times via the service Kaenkky, a map with possible highlighting of different kinds of locations (restaurants, bus stops, shopping, culture & leisure and accommodation) or sending of electronic postcards supplemented with real time photos. An event calendar or information about Oulu’s government can be retrieved via the category of City. Every interested party has the possibility to integrate its content into the hotspots for a small fee. The revenue is used for maintenance and upgrades. Actual 3rd party services are blood service, the Oulu University of Applied Science or the local cinema. Fun and games comprise classic games like Tetris, Memory or Hangman. Local artists are able to display their work for free via the service Street Gallery which belongs to the category of Multimedia. New Cool Stuff has, as its name implies, a list of the latest integrated services. The full portfolio of services available in June 2012 can be seen in Table 1.
Services offered by the UBI-portal in 2012
More functionalities include partially language selection, a service specific help page and buttons for giving thumbs up/down feedback for the currently selected service. Since the beginning of the project the overall number of displays has increased. As of today there are overall 21 displays. The UbiOulu initiative has collected massive amount of quantitative and qualitative data. On the basis of this data the project is rated as a success.
Nonetheless many obstacles have been faced: “The greatest challenge in our deployment has been maintenance. A substantial amount of our resources has been used to ensuring that the system behaves as expected, to troubleshoot faults, and even to clean the displays. Vandalism is another issue we have had to deal with. […] Finally, the deployment is challenged by economic viability and measurement of success. First, after the initial 400,000€ capital investment it has been challenging to ensure that the hotspots become self-sufficient. We have generated revenue from commercial use, but this has conflicted with research objectives. Second, the discipline as a whole lacks standardized metrics for evaluating the success of such systems. In other words, despite the availability of huge volumes of quantitative and qualitative data on the usage of the hotspots, it is challenging to measure their actual impact on the community” [32].
Originally, public displays were developed for advertisement purposes. They were supposed to catch the people’s attention. Nevertheless the services of the UBI-hotspots resemble the traditional ideas of ubiquitous computing applications [34]. The hotspot itself is defined as an artifact “that does not blend into the landscape, but is provocative enough to elicit direct reaction and promote immediate discussion about it” [34]. Still, they are not supposed to be too eye-catching. Hence the possibilities of embedding those hotspots into the environment are being improved to provide a unique experience to the users [17].
The panOULU WLAN is a city-wide WLAN network provided by a public–private partnership involving five public organizations and four ISPs (DNA, Elisa, LAN&WAN, Netplaza) [33]. The network is based on the panOULU cooperation agreement which was signed in 2003. The first concept of the network is built on the triple helix model of academia–government–industry, as the network is an innovation born from such relations: the local University as the driver with the generation of intellectual capital, the government as an enabler with the control of the public sphere and the industry as a stakeholder with the creation of wealth. Since the realization of the project, the installation of access points (APs), which are necessary to distribute WiFi, has increased from commencing six APs in 2001, to 150 APs in 2003, to 610 AP in 2005 and up to approximately 1,350 APs in 2012. Figure 4 shows an overview of all installed APs in and around Oulu.
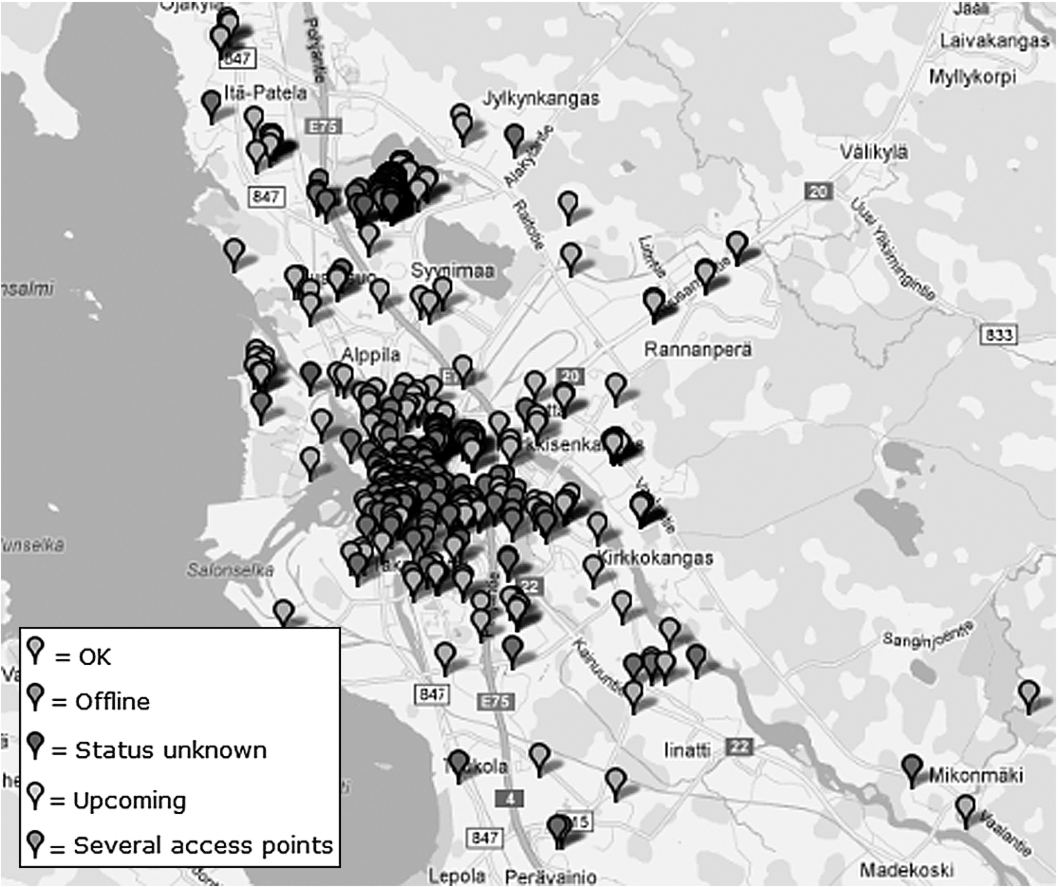
Overview of APs in and around Oulu contributing the panOULU network in 2010. Based on Google Maps.
As seen in Fig. 4 the highest concentration of APs is inside Oulu. Approximately 500 of them are deployed within a 1 km radius at the city centre. The positioning of the APs focused on covering every important public place in and around. In its coverage area the panOULU network provides open and free wireless internet access to the general public equipped with a WLAN device. That implies that no authentication or registration is necessary and the usage is always free of charge. However, it is not possible to access the panOULU network in all places of Oulu which is an often made misapprehension. Currently there are no limitations or restrictions on the use of the WiFi service. A barrier-free information access for satisfying any eventual information need is therefore possible. Additionally more and more services are complemented into the panOULU network. This comprises an e-mail server, a communication server, news feeds and the panOULU Luotsi information mash-up which is a program that retrieves information relevant to the user’s current location displayed on a map for a location-based browsing view about nearby services, sites and events of interest. The large coverage combined with the open and free access makes the panOULU WLAN network a valuable R&D resource. One can see an increase of 20,000 panOULU network’s users between November 2006 and February 2011. This can be explained by the continuous expansion of the network and the increasingly popularity of handheld devices such as smartphones and tablet PCs.
The research questions are:
“Do the citizens of Oulu accept the touch screen monoliths of the media poles?”
“Do the citizens of Oulu accept the city-wide free WiFi?”
The case study aims at finding out more about the acceptance and the usage of the implemented information technology and its content in Oulu. The survey is based on the assumption that the citizens of Oulu use the offered technology regularly and have accepted it as an inherent part of the city’s infrastructure. It is a quantitative study. This method was chosen to obtain representative results about the usage and the acceptance of the offered ubiquitous computing infrastructure in downtown Oulu.
The multi-pronged study was conducted in Oulu, Finland, in May 2012. The study consists of two questionnaires which were filled in by students of the Oulun Lyseo Upper Secondary School and students of the University of Oulu and interviews with some of the stakeholders of the project. The interviewees are six people that are strongly involved in the project and know a lot about the user’s opinions and the project itself. The study was divided into two major subject areas: the panOULU network and the UBI-hotspots. The questionnaires were selected because they offer the possibility to reach many people in a short time span and representative results can be obtained from a chosen target group.
The questions were divided into four categories: the first one enquires the demographical aspects such as gender and age. The second part asks for the opinion concerning different parts of the UBI Displays. The third segment refers to the panOULU WLAN. Finally, in the fourth paragraph, general questions concerning the whole UbiOulu project are asked.
Approximately 100 questionnaires were distributed personally at the school in combination with a short presentation about the panOULU project and the research goals. In the meanwhile, the university students received the survey as an online questionnaire which was sent to them via e-mail lists. The survey was opened for 19 days (from May 23rd to June 10th 2012) and was completed by 924 students.
The generation of pupils and students was chosen since they represent the group of digital natives [37] and were expected to get involved most with the offered services, so that they have enough user experience to assess their value. Furthermore there was no possibility to access another homogenous group of older people to question them because of language barriers and the missing opportunity to get in touch with larger groups of possible respondents. We evaluated the aspects perceived ease of use, perceived usefulness and perceived trust. Additionally the adoption of the information service by the local internet service providers was examined. The results were analyzed with the statistical software PASW Statistics 18 (formerly SPSS).
According to the open UBI Oulu initiative’s people in charge Oulu can be considered a ubiquitous city. Keeping Hollands’ [13] complaint in mind that one is “constantly bombarded with a wide range of new city discourses” ([13], p. 305) and that a lot of cities inflationary use these denotations to just follow the current hype and for marketing purposes without realizing its actual profundity and range, one has to separate between “image and reality” ([13], p. 305). Now that the salient ICT infrastructure of Oulu was presented in the previous section, a valuation on the basis of the definitions and indicators of a ubiquitous city will follow.
Lee et al. [19] define a u-city as a built environment where any citizen can get any services anywhere and anytime through any ICT device. Let’s unravel this definition step by step. With Oulu providing an 80% household, 90% business and 100% government broadband penetration [14], supplemented with the installation of around 1,350 APs for the open and free panOULU WLAN network supported by the deployment of 21 hotspots and 38 BT APs it can be thoroughly seen as a built environment [14]. Both the panOULU network and the hotspots can be used for free without any needed authentication or registration making it accessible to any citizen, in fact even anyone located inside of Oulu, who are able to get any services through the internet. The local boundedness of the hotspots and the limited area of usage to solely public places do not satisfy the factor of anywhere, thus no city wide access is granted. The hotspots have mobile phone support and the panOULU WLAN network can be used with any [common] ICT device, such as PC, smart phone, laptop, tablet PC and so on. Another aspect of a ubiquitous city is that the ICT does not generally need active attention, because it is embedded invisibly into the daily routine of the citizens and is thus not necessarily perceived as such.
In conclusion, Oulu is definitely following ubiquitous basic approaches and differs vehement from the majority of today’s cities. However the demands of the definition of a ubiquitous city cannot be satisfied yet, since an omnipresent ICT infrastructure is not present. Further it certainly cannot be compared with ubiquitous pioneers like Southeast Asian countries, since Oulu has not integrated potent campaigns supported by embedded ICTs concerning the citizen’s life, business or government in regard to South Korea’s u-life, u-business and u-government. Commencements such as UBI-AMI, a service for advanced measuring of power consumption, were not used by the community. Theoretically classic information needs should be able to be satisfied by using Oulu’s imbedded information technology.
The following empirical investigation proves if this is actually the case and is dedicated to the presentation of the results obtained by the distribution of questionnaires. To avoid the loss of important information all the questionnaires were evaluated even if they were not completed. Therefore every question has its own number of participants declared by the variable “n”.
UBI-hotspots
The first section of the questionnaire concentrates on the UBI displays. The results show that 433 out of 1,045 students use the interactive screens. Based on the numbers of users we can say that the acceptance of the touch screens is rather low. A possible reason for the rather small amount of users could be the weather’s influence, since most of the displays are located outside [23]. The top ten services are: Map, Oulu Today, City of Oulu, Kaenkky, Finnkino, Transport, Event Calendar, Restaurant, UBI Postcard and Hangman. The polled generation seems to utilize the screens to satisfy their information needs that are limited to Oulu. A serious problem of the UBI displays is revealed by the following question that shows the problems that occurred during the usage of the screens. To obtain representative results all the students that stated not to use the displays have been removed. It is noticeable that the majority faced some kind of problem while using the hotspots and only 166 students were able to use the displays without having any serious problems.
Almost 62% (
Besides these findings it is important to take a closer look at the perceived usefulness. The respondents were asked whether they would support the introduction of the UBI displays in other cities or not. The people that do not use the screens were not taken into account here because they cannot judge the usefulness of the offered content in an appropriate way. 65% out of 426 students consider the usefulness of the UBI-hotspots as sufficient and would like them to be implemented in other cities as well. Still 30% are not convinced by the helpfulness and stated not to care. Only 3.5% do not think that the screens’ usefulness is sufficient.
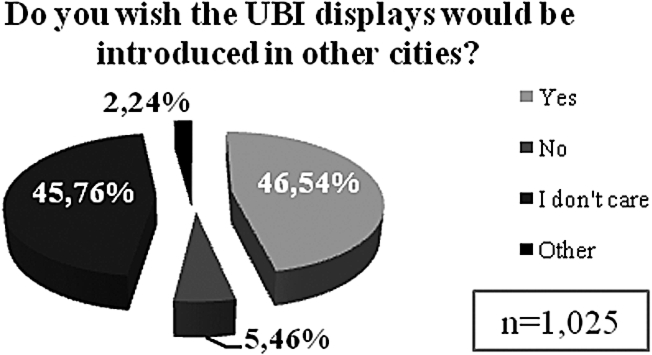
Opinions concerning the introduction of the UBI displays in other cities.
The points of criticism are the content and software and hardware issues. One of the interviewed experts (personal communication, May 3, 2012) stated “We need to have more interesting content so that people would use them (the screens)”. This comment reveals that at least some of the people responsible for the UbiOulu project are aware of the poor content and that it has to be improved to attract more users. The problems concerning the touch screens are known. Allegedly there were no better screens on the market that worked outside. Other people think that the screens are too big and that it would be a loss of privacy to use them. The stakeholders (personal communication, May 3, 2012) themselves said that they “wouldn’t use the screens for private communication” but rather to look for information like different restaurants.
The number of respondents using the panOULU WiFi is much higher than the number of students that use the UBI displays. 827 respondents access the internet via the open WiFi. In most cases they connect to it with their laptops and smartphones as the results displayed in Table 2 show.
Devices used to access the open WiFi
Devices used to access the open WiFi
Notes:
The usage purpose is focused on e-mail services, news, Facebook, bus schedules and weather services. A very important aspect is treated by the question concerning the data safety that belongs to the aspect perceived trust in the ISE Model. 45.47% out of 827 students think that using the panOULU network is insecure. They are worried about the data safety and the possibility of surveillance. The majority of the respondents (54.53%) do not have any concerns using the open WiFi and trust in the system. It is remarkable that the security concerns do not keep people from using the panOULU network. Only 24 out of the 369 respondents that are worried about the data safety and therefore do not access the internet via the panOULU network. One of the interviewed experts (personal communication, May 3, 2012) stated “You should know that you shouldn’t do all kinds of things in an open WiFi”. An improvement of the data safety would be a good investment since above mentioned security issues should be fixed. Additionally people should be informed about precautions they could take to better protect their data as the comment of a student reveals: We did an experiment during one lecture at university (L1) few years ago using an open source WLAN packet sniffer to “listen” panOULU WLAN traffic. In five minutes we spotted at least three username + password combos in plain ASCII text inside WLAN packages. (Student 868.)
It seems obvious that people living in an area with free WiFi prefer using it rather than acquiring a separate internet service provider (ISP) since it is cost-effective. Therefore one would expect the ISPs to be down on projects like the panOULU WLAN. Surprisingly the results show that 97.57% of 1,028 questionees do acquire an internet service provider or access the internet via a provider that is offered by their housing company. One of the reasons that the panOULU WLAN cannot be seen as a competitor in the area of internet service providers is its speed and the covered area.
Four of the local ISPs in Oulu joined panOULU and offer APs to local business owners so that their customers can access the internet via the panOULU network. This way conflicts should be avoided and additionally the collaboration offered the possibility to expand the network into the private sector because the city and the university can only use public money to install APs in public places. All in all the results shown above reveal that open WiFi does not have any negative effects on the number of customers of the ISPs. The participation of the local ISPs in the project shows, that they adopted the panOULU WiFi and are likely to support it.
The question concerning the introduction of the panOULU WiFi in other cities reveals a big gap between the popularity of the UBI-hotspots and the open WiFi. 82.55% out of 824 students think that the panOULU WiFi is very helpful and should be introduced in other cities as well. Only 12.24% are not sure whether it is useful enough or not and 3% of the respondents do not consider the open WiFi as useful enough to offer it elsewhere.
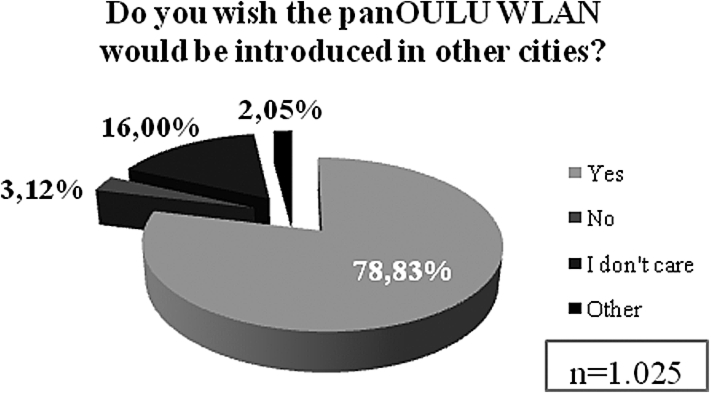
Opinions concerning the introduction of the panOULU WLAN in other cities.
According to the questionees’ comments the limited coverage is the main issue of the panOULU network. Even the development manager (personal communication, May 4, 2012) thinks that the covered area should be enlarged since the best connection is only available at the airport, the university and in the city center. The former minister of communication of Finland (personal communication, May 3, 2012) detected another problem that keeps people from using the panOULU WLAN: Most of the people do not know that panOULU is free and therefore they do not use it even if their device lists it as a possible access point. The idea of the student who proposed to rename the panOULU WLAN to “Free-WiFi-Oulu” could be a possible solution for this problem.
Summarizing the findings of this study one can say that, although Oulu is just approaching ubiquitous basic features, it is definitely setting itself apart from conventional cities. Oulu is certainly stepping in the right direction regarding future city development.
Concerning the acceptance of the UBI-hotspots, the case study shows that the number of users is still very low and could be increased by better marketing strategies (personal communication, May 3, 2012; personal communication, May 4, 2012). The UBI-hotspots are not used by many people and a lot of them criticize the technical issues, the offered services and the content. The perceived ease of use of the hotspots is rather small since there are many problems that occur during the usage of the touch screens. Furthermore some of the respondents think that they are more useful for tourists than for the citizens of Oulu. This decreases the perceived usefulness. The ability of the displays to help people that are trying to satisfy their information need is restricted since they offer only a certain amount of services. It is likely that the respondents do not support the introduction in other cities for this reason. The lack of relevant content causes the respondents to use the hotspots very seldom if at all. A student proposed to put a web browser on the UBI-hotspots which would increase the perceived usefulness. People could search for whatever they need and the ones that do not own a smartphone or a similar device to access the panOULU WLAN could surf the internet via the UBI displays. Another disadvantage of the UBI displays is that there are only few of them and the probability of being close to such a device while needing one is rather small.
The panOULU WLAN is more popular than the UBI-hotspots and accepted by many respondents. A lot of people access the internet via the open WiFi and even though it is not available in the whole city, the perceived usefulness is very high and therefore the students do not stop using it. Another fact that shows how much the citizens of Oulu appreciate the free WiFi is that they want it to be available in the whole city. The panOULU network allows people to satisfy their information need no matter what it is about since the internet offers all the possibilities they need. The fact that the majority wants the panOULU WLAN to be introduced in other cities shows that the idea of open WiFi is highly accepted and considered as useful for the daily routine. Anyways, the perceived trust is not as high as it should be because a lot of people are worried about the data safety. This issue has to be fixed in the near future.
According to the project manager (personal communication, May 4, 2012) the UbiOulu project has a “visibly major impact on the city”. That means the project is very important for the city and the citizens but also for its representation in Finland and other countries. The high amount of users shows that the discussed information need is omnipresent and the citizens of Oulu use the offered technology to satisfy it wherever they are and whenever such a need arises. Ubiquitous cities serve the satisfaction of the human needs and make life easier and more comfortable. They are trend-setting and should be taken as a model by the other cities. Even though the UBI-hotspots are not as popular as the open WiFi, they can be seen as an alternative for a free public internet access in countries where it is not possible to offer open WiFi because of the culture, legal or for other reasons.
In this work the UbiOulu project, an important part of the information and communication infrastructure of Oulu was studied. The role of the panOULU network, an open WiFi that is available in certain areas of the city and the UBI-hotspots, interactive screens that offer different services for the users in the progress of information seeking with the aim of satisfying the human needs was examined. A survey was carried out with the aid of questionnaires that were distributed to ∼1,000 students. Additionally interviews with six key personalities involved in the project were conducted. The results show that there is room for improvement concerning both elements of the project. Still the UBI-hotspots have not been able to establish themselves. The citizens are not likely to use them since there are technical issues and a lack of relevant content. Nowadays, nearly everyone uses a mobile device (mainly smartphones). So there is no need to contact a stationary touch screen monolith to satisfy his information needs. Probably, the media poles are a historical relict from the pre-smartphone age.
The people prefer the panOULU WLAN and would like it to be expanded so that the whole city is covered by the open WiFi. It offers more possibilities and even though it is only available in certain areas of the city, it is not as limited to a specific place as the UBI-hotspots are. Ndiwalana, Chewar, Somervell and McCrickard obtained similar results in their study in 2003. The people questioned by them preferred Ubicomp systems over desktop interfaces in certain situations [28]. Summarizing we can say that the panOULU WLAN is an integrated part of the daily routine of Oulu’s digital natives. The UBI-hotspots can be seen as a supplementary tool that is not as needed as the open WiFi since its possibilities are limited. For the future, the experts that were interviewed (personal communication, May 3, 2012) see it as a target to offer free WiFi in every city in public places. In general one can say that every city should aim at offering free WiFi in the whole township. To improve its usefulness city-specific content should be offered, both as city-specific apps as well as parts of social media such as Facebook or Twitter [24]. Concerning the media poles the results of this study have shown that they are not likely to be used. One of the reasons for this result is the wide distribution of smartphones and tablet PCs that are equipped with WLAN access via a mobile provider. Hence the media poles are only useful for people that do not own such a device (certainly a minority of the population) or for tourists that cannot use their WLAN access when they are abroad.
Even though this work is limited to the generation of digital natives living in Oulu, it shows that ubiquitous cities serve the human needs very well and make our lives easier. They are future-oriented and, as it was revealed in the interviews, the concept should be realized in every bigger city. Basic features of ubiquitous cities are (1) city-wide (preferable free) WiFi and (2) appropriate city-specific content, which will be distributed to the citizens, the tourists, the local businesses and all other stakeholders of the city.
Footnotes
Acknowledgements
Many thanks to Timo Ojala (Oulu) as well as to Agnes Mainka and Steffen Rölike (Düsseldorf) for fruitful discussions on earlier versions of this paper. Special thanks to all interviews partners in Oulu and to the students in Oulu who completed our questionnaire.