
Abstract
BACKGROUND:
A Polar heart rate monitor is a device that measures RR intervals, but has not been correlated to accurately measure the series of RR interval signals between the ECG and the Polar
OBJECTIVE:
The aim of the study was to evaluate the temporal cross-correlations between the Polar
METHODS:
The sample consisted of eighteen healthy male subjects and they were instructed to lie in the supine position at rest while breathing normally and a time window of the last 2 min was recorded to analyse RR intervals were obtained for each subject with a Polar
RESULTS:
The cross-correlation was excellent, resulting in a mean of 0.98
CONCLUSIONS:
The Polar
Introduction
Heart rate variability (HRV) is a non-invasive tool used to assess the autonomic control of heart rate fluctuations [1]. In the sports field, HRV has been found to be a valuable measure in a variety of sports settings with the measurement of many factors including overtraining [2], heart dynamics and efforts recovery [3], exercise prescription [4], identification of anaerobic thresholds [5] and determination of an athlete’s fitness level [6].
The use of electrocardiogram (ECG) has been used to study HRV analysis, but the high cost, difficulty of application in situations outside the laboratory environment, such as in physical training conditions [7, 8] make this a rather impractical tool for use outside the laboratory. As an alternative, the Polar
Previous studies have investigated the correlation between commercial ECG systems at rest [12, 13, 14, 15, 16, 17] and during exercise [18, 19, 20, 21, 22] based on HRV. In addition, none of these studies investigated the use of the cross-correlation to accurately measure the series of RR intervals between the ECG and the Polar
The cross-correlation function [23] estimates the correlation between the series allocated at time (
Cross-correlation is a way of measuring the degree of similarity between a time series and a lagged version of another time series [24] or the interdependence between the signals [25]. It can also be used to determine phase differences, extract hidden signals, and reveal frequency content [25]. Thus, the aim of the study was to temporal cross-correlation between Polar
Subjects
The sample consisted of eighteen adult male athletes 20 to 25 yrs of old, who volunteered for this study. All subjects were physical education students, non-smokers, with no history of cardiopulmonary disease and none was taking any medication, randomly selected during an anthropometric evaluation in the Physical Education course at the Federal University of Amapá (UNIFAP) between May and December 2022 in the period from 08:00 to 10:00 hours.
The study protocol was approved by the local Human Research Ethics Committee of the Federal University of Amapá (CAAE: 50150121.1.0000.0003, n
Anthropometric measurements
Potential volunteers were given a verbal explanation of the testing procedures and the time commitment required to participate in this study during an orientation session. Data collection and the anthropometric variables were performed by the same and experienced evaluator throughout the study. For both weight and height measurements, participants were kept barefoot, wearing light clothes and not carrying any object. The height was measured in centimeters and body weight in kilograms using certified and calibrated mechanical scales (Filizola, Brazil).
Data collection
The tests were conducted in a quiet room with temperature maintained at 22
The skin was prepared by shaving the hair, abrasion with sandpaper and alcohol cleaning. The ECG signal was measured by an electrocardiograph MCL07 (Ecafix, Brazil) in the modified lead CM5 to improve signal quality and R-wave amplitudes and surface electrodes of silver-silver chloride (Ag/AgCl) disposable Kendall Meditrace 200 (The Ludlow, Chicopee, USA). Additionally, cardiac pulses were also collected through Polar
Signal processing
All signal processing was analyzed with programs written in Matlab version 2020.b (The MathWorks, USA). To measure the RRi of the ECG, the signal was preprocessed by a 2th order Butterworth band-pass filter with cutoff frequencies of 5 and 20 Hz, applied in both the direct and reverse directions of the signals to avoid phase distortions. The times of the peaks of R-waves were detected by the zero crossing of the derivative of the filtered signal. Thus, the algorithm selected all signal peaks above a threshold of 0.5 V and removed the peaks whose refractory period was less than 250 ms. In addition, the algorithm allowed manual editing with visual inspection, in order to exclude ectopic heartbeats and exported as RR intervals in seconds.
A pulse train of peaks from the Polar
Time series analysis
The cross-correlation analysis [24] between the RR interval signals from the ECG and the Polar
where
For each participant, the mean of the RR intervals (MeanRRi) from the Polar
Descriptive data were expressed as mean
Results
Anthropometric and physical characteristics and mean RRi obtained from ECG and Polar
HRMI Board of participants at rest
Anthropometric and physical characteristics and mean RRi obtained from ECG and Polar
Values are mean
Cross-correlation RR interval signals between Polar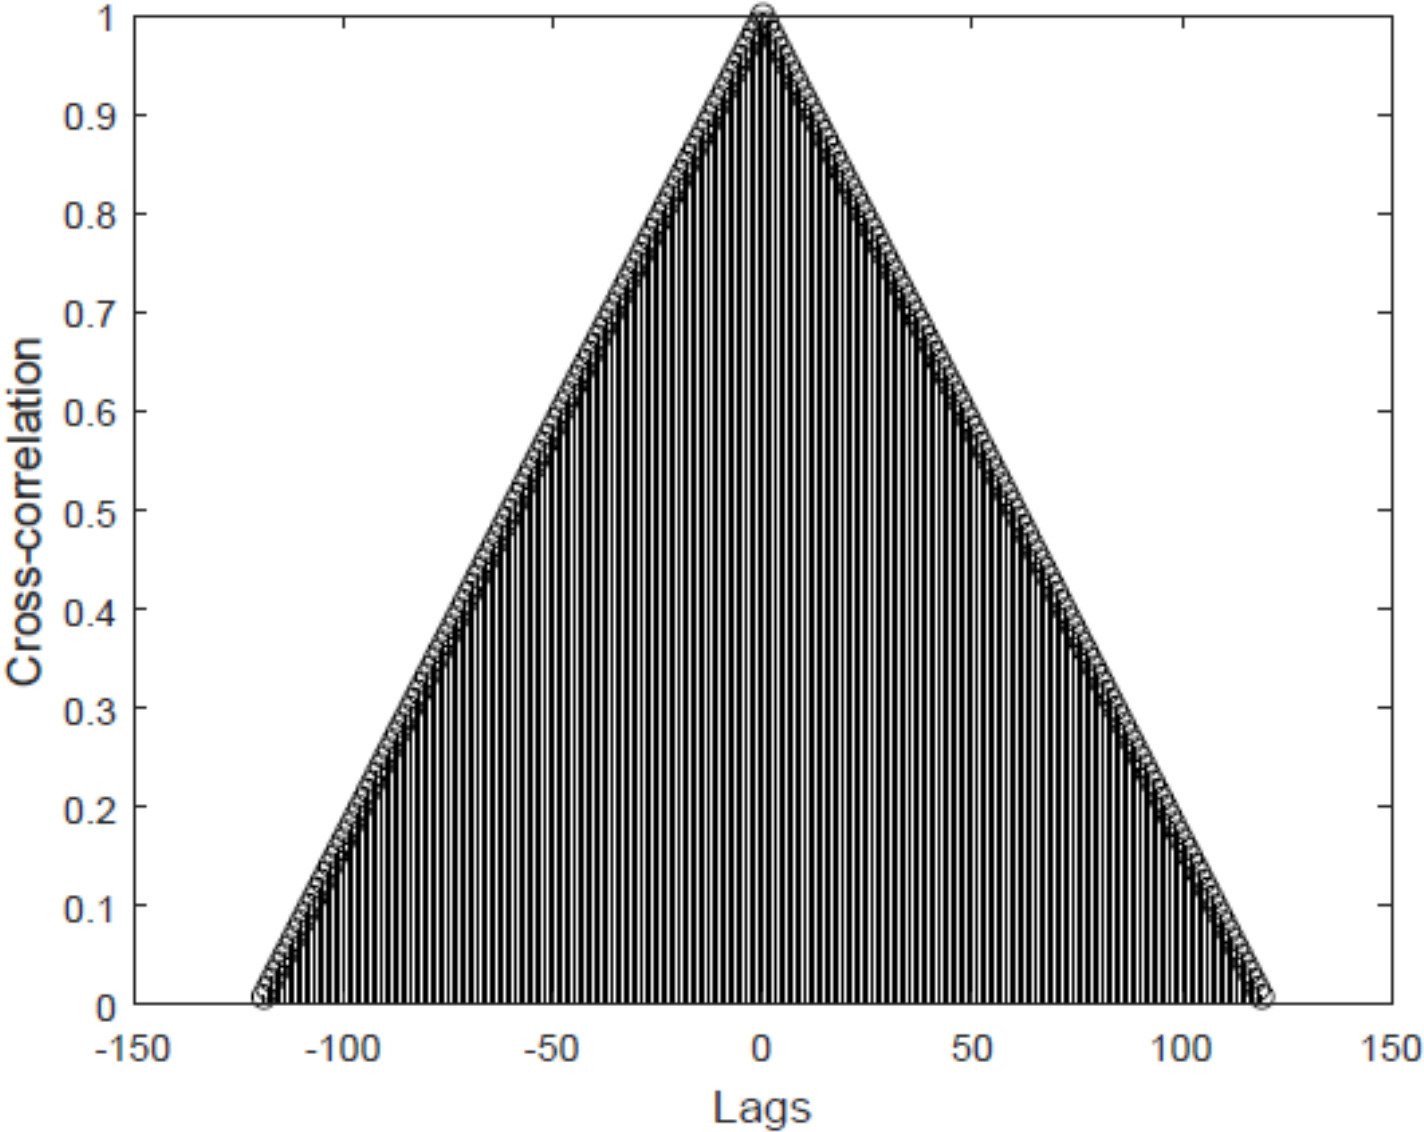
Anthropometric, physical characteristics and MeanRRi from the Polar
The MeanRRi data obtained from the Polar
Cross-correlation between Polar
The Bland and Altman [28] plot analyzed the agreement resting MeanRRi data between the Polar
Bland and Altman [25] plot of the MeanRRi HRV parameter between Polar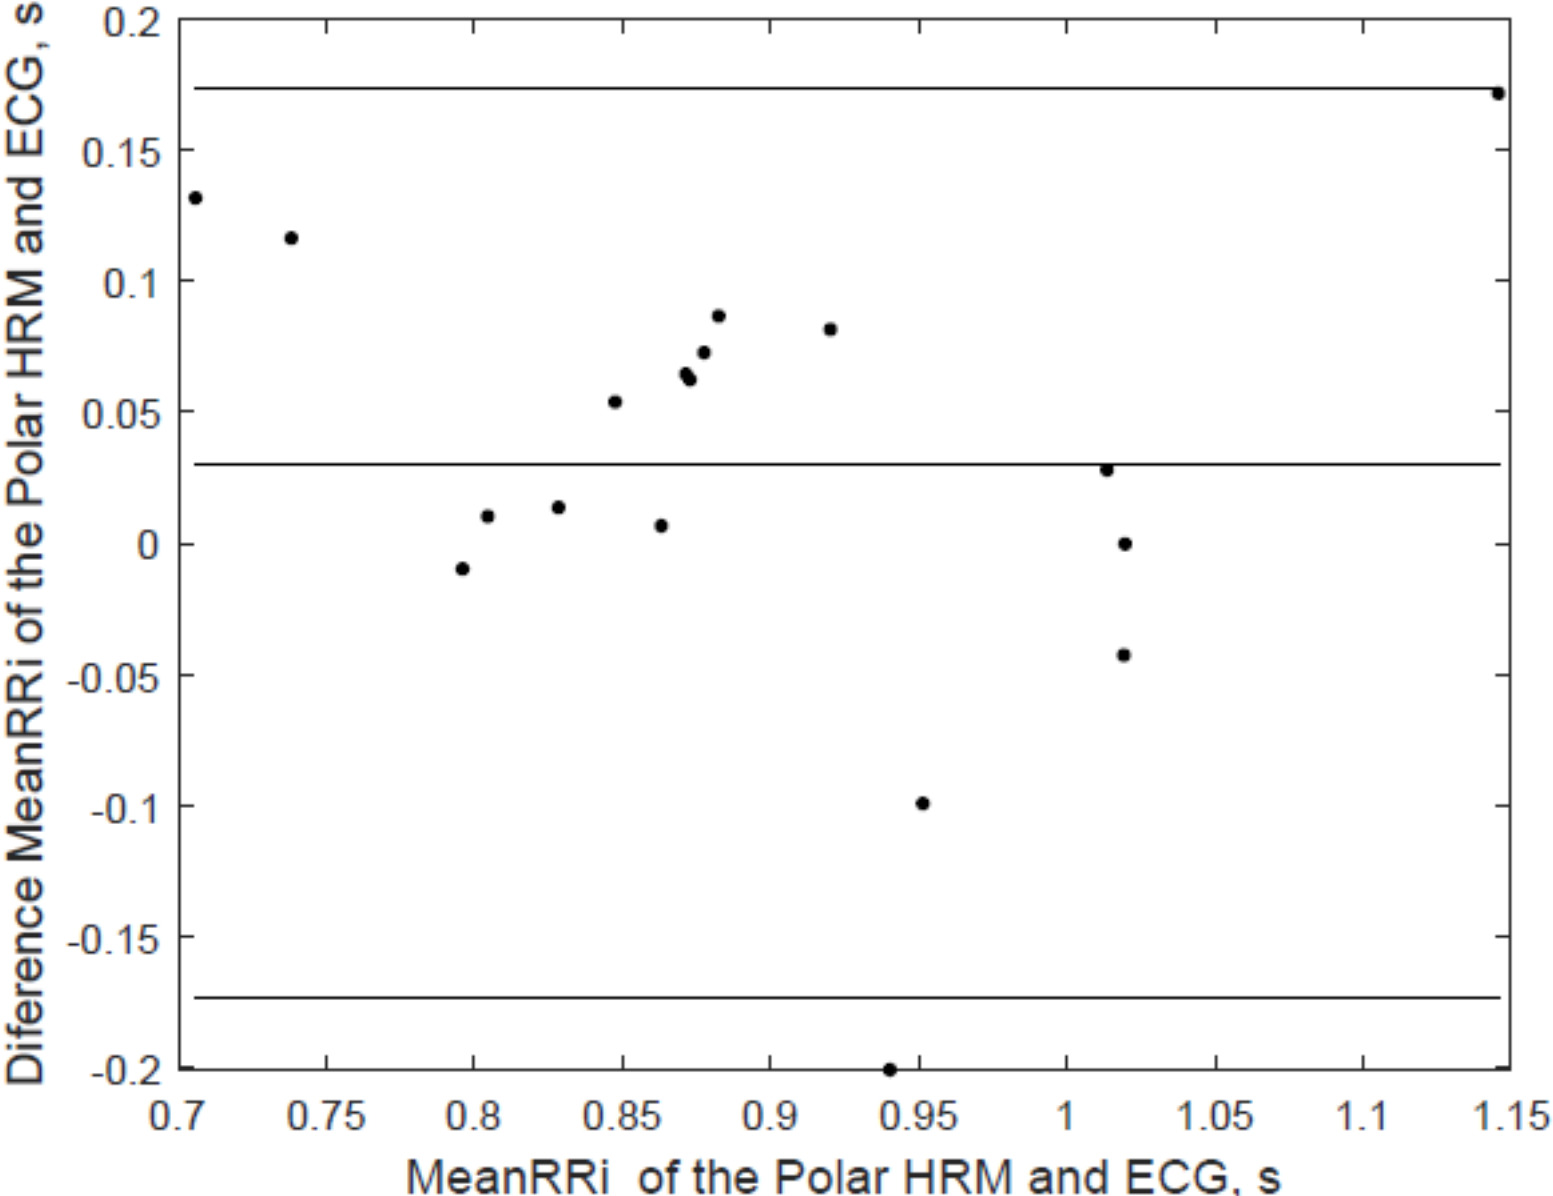
RR interval signals between Polar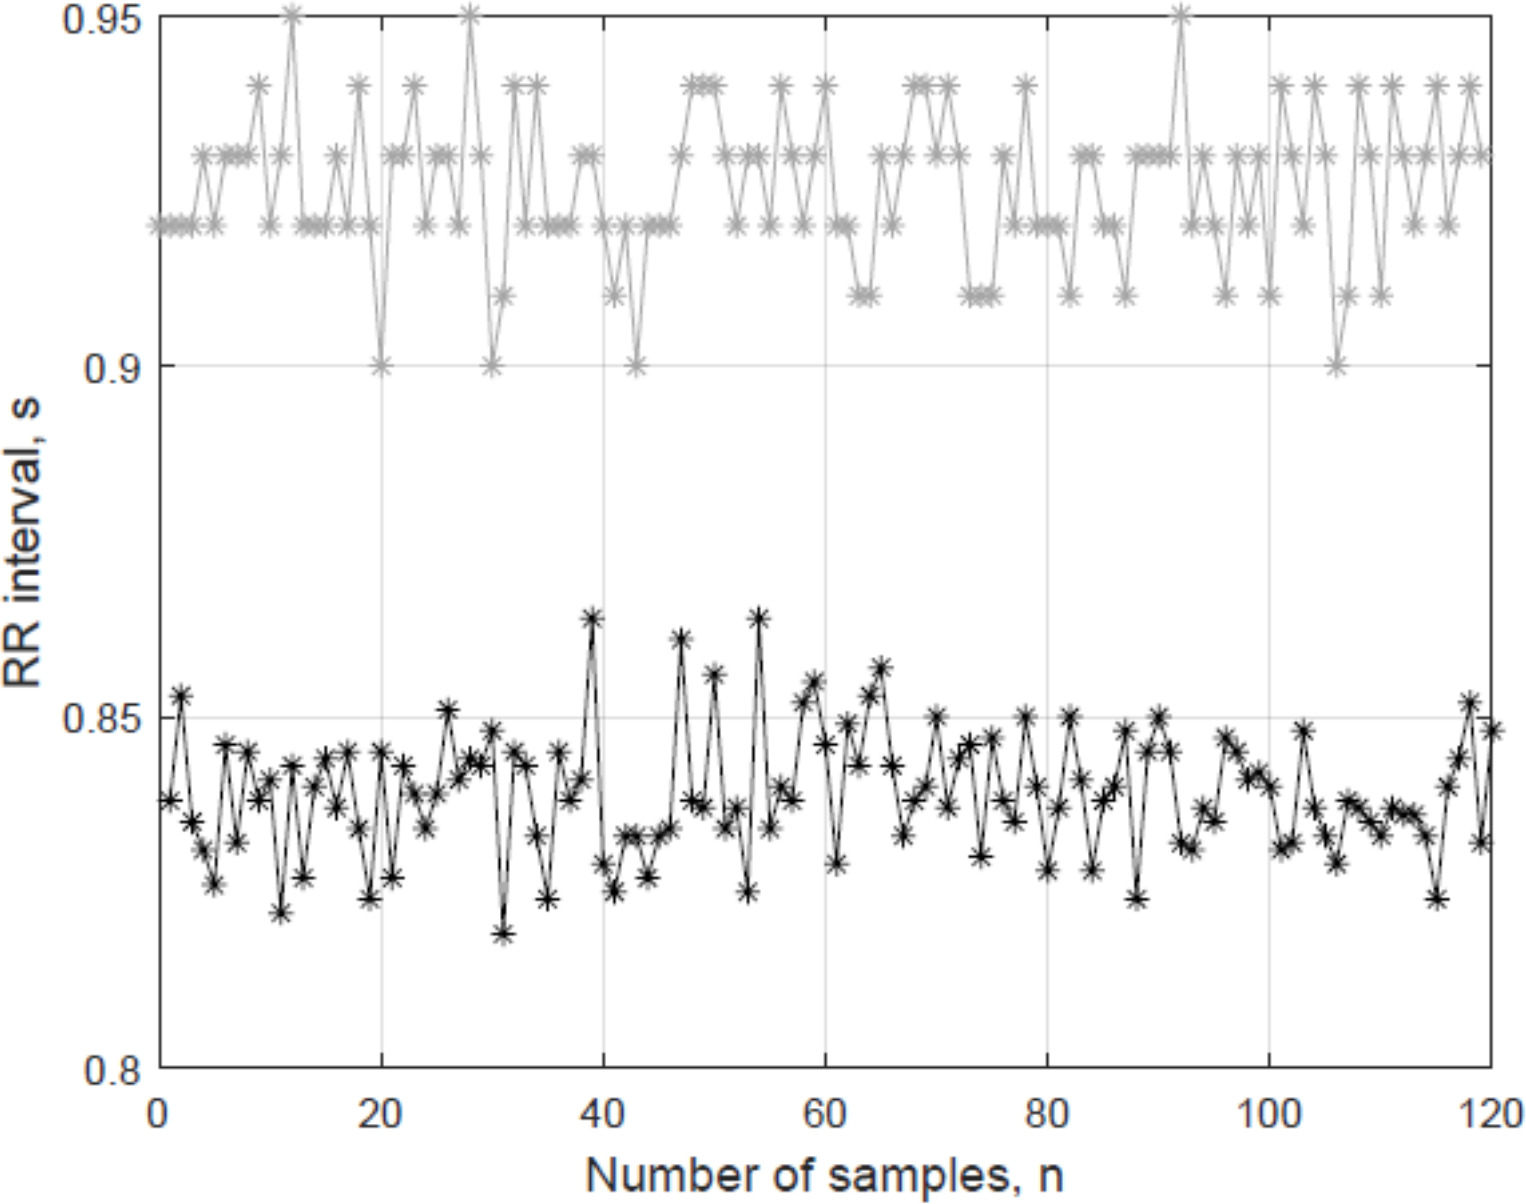
The purpose of this study was to determine the temporal cross-correlation between the Polar
Previous studies [12, 13, 14, 15, 16, 17] support the validity of the Polar
The time domain analysis based on the cross-correlation between these RR interval signals shows the presence of correlation between the rhythms, as it resulted in excellent cross-correlation, with an average of 0.98
The RR interval is the time elapsed between two successive R-waves of the QRS signal on the ECG is a function of the intrinsic properties of the sinus node as well as autonomic influences [29]. For this reason, MeanRRi is the average RR interval duration in a measurement. Autonomic cardiovascular regulation can be studied by quantifying MeanRRi as assessed under steady state conditions of health [30, 31] or disease [32, 33] when compared to other HRV parameters, which justifies the use of the MeanRRi HRV parameter in the study. However, no statistically significant difference was found when testing the differences in the MeanRRi HRV parameter obtained during at rest between the Polar
Bland and Altman [34] have investigated about the use of correlation is misleading, an alternative approach, based on graphical techniques and simple calculations is described along with the relationship between this analysis and the assessment of repeatability. Therefore, the Bland and Altman [28] plot illustrates the coordinates of MeanRRi of the HRV parameter, which showed a low variability and few coordinates outside the limits of agreement, expressed as 95% LOA, indicating homoscedasticity or homogeneity of variances.
Figure 3 illustrates the RR interval signals between the Polar
The present study was limited to the study of the MeanRRi HRV parameter alone in the time domain. Future research should address the limitations of the present study by employing a sample of different age and both sexes, analysis of HRV parameters in the frequency domain with respiratory rate control [36] and control group by investigating the associations between these parameters HRV values and cardiovascular risk factors.
Conclusions
The Polar