Strength differences between performance levels remain unclear in female football. Furthermore, the relationship between fulltime training and strength has been unexplored despite increased professionalisation in the sport.
OBJECTIVE:
The aims of this research were to examine knee flexor/extensor and hip adductor/abductor strength differences between elite and sub-elite female footballers, and then determine the relationship of strength performance to age, years of football experience (FE), and years of fulltime training (FTT).
METHODS:
15 elite and 15 sub-elite professional female footballers were tested. The main outcomes were concentric isokinetic knee flexor and extensor peak moment at 60, 180, and 300/s, and isometric hip adductor (ADD) and abductor (ABD) force.
RESULTS:
The elite team had higher absolute (300/s: 47.13–49.33 Nm vs 37.33–38.93 Nm, 0.05) and normalised (300/s: 0.76–0.80 Nm/kg vs 0.59–0.62 Nm/kg, 0.05) knee flexor values, and higher normalised ADD (5.64–5.66 N/kg vs 4.98–5.05 N/kg, 0.05) and ABD force (5.80–6.00 N/kg vs 5.26–5.39 N/kg, 0.05), compared to the sub-elite team. Age, FE, and FTT were correlated to knee flexor values ( 0.381–0.559, 0.05). Additionally, FTT was correlated with normalised ADD and ABD force ( 0.362–0.546, 0.05).
CONCLUSION:
Sub-elite female footballers may require additional knee flexor and hip strengthening in order to make the step up to the elite level. Those who are younger or have low FTT may also be recommended additional lower limb strengthening ahead of joining a fulltime training environment.
Increased professionalisation in female football has allowed players to train fulltime without additional work commitments [1, 2]. This professionalisation has increased training and match exposure, with the most loading at the highest, elite levels of competition [3, 4]. In order to mitigate these increased loads and reduce potential injury risk, players require adequate muscle strength to meet the demands of football at the elite level [5, 6].
Lower limb strength in female footballers has been previously assessed by isokinetic and isometric testing [7, 8, 9, 10, 11, 12, 13]. Recent research in isokinetic performance testing examined knee flexor and extensor strength differences between dominant and nondominant legs at angular velocities of 60/s, 180/s, and 240/s [14, 15]. However, the difference between performance levels (elite vs. sub-elite) was not examined, nor was testing conducted at 300/s, a velocity which previously revealed knee flexor strength deficits that increased anterior cruciate ligament (ACL) injury risk in female athletes [9]. A lower isometric adductor to abductor ratio has also been found to be associated with increased ACL injury risk in a mixed female football population [13], though there has been limited research of hip strength in adult female footballers, especially of different performance levels [11, 12]. It would be beneficial for practitioners to know if lower limb strength differences exist between elite and sub-elite players, in order to bridge the gap between performance levels and better prepare those making the transition in female football [4].
As numbers in fulltime training continue to rise [1], it would also be beneficial to explore the relationship of a player’s age, years of football experience, and years of fulltime training to their strength performance. This would be particularly pertinent for female footballers, as players can have varied backgrounds, ranging from youth academies, amateur football, or even other sports, and can be promoted to elite football environments without much preparation due to excelling at a young age or at a sub-elite level [16]. Male players have shown that isokinetic knee extensor and flexor strength increased with more years of football training [17, 18, 19]. However, there is currently no research that has analysed this relationship in female footballers, nor looked at the relationship of years of fulltime training to strength performance.
Thus, the aims of this research were to examine the difference between elite and sub-elite female footballers in knee isokinetic and hip isometric strength, and then determine the relationship of their strength performance to age, years of football experience, and years of fulltime training.
Brief overview of in-season weekly training and match program for both teams
Day
Field-based training
Gym training
Match
MD+1
Day off
MD-5
60 min
30 min
MD-4
60 min
30 min
MD-3
90 min
MD-2
60 min
30 min
MD-1
60 min
MD
90 min
Legend: MD – match day.
Methods
Study sample and recruitment
This was a cross-sectional study design. The A team ( 15) and B team ( 15) of one female football club were analysed during pre-season. The A team (Elite) play in the top division of the Czech national league, and the B team (Sub-elite) play in the second highest division. Both teams have the same weekly volume and frequency of training in a season (Table 1). To be included, players had proof of a signed contract to train and play with their club, were free of injury and pain in the lower limbs at the time of testing, and gave informed consent for the testing. This study was approved by the research ethics committee of the Faculty of Physical Education and Sport at Charles University, Czech Republic (No. 107/2021), and followed the principles of the declaration of Helsinki.
Baseline characteristics and test protocol
For basic anthropometric data collection, players filled in a questionnaire that asked the following: Foot Preference (for kicking the ball), Years of Football Experience (FE), Years of Fulltime Training (FTT) (more than four training sessions per week), and Playing Position. Body mass was then measured by the Tanita MC-980 MA Plus (Tanita Corporation, Tokyo, Japan), while standing height were measured with a Seca 213 stadiometer (Seca, Hamburg, Germany). Before testing began, participants completed a warm-up of three sets with eight repetitions each of lunges, squats, and single leg glute bridges, and then two sets of three repetitions of 10 s groin squeezes with a ball at the knees, with hips and knees bent to approximately 60.
Means and standard deviations for age, height, body mass, years of football experience, and years of fulltime training for both teams and overall
Elite ( 15)
Sub-elite ( 15)
Overall
Age (years)
24.14 4.35
19.45 0.95
21.79 3.90
0.001
Height (cm)
168.55 9.65
169.76 6.15
169.15 6.48
0.616
Body mass (kg)
62.21 6.95
63.07 8.78
62.64 7.79
0.768
Football experience (years)
18.47 4.37
9.60 3.27
14.03 5.89
0.000
Fulltime training (years)
8.47 3.78
3.07 1.98
5.77 4.04
0.000
Legend: kg: kilograms; cm: centimetres; Significantly different between teams ( 0.05).
Hip adductor and abductor strength
Isometric hip adduction (ADD) and abduction (ABD) strength was measured by an isometric dynamometer (ForceFrame Strength Testing System, Vald Performance, Australia). Participants laid beneath the ForceFrame with head resting on the ground, arms by their sides, hips and knees bent to approximately 60, and soles of the feet hip width apart and firmly on the floor [20, 21]. The pads of the ForceFrame were lined up with the femoral condyles of the participant. They were familiarised with the setup, and allowed three practice trials at approximately 50% effort. The test with maximal effort was performed in three stages: 1) Participants squeezed the medial femoral condyles against the inner pads and a maximal sustained contraction was held for 3 s, 2) they rested for 5 s, and 3) they then pushed the lateral femoral condyles against the outer pads and a maximal sustained contraction was held for 3 s. This was repeated three times in total, with 30 s rest in-between. Consistent verbal encouragement was given throughout testing. Total Newtons force reported in absolute (ABS) and normalised to body weight (NOR) values were collected by the Scoreboard software (Vald,Australia) [21]. The best trial was selected for further data analysis and for the ADD:ABD ratio calculation.
Knee flexor and extensor strength
Knee flexor and extensor strength were measured by an isokinetic dynamometer (Cybex NORM, Humac, CA, USA). The maximum peak moment (PT) of the dominant (DOM) and nondominant (NON) leg during concentric contraction were measured at three angular velocities (60, 180, and 300/s) [22]. According to manufacturer instructions and individual characteristics, the dynamometer seat and dynamometer arm were adjusted. The axis of the dynamometer arm rotation was visually adjusted to the lateral femoral condyle. PT was controlled and modified by gravitational influence at each velocity. Range of motion was set at 90 with maximum extension marked and set as anatomical “0”. The participant’s trunk and thigh of the tested leg were fixed by straps to isolate the examined movement. The participant held the side handles of the device during the measurement, and consistent verbal encouragement and visual feedback were given during the trials with maximum effort. The testing protocol consisted of familiarisation by completing two sets of five submaximal repetitions of concentric knee extension and flexion. This was then followed by two maximal attempts at knee flexion and extension at the monitored velocities from the lowest to the highest velocity, with ten seconds rest in between angular velocities. Results were expressed in ABS and NOR values [14, 15]. The best trial was selected for further data analysis, and for the conventional hamstring:quadriceps ratio (H:Q ratio).
Data analysis
All data analysis was completed using IBM SPSS v25 (Statistical Package for Social Science, Inc., Chicago, IL, USA). Descriptive statistics for all measures and baseline characteristics were calculated for each team and overall. To decide on parametric or non-parametric tests, the data was analysed for normal distribution. Levene’s test of the equality of variances was used to verify the assumption that the error variances of the dependent variables were equal across categories. Independent sample t-tests compared the strength measures (ABS and NOR values) and the muscle group ratios (conventional H:Q Ratio, ADD:ABD Ratio) between the two teams. Cohen’s d calculated the effect size of the difference between the teams Pearson’s correlation coefficient analysis established whether Age, FE, or FTT had a significant relationship to any of the strength measures with criteria set as: Negligible: 0.00 0.30, Low: 0.30 0.50, Moderate: 0.50 0.70, High: 0.70 0.90, and Very High: 0.90 1.00 [23]. The -value, indicating the probability of a type I error (alpha), was set at 0.05 in all statistical analyses.
Results
Team characteristics
Descriptive statistics on age, height, body mass, FE, and FTT are presented for both teams, and overall, in Table 2. The Elite team were significantly older, and had more years of football experience and of fulltime training, compared to the Sub-elite team.
Isometric absolute (ABS) and normalised (NOR) maximum force means and standard deviations for dominant (DOM) and nondominant (NON) hip abduction and adduction for both teams and overall
Elite ( 15)
Sub-elite ( 15)
Overall ( 30)
-value
Effect size (Cohen’s )
Adductors
ABS Dom (N)
350.47 47.34
316.83 56.17
333.65 48.08
0.054
0.648
ABS Non (N)
349.61 41.24
313.43 49.81
331.52 54.25
0.067
0.922
NOR Dom (N/kg)
5.66 0.61
5.05 0.71
5.36 0.72
0.018
0.791
NOR Non (N/kg)
5.64 0.68
4.98 0.72
5.31 0.76
0.016
0.942
Abductors
ABS Dom (N)
370.43 38.34
337.03 42.01
353.73 43.01
0.031
0.830
ABS Non (N)
359.02 41.06
330.17 45.74
344.59 45.16
0.080
0.664
NOR Dom (N/kg)
6.00 0.67
5.39 0.68
5.69 0.73
0.023
0.904
NOR Non (N/kg)
5.80 0.64
5.26 0.59
5.53 0.66
0.019
0.877
ADD:ABD Ratio
Dom
1.06 0.14
1.07 0.22
1.05 0.13
0.612
0.054
Non
1.04 0.15
1.07 0.12
1.07 0.12
0.885
0.221
Legend: N: Newtons; kg: kilograms; ABS: absolute maximal value; NOR: maximal value normalised to bodyweight; Dom: dominant leg; Non: Nondominant leg; ADD:ABD Ratio: Adductor to Abductor Ratio; Significantly different between teams ( 0.05).
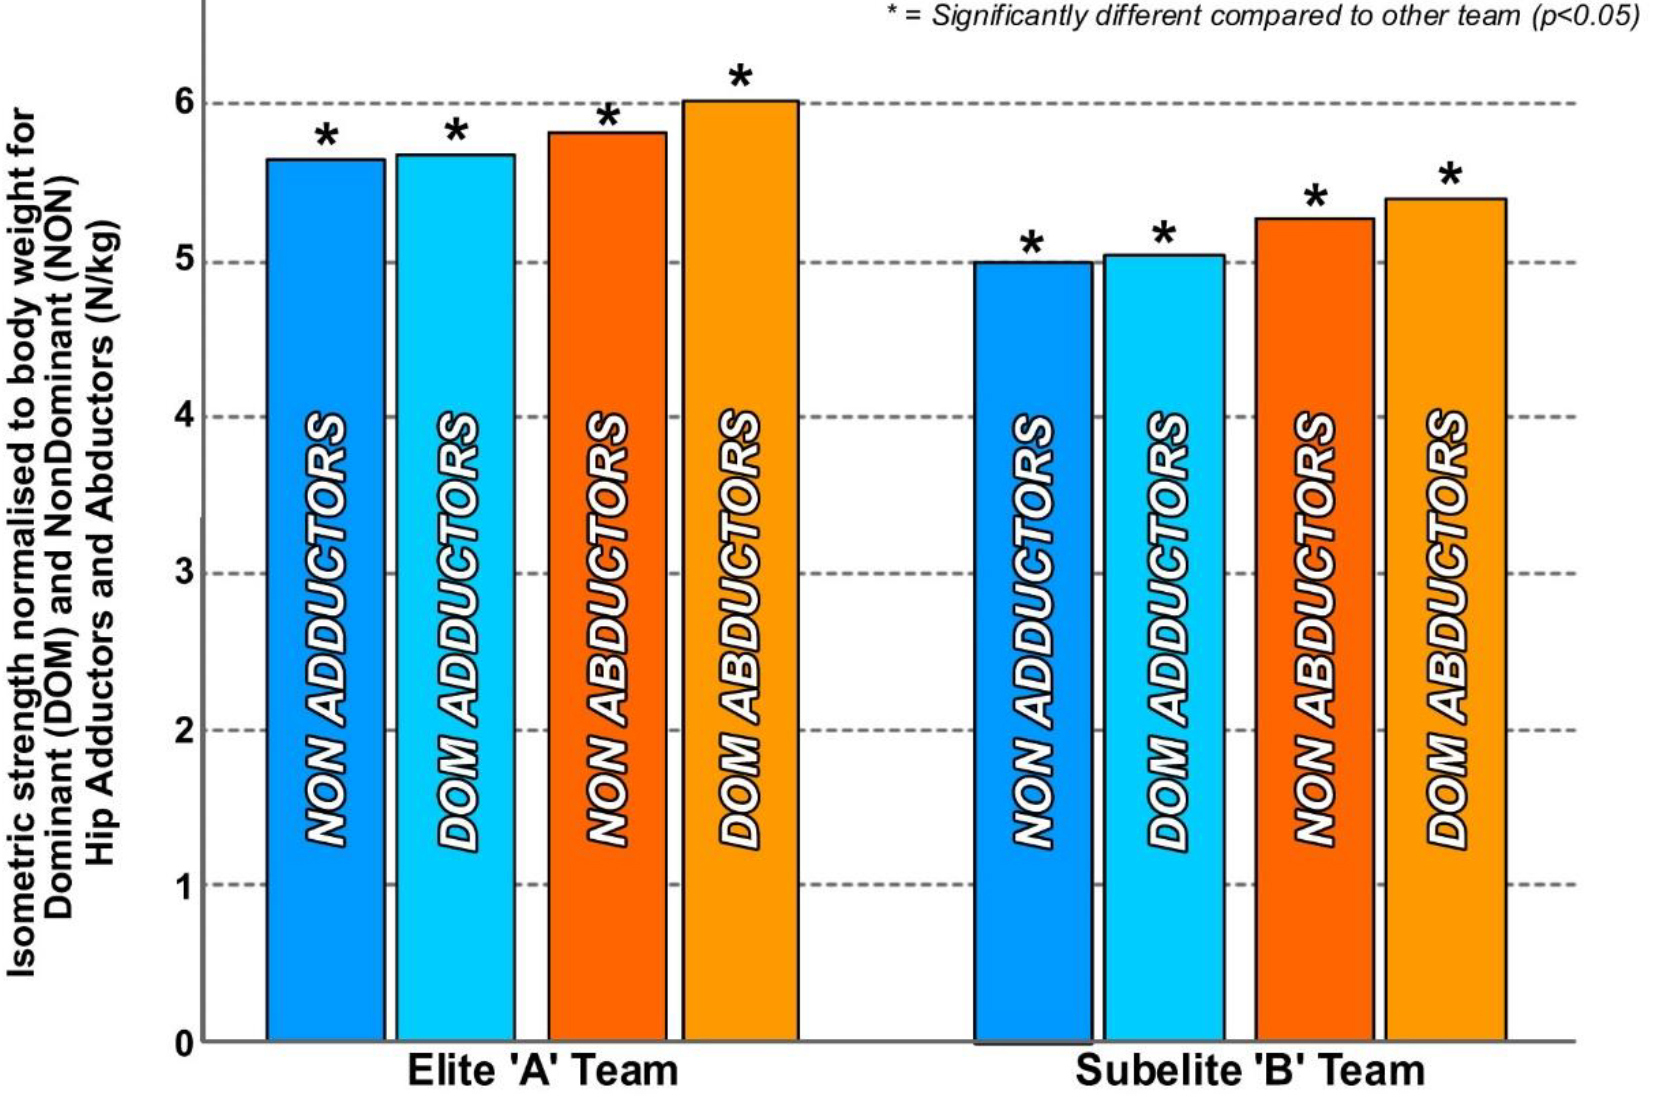
Isometric Normalised (NOR) Strength for dominant (DOM) and nondominant (NON) legs for Hip Adductors and Abductors for the Elite and Sub-elite teams.
Isokinetic absolute (ABS) and relative (NOR) maximum peak moment means and standard deviations for dominant (DOM) and nondominant (NON) knee extension and flexion for both teams and overall
Elite ( 15)
Sub-elite ( 15)
Overall ( 30)
-value
Effect size (Cohen’s )
Extensors
ABS 60 Dom (Nm)
152.00 17.42
157.47 29.85
154.73 24.17
0.545
0.224
ABS 60 Non (Nm)
157.67 23.56
163.33 24.18
160.50 23.64
0.521
0.237
ABS 180 Dom (Nm)
108.47 9.28
108.87 24.07
108.67 17.92
0.953
0.022
ABS 180 Non (Nm)
107.60 12.64
111.92 16.28
109.77 14.49
0.422
0.296
ABS 300 Dom (Nm)
84.60 6.65
82.87 17.88
83.73 13.29
0.729
0.128
ABS 300 Non (Nm)
84.60 9.49
84.67 12.26
84.63 10.77
0.987
0.006
NOR 60 Dom (Nm/kg)
2.45 0.25
2.48 0.23
2.47 0.24
0.716
0.125
NOR 60 Non (Nm/kg)
2.53 0.27
2.59 0.27
2.56 0.27
0.545
0.222
NOR 180 Dom (Nm/kg)
1.75 0.15
1.71 0.19
1.73 0.17
0.541
0.234
NOR 180 Non (Nm/kg)
1.73 0.17
1.78 0.15
1.76 0.16
0.473
0.312
NOR 300 Dom (Nm/kg)
1.37 0.11
1.31 0.15
1.34 0.14
0.231
0.456
NOR 300 Non (Nm/kg)
1.37 0.15
1.34 0.10
1.35 0.12
0.616
0.235
Flexors
ABS 60 Dom (Nm)
84.60 16.11
77.67 10.26
81.13 13.73
0.171
0.513
ABS 60 Non (Nm)
81.33 16.66
76.12 17.22
78.73 16.85
0.408
0.308
ABS 180 Dom (Nm)
64.27 10.69
54.67 7.45
59.47 10.29
0.008
1.042
ABS 180 Non (Nm)
60.73 12.29
53.20 12.42
56.97 12.73
0.106
0.609
ABS 300 Dom (Nm)
49.33 7.83
38.93 6.94
44.10 8.99
0.001
1.406
ABS 300 Non (Nm)
47.13 10.16
37.33 10.15
42.23 11.15
0.013
0.965
NOR 60 Dom (Nm/kg)
1.37 0.27
1.24 0.18
1.31 0.24
0.150
0.567
NOR 60 Non (Nm/kg)
1.31 0.25
1.21 0.24
1.26 0.25
0.279
0.408
NOR 180 Dom (Nm/kg)
1.04 0.19
0.88 0.13
0.96 0.18
0.009
0.983
NOR 180 Non (Nm/kg)
0.98 0.18
0.84 0.16
0.91 0.18
0.039
0.822
NOR 300 Dom (Nm/kg)
0.80 0.12
0.62 0.11
0.71 0.14
0.000
1.564
NOR 300 Non (Nm/kg)
0.76 0.15
0.59 0.14
0.68 0.16
0.003
1.172
H:Q Ratios
60 Dom
56.13 11.42
50.44 8.99
53.28 10.51
0.141
0.554
60 Non
51.71 7.71
47.07 9.73
49.39 8.95
0.159
0.529
180 Dom
59.60 10.78
51.73 10.40
55.67 11.15
0.052
0.743
180 Non
56.36 8.44
47.66 8.61
52.01 9.47
0.009
1.020
300 Dom
58.64 10.22
48.07 10.16
53.35 11.37
0.008
1.037
300 Non
55.68 9.93
44.33 10.74
50.00 11.69
0.006
1.097
Legend: Nm: Newtown metres; kg: kilograms; ABS: absolute maximal value; NOR: maximal value normalised to bodyweight; Dom: dominant leg; Non: Nondominant leg; H:Q Ratio: Hamstring to Quadriceps Ratio; Significantly different between teams ( 0.05).
Hip adductor and abductor strength
ABS and NOR isometric strength for the hip adductors and abductors are presented for both teams, and overall, in Table 3. It was revealed that the Elite team had significantly higher values for both DOM and NON adductor and abductor NOR strength, and for the DOM abductor ABS strength. These NOR value differences between teams are highlighted in Fig. 1. The DOM and NON ADD:ABD Ratios were not significant between the teams.
Knee flexor and extensor strength
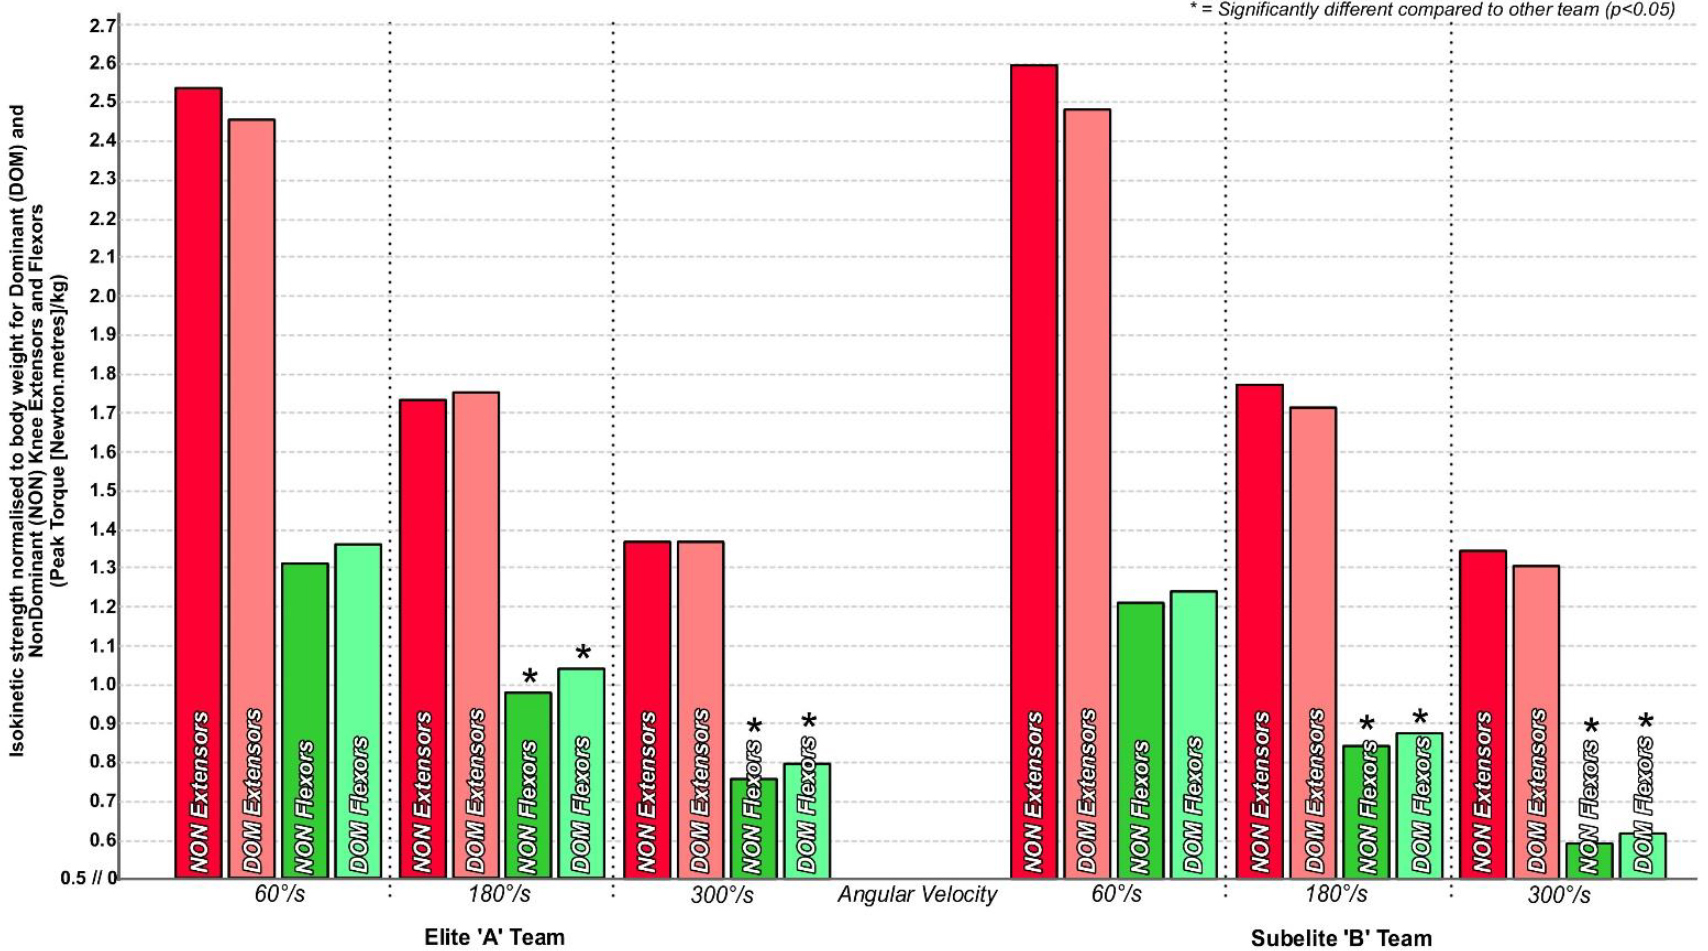
ABS and NOR isokinetic PT for DOM and NON were gathered for knee flexors and extensors at three velocities: 60/s, 180/s, and 300/s. Results are presented for each team, and overall, in Table 4 and Fig. 2. The Elite team had significantly stronger DOM Flexor values at 180/s and 300/s (ABS and NOR), and NON Flexor values at 180/s (NOR) and 300/s (ABS and NOR). Furthermore, the H:Q Ratio was significantly different between teams, as the Elite team had significantly increased ratios for NON at 180/s and 300/s, and for DOM at 300/s, though it should be noted that the ratio for DOM at 180/s was very nearly significant ( 0.052).
Correlations between flexor, abductor, and adductor strength values, and age, football experience, and fulltime training experience
Age (years)
Football experience (years)
Fulltime training (years)
Strength values
r
p-value
r
p-value
r
p-value
Flexors ABS Dom 60
0.381
0.038
0.373
0.042
0.140
0.461
Flexors ABS Dom 180
0.504
0.005
0.524
0.003
0.311
0.094
Flexors ABS Non 180
0.414
0.023
0.340
0.066
0.178
0.346
Flexors ABS Dom 300
0.539
0.002
0.573
0.001
0.414
0.023
Flexors ABS Non 300
0.472
0.008
0.416
0.022
0.313
0.092
Flexors NOR Dom 180
0.464
0.010
0.489
0.006
0.343
0.064
Flexors NOR Non 180
0.480
0.007
0.405
0.027
0.271
0.147
Flexors NOR Dom 300
0.550
0.002
0.592
0.001
0.479
0.007
Flexors NOR Non 300
0.525
0.003
0.476
0.008
0.407
0.025
H:Q Ratio Dom 60
0.385
0.036
0.370
0.044
0.258
0.169
H:Q Ratio Dom 180
0.434
0.017
0.403
0.027
0.254
0.175
H:Q Ratio Non 180
0.484
0.007
0.457
0.011
0.345
0.062
H:Q Ratio Dom 300
0.559
0.001
0.555
0.001
0.415
0.023
H:Q Ratio Non 300
0.472
0.008
0.437
0.016
0.425
0.019
Adductors ABS Dom
0.266
0.155
0.266
0.156
0.474
0.008
Adductors ABS Non
0.231
0.219
0.204
0.280
0.366
0.047
Adductors Norm Dom
0.299
0.108
0.296
0.112
0.546
0.002
Adductors Norm Non
0.231
0.219
0.245
0.193
0.443
0.014
Abductors Norm Non
0.303
0.103
0.331
0.074
0.362
0.049
Legend: ABS: absolute maximal value; NOR: maximal value normalised to bodyweight; Dom: dominant leg; Non: Nondominant leg; H:Q Ratio: Hamstring to Quadriceps Ratio; r: Pearson’s correlation coefficient; Significantly different between teams ( 0.05).
Isokinetic normalised strength (NOR) for dominant (DOM) and nondominant (NON) legs for knee extensors and flexors for the elite and sub-elite teams.
Correlations to age, years of football experience, and years of fulltime training
When the correlations of Age, FE, and FTT to the strength values were assessed, significant results were found for Flexor, Adductor, and Abductor values (Table 5). Age had a significant low-to-moderate positive correlation to DOM and NON Flexor strength values (ABS and NOR) at 180/s and 300/s, and a low positive correlation to DOM at 60/s (ABS only). Thus, there were significant low-to-moderate positive correlations of Age to the DOM H:Q ratios at 60/s, 180/s, and 300/s, and NON H:Q Ratios at 180/s and 300/s. FE had nearly the exact same significant correlations, apart from NON at 180/s (ABS only). These were low-to-moderate positive correlations, usually becoming greater with increased velocity.
There was a significant moderate positive correlation of FTT to the highest speed of 300/s for DOM ABS, and DOM and NON NOR. This then showed a significant low positive correlation for both H:Q ratios at 300/s. Interestingly, FTT had a significant low-to-moderate positive correlation to both DOM and NON adductor strength (ABS and NOR), and to NON abductor strength (NOR only).
Discussion
Our research found that the faster velocities of testing at 180/s and 300/s revealed significant differences in knee flexor strength between the Elite and Sub-elite teams that the usual testing method of 60/s did not uncover. This higher velocity isokinetic testing at 300/s has not been conducted before in a solely female footballer population, despite recommendations for it [14]. Normative isokinetic knee extensor and flexor strength values for female footballers of mixed performance levels exist for testing at 60/s [14, 15, 24, 25, 26, 27]. Our absolute knee extensor strength results are in the midrange compared to the literature (approx. 125–190 Nm), while our absolute knee flexor strength results are more in line with the lower end of the spectrum (approx. 70–105 Nm) [14, 15]. Until recently, little research existed at faster angular velocities that are nearer the functional knee velocities of football activities, such as cutting or landing [28]. For testing at 180/s, our overall adult female footballers had stronger normalised strength values compared to the adolescent population of Hannon et al. (2022), and while our Elite team had similar results to the findings of Brígido-Fernández et al. (2022), our Sub-elite team had lower knee flexor strength results [14, 25]. This shows the benefit of comparing between performance levels. Taking an average without consideration for playing level could hide deficits in those playing at lower levels, as the Sub-elite team in our study were significantly weaker in knee flexor strength compared to the Elite team. This gives more specific and individualised results for practitioners at different performance levels, rather than when players are pooled overall.
While previous research has stated that H:Q ratios should increase with increasing velocity [28], this has only been shown with the functional H:Q ratio in females [29], not the conventional ratio, which has been shown to plateau in females compared to males [28]. This is similar to our findings in which the ratio did not increase at the highest isokinetic angular velocity of 300/s. While the ratios for the Elite are in line with previous research [14, 15, 24, 25, 26, 27], they are still below the 60% set out in ACL injury prevention guidelines [9, 30]. The Elite had a closer ratio to the guideline of approximately 55–59%, however the Sub-elite had a significantly lower H:Q ratio of approximately 45–50% due to significantly weaker knee flexor strength compared to the Elite. These results indicate that while both groups would benefit from knee flexor strengthening, sub-elite players require more in order to reach the level of their elite peers and be closer to injury prevention guidelines.
In isometric hip strength testing in female athletes, previous studies have found hip abductor asymmetry in sidelying, dynamometer strength differences between younger age groups, and that a lower adductor to abductor ratio was associated with increased ACL injury risk [11, 13, 31]. Our performance level comparison revealed the Elite had significantly higher adductor and abductor strength than their Sub-elite counterparts when normalising the results to bodyweight, a common practice in the literature to assess individual-specific deficits, rather than when comparing absolute values [21]. These results indicate that Sub-elite players require hip strengthening interventions, both for adductors and abductors, in order to meet the physical demands of the elite level, where games are of a higher intensity [32]. The hip and groin area is the most frequent non-time-loss injury location in amateur female footballers, which further necessitates hip strengthening intervention in this population below the elite level [33]. There were no significant differences between ADD:ABD ratios, and the results for both squads were in line with guidelines for these ratios [13, 34].
Overall, these findings show that of the four muscle groups tested, three of them were significantly different between the Elite and Sub-elite. Research with male footballers has also found differences between performance levels with the most Elite sides having stronger peak isokinetic values, including for knee extension, at 60/s and 300/s [36]. This could mean a longer transition period for sub-elite players to reach the elite level in order to reduce injury and meet the demands required [13, 35]. Practitioners and coaches should be mindful of this when preparing players in sub-elite teams for the elite leagues, and our results highlight the incorporation of additional strengthening of these muscle groups for footballers that are making the step up.
When analysing the relationship of age, years of football experience, and years of fulltime training to the strength values, the first two parameters were quite similar. They had a significant low-to-moderate positive relationship with the knee flexor strength values, which usually increased with increasing angular velocity. This follows similar results in male footballers, who are stronger in isokinetic knee and isometric hip strength when older [37, 38]. Years of fulltime training also had a significant low-to-moderate positive relationship to knee flexor strength at the highest velocity of 300/s, an angular velocity which has previously shown a significant inverted relationship with kick accuracy in elite male soccer players [39]. This could be taken into account when working with younger athletes in the female football environment; they may need additional knee flexor strengthening at higher velocities in order to reach the level of their older peers. Years of fulltime training revealed an interesting significant finding of greater adductor strength, absolute and normalised, in those with more years of fulltime training, as well as normalised nondominant abductor strength. This indicates that those moving from an amateur, youth, or sub-elite level into fulltime training may require additional hip strengthening work in order to be on par with their peers. As seen in longitudinal studies, hip strength does not significantly change over time with age, which is in agreement with our results [12]. For individualised results, hip strength values should be normalised to body weight to assess deficits more accurately. It could also be used to provide tailored strengthening programmes for specific players.
The results presented here are novel in the literature, as for the first time the relationship of strength to years of fulltime training was explored in female footballers. Previous work in male footballers included only participants with training ages above 5 years, and it found no significant differences between the training age groups for isokinetic knee flexor and extensor testing at 180/s and 300/s [17]. The training age was undefined, but it is assumed to be similar to our years of football experience parameter [17]. Likewise, another paper found a small effect of years of training on the H:Q ratio for the non-dominant leg, though not for the individual knee flexor strength values at 60/s [18]. Again, this highlights our results that higher velocities may be required to discover deficits in football players, particularly in knee flexor strength in females, which is associated with ACL injury risk at 300/s [9].
Future research should assess whether these findings occur with the commonly-used functional H:Q ratio, which includes eccentric hamstring strength [29, 40], as well as in a fatigued state [41]. Our results can only be used to compare against concentric knee flexor and extensor strength, and a consideration should be made that at higher velocities, such as at 300/s, isokinetic measurements can have inertial error effects [42]. Another factor that may impact results is previous lower limb injury, particularly hamstring or ACL injuries, which can see continued deficits in muscle strength after rehabilitation [43]. The use of the VALD ForceFrame may limit generalisation of results to other isometric hip strength measures, though it has been validated against other isometric testing apparatus [20, 21]. There may also be limitations in comparing an A and B team of the same club, as the B team may feature younger high potential players than other Sub-elite teams. However, the average age of the Sub-elite team was above 19 years old so they were still adult players. Finally, this current research was conducted in a small sample size, and this weakens the conclusions to be drawn from our correlation analysis especially. It should be repeated in a larger population, ideally with additional comparisons to younger and/or amateur female footballers.
Conclusion
Lower limb strength differences exist between Elite and Sub-elite female footballers. These were found when normalising scores to body mass for hip adductors and abductors, and at higher angular velocities of 180/s and 300/s in isokinetic knee flexors. These results indicate the areas needed for improvement for sub-elite players to reach the levels of their elite peers. The strength performance was significantly related to age, years of football experience, and years of fulltime training, as younger athletes may require further knee flexor strengthening to match their older peers. Moreover, our results show that those moving from an amateur or non-fulltime environment to fulltime training may require additional adductor and abductor strengthening to meet the elite fulltime training requirements .
Author contributions
CONCEPTION: FFV, MH, PM, TM and FZ.
PERFOEMANCE OF WORK: All authors were a part of the data acquisition.
INTERPRETATION OR ANALYSIS OF DATA: FFV, MH, PM, TM, and FZ.
PREPARATION OF THE MANUSCRIPT: FFV.
REVISION FOR IMPORTANT INTELLECTUAL CONTENT: MH, PM, TM, and FZ revised it critically.
SUPERVISION: All authors have read and approved the final version of the manuscript.
Ethical considerations
This study was approved by the research ethics committee of the Faculty of Physical Education and Sport at Charles University, Czech Republic (No. 107/2021), and followed the principles of the declaration of Helsinki.
Funding
This research was supported by the Programme for Development of Fields of Study at Charles University under Grant UNCE HUM/032, SVV 260599, and the Student Development Programme at Charles University under Grant number START/SOC/066.
Footnotes
Acknowledgments
None.
Conflict of interest
The authors declare that they have no competing interests.
References
1.
KrygerKWangAMehtaRImpellizzeriFMasseyAMcCallA. Research on women’s football: a scoping review. Science and Medicine in Football.2021; 6(5): 549-558.
2.
CulvinA. Football as work: the lived realities of professional women footballers in England. Managing Sport and Leisure.2021 July: 1-14.
3.
GriffinJHoranSKeoghJDoddKAndreattaMMinahanC. Contextual factors influencing the characteristics of female football players. Journal of Sports Medicine and Physical Fitness.2021; 61(2): 218-232.
4.
ChoiceETufanoJJaggerKHookerKCohrane-SnymanK. Differences across Playing Levels for Match-Play Physical Demands in Women’s Professional and Collegiate Soccer: A Narrative Review. Sports.2022; 10: 141.
5.
StølenTChamariKCastagnaCWisløffU. Physiology of Soccer: An Update. Sports Medicine.2005; 35: 501-536.
6.
ReillyTBangsboJFranksA. Anthropometric and Physiological Predispositions for Elite Soccer. Journal of Sports Sciences.2000; 18: 669-683.
7.
OstenbergARoosH. Injury risk factors in female European football. A prospective study of 123; players during one season. Scandanavian Journal of Medicine and Science in Sports. 2000 October; 10(5): 279-285.
8.
SteffenKNilstadAKristianslundEMykleburstGBahrRKrosshaugT. Association between Lower Extremity Muscle Strength and Noncontact ACL Injuries. Medicine and Science in Sports and Exercise.2016 November; 48(11): 2082-2089.
9.
MyerGFordK, FossKLiuCNickTHewettT. The Relationship of Hamstrings and Quadriceps Strength to Anterior Cruciate Ligament Injury in Female Athletes. Clinical Journal of Sport Medicine.2009 January; 19(1): 3-8.
10.
IzovskaJHankMCabellLKalataMBujnovskyDZahalkaF, et al. The hamstring and ACL injury incidence during a season is not directly related to preseason knee strength ratios in elite male soccer players. Applied Sciences – Basel.2022; 12(3): 1272.
11.
FaltstromASkillgateETranaeusUWeissNKallbergHLybergV, et al. Normative values and changes in range of motion, strength, and functional performance over 1 year in adolescent female football players: Data from 418 players in the Karolinska football Injury Cohort study. Physical Therapy in Sport.2022 November; 58: 106-116.
12.
NguyenAZukEBaellowAPfileKDiStefanoLBolingM. Longitudinal Changes in Hip Strength and Range of Motion in Female Youth Soccer Players: Implications for ACL Injury, A Pilot Study. Journal of Sport Rehabilitation.2017; 26(5): 358-364.
13.
CollingsTDiamondLBarrettRTimminsRHickeyJMoulinW, et al. Strength and Biomechanical Risk Factors for Noncontact ACL Injury in Elite Female Footballers: A Prospective Study. Medicine and science in sports and exercise.2022; 54(8): 1242-1251.
14.
Brígido-FernándezIGarcía-Muro San JoséFCharneco-SalgueroGCárdenas-RebolloJOrtega-LatorreYCarrión-OteroO, et al. Knee Isokinetic Profiles and Reference Values of Professional Female Soccer Players. Sports (Basel).2022 December; 10(12): 204.
15.
RisbergMSteffenKNilstadAMykleburstGKristianslundEMltubaakM, et al. Normative Quadriceps and Hamstring Muscle Strength Values for Female, Healthy, Elite Handball and Football Players. The Journal of Strength and Conditioning Research.2018; 32(8): 2314-2323.
16.
GullichA. “Macro-structure” of developmental participation histories and “micro-structure” of practice of German female world-class and national-class football players. Journal of Sports Sciences.2019; 37(12): 1347-1355.
17.
FousekisKTsepisEVagenasG. Lower Limb Strength in Professional Soccer Players: Profile, Asymmetry, and Training Age. Journal of Sports Science & Medicine.2010 September; 9(3): 364-373.
18.
VoutselasVPapanikolaouZSoulasDFamisisK. Years of Training and Hamstring-Quadriceps Ratio of Soccer Players. Psychological Reports.2007; 101: 899-906.
19.
MalyTFordKSugimotoDIzovskaJBujnovskyDHankM, et al. Isokinetic Strength, Bilateral and Unilateral Strength Differences: Variation by Age and Laterality in Elite Youth Football Players. International Journal of Morphology.2021; 39(1): 260-267.
20.
OliverasRBizziniMBrunnerRMaffiulettiN. Field-based evaluation of hip adductor and abductor strength in professional male ice hockey players: Reference values and influencing factors. Physical Therapy in Sport.2020; 43: 204-209.
21.
O’ConnorCMcIntyreMDelahuntEThorborgK. Reliability and validity of common hip adduction strength measures: The ForceFrame strength testing system versus the sphygmomanometer. Physical Therapy in Sport.2023; 59: 162-167.
22.
MalyTMalaLBujnovskyDHankMZahalkaF. Morphological and Isokinetic Strength Differences: Bilateral and Ipsilateral Variation by Different Sport Activity. Open Medicine (Warsaw).2019; 14: 207-216.
23.
MukakaM. A guide to appropriate use of Correlation coefficient in medical research. Malawi Medical Journal.2012; 24(3): 69-71.
24.
ParpaKMichaelidesM. Anterior-Posterior and Inter-Limb Lower Body Strength Asymmetry in Soccer, Basketball, Futsal, and Volleyball Players. Medicina (Kaunas).2022 August; 58(8): 1080.
25.
HannonJWang-PriceSGarrisonJGotoSBothwellJBushC. Normalized Hip and Knee Strength in Two Age Groups of Adolescent Female Soccer Players. Journal of Strength and Conditioning Research.2022 January; 1(207-211): 36.
26.
Zimermann VargasVMottaCPeresBLuiz VanciniRDe LisaCSantos AndradeM. Knee isokinetic muscle strength and balance ratio in female soccer players of different age groups: a cross-sectional study. The Physician and Sportsmedicine.2020; 48(1): 105-109.
27.
StruzikASiemienskiABoberTPietrasezewskiB. Ratios of moments of antagonist muscle groups in female soccer players. Acta Bioeng Biomech.2018; 20(1): 153-158.
28.
HewettTMyerGZazulakB. Hamstrings to quadriceps peak moment ratios diverge between sexes with increasing isokinetic angular velocity. Journal of Science and Medicine in Sport.2008; 11(5): 452-459.
29.
De Ste CroixMElNagarYIgaJAyalaFJamesD. The impact of joint angle and movement velocity on sex differences in the functional hamstring/quadriceps ratio. Knee.2017; 24(4): 745-750.
30.
van der HorstNvan DenderenR. Isokinetic hamstring and quadriceps strength interpretation guideline for football (soccer) players with ACL reconstruction: a Delphi consensus study in the Netherlands. Science and Medicine in Football.2022; 6(4): 434-445.
31.
BrophyRChiaiaTMaschiRDodsonCOhLLymanS, et al. The Core and Hip in Soccer Athletes Compared by Gender. International Journal of Sports Medicine.2009; 30: 663-667.
32.
VescoviJFernandesEKlasA. Physical Demands of Women’s Soccer Matches: A Perspective Across the Developmental Spectrum. Frontiers in Sprots and Active Living.2021; 3: 634696.
33.
LanghoutRWeirALitjesWGozelingMStubbeJKerkhoffsG, et al. Hip and groin injury is the most common non-time-loss injury in female amateur football. Knee Surg Sports Traumatol Arthrosc.2019; 27(10): 3133-3141.
34.
TylerTNicholasSCampbellRMcHughM. The association of hip strength and flexibility with the incidence of adductor muscle strains in professional ice hockey players. American Journal of Sports Medicine.2001; 29(2): 124-128.
35.
CrossleyKPattersonBCulvenorABruderAMoslerAMentiplayB. Making football safer for women: a systematic review and meta-analysis of injury prevention programmes in 11 773 female football (soccer) players. British Journal of Sports Medicine.2020; 54(18): 1089-1098.
36.
GouveiaJFrancaCMartinsFHenriquesRNascimentoMIhleA, et al. Characterization of Static Strength, Vertical Jumping, and Isokinetic Strength in Soccer Players According to Age, Competitive Level, and Field Position. International Journal of Environmental Research in Public Health.2023 January; 20(3): 1799.
37.
OcarinoJResendeRBittencourtNCorreaRMendoncaLReisG, et al. Normative data for hip strength, flexibility and stiffness in male soccer athletes and effect of age and limb dominance. Physical Therapy in Sport.2021 January; 47: 53-58.
38.
BishopCCoratellaGBeatoM. Intra- and Inter-Limb Strength Asymmetry in Soccer: A Comparison of Professional and Under-18 Players. Sports (Basel).2021 September; 9(9): 129.
39.
MalyTZahalkaFMalaLTeplanJ. Profile, Correlation and Structure of Speed in Youth Elite Soccer Players. Journal of Human Kinetics.2014; 40(1): 149-159.
DelextratAGregoryJCohenD. The use of the functional H:Q ratio to assess fatigue in soccer. International Journal of Sports Medicine.2010; 31(3): 192-197.
42.
IossifidouANBaltzopoulosV. Inertial effects on the assessment of performance in isokinetic dynamometry. International Journal of Sports Medicine.1998 November; 19(8): 567-573.
43.
Rivera-BrownAFronteraWFontánezRMicheoW. Evidence for isokinetic and functional testing in return to sport decisions following ACL surgery. PM & R.2022 May; 14(5): 678-690.