Studies of coactivation have typically utilized single movement isometric or isokinetic fatiguing muscle actions.
OBJECTIVE:
The purpose of the current study was to examine coactivation of the biceps brachii (BB) and triceps brachii (TB) in response to a maximal, reciprocal, isokinetic fatiguing task of the forearm flexors and extensors at slow (60/s) and moderate (180/s) isokinetic velocities in men.
METHODS:
Ten men (mean SD: age 21.6 1.3 years) completed 50 consecutive, maximal, reciprocal, isokinetic muscle actions of the right forearm flexors and extensors at 60 and 180/s. The amplitude (AMP) and mean power frequency (MPF) contents of the electromyographic (EMG) and mechanomyographic (MMG) signals from the BB and TB were recorded simultaneously throughout the fatiguing task. Repeated measures ANOVAs with Tukey post hocs were used to determine mean differences for the torque and neuromuscular parameters across repetitions.
RESULTS:
The torque analyses indicated greater fatigability at 180/s, compared to 60/s ( 0.02). There were no significant changes in EMG AMP for either muscle during flexion or extension at 60/s ( 0.05). At 180/s, there were significant increases in agonist EMG AMP ( 0.01 to 0.004), however, no changes in antagonist EMG AMP ( 0.05). For EMG MPF, there were significant decreases during flexion and extension ( 0.001 to 0.02) at both velocities, collapsed across muscle. There were no significant ( 0.05) changes across repetition for MMG AMP or MPF.
CONCLUSIONS:
This study indicated velocity-specific responses to fatigue, with a greater magnitude of fatigability at 180/s. Furthermore, despite increases in EMG AMP of the agonist muscles at 180/s only, it was not sufficient to alter the ratio of coactivation, likely due to common neural drive between muscles. Thus, the decreases in torque in the present study were not attributable to increases in coactivation.
According to Hureau et al., (2018, p. 14) “Neuromuscular fatigue develops during strenuous physical activities and causes a temporary reduction in the force or power generating capacity of a muscle or muscle group” [1]. Recent studies have utilized protocols that involved sustained isometric [2, 3] or repeated isokinetic leg extension [4, 5] or forearm flexion [6, 7] muscle actions to examine the torque and neuromuscular responses to fatigue. The global magnitude of fatigue is often assessed from decreases in maximal voluntary isometric force [8, 9] or isokinetic peak torque [10, 11]. In addition, the neuromuscular patterns of responses from agonist muscles have been characterized using electromyography (EMG) and mechanomyography (MMG) to make inferences regarding fatigue-induced changes in motor unit activation strategies. The global fatigue-induced decreases in force (or torque) production can result from central and/or peripheral mechanisms and are usually, at least in part, attributable to decreases in intracellular pH due to the buildup of metabolic byproducts in the agonist muscle [12].
It has also been suggested that the simultaneous activation of the antagonist muscle during an agonist contraction, termed coactivation, may contribute to the fatigue-induced decreases in torque [13]. Previous studies [7, 14, 15]have reported fatigue-induced increases in activation of the antagonist muscle from the measurement of EMG amplitude (AMP) that occurred concurrently with decreases in torque production. There appears, however, to be a fatigue-induced, velocity-specific activation response for the antagonist muscle which is characterized by no changes at slow velocities [16], and no changes or increases at moderate to fast velocities [7, 15, 17]. It has also been reported that, despite increases in activation of the antagonist muscle, the ratio of coactivation (agonist activation divided by antagonist activation) remains constant throughout the fatiguing task due to common neural drive to agonist and antagonist muscles [7, 13, 18, 19]. Recently, Reece and Herda (2021) used EMG decomposition software to examine motor unit recruitment and firing rates in the biceps brachii (BB) and triceps brachii (TB). The authors [20] reported similar responses between the agonist and antagonist muscles during submaximal isometric forearm flexion and extension muscle actions. In addition, Neltner et al., (2022) used simultaneous assessments of EMG and MMG, AMP and mean power frequency (MPF) responses to examine the contributions of muscle activation (EMG AMP), motor unit recruitment (MMG AMP), muscle compliance (MMG AMP), and the global firing rate of the unfused, activated motor units (MMG MPF) to coactivation. Based on similar fatigue-induced responses for the BB and TB, the authors [7] hypothesized that there was a common neural drive for the agonist and antagonist muscle and that coactivation did not contribute to the fatigue-induced decrease in torque. Thus, when assessing coactivation as a ratio, there is conflicting evidence regarding the contributions of coactivation to fatigue-induced decreases in torque [13].
Studies of coactivation have typically utilized single movement isometric or isokinetic fatiguing muscle actions [6, 14, 18, 19]. Recently, however, Neltner et al., (2022) examined the effects of a reciprocal, isokinetic fatiguing task of the forearm flexors and extensors on coactivation in women. Previous studies on sex differences in fatigue characteristics have indicated that women are more fatigue resistant than men [21, 22, 23]. It has been suggested that differences in the neuromuscular responses of the agonist muscles contribute to the greater magnitude of fatigability in men [24, 25, 26]. Perhaps, there are differences between men and women in the neuromuscular responses of the antagonist muscle and the contribution of coactivation to fatigue-induced decreases in torque. Thus, the purpose of the current study was to examine coactivation of the biceps brachii (BB) and triceps brachii (TB) in response to a maximal, reciprocal, isokinetic fatiguing task of the forearm flexors and extensors at slow (60/s) and moderate (180/s) isokinetic velocities in men. We hypothesized, based on previous studies [7, 14, 15, 16], that no changes in activation would occur at 60/s, however, there would be increases in activation at 180/s. In addition, there would be similar neuromuscular responses of the agonist and antagonist muscles across the fatiguing task, including decreases in EMG MPF, but no changes or decreases in MMG AMP and MPF for both movements and velocities [4, 6, 7].
Methods
Subjects
An a priori power analysis (G*Power3) revealed that to demonstrate mean differences between two dependent groups using repeated measures (RM) ANOVAs, an effect size of 0.85 [4], a power of 0.95, and an alpha of 0.05, at least 8 subjects were required. Therefore, to ensure adequate power, ten men (mean SD: age 21.6 1.3 years; body mass 80.9 6.5 kg; height 179.1 5.9 cm) were enrolled in this study. None of the data in this study have been previously published, however, the subjects were part of a larger multi-independent and dependent variable study [7]. All subjects were recreationally trained, including participating in resistance and/or aerobic training at least three days per week prior to participation in the study [27]. The subjects were directed to refrain from resistance training of the upper body for at least 24 hours before each visit. The subjects reported for testing on three occasions, each separated by 2 to 7 days. During a familiarization visit prior to participation in the two testing visits, the subjects were required to sign a written informed consent document and complete a health history questionnaire. The study was approved by the University Institutional Review Board for Human Subjects (#20200120007FB/2019).
Electromyographic and mechanomyographic signal acquisition
Prior to electrode positioning, the skin was dotted with a marker on the BB at 1/3 of the distance on a line from the fossa cubit and the medial acromion, and on the TB at two finger widths medially to the line between the posterior crista of the acromion and the olecranon at a distance of 50%, in accordance with the Surface Electromyography for the Non-Invasive Assessment of Muscles project recommendations [28]. The skin was then shaved and carefully abraded and cleaned with an alcohol wipe. Bipolar (30-mm center-to-center) surface EMG electrodes (circular 4-mm diameter silver/silver chloride; Biopac Systems, Inc., Santa Barbara, CA, USA) were then placed on the BB and the long head of the TB, based on previously described activation patterns [29]. For MMG signal detection, miniature accelerometers (Entras EGAS FT 10, bandwidth 0–200 Hz, dimensions 1.0 1.0 0.5 cm, mass 1.0 g, sensitivity 550.4 mVg-1 for the BB, 501.7 mVg-1 for the TB) were positioned between the bipolar EMG electrodes of the BB and TB muscles using double-sided adhesive tape.
The raw EMG and MMG signals were digitized at 2000 Hz with a 12-bit analog-to-digital converter (Model MP150; Biopac Systems, Inc.) and the EMG signals were amplified (gain: 1000) using differential amplifiers (EMG2-R Bionomadix, Biopac Systems, Inc., Goleta, CA, USA; bandwidth – 10–500 Hz). The EMG and MMG signals were stored on a personal computer (Dell XPS Dell Inc., Round Rock, TX, USA) and signal processing was performed using custom programs written with the LabVIEW programming software (version 18.0f2, National Instruments, Austin, TX, USA) where they were digitally bandpass filtered (fourth-order Butterworth) at 10–500 Hz and 5–100 Hz, respectively. For each forearm muscle action, the EMG (V root mean square, Vrms) and MMG AMP (ms) and MPF (Hz) values were calculated for a time period that corresponded to the middle third of the total range of motion [30] (approximately 50 to 100 of the movement) to avoid the acceleration and deceleration phases of the isokinetic repetitions. There was 150 total range of motion, which resulted in a total contraction time of 2.5 s and 0.83 s and signal epochs of 0.83 s and 0.28 s were used to calculate the AMP and MPF values of the EMG and MMG signals for the 60/s and 180/s trials, respectively.
Experimental procedures
The subjects first completed a familiarization visit where they were oriented to the positioning on the upper body exercise table and practiced the forearm flexion and extension movements. During the familiarization and testing visits, the subjects laid supine on the upper body exercise table, aligning the lateral epicondyle of their humerus with the lever arm of the Cybex 6000 (Cybex, Division of Lumex, Inc., Ronkonkoma, NY, USA). The subjects grasped the handle with their dominant hand (based on throwing preference). During the testing visits, the subjects performed a standardized warmup, consisting of 10 submaximal repetitions at 60/s and 180/s, followed by a fatiguing task. The fatiguing task consisted of 50 maximal, reciprocal, forearm flexion and extension repetitions at 60/s or 180/s (randomly ordered) on separate days.
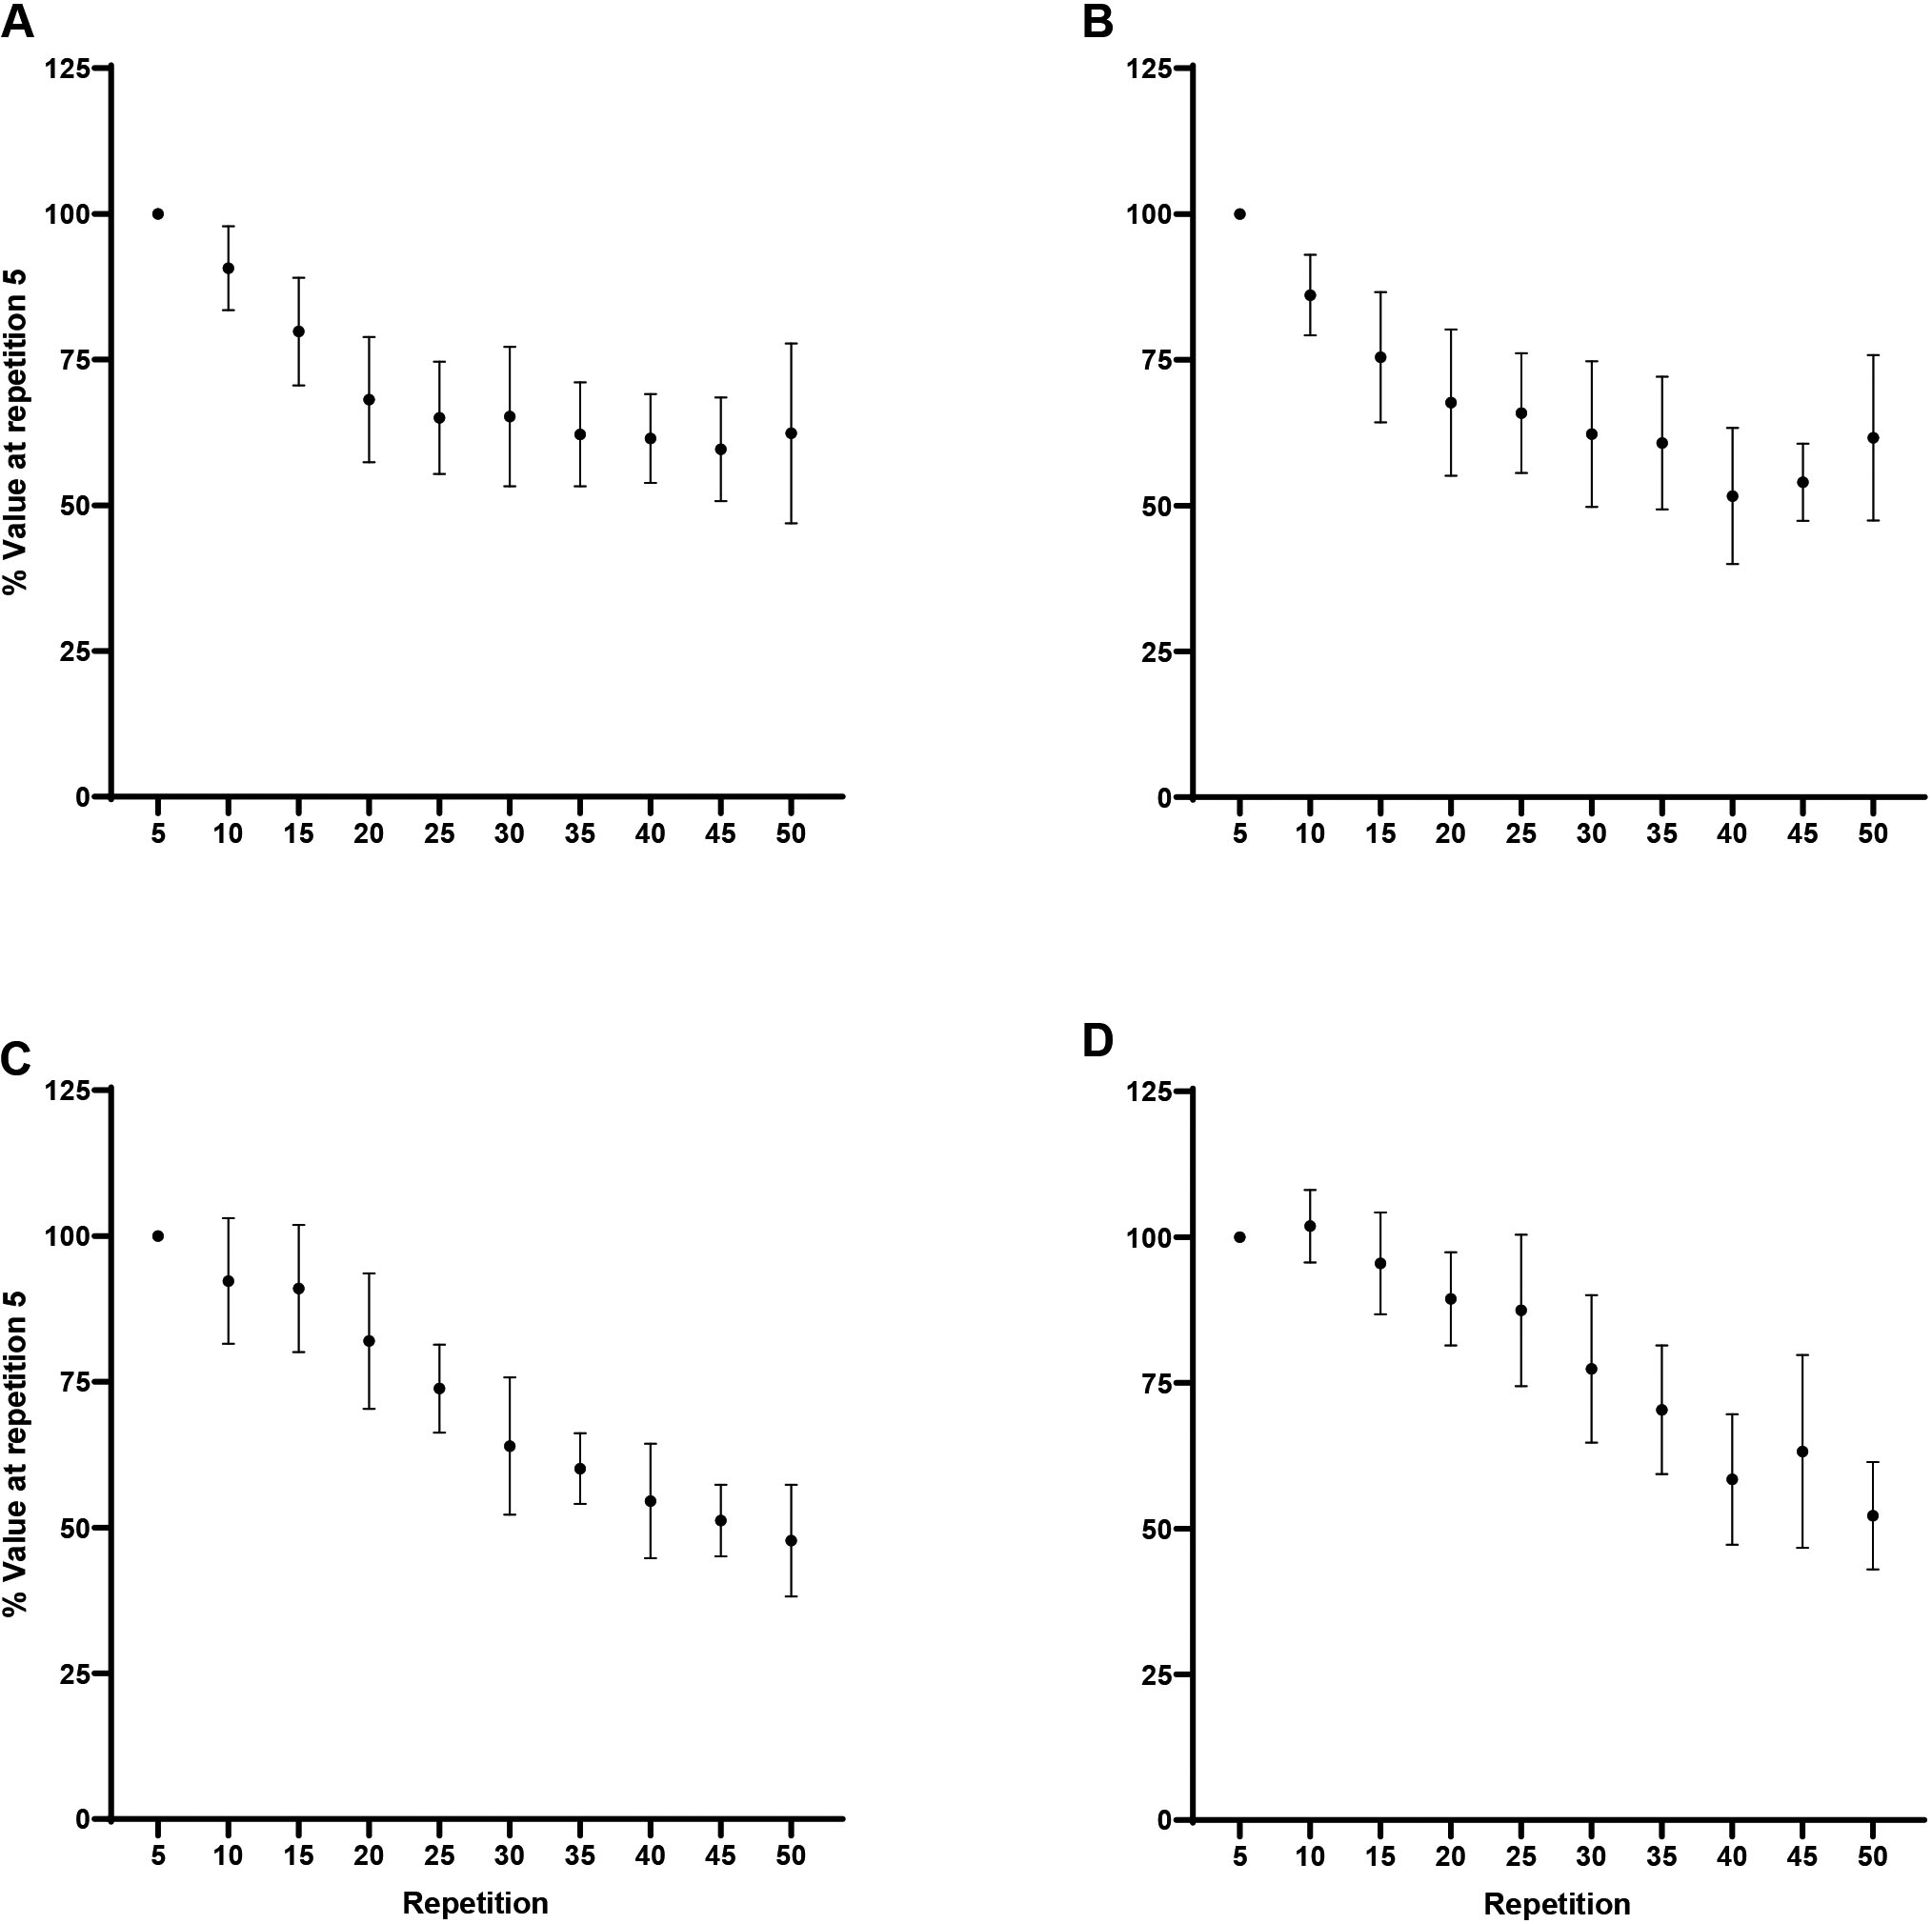
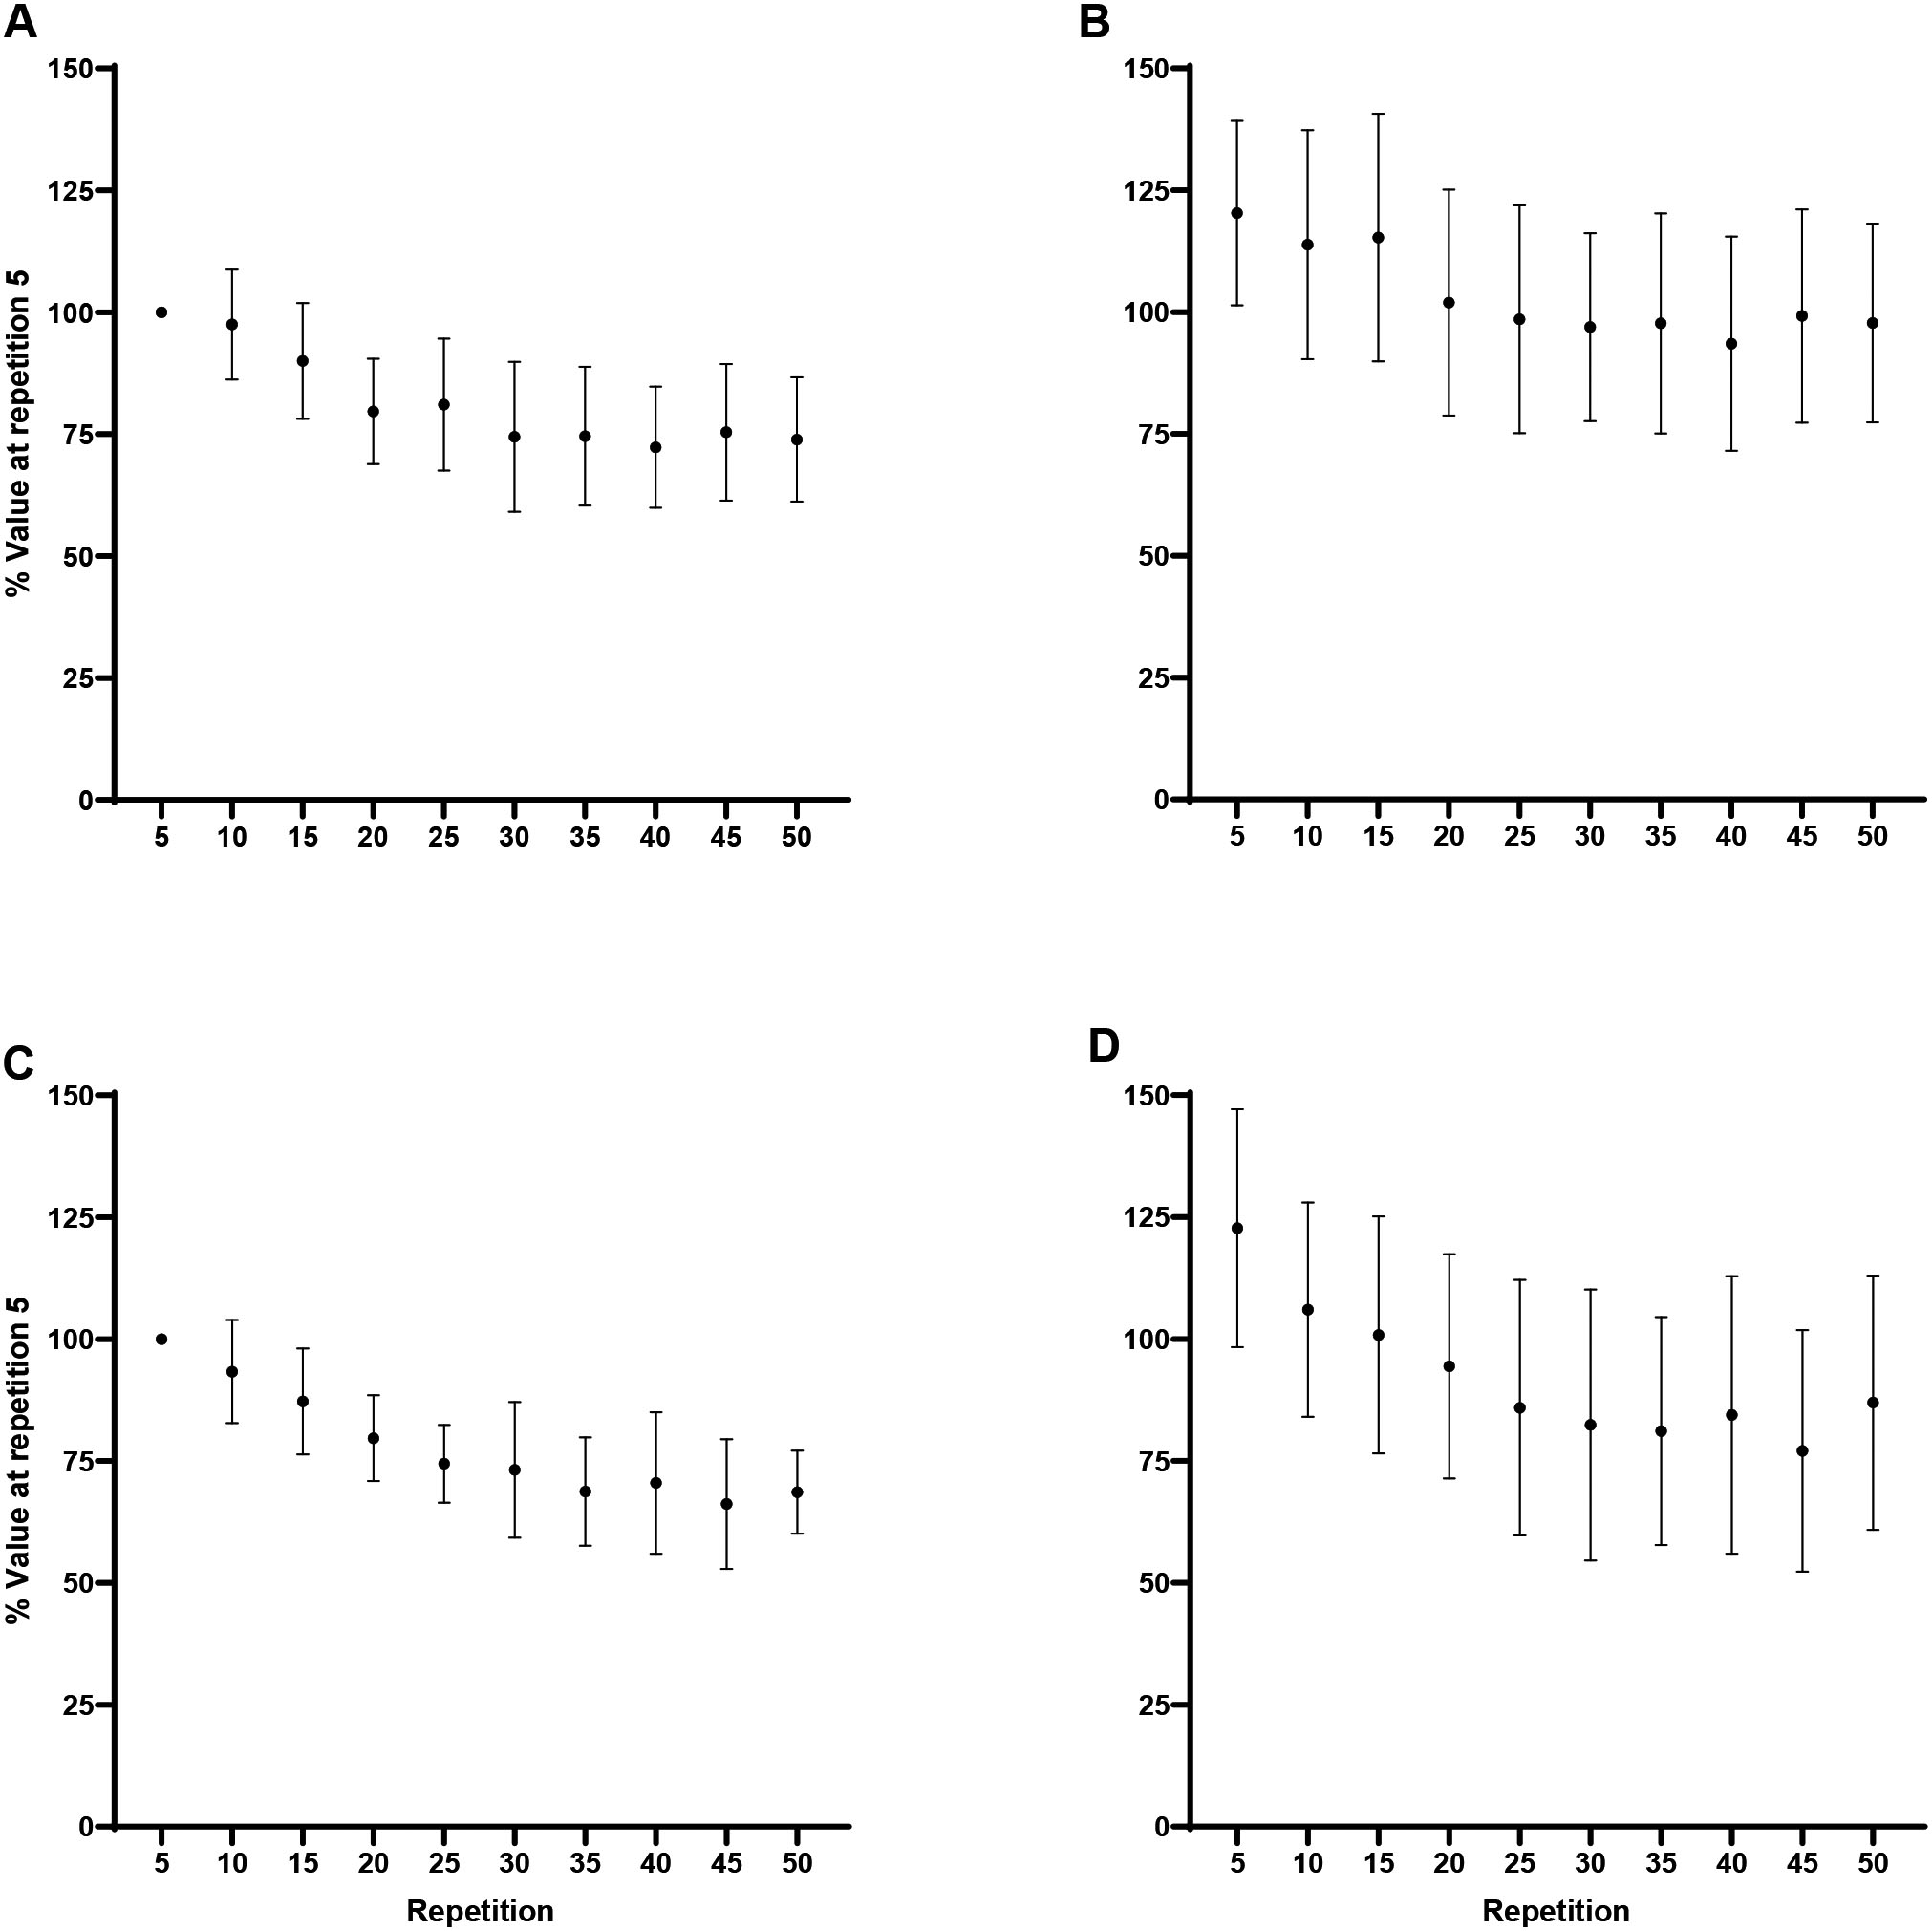
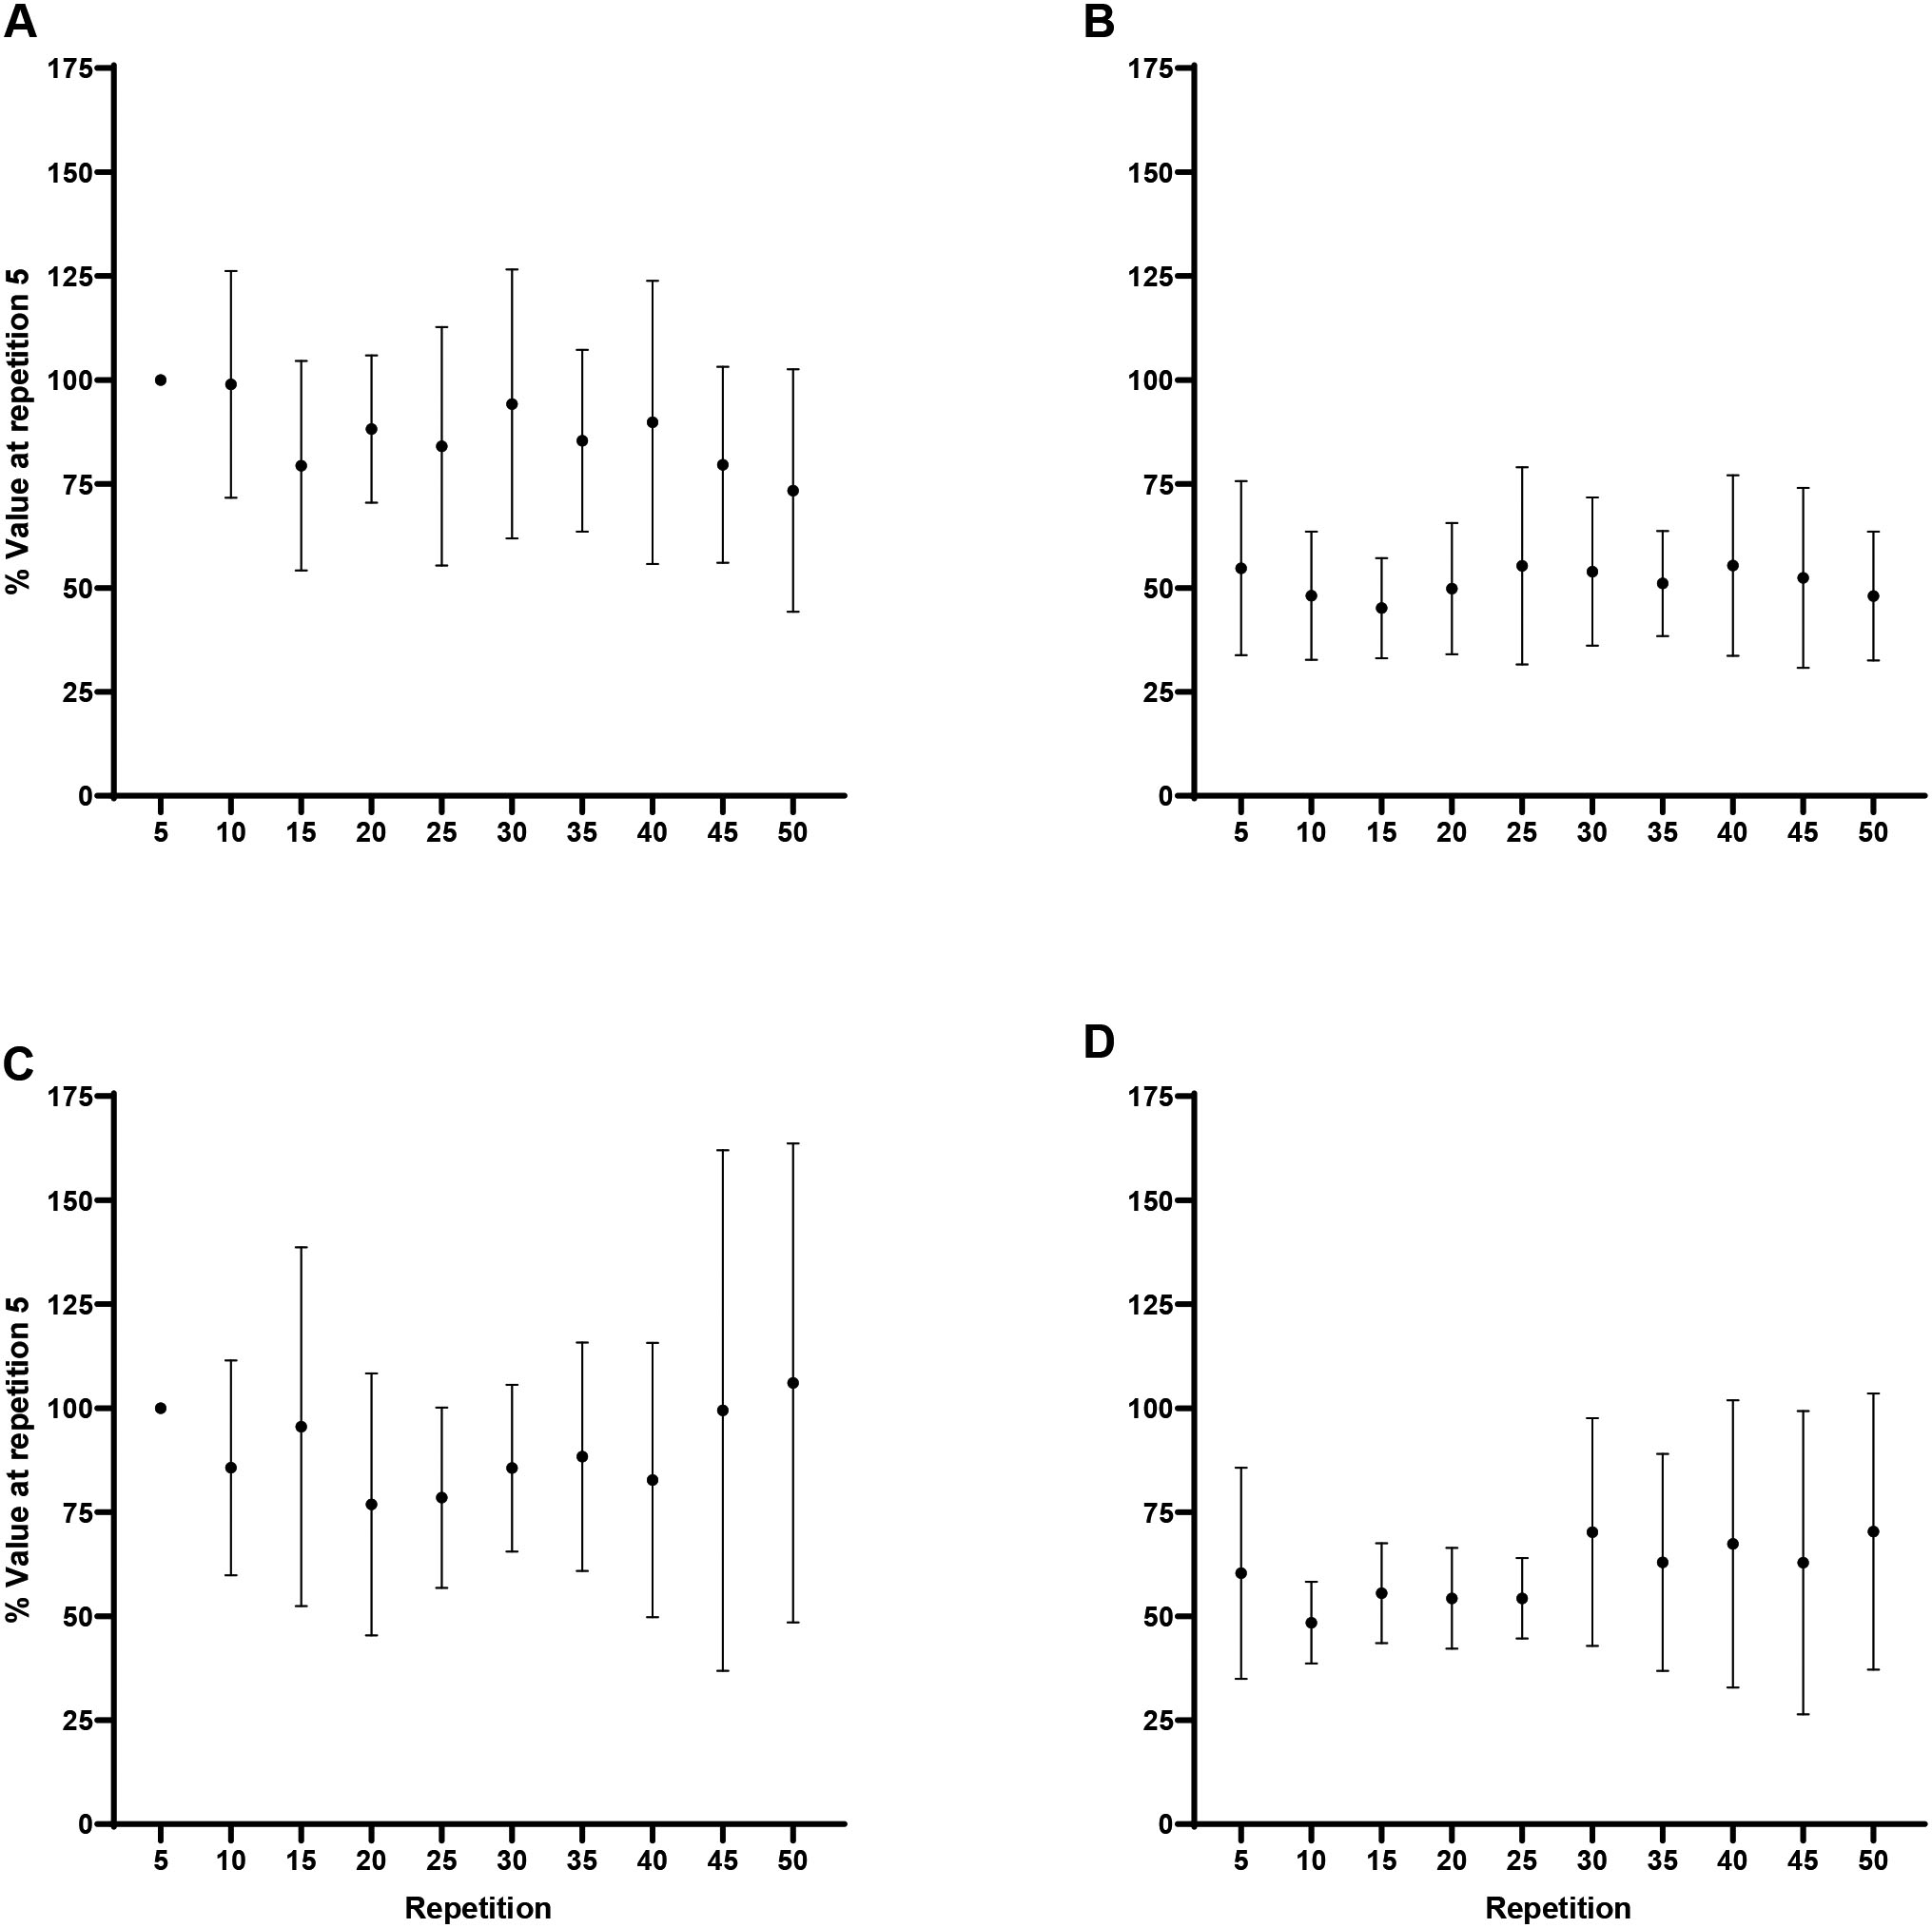
Peak torque: Normalized (% of repetition 5) peak torque (mean SD) for every fifth repetition. A) Forearm flexion at 60/s, B) Forearm extension at 60/s, C) Forearm flexion at 180/s, D) Forearm extension at 180/s. Note: A) Repetition 5 greater than repetitions 15–50 at 0.05. B) Repetition 5 greater than repetitions 10–50 at 0.05. C) Repetition 5 greater than repetitions 20–50 at 0.05. D) Repetition 5 greater than repetitions 25–50 at 0.05.
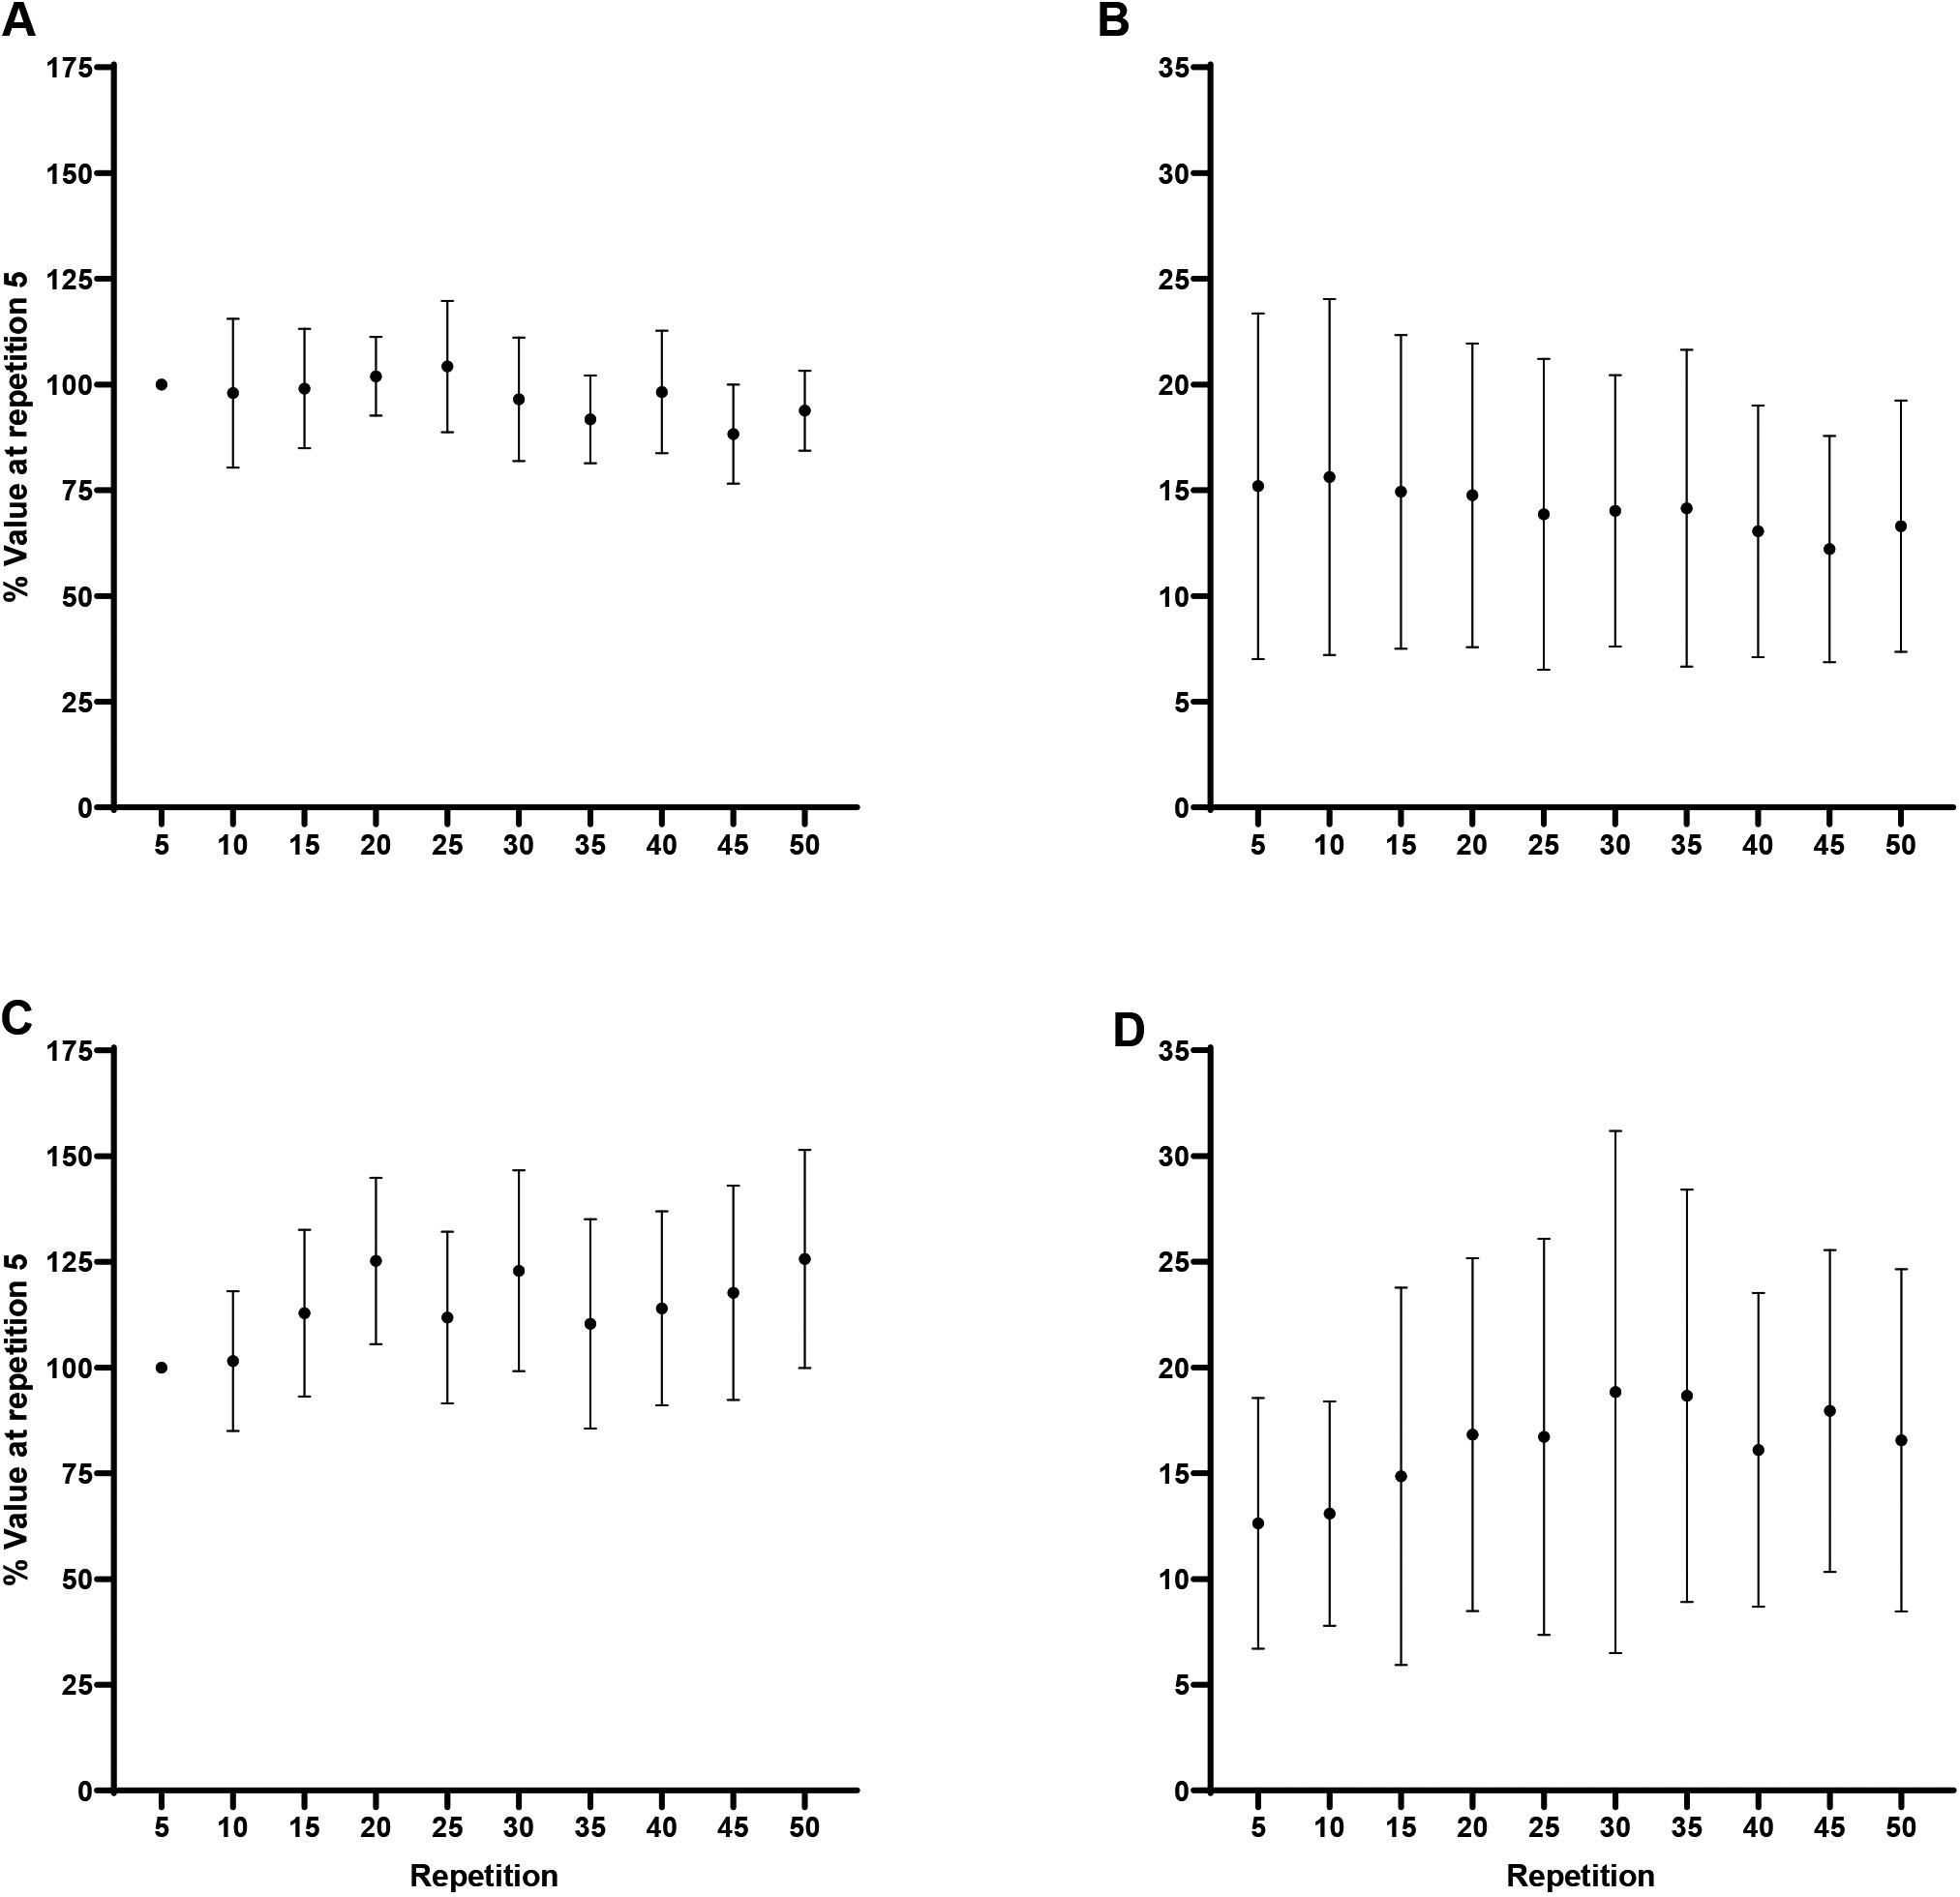
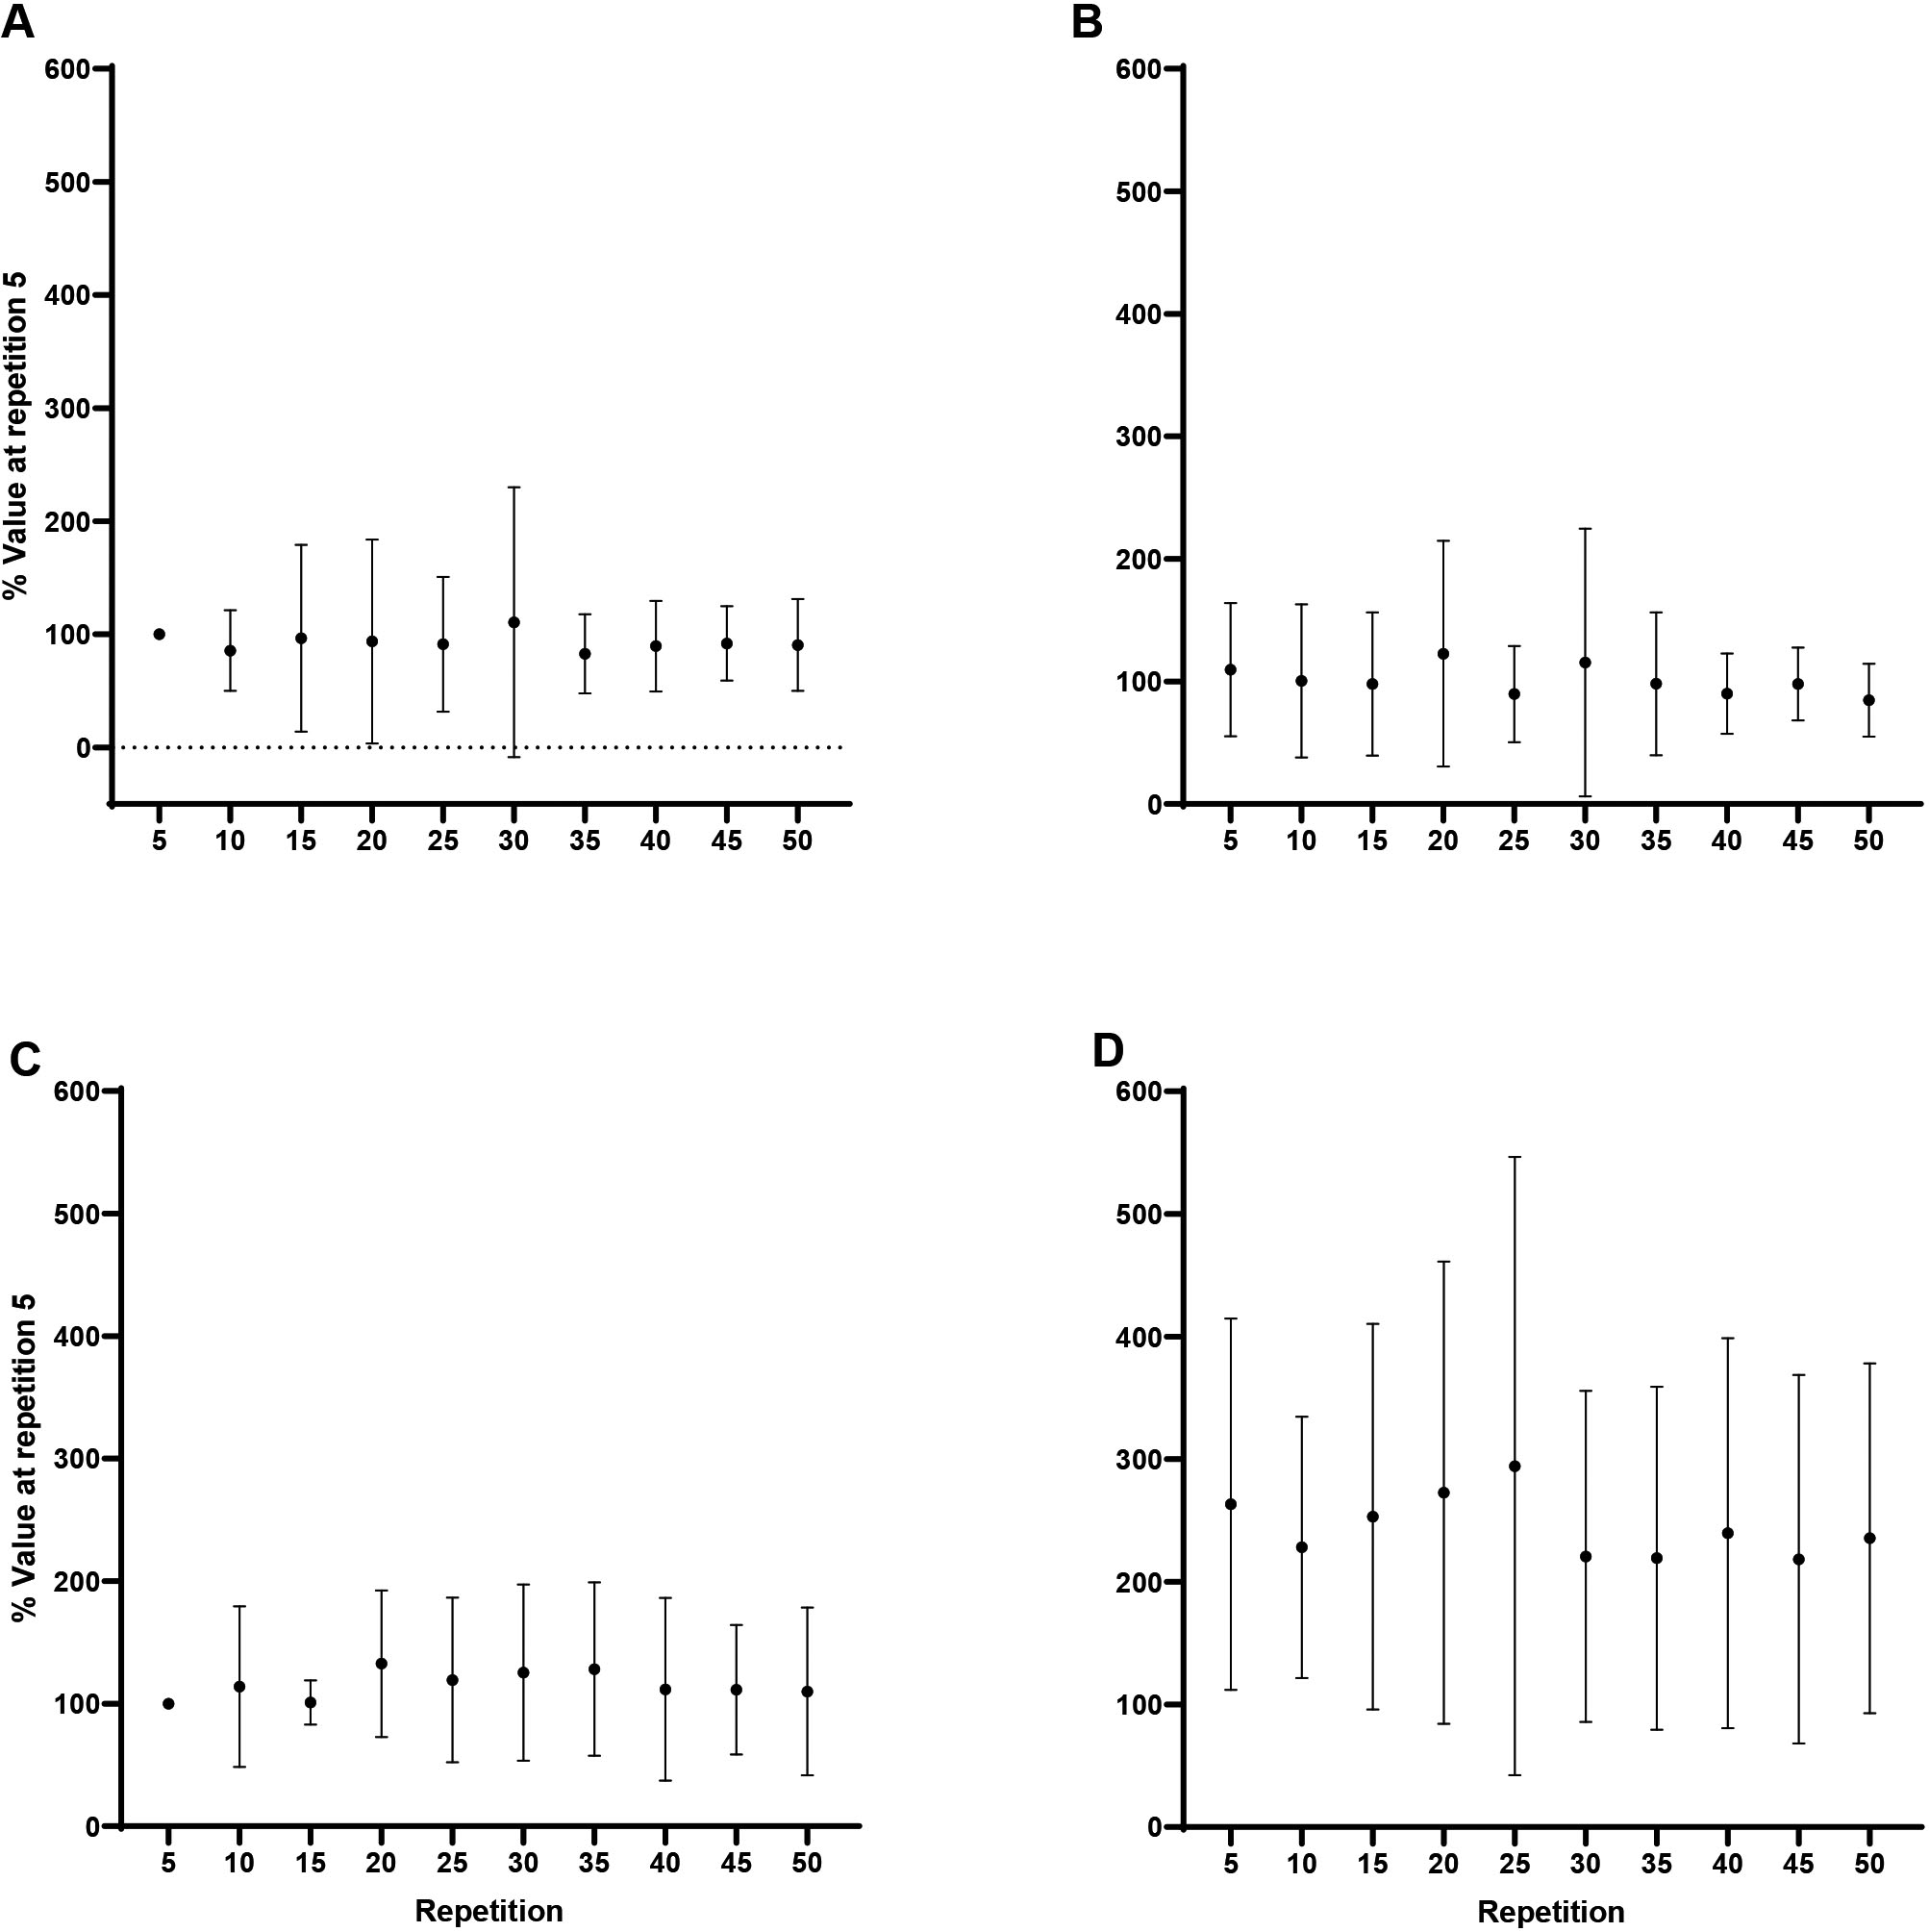
Forearm flexion EMG AMP: A) Biceps brachii at 60/s, B) Triceps brachii at 60/s, C) Biceps brachii at 180/s, D) Triceps brachii at 180/s. Note: C) Repetition 5 less than repetitions 20, 30, and 50 at 0.05.
Forearm extension EMG AMP: A) Triceps brachii at 60/s, B) Biceps brachii at 60/s, C) Triceps brachii at 180/s, D) Biceps brachii at 180/s. Note: C) Repetition 5 less than repetitions 25–50 at 0.05.
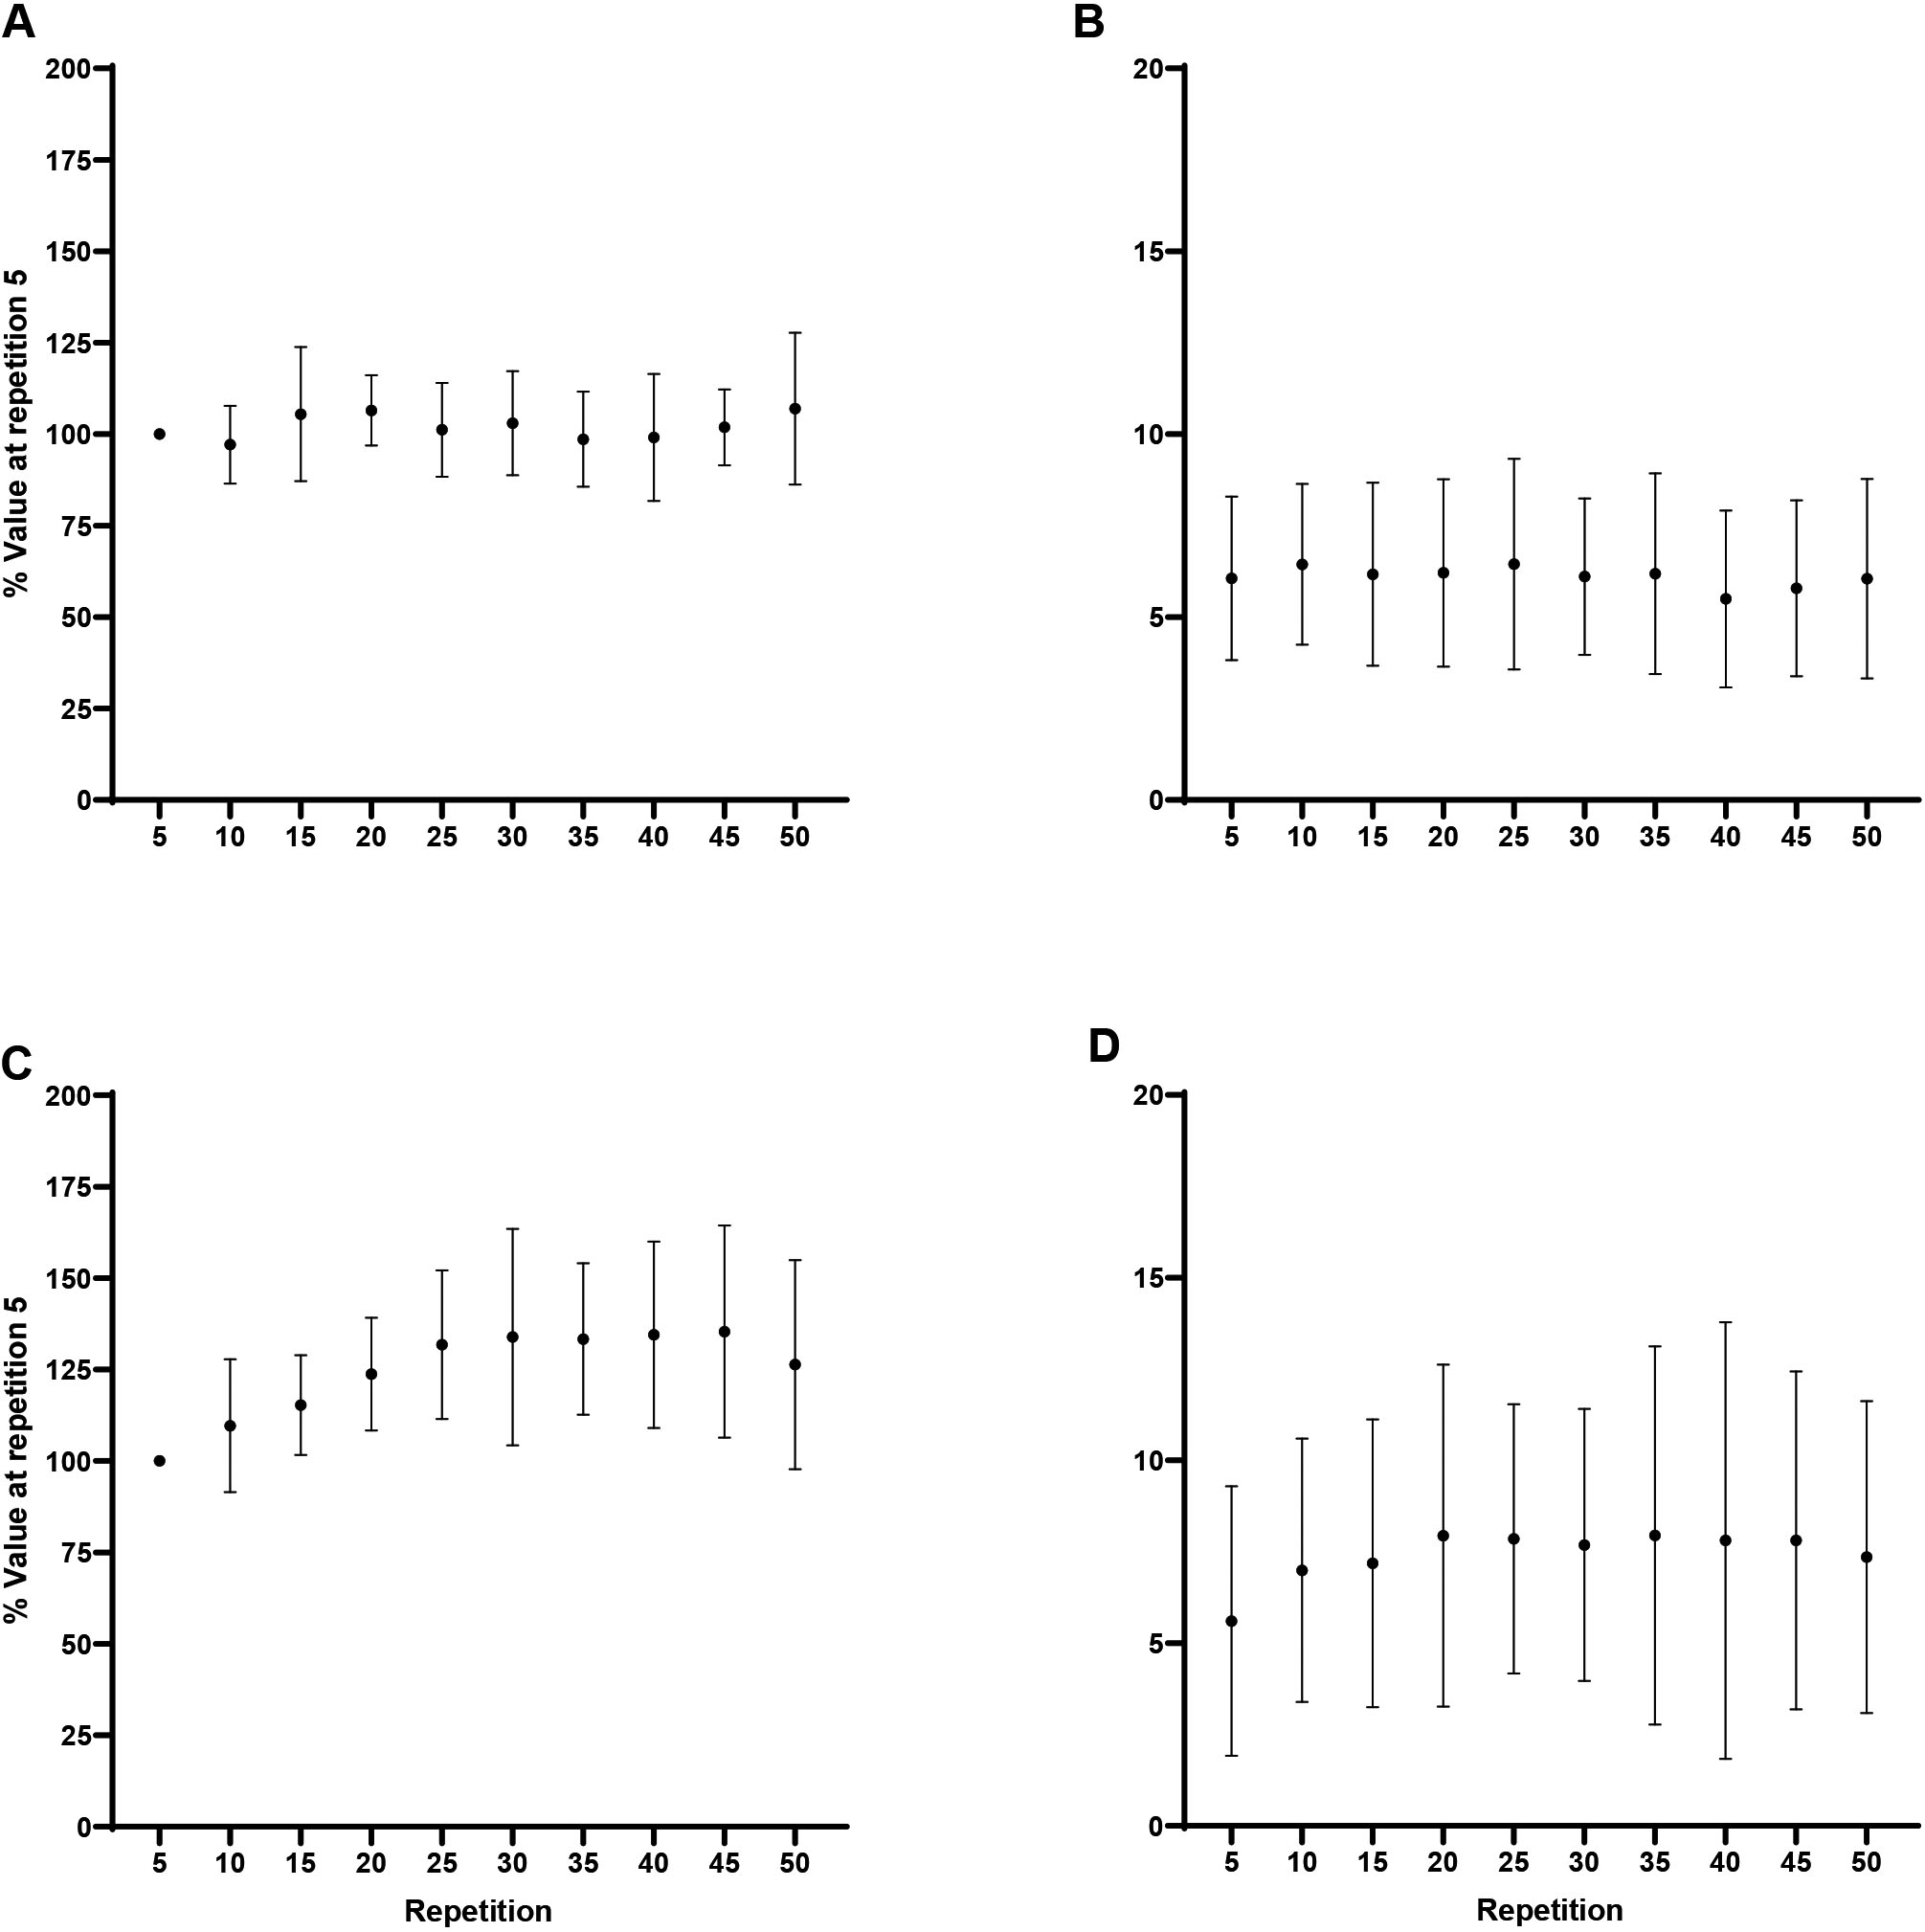
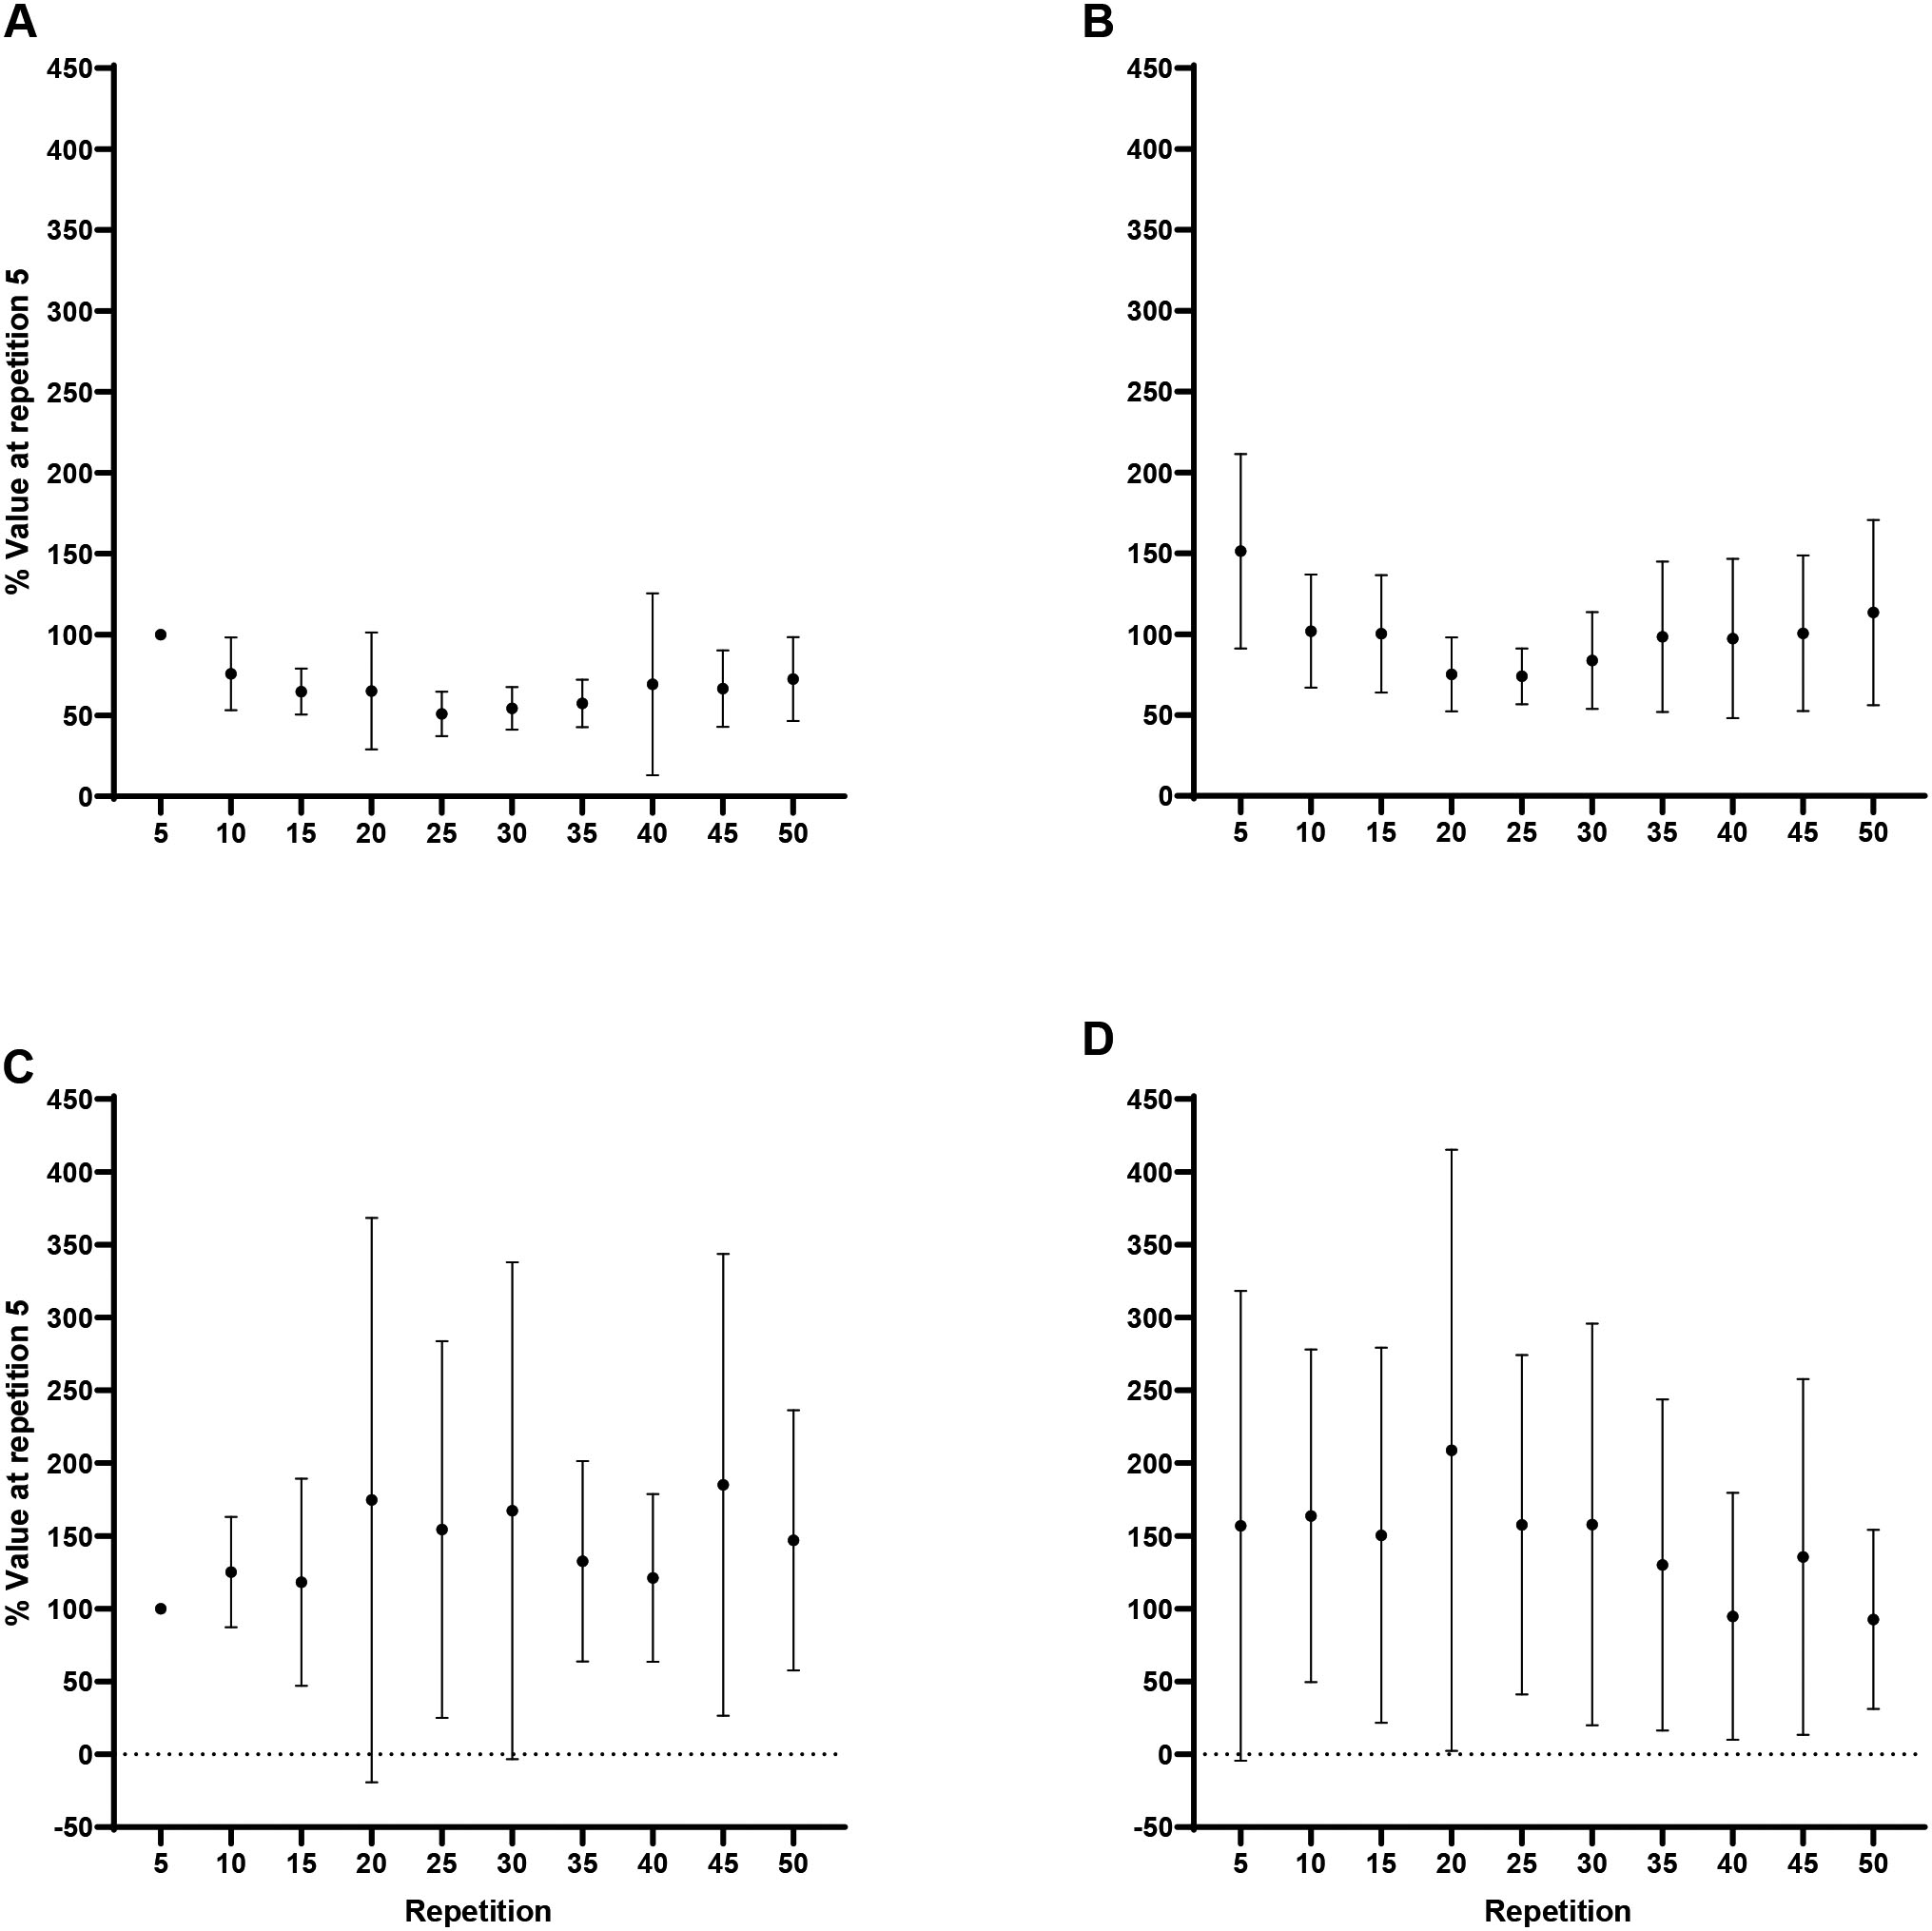
Forearm flexion EMG MPF: A) Biceps brachii at 60/s, B) Triceps brachii at 60/s, C) Biceps brachii at 180/s, D) Triceps brachii at 180/s. Note: A) and B) Repetition 5 greater than repetition 15–50, collapsed across muscle at 0.05. C) and D) Repetition 5 greater than repetition 20–50, collapsed across muscle at 0.05.
Forearm extension EMG MPF: A) Triceps brachii at 60/s, B) Biceps brachii at 60/s, C) Triceps brachii at 180/s, D) Biceps brachii at 180/s. Note: Repetition 5 greater than repetition 15–50, collapsed across muscle and velocity at 0.05.
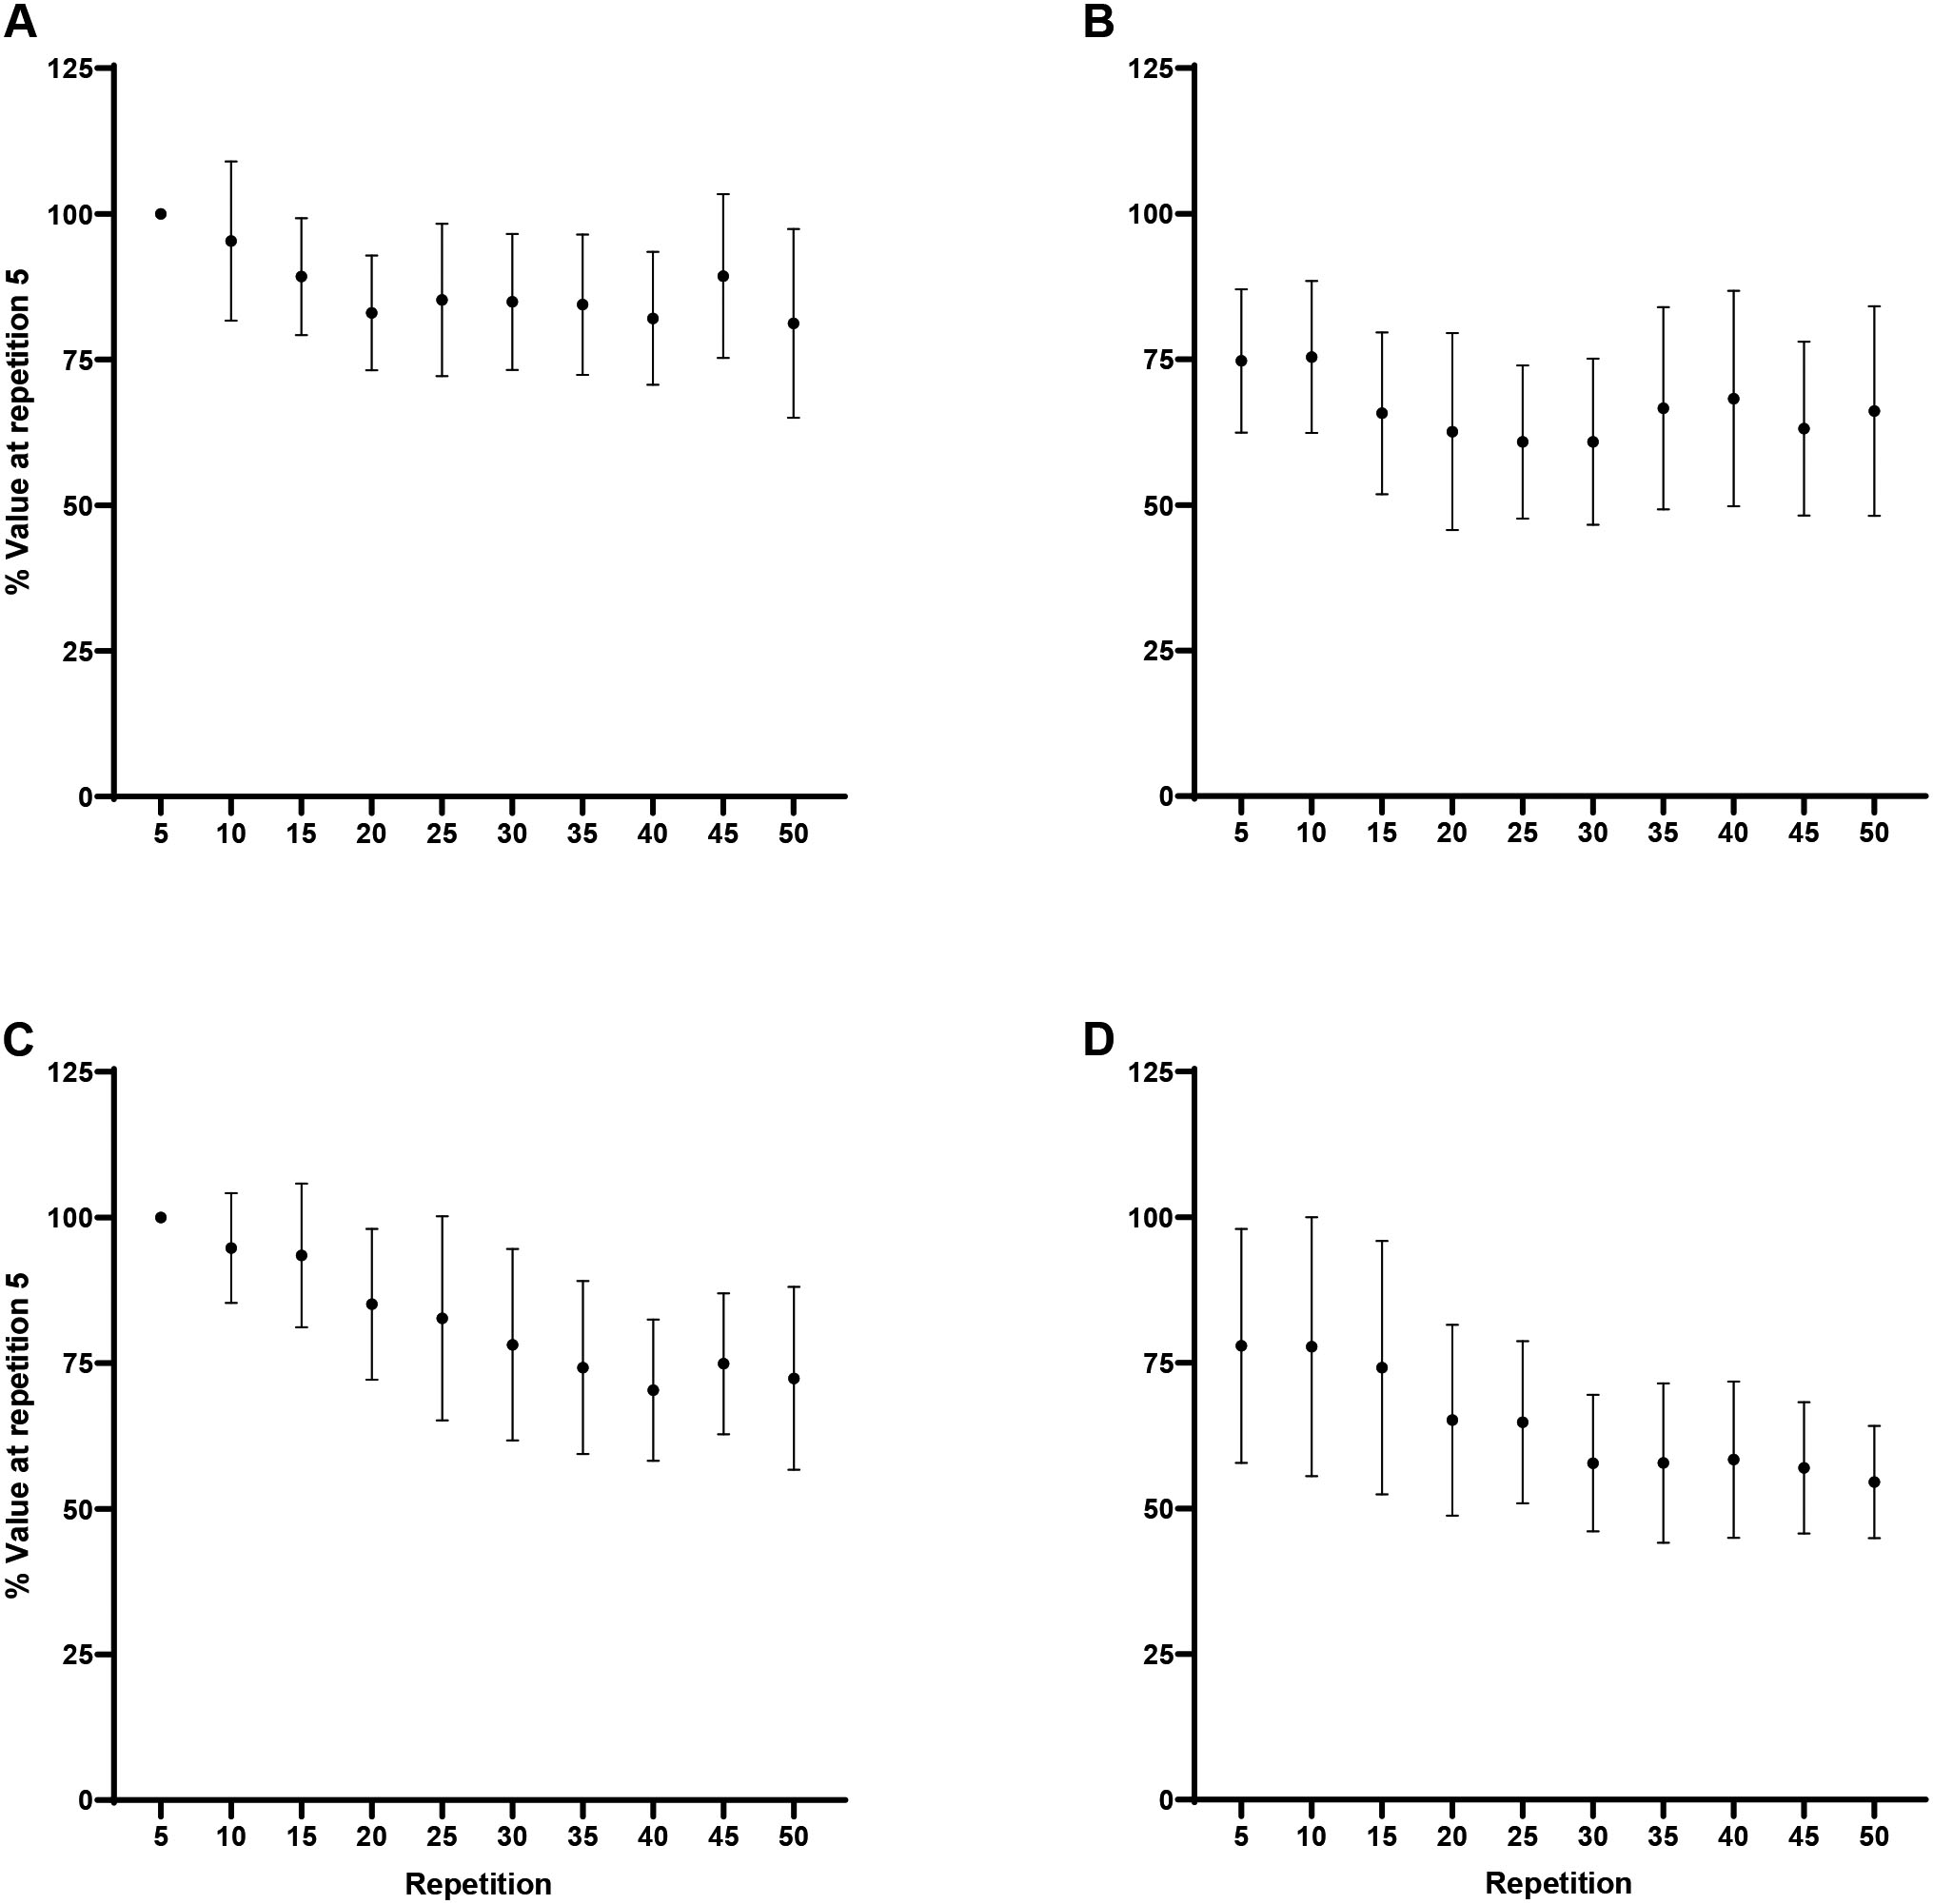
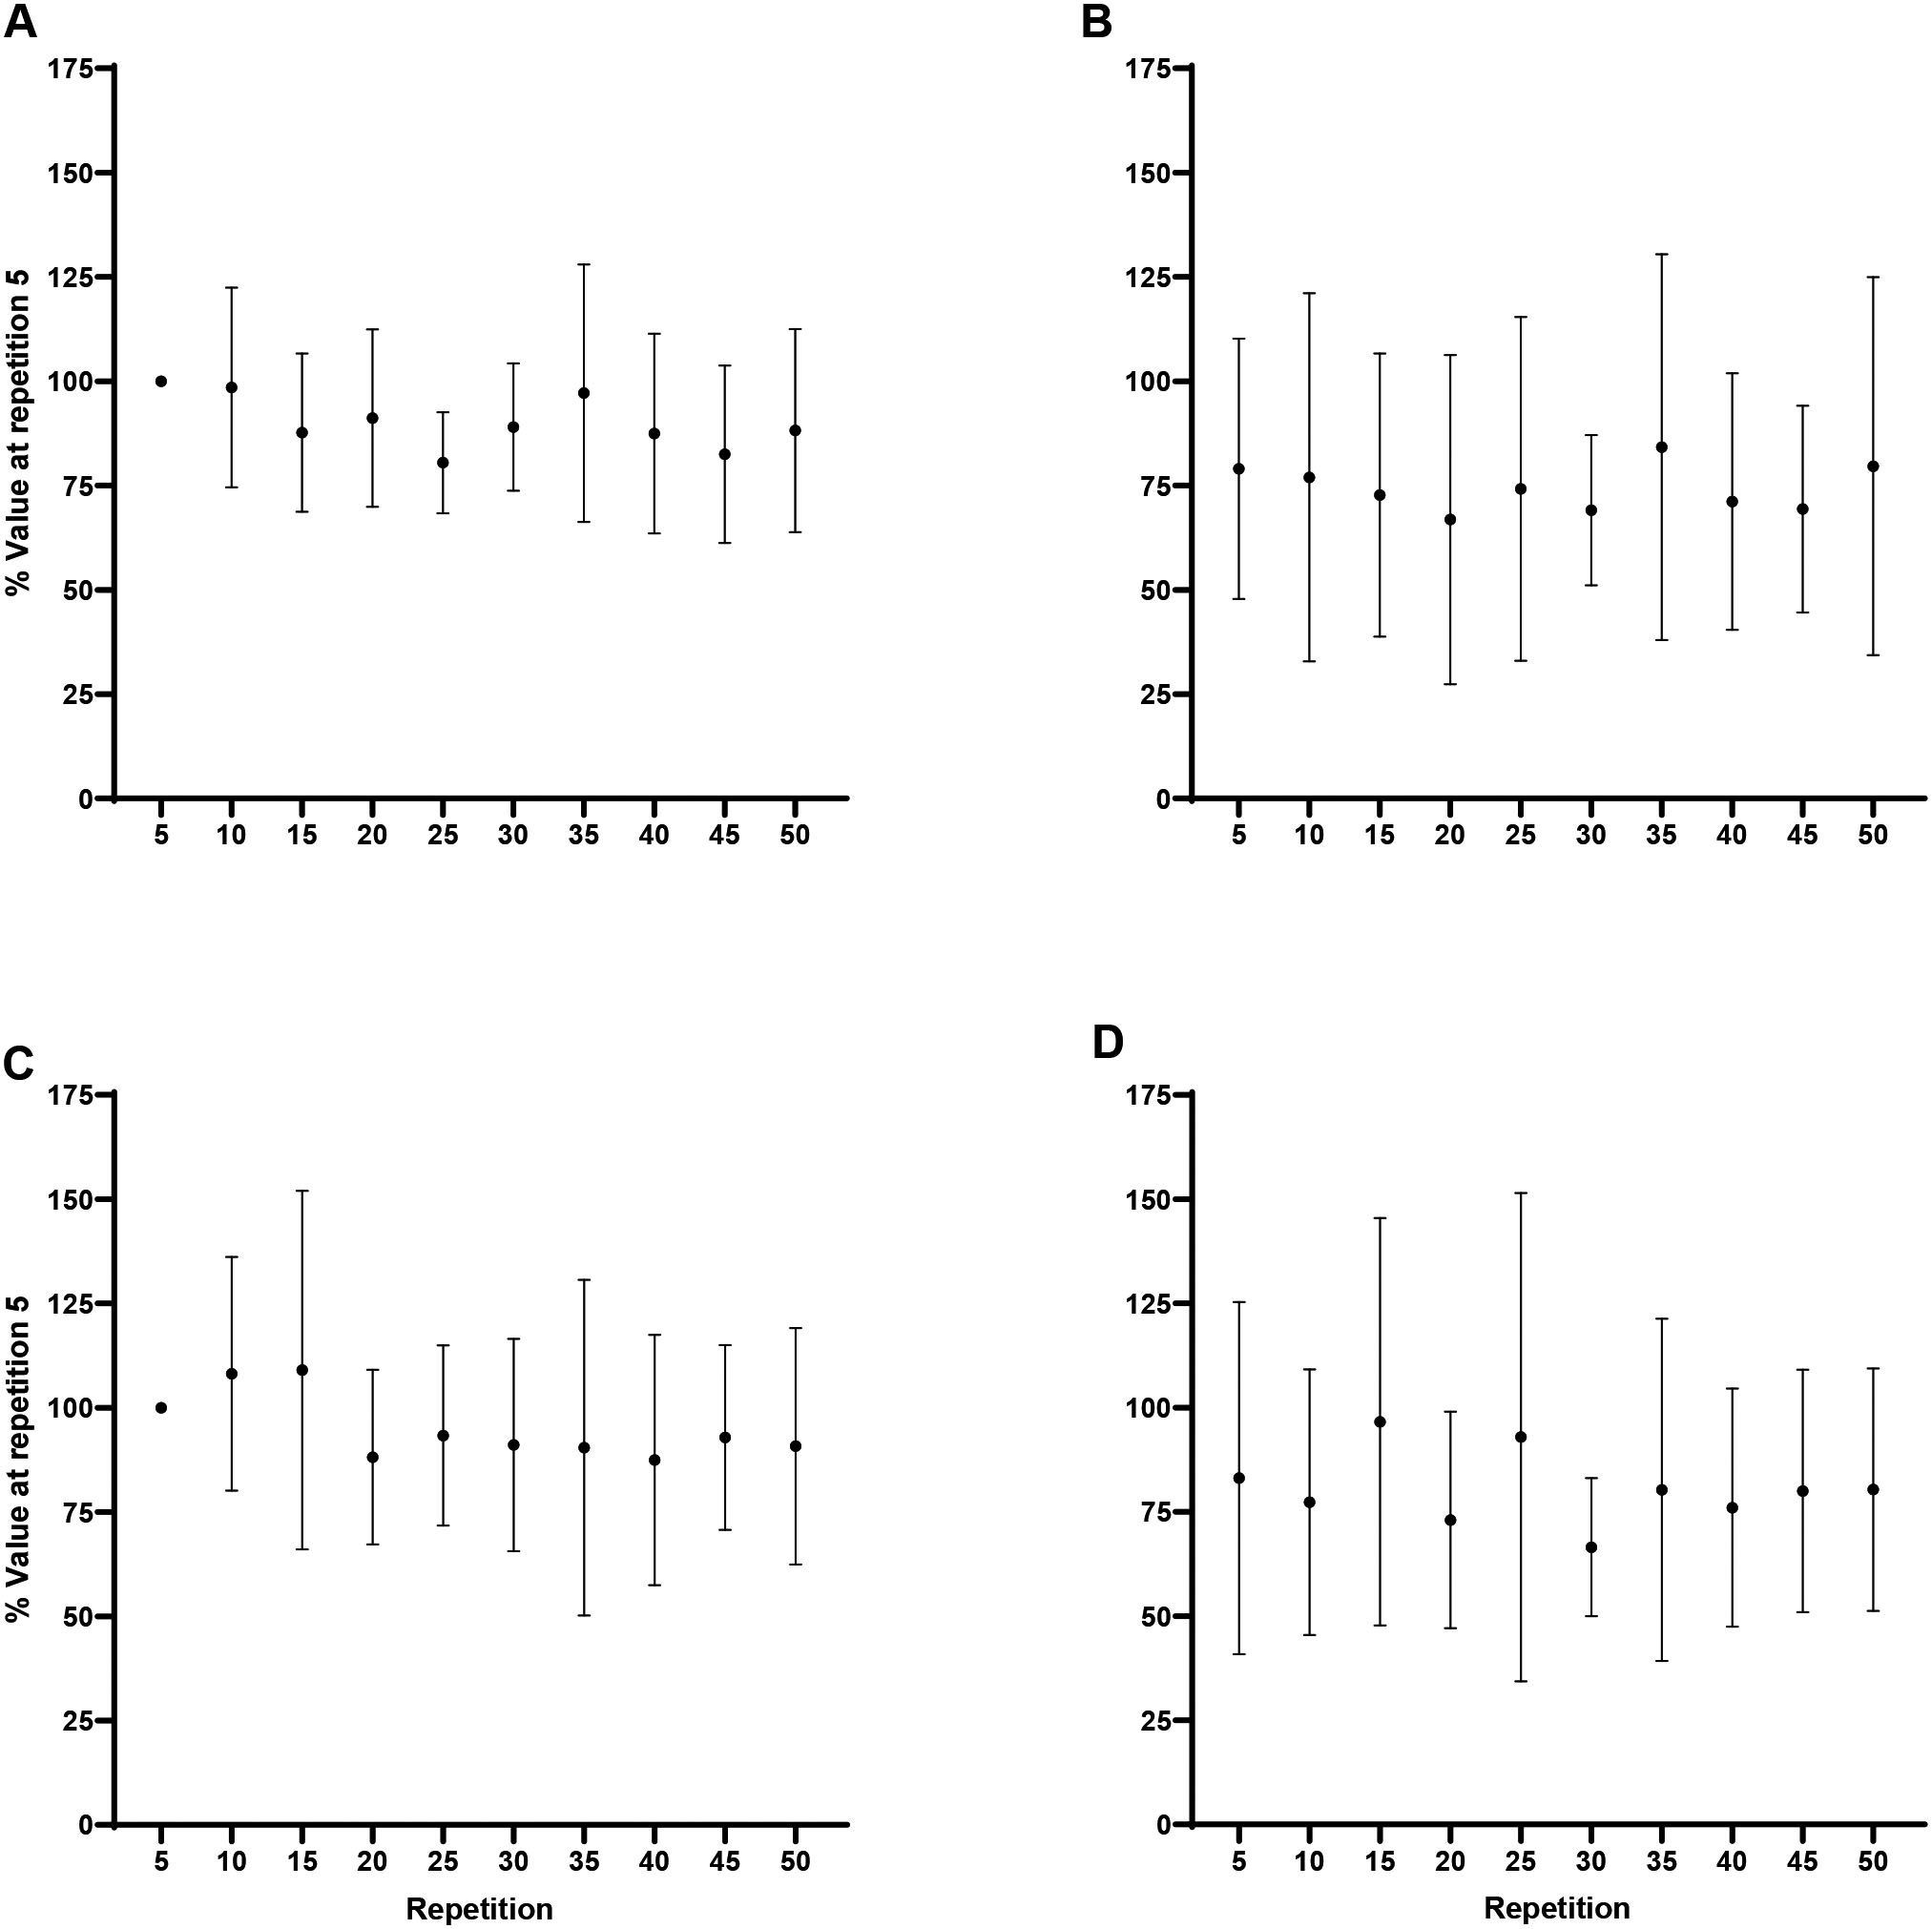
Forearm flexion MMG AMP: A) Biceps brachii at 60/s, B) Triceps brachii at 60/s, C) Biceps brachii at 180/s, D) Triceps brachii at 180/s. Note: MMG AMP at 180/s greater than 60/s, collapsed across repetition at 0.05.
Forearm extension MMG AMP: A) Triceps brachii at 60/s, B) Biceps brachii at 60/s, C) Triceps brachii at 180/s, D) Biceps brachii at 180/s. Note: MMG AMP at 180/s greater than 60/s, collapsed across muscle and repetition at 0.05.
Forearm flexion MMG MPF: A) Biceps brachii at 60/s, B) Triceps brachii at 60/s, C) Biceps brachii at 180/s, D) Triceps brachii at 180/s.
Forearm extension MMG MPF: A) Triceps brachii at 60/s, B) Biceps brachii at 60/s, C) Triceps brachii at 180/s, D) Biceps brachii at 180/s. Note: TB greater than BB, collapsed across velocity and repetition at 0.05.
Statistical analysis
To examine the time course of changes in the torque and neuromuscular responses across the fatiguing task, the values from every fifth repetition (i.e. 5, 10, 15, 20 …50) were normalized to the respective values from repetition 5. For normalized torque, a 2 (velocity: 60 and 180) 2 (movement: flexion and extension) 10 (repetition: 5, 10 …50) RM ANOVA was used to examine mean differences. Four, 2 (velocity: 60 and 180) 2 (muscle: BB and TB) 2 (movement: flexion and extension) 10 (repetition: 5, 10 …50) RM ANOVAs were used to analyze mean differences for normalized EMG AMP, EMG MPF, MMG AMP and MMG MPF. Follow-up RM ANOVAs were performed as necessary, and separate Tukey values were calculated for the significant ANOVAs. The time course of changes in the normalized torque and neuromuscular values were analyzed using Tukey post hoc comparisons to examine mean differences between repetition 5 and repetitions 10–50. One-way RM ANOVAs were performed to examine changes in the agonist: antagonist ratio across the fatiguing task for EMG AMP, EMG MPF, MMG AMP, and MMG MPF. To account for potential ceiling effects on EMG AMP ratios, the values were log transformed [31] and one-way RM ANOVAs were performed. Shapiro Wilk’s test for normality was conducted on EMG AMP data measures of effect size for ANOVAs and Tukey post hoc comparisons were assessed with partial eta squared () and Cohen’s , respectively. An alpha of 0.05 was considered statistically significant for all comparisons. The RM ANOVAs and Tukey post hoc comparisons were performed using IBM SPSS v. 27 (Armonk, NY, USA) and Microsoft Excel, respectively.
Results
Normalized peak torque
There were significant decreases across repetition for flexion at 60/s ( 0.001, 0.77) and 180/s ( 0.001, 0.89), and extension at 60/s ( 0.001, 0.80) and 180/s ( 0.001, 0.84; Fig. 1). For flexion at 60/s, Tukey post hoc comparisons indicated repetition 5 (100%) was significantly greater than repetitions 15 (79.8 9.2%; 0.001, 2.51), 20 (68.1 10.7%; 0.001, 3.95), 25 (65 9.6%; 0.001, 4.35), 30 (65.2 11.9%; 0.001, 4.32), 35 (62.2 8.9%; 0.001, 4.70), 40 (61.5 7.6%; 0.001, 4.78), 45 (59.6 8.9%; 0.001, 5.01), and 50 (62.3 15.4%; 0.001, 4.67). For flexion at 180/s, Tukey post hoc comparisons demonstrated repetition 5 (100%) was significantly greater than repetitions 20 (82 11.6%; 0.001, 2.52), 25 (73.8 7.5%; 0.001, 3.66), 30 (64 11.8%; 0.001, 5.04), 35 (60.1 6.1%; 0.001, 5.58), 40 (54.6 9.8%; 0.001, 6.35), 45 (51.2 6.1%; 0.001, 6.82), and 50 (47.8 9.6%; 0.001, 7.30). For extension at 60/s, Tukey post hoc comparisons indicated repetition 5 (100%) was significantly greater than repetitions 10 (86.1 6.9%; 0.006, 1.75), 15 (75.5 11.2%; 0.001, 3.08), 20 (67.6 12.5%; 0.001, 4.07), 25 (65.9 10.3%; 0.001, 4.29), 30 (62.3 12.5%; 0.001, 4.74), 35 (60.7 11.4%; 0.001, 4.93), 40 (51.6 11.7%; 0.001, 6.07), 45 (54.0 6.6%; 0.001, 5.78), and 50 (61.6 14.2%; 0.001, 4.82). For extension at 180/s Tukey post hoc comparisons demonstrated repetition 5 (100%) was significantly greater than repetitions 25 (87.4 13%; 0.001, 1.52), 30 (77.4 12.7%; 0.001, 2.73), 35 (70.4 11%; 0.001, 3.59), 40 (58.4 11.2%; 0.001, 5.03), 45 (63.2 16.5%; 0.001, 4.45), and 50 (52.2 9.2%; 0.001, 5.78). In addition, the analyses indicated greater fatigability, collapsed across movement, at 180/s compared to 60/s (50 7.1% vs 38 12.8%; 0.02, 1.16).
Normalized EMG AMP
During flexion at 60/s, EMG AMP for neither, the agonist BB ( 0.18, 0.16), or antagonist TB ( 0.16, 0.17), changed significantly across repetition. During flexion at 180/s, the agonist BB, had significantly less normalized EMG AMP at repetition 5 (100%) than repetitions 20 (125.2 19.7%; 0.01, 1.72), 30 (122.9 23.7%; 0.03, 1.56), and 50 (125.7 25.8%; 0.01, 1.75), however, there was no change in the antagonist TB ( 0.053, 0.24). During extension at 60/s, EMG AMP for neither the agonist TB, or antagonist BB, changed significantly across repetition. During extension at 180/s, the agonist TB, had significantly less normalized EMG AMP at repetition 5 (100%) than repetitions 25 (131.8 20.3%; 0.004, 1.81), 30 (133.9 29.6%; 0.001, 1.93), 35 (133.4 20.7%; 0.002, 1.90), 40 (134.5 25.5%; 0.001, 1.96), 45 (135.4 29%; 0.001, 2.01), and 50 (126.3 28.6%; 0.04, 1.50), however, there was no change in the antagonist BB ( 0.26, 0.14). The Shapiro-Wilk’s test for normality revealed some of the data at individual time points was non-normal. However, one-way RM ANOVAs for the normalized and log transformed ratios revealed no changes ( 0.05) in coactivation across the fatiguing task for flexion or extension at 60/s or 180/s.
Normalized EMG MPF
For flexion at 60/s, collapsed across muscle, repetition 5 (87.4 6.2%) was significantly greater than repetitions 15 (77.5 8.2%; 0.02, 1.61), 20 (72.8 10.2%; 0.001, 2.37), 25 (73 9.9%; 0.001, 2.33), 30 (72.9 6.9%; 0.001, 2.35), 35 (75.5 11.1%; 0.002, 1.92), 40 (75.2 9.5%; 0.001, 1.98), 45 (76.2 12.1%; 0.004, 1.81), and 50 (73.7 9.6%; 0.001, 2.23). For flexion at 180/s, collapsed across muscle, repetition 5 (89 10%) was significantly greater than repetitions 20 (75.1 12.9%; 0.01, 1.55), 25 (73.7 14.1%; 0.003, 1.76), 30 (68 12.2%; 0.001, 2.51), 35 (66 12.3%; 0.001, 2.60), 40 (64.4 12.1%; 0.001, 2.86), 45 (65.9 11.1%; 0.001, 2.70), and 50 (63.5 11.6%; 0.001, 2.98; Fig. 4). For extension, collapsed cross muscle and velocity, repetition 5 (110.8 7.2%) was significantly greater than repetitions 15 (98.3 13.3%; 0.001, 1.87), 20 (88.9 10.8%; 0.001, 3.2), 25 (85 12.8%; 0.001, 3.95), 30 (81.7 14.6%; 0.001, 4.18), 35 (80.5 13.1%; 0.001, 4.43), 40 (80.2 15.1%; 0.001, 4.59), 45 (79.5 14%; 0.001, 4.69), and 50 (81.8 13.8%; 0.001, 4.18; Fig. 5). One-way RM ANOVAs revealed no changes ( 0.05) in the EMG MPF ratio across the fatiguing task for flexion or extension at 60/s or 180/s.
Normalized MMG AMP
For flexion, collapsed across repetition, Tukey post hoc comparisons, indicated no significant differences ( 0.35, 0.50) between velocities for the BB, however, greater MMG AMP at 180/s than 60/s for the TB (244.5 124.7% vs 100.6 32.6%; 0.004, 1.68; Fig. 6). For extension, collapsed across muscle and repetition, MMG AMP was greater at 180/s than 60/s (143.7 76.2% vs 83.6 15.7%; 0.04, 1.04; Fig. 7). One-way RM ANOVAs revealed no changes ( 0.05) in the MMG AMP ratio across the fatiguing task for flexion or extension at 60/s or 180/s.
Normalized MMG MPF
For flexion, collapsed across velocity and repetition, there were no differences ( 0.15, 0.82) in MMG MPF between the agonist, BB, and antagonist, TB, however, significantly greater MMG MPF for the agonist, TB, than the antagonist, BB, during extension (88.6 15.9% vs 56 8.1%; 0.001, 2.32; Figs 8 and 9). One-way RM ANOVAs revealed no changes ( 0.05) in the MMG MPF ratio across the fatiguing task for flexion or extension at 60/s or 180/s.
Discussion
The main findings of the current study demonstrated that the patterns of neuromuscular responses were indicative of a common neural drive for agonist and antagonist muscles leading to no fatigue-induced changes in coactivation, regardless of the movement or velocity of the isokinetic muscle actions. For EMG AMP at 60/s, as well as EMG MPF, MMG AMP, and MMG MPF at 60/s and 180/s, there were parallel responses between the agonist and antagonist muscles that suggested no changes in muscle activation (EMG AMP), motor unit recruitment (MMG AMP), and motor unit firing rates (MMG MPF), respectively (Figs 2–9). Despite increases in EMG AMP of the agonist muscles during flexion (BB) and extension (TB) at 180/s, but no changes in the antagonist muscles, there were no significant changes in the ratio of coactivation across the fatiguing task. Thus, the increases in EMG AMP in the agonist muscles were not sufficient to alter the coactivation ratio. These results were similar to previous studies which demonstrated a common neural drive between agonist and antagonist muscles under isometric [18, 20] and isokinetic [7, 32] conditions. It has been suggested that common neural drive to agonist and antagonist muscle pairs occurs as an attempt to provide optimal moment production and joint stability [13]. Furthermore, activation of the antagonist muscle may help maintain “local equilibrium of the limb” [33] and enhance ligament function by providing the joint’s articular surface with greater pressure distribution and preventing relative bone displacement that could lead to musculoskeletal injuries [13]. Thus, antagonist activation may be a mechanism by which our body maintains segmental posture [33]. Our findings are highlighted by the novel use of a reciprocal forearm flexion and extension fatiguing task and although the BB and TB are innervated by the musculocutaneous and radial nerves, respectively, they may share a common neural drive because both bifurcate from the brachial plexus and have a common origin at the C6 spinal nerve [34]. De Luca and Mambrito (1987) hypothesized that common neural drive among motor neuron pools arise from “…centrally mediated, reciprocally organized flexion and extension channels …” (p. 541), where the flexor motor neuron pool stimulates flexion and inhibits extension, and vice versa for the extensor pool, with a coactivation command that stimulates both, the flexor and extensor pools. The authors [18] concluded that agonist and antagonist motor neuron pools are controlled as if they are one pool (coactivation) when performing the same task or during rapid force compensatory contractions, and that reciprocal activation of the antagonist muscles occurred when both conditions were present. Thus, perhaps the reciprocal movement of the fatiguing tasks in the present study resulted in coactivation and reciprocal activation commands from a common neural drive in an effort to provide greater elbow joint stability during both movements [13, 18, 19].
In the current study, there were fatigue-induced increases in agonist EMG AMP at 180/s during forearm flexion and extension, but no changes at 60/s. Previous studies of maximal, fatiguing, isokinetic muscle actions of the BB, have reported no changes [7] or decreases [35] in agonist activation at slow (60/s) velocities and no changes [32] or increases [6, 7] at moderate (180/s) velocities. In the current study, EMG AMP at 180/s increased during flexion and extension from the onset of exercise until approximately repetitions 15 and 20, respectively, before exhibiting a general plateau for the remainder of the fatiguing task (Figs 2 and 3). The increases in EMG AMP at 180/s, but not 60/s, were consistent with previous studies [6, 7] that have reported a delay in reaching peak activation at moderate velocities, possibly due to fatigue-induced activation of reserve motor units [36]. De Luca and Contessa (2015) suggested that up to 10% of motor units are held in reserve, designed to only be used during conditions of extreme stress or fatigue [36]. Furthermore, the authors [36] indicated that these increases in activation are due to unfused, later-recruited motor units, characterized by high amplitude twitches. Thus, the increases in EMG AMP at 180/s in the current study may have been due to greater overall and peripheral fatigue compared to the 60/s task, which resulted in the activation of motor units previously held in reserve [6, 36].
The fatiguing tasks in the current study resulted in parallel decreases in torque, with declines of approximately 38% for both flexion and extension at 60/s, and 52% and 48% for flexion and extension at 180/s, respectively (Fig. 1). Recently, we reported decreases of 32% and 38%, and 46% and 39%, for flexion and extension torque at 60/s and 180/s, respectively, in a study that utilized the same experimental design, but women subjects [7]. Previous studies have reported greater fatigability in men than women for isometric [22, 37] and isokinetic [21, 23, 38, 39] muscle actions. The slightly greater magnitude of fatigability in the current study, compared to Neltner et al., (2022), may have been due to sex differences in fatigue characteristics that allow women to complete more repetitions before a significant reduction in torque than men [40]. It has been suggested that sex differences in fatigability may be characterized by differences in neuromuscular responses between men and women [23, 26, 41]. Similar to the present study in men, Neltner et al., (2022) recently reported that women exhibited increases in EMG AMP at 180/s but decreases in MMG AMP and MPF in the agonist muscles over the course of a fatiguing task. Anders et al., (2020) also reported decreases in MMG MPF following 50 maximal, isokinetic leg extension muscle actions in women. Thus, the patterns of MMG MPF responses in the current and previous studies [4, 7]suggested that sex differences in fatigability may be characterized by more pronounced decreases in motor unit firing rates in women than men.
The current study demonstrated greater fatigability, as defined by the percent decline in torque across the 50 maximal repetitions, at 180/s than 60/s. While fatigability was greater at 180/s, a significant reduction in torque occurred slightly earlier at 60/s for both flexion (repetition 15 vs 20) and extension (repetition 20 vs 25). This, however, was likely due to the greater amount of absolute torque that can be produced at slower compared to faster velocities [42], which resulted in a more rapid reduction in torque. The patterns of neuromuscular responses have been used to describe the mechanisms underlying the reduction in torque from a fatiguing task. Typically, there are decreases in EMG MPF, and no changes or decreases in MMG AMP and MPF as a result of maximal, fatiguing, isokinetic muscle actions [5, 6, 43]. Decreases in EMG MPF reflect reductions in motor unit action potential conduction velocity, and have been attributed to a buildup of metabolic byproducts, decreases in intracellular pH, increases in intramuscular pressure and/or extracellular potassium [44, 45], which are indicative of peripheral fatigue [46]. It has also been suggested that MMG AMP reflects motor unit recruitment and/or muscle compliance, while MMG MPF qualitatively reflects the global firing rate of activated, unfused motor units [6, 47]. In the current study, there were parallel responses between the agonist and antagonist muscles during flexion and extension for both velocities that included decreases in EMG MPF, but no changes in MMG AMP or MMG MPF. These results indicated that the greater fatigability at 180/s, compared to 60/s, was not related to changes in motor unit action potential conduction velocity, motor unit compliance, and/or motor unit firing rates. Thus, differences in fatigability between velocities were likely due to the greater contribution of the fatigue resistant, slow-twitch muscle fibers at 6/s that were not able to contribute to torque production at 180/s [48].
Limitations of the current study included the reciprocal movement of the fatiguing task that did not allow for the determination of whether antagonist muscle fatigue was influenced by the agonist contraction. Furthermore, the equipment used in this study only allowed for the measurement of torque from the agonist muscle, but not the antagonist. Fatigability in the current study was assessed from decreases in isokinetic peak torque, a global measure of fatigue, however, it did not allow for the portioning of the contributions of central versus peripheral fatigue. Perhaps the interpolated twitch technique could be used to examine the effect of central fatigue on the timing of agonist and antagonist muscle activation and the relationship to stability. Although not directly within the scope of the current study, the simultaneous assessment of EMG and MMG signals may provide additional information regarding the characteristics of coactivation. For example, future studies should examine the latencies between the EMG and MMG signals for the agonist and antagonist muscles. It is also possible that fatigue-induced decreases in the efficacy of postural muscles can be examined by neuromuscular assessments of EMG and MMG parameters used in the present study.
Conclusion
In summary, the results of the current study suggested that there was a common neural drive to agonist and antagonist muscles during fatiguing muscle actions at slow and moderate velocities. There were parallel responses of EMG AMP, EMG MPF, MMG AMP, and MMG MPF during forearm flexion and extension muscle actions, which suggested common neural drive, regardless of the movement or neuromuscular parameter assessed. Thus, simultaneous examination of EMG and MMG in the agonist and antagonist muscles provided insight into the mechanism underlying common neural drive in response to reciprocal fatigue. In addition, the results of the current study suggested that there may be more pronounced changes in motor unit firing rates (MMG MPF) in women compared to men, that may contribute to sex differences in fatigability. While both velocities resulted in fatigue-induced declines in torque, there was a greater magnitude of torque decline at 180/s, but an earlier decline at 60/s, which was attributed to the contribution of slow-twitch muscle fibers at 60/s that could not contribute to torque production at 180/s, and the ability to produce a greater amount of absolute torque at slower velocities, respectively [42, 48].
Author contributions
CONCEPTION: Tyler J. Neltner, Terry J. Housh, Richard J. Schmidt and Glen O. Johnson.
PERFORMANCE OF WORK: Tyler J. Neltner, John Paul V. Anders, Robert W. Smith, Jocelyn E. Arnett and Joshua L. Keller.
INTERPRETATION OR ANALYSIS OF DATA: Tyler J. Neltner, John Paul V. Anders, Robert W. Smith, Jocelyn E. Arnett and Joshua L. Keller.
PREPARATION OF THE MANUSCRIPT: Tyler J. Neltner and Terry J. Housh.
REVISION FOR IMPORTANT INTELLECTUAL CONTENT: Tyler J. Neltner, John Paul V. Anders, Robert W. Smith, Jocelyn E. Arnett, Joshua L. Keller, Terry J. Housh, Richard J. Schmidt and Glen O. Johnson.
SUPERVISION: Tyler J. Neltner, Richard J. Schmidt and Glen O. Johnson.
Ethical considerations
All subjects were informed of the procedures and signed a written informed consent form prior to participation in the study. The study protocol was approved by the University of Nebraska – Lincoln Institutional Review Board (IRB #20200120007FB/2019).
Funding
The authors report no funding.
Footnotes
Acknowledgments
The authors have no acknowledgments.
Conflict of interest
Authors declare no conflict of interest.
References
1.
HureauTJRomerLMAmannM. The “sensory tolerance limit”: A hypothetical construct determining exercise performance? Eur J Sport Sci.2018; 18: 13–24. doi: 10.1080/17461391.2016.1252428.
2.
KellerJLHoushTJAndersJPVNeltnerTJSchmidtRJJohnsonGO. Similar performance fatigability and neuromuscular responses following sustained bilateral tasks above and below critical force. Eur J Appl Physiol. 2021. doi: 10.1007/s00421-020-04588-y.
3.
SmithRWNeltnerTJAndersJPVKellerJLHoushTJSchmidtRJ, et al. Fatigability, coactivation, and neuromuscular responses of the biceps brachii and triceps brachii following sustained, maximal, isometric forearm flexion to task failure. J Exerc Physiol Online.2021; 24: 55–74.
4.
AndersJPVKellerJLSmithCMHillECNeltnerTJHoushTJ, et al. Performance fatigability and neuromuscular responses for bilateral versus unilateral leg extensions in women. J Electromyogr Kinesiol.2020; 50: 1–6. doi: 10.1016/j.jelekin.2019.102367.
5.
AndersJPVKellerJLSmithCMHillECNeltnerTJHoushTJ, et al. Performance fatigability and neuromuscular responses for bilateral and unilateral leg extensions in men. J Musculoskelet Neuronal Interact.2020; 20: 325–31.
6.
BeckTWHoushTJJohnsonGOWeirJPCramerJTCoburnJW, et al. Mechanomyographic and electromyographic amplitude and frequency responses during fatiguing isokinetic muscle actions of the biceps brachii. Electromyogr Clin Neurophysiol.2004; 44: 431–41.
7.
NeltnerTJAndersJPVKellerJLSmithRWHoushTJSchmidtRJ, et al. Velocity-specific coactivation and neuromuscular responses to fatiguing, reciprocal, isokinetic, forearm flexion, and extension muscle actions. J Strength Cond Res.2022; 36: 649–60. doi: 10.1519/JSC.0000000000004190.
8.
DutraYMClausGMMaltaEDSBrisolaGMPEscoMRFerraresiC, et al. Acute photobiomodulation by LED does not alter muscle fatigue and cycling performance. Med Sci Sports Exerc.2020; 52: 2448–58. doi: 10.1249/MSS.0000000000002394.
9.
PethickJWinterSLBurnleyM. Physiological evidence that the critical torque is a phase transition, not a threshold. Med Sci Sports Exerc.2020; 52: 2390–401. doi: 10.1249/MSS.0000000000002389.
10.
EnokaRMDuchateauJ. Translating fatigue to human performance. Med Sci Sports Exerc.2016; 48: 2228–38. doi: 10.1249/MSS.0000000000000929.
11.
NeyroudDKayserBPlaceN. Are There Critical Fatigue Thresholds? Aggregated vs. Individual Data. Front Physiol. 2016; 7. doi: 10.3389/fphys.2016.00376.
12.
SmithCMHoushTJHillECKellerJLJohnsonGOSchmidtRJ. Time course of changes in neuromuscular parameters from the quadriceps during maximal isokinetic muscle actions. J Nat Sci.2017; 3: e426; 1–7.
13.
DuchateauJBaudryS. The neural control of coactivation during fatiguing contractions revisited | Elsevier Enhanced Reader. J Electromyogr Kinesiol.2014; 24: 780–8. doi: 10.1016/j.jelekin.2014.08.006.
14.
SmithCMHoushTJHillECKellerJLJohnsonGOSchmidtRJ. Co-activation, estimated anterior and posterior cruciate ligament forces, and motor unit activation strategies during the time course of fatigue. Sports.2018; 6: 1–13. doi: 10.3390/sports6040104.
15.
WeirJPKeefeDAEatonJFAugustineRTTobinDM. Effect of fatigue on hamstring coactivation during isokinetic knee extensions. Eur J Appl Physiol.1998; 78: 555–9. doi: 10.1007/s004210050460.
16.
KellisEKellisS. Effects of agonist and antagonist muscle fatigue on muscle coactivation around the knee in pubertal boys. J Electromyogr Kinesiol.2001; 11: 307–18. doi: 10.1016/S1050-6411(01)00014-1.
17.
KellisE. The effects of fatigue on the resultant joint moment, agonist and antagonist electromyographic activity at different angles during dynamic knee extension efforts. J Electromyogr Kinesiol.1999; 9: 191–9. doi: 10.1016/S1050-6411(98)00032-7.
18.
De LucaCDMambritoB. Voluntary control of motor units in human antagonist muscles: coactivation and reciprocal activation. J Neurophysiol. 1987. doi: 10.1152/JN.1987.58.3.525.
19.
PsekJACafarelliE. Behavior of coactive muscles during fatigue. J Appl Physiol.1993; 74: 170–5. doi: 10.1152/jappl.1993.74.1.170.
20.
ReeceTMHerdaTJ. An examination of a potential organized motor unit firing rate and recruitment scheme of an antagonist muscle during isometric contractions. J Neurophysiol.2021; 125: 2094–106. doi: 10.1152/jn.00034.2021.
21.
Hébert-LosierKHolmbergH-C. Dynamometric indicators of fatigue from repeated maximal concentric isokinetic plantar flexion contractions are independent of knee flexion angles and age but differ for males and females. J Strength Cond Res.2014; 28: 843–55. doi: 10.1519/JSC.0b013e3182a993a0.
22.
HunterSKCritchlowAEnokaRM. Influence of aging on sex differences in muscle fatigability. J Appl Physiol.2004; 97: 1723–32. doi: 10.1152/japplphysiol.00460.2004.
23.
SenefeldJPereiraHMElliottNYoonTHunterSK. Sex differences in mechanisms of recovery after isometric and dynamic fatiguing tasks. Med Sci Sports Exerc.2018; 50: 1070–83. doi: 10.1249/MSS.0000000000001537.
24.
HäkkinenK. Neuromuscular fatigue and recovery in male and female athletes during heavy resistance exercise. Int J Sports Med.1993; 14: 53–9. doi: 10.1055/s-2007-1021146.
25.
HunterSK. The relevance of sex differences in performance fatigability. Med Sci Sports Exerc.2016; 48: 2247–56. doi: 10.1249/MSS.0000000000000928.
26.
HunterSK. Sex differences in human fatigability: Mechanisms and insight to physiological responses. Acta Physiol.2014; 210: 768–89. doi: 10.1111/apha.12234.
27.
RiebeDEhrmanJLiguoriGMagalM. ACSM’s Guidelines for Exercise Testing and Prescription. 10th ed. Philadelphia: Wolters Kluwer; 2018.
28.
HermensHFreriksBDisselhorst-KlugCRauG. Development of recommendations for SEMG sensors and sensorplacement procedures. J Electromyogr Kinesiol.2000; 10: 361–74. doi: 10.1016/S1050-6411(00)00027-4.
29.
KholinneEZulkarnainRFSunYCLimSChunJ-MJeonI-H. The different role of each head of the triceps brachii muscle in elbow extension. Acta Orthop Traumatol Turc.2018; 52: 201–5. doi: 10.1016/j.aott.2018.02.005.
30.
BrownLEWhitehurstMGilbertRBuchalterDN. The effect of velocity and gender on load range during knee extension and flexion exercise on an isokinetic device. J Orthop Sports Phys Ther.1995; 21: 107–12. doi: 10.2519/jospt.1995.21.2.107.
31.
CatinoLMalloggiCScaranoSCerinaVRotaVTesioL. Quadriceps activation during maximal isometric and isokinetic contractions: The minimal real difference and its implications. Isokinet Exerc Sci.2021; 29: 277–89. doi: 10.3233/IES-203241.
32.
LinnamoVBottasRKomiPV. Force and EMG power spectrum during and after eccentric and concentric fatigue. J Electromyogr Kinesiol.2000; 10: 293–300. doi: 10.1016/S1050-6411(00)00021-3.
33.
CavallariPBolzoniFBruttiniCEspostiR. The organization and control of intra-limb anticipatory postural adjustments and their role in movement performance. Front Hum Neurosci.2016; 10: 525. doi: 10.3389/fnhum.2016.00525.
34.
BielA. Trail Guide To The Body. 4th ed. Books of Discovery; 2011.
35.
HassaniAPatikasDBassaEHatzikotoulasKKellisEKotzamanidisC. Agonist and antagonist muscle activation during maximal and submaximal isokinetic fatigue tests of the knee extensors. J Electromyogr Kinesiol.2006; 16: 661–8. doi: 10.1016/j.jelekin.2005.11.006.
36.
De LucaCJContessaP. Biomechanical benefits of the Onion-Skin motor unit control scheme. J Biomech.2015; 48: 195–203. doi: 10.1016/j.jbiomech.2014.12.003.
37.
HunterSKSchlettyJMSchlachterKMGriffithEEPolichnowskiAJNgAV. Active hyperemia and vascular conductance differ between men and women for an isometric fatiguing contraction. J Appl Physiol.2006; 101: 140–50. doi: 10.1152/japplphysiol.01567.2005.
38.
PinciveroDMCoelhoAJCampyRM. Gender differences in perceived exertion during fatiguing knee extensions. Med Sci Sports Exerc.2004; 36: 109–17. doi: 10.1249/01.MSS.0000106183.23941.54.
39.
SenefeldJYoonTBementMHHunterSK. Fatigue and recovery from dynamic contractions in men and women differ for arm and leg muscles. Muscle Nerve.2013; 48: 436–9. doi: 10.1002/mus.23836.
40.
HunterSK. Sex differences in fatigability of dynamic contractions. Exp Physiol.2016; 101: 250–5. doi: 10.1113/EP085370.
41.
KellerJLHoushTJHillECSmithCMSchmidtRJJohnsonGO. Are There Sex-Specific Neuromuscular or Force Responses to Fatiguing Isometric Muscle Actions Anchored to a High Perceptual Intensity? J Strength Cond Res. 2020. Publish Ahead of Print. doi: 10.1519/JSC.0000000000003394.
42.
HillAV. The maximum work and mechanical efficiency of human muscles, and their most economical speed. J Physiol.1922; 56: 19–41.
43.
CamicCLHoushTJZunigaJMRussell HendrixCBergstromHCTraylorDA, et al. Electromyographic and mechanomyographic responses across repeated maximal isometric and concentric muscle actions of the leg extensors. J Electromyogr Kinesiol.2013; 23: 342–8. doi: 10.1016/j.jelekin.2012.09.010.
44.
FortuneELoweryMM. The Effect of Extracellular Potassium Concentration on Muscle Fiber Conduction Velocity Examined Using Model Simulation. 2007 29th Annu. Int. Conf. IEEE Eng. Med. Biol. Soc., 2007, pp. 2726–9. doi: 10.1109/IEMBS.2007.4352892.
45.
NeltnerTJHoushTJSmithCMKellerJLHillECSchmidtRJ, et al. Similar Fatigue-Induced Changes in Neuromuscular Patterns of Responses for Contralateral Legs during Maximal Bilateral Leg Extensions. J Exerc Physiol. 2020; 23.
46.
SmithCMHoushTJJenkinsNDMHillECCochraneKCMiramontiAA, et al. Combining regression and mean comparisons to identify the time course of changes in neuromuscular responses during the process of fatigue. Physiol Meas.2016; 37: 1993–2002. doi: 10.1088/0967-3334/37/11/1993.
47.
OrizioCGobboMDiemontBEspositoFVeicsteinasA. The surface mechanomyogram as a tool to describe the influence of fatigue on biceps brachii motor unit activation strategy. Historical basis and novel evidence. Eur J Appl Physiol.2003; 90: 326–36. doi: 10.1007/s00421-003-0924-1.
48.
AlcazarJCsapoRAraIAlegreLM. On the shape of the force-velocity relationship in skeletal muscles: The linear, the hyperbolic, and the double-hyperbolic. Front Physiol.2019; 10: 769. doi: 10.3389/fphys.2019.00769.