This study examined the differences in physical and anthropometric traits between specific playing positions (i.e., forwards: front row, second row, back row; backs: half backs, centers, wings/fullbacks) in amateur rugby players and analyzed the magnitude of correlations among jump, sprint, and strength measures in forwards and backs.
METHOD:
Sixty-four male rugby players were assessed in anthropometrics, a variety of vertical jumps, 10- and 30-m sprint, and strength tests (i.e., squat and bench press).
RESULTS:
Front row forwards (F) demonstrated significantly higher body mass (BM) than second row (F) and back row (F) (107.4 12.8, 99.1 9.9 and 91.6 7.6 kg respectively; 0.001). F showed greater absolute strength in bench press and squat, although no differences were found in relative strength. Regarding the differences in jump performance, F and F showed significantly ( 0.05) and significant to non-significant ( 0.042–0.078, ES 0.90–1.55) higher jumps in all tasks compared to F. Moreover, F demonstrated lower sprint times and greater maximum sprinting speed (MSS) than F ( 0.01). For the backs, centers (B) were significantly heavier ( 0.05) and exhibited a non-significantly moderate larger sprint momentum ( 0.068, ES 0.75) compared to half backs (B). MSS values were small to moderately greater in favor of wings/fullbacks [B] ( 0.188–0.059, ES 0.50–0.71). Finally, statistically significant correlations were found between drop jump (flight time) and jump height across all jump tasks, sprint times and speed for both forwards ( 0.541 to 0.996, 0.001) and backs ( 0.422 to 0.995, 0.05).
CONCLUSIONS:
In conclusion, F demonstrated significant, small to very large differences, when compared to their specific peers, whereas the backs were more similar. Additionally, our results indicated moderate to strong associations between explosive tasks such as sprinting and jumping in both playing positions.
In elite rugby union, players perform a considerable amount of high-intensity activities (e.g., high-speed running, sprinting, collisions) interspersed by bouts of low-intensity efforts, which requires players to be well-conditioned with respect to endurance, speed, agility, strength, power, and game-specific skills [1, 2]. Considering playing position, players require certain physical attributes combined with specific technical and tactical skills to successfully execute their game demands [3, 4]. Playing positions can be categorized into two positional groups: forwards (props and hookers [Front row], locks [Second row], and flankers and no. 8 [Back row]); and backs (scrum half and fly-half [Half backs], centers, and wings and fullbacks) [5]. Positional differences in physical [6, 7] and anthropometric qualities [8, 9] have been generally explored by comparing backs and forwards. The latter have been shown to be heavier and taller [6, 10], and present significantly lower jump height [10, 11] and sprint speed than backs over 5- and 30-m [11] (thus suggesting that anthropometric, jump, and speed measures are discriminating factors between playing positions) [7]. Moreover, forwards have been shown to generate a greater sprint momentum [SM] (i.e., a product of body mass [BM] and sprint speed) [6, 12], a key aspect in rugby union [12] due to the collisional characteristic of this sport.
Regarding strength, published data indicate that forwards possess greater absolute values when compared to backs, which may be partially explained by their larger BM [13]. Strength expressed in both absolute and relative terms (normalized to BM) is essential to rugby union success [14], as the expression of maximum strength is critical for contact and confrontational situations (e.g., scrums, rucks, mauls) [13]. Specifically, props have shown to be the strongest athletes and the inside and outside backs the weakest [15]. The contrasting roles between forwards and backs suggest that certain physical capacities are required to perform game tasks safely and effectively [10]. Since distinct playing positions place different physical and technical demands [10, 16], it is likely that these specific in-match roles may be also characterized by different physical capabilities.
The importance of physical and anthropometric characteristics relies not only on the associations reported previously between BM, SM, and maximum sprint speed (MSS) [6, 12] but also on the large correlations reported between strength, jumping ability, and sprint performance in rugby players of similar playing positions [6, 11]. In fact, previous findings suggested that there are athletic and anthropometric differences between and within the forward and back units [8]. To our knowledge, only one study reported an association between vertical jump flight time and lower limb power performance (measured in the countermovement jump exercise, 0.87) [17], although this relationship was not tested against other explosive motor-tasks such as sprinting or squatting. For example, in professional rugby players, both relative strength (0.55) and relative power (0.82) were negatively correlated to 10-m sprint times, suggesting that strength, power, jump, and sprint abilities seem to be interrelated [18, 19]. However, correlations of these parameters within specific playing positions (e.g., forwards and backs) have not been previously analyzed. Since jump and squat measures are commonly used to monitor players’ performance and identify young talents [19], it is of relevance to explore the possible associations between certain jump measures (e.g., contact time, flight time, and jump height collected during a drop jump test) and strength and sprint performances.
Upon review of the literature, it is noticeable that recent rugby research has focused mainly on professional players. However, these elite athletes, are usually superior in many aspects when compared to non-elite players [4, 7, 20] and represent a small proportion of the playing population, with a much larger percentage being amateur athletes. As such, research on this competitive level is warranted. A deeper understanding of the particular characteristics of playing positions in amateur rugby players may assist coaches and sport scientists to design more tailored training programs and better select players for each specific positional role [21]. Therefore, the aim of this study was twofold: i) to examine the differences between physical and anthropometric aspects within some specific playing units (i.e., forwards: front row vs second vs back row; backs: half backs vs centers vs wings/fullbacks); and ii) to analyze the magnitude of the relationships between drop jump, sprint, and strength measures in amateur forwards and backs. It was hypothesized that within-position differences would be larger in forwards than backs [11], and that vertical jump performance would be strongly associated (irrespective of playing positions) with other speed-power tasks [10, 17](i.e., sprint and back squat).
Methods
Participants
Sixty-four amateur male rugby union players ( 64; age 24.2 3.1 years, anthropometric measures provided in Tables 1 and 2) with first-team and second-team playing experience volunteered to participate in
Mean ( SD) performance and differences in sprint, strength, and jump performance between forwards specific playing positions
Front row
Second row
Back row
-values (ES CI 90%)
FR vs SR
FR vs BR
SR vs BR
Height (m)
1.81
0.07
1.90
0.03
1.81
0.05
0.018
(0.79 0.52)
0.556
(0.26 0.81)
0.012
(1.01 0.61)
Body mass (kg)
107.4
12.8
99.1
9.9
91.6
7.6
0.001
(1.04 0.55)
0.001
(1.58 0.65)
0.130
(0.61 0.71)
1RM (kg)
153.6
12.1
144.0
18.1
129.5
12.3
0.175
(0.74 0.97)
0.004
(2.04 1.03)
0.147
(1.09 1.34)
SQ (kgkg)
6.72
0.45
6.65
0.63
6.28
0.41
0.434
(0.37 0.89)
0.210
(0.58 0.82)
0.296
(0.71 1.23)
MPV (ms)
1.03
0.07
1.04
0.05
1.07
0.04
0.792
(0.12 0.91)
0.292
(0.46 0.78)
0.153
(0.43 0.55)
MPV (ms)
0.86
0.05
0.88
0.05
0.83
0.07
0.091
(0.56 0.58)
0.347
(0.49 0.94)
0.250
(0.64 1.01)
MPV (ms)
0.66
0.04
0.64
0.03
0.64
0.04
0.422
(0.40 0.93)
0.164
(0.52 0.65)
0.913
(0.05 0.93)
1RM (kg)
127.8
11.0
112.7
21.1
112.4
17.8
0.035
(1.58 1.21)
0.030
(1.58 1.18)
0.926
(0.08 1.84)
BP (kgkg)
5.60
0.50
5.17
0.77
5.45
0.75
0.347
(0.66 1.28)
0.702
(0.17 0.89)
0.455
(0.64 1.56)
MPV (ms)
1.12
0.07
1.14
0.05
1.15
0.06
0.085
(0.51 0.50)
0.377
(0.46 0.91)
0.965
(0.02 0.75)
MPV (ms)
0.75
0.07
0.75
0.06
0.79
0.05
0.687
(0.18 0.84)
0.147
(0.65 0.78)
0.526
(0.29 0.86)
MPV (ms)
0.49
0.05
0.49
0.06
0.47
0.04
0.879
(0.09 1.24)
0.291
(0.45 0.76)
0.690
(0.20 0.95)
CMJ (cm)
31.98
3.31
34.18
3.27
36.73
3.68
0.058
(0.98 0.86)
0.001
(1.55 0.45)
0.212
(0.57 0.83)
SJ (cm)
28.79
3.23
31.06
2.45
33.45
3.39
0.078
(0.90 0.87)
0.001
(1.56 0.56)
0.238
(0.53 0.82)
ABK (cm)
36.40
4.22
39.55
3.83
41.88
3.29
0.062
(0.97 0.87)
0.001
(1.34 0.58)
0.207
(0.42 0.61)
DJ (cm)
35.92
3.87
41.66
5.50
41.97
5.81
0.042
(1.37 1.09)
0.023
(1.33 0.92)
0.956
(0.02 0.82)
DJ (ms)
0.36
0.08
0.35
0.07
0.34
0.10
0.889
(0.06 0.87)
0.777
(0.11 0.76)
0.756
(0.16 0.96)
DJ (s)
0.53
0.03
0.57
0.03
0.57
0.04
0.044
(1.35 1.09)
0.029
(1.27 0.94)
0.959
(0.02 0.82)
RSI
1.54
0.35
1.69
0.35
1.77
0.46
0.448
(0.38 0.93)
0.238
(0.41 0.62)
0.796
(0.13 0.97)
MSS (ms)
7.58
0.20
7.79
0.69
8.21
0.39
0.404
(0.84 1.89)
0.010
(2.71 1.41)
0.227
(1.77 2.72)
T (s)
1.75
0.04
1.73
0.05
1.67
0.03
0.439
(0.58 1.47)
0.002
(1.97 0.70)
0.061
(1.36 1.20)
T (s)
4.46
0.09
4.40
0.27
4.19
0.12
0.471
(0.89 2.41)
0.002
(2.84 1.02)
0.186
(1.92 2.65)
SM (kgms)
805.08
96.27
761.75
92.27
771.24
70.87
0.319
(0.67 1.27)
0.301
(0.56 1.01)
0.857
(0.11 1.29)
ES: g Hedge’s effect size, CI: confidence interval; SQ: relative strength between 1RM and body mass; 1RM: 1RM in squat exercise; SQ: relative strength between 1RM in BP and body mass; 1RM: 1RM in the bench press; MPV: mean propulsive velocity against low-loads; MPV: mean propulsive velocity against moderate-loads; MPV: mean propulsive velocity against high-loads; CMJ: countermovement jump; SJ: squat jump; ABK: abalakov; DJ: drop jump; DJ: DJ contact time; DJ: DJ flight time. RSI: reactive strength index; T: time in 10-m sprint; T: time in 30-m sprint; MSS: maximum sprint speed; SM: sprint momentum. Denotes unclear differences.
Mean ( SD) performance and differences in sprint, strength, and jump performance between backs specific playing positions
Half backs
Centers
Wings/full-backs
-values (ES CI 90%)
HB vs Cen
HB vs WFB
Cen vs WFB
Height (m)
1.75
0.04
1.77
0.03
1.75
0.04
0.318
(0.52 0.96)
0.897
(0.06 0.92)
0.012
(0.16 0.49)
Body mass (kg)
77.9
6.4
83.5
3.9
79.28
4.55
0.011
(0.84 0.51)
0.674
(0.12 0.53)
0.008
(0.63 0.35)
1RM (kg)
123.1
18.0
132.8
16.5
132.9
16.3
0.308
(0.48 0.86)
0.188
(0.58 0.78)
0.876
(0.08 1.01)
SQ (kgkg)
6.66
0.90
6.87
0.75
7.14
0.79
0.679
(0.19 0.86)
0.221
(0.56 0.81)
0.717
(0.17 0.95)
MPV (ms)
1.09
0.07
1.10
0.03
1.07
0.07
0.667
(0.17 0.77)
0.682
(0.20 0.94)
0.185
(0.45 0.62)
MPV (ms)
0.84
0.08
0.87
0.06
0.84
0.07
0.252
(0.48 0.77)
0.764
(0.14 0.92)
0.430
(0.24 0.59)
MPV (ms)
0.65
0.03
0.61
0.03
0.61
0.03
0.206
(0.51 0.73)
0.168
(0.69 0.88)
0.893
(0.04 0.62)
1RM (kg)
100.8
12.1
110.9
10.8
109.9
13.0
0.076
(0.65 0.63)
0.222
(0.57 0.92)
0.287
(0.38 0.65)
BP (kgkg)
5.44
0.54
5.71
0.44
5.86
0.60
0.265
(0.44 0.71)
0.232
(0.63 0.94)
0.561
(0.21 0.70)
MPV (ms)
1.13
0.06
1.15
0.05
1.17
0.08
0.505
(0.27 0.77)
0.426
(0.47 1.08)
0.939
(0.03 0.86)
MPV (ms)
0.80
0.07
0.80
0.08
0.76
0.11
0.765
(0.09 0.58)
0.765
(0.76 0.81)
0.186
(0.67 0.91)
MPV (ms)
0.51
0.06
0.46
0.03
0.49
0.04
0.186
(0.55 0.75)
0.497
(0.23 0.63)
0.293
(0.22 0.40)
CMJ (cm)
39.64
3.65
39.01
2.97
39.33
4.17
0.353
(0.31 0.62)
0.650
(0.22 0.90)
0.759
(0.11 0.68)
SJ (cm)
36.05
2.90
36.10
2.45
35.49
3.80
0.748
(0.11 0.66)
0.554
(0.34 1.07)
0.730
(0.16 0.87)
ABK (cm)
46.93
4.29
43.23
3.35
44.62
4.17
0.010
(0.98 0.56)
0.183
(0.67 0.90)
0.396
(0.37 0.82)
DJ (cm)
42.75
5.24
44.58
4.96
45.33
5.13
0.286
(0.42 0.72)
0.260
(0.54 0.87)
0.649
(0.15 0.74)
DJ (ms)
0.27
0.06
0.34
0.07
0.38
0.08
0.009
(1.12 0.63)
0.022
(1.58 1.08)
0.381
(0.59 1.25)
DJ (s)
0.58
0.03
0.59
0.03
0.60
0.03
0.283
(0.44 0.76)
0.269
(0.54 0.90)
0.723
(0.14 0.78)
RSI
2.21
0.40
1.77
0.32
1.63
0.41
0.007
(1.00 0.53)
0.046
(1.43 1.18)
0.432
(0.55 1.32)
MSS (ms)
8.56
0.32
8.35
0.20
8.63
0.39
0.188
(0.50 0.69)
0.715
(0.20 1.07)
0.059
(0.71 0.63)
T (s)
1.63
0.06
1.65
0.04
1.63
0.06
0.384
(0.28 0.61)
0.896
(0.06 0.93)
0.418
(0.34 0.80)
T (s)
4.06
0.15
4.13
0.08
4.04
0.12
0.277
(0.39 0.65)
0.831
(0.10 0.94)
0.153
(0.50 0.61)
SM (kgms)
650.54
53.84
703.88
40.18
687.80
44.31
0.068
(0.75 0.70)
0.240
(0.50 0.79)
0.262
(0.24 0.40)
ES: g Hedge’s effect size, CI: confidence interval; SQ: relative strength between 1RM and body mass; 1RM: 1RM in squat exercise; SQ: relative strength between 1RM in BP and body mass; 1RM: 1RM in the bench press; MPV: mean propulsive velocity against low-loads; MPV: mean propulsive velocity against moderate-loads; MPV: mean propulsive velocity against high-loads; CMJ: countermovement jump; SJ: squat jump; ABK: abalakov; DJ: drop jump; DJ: DJ contact time; DJ: DJ flight time. RSI: reactive strength index; T: time in 10-m sprint; T: time in 30-m sprint; MSS: maximum sprint speed; SM: sprint momentum. Denotes unclear differences.
this study (backs, 30; forwards, 34). Participants were initially classified into forwards and backs; subsequently, each unit was further subdivided into: backs, half backs (B, 11), centers (B, 9) and wings and full-backs (B, 10); and forwards, front row (F; 15), second row (F; 9) and back row (F 10). All participants had a minimum of ten years of experience as rugby players. They normally participated in 6 weekly training sessions (3 sessions of speed and resistance training, and 3 to 4 rugby sessions) and a weekly match. No physical limitations or musculoskeletal injuries that could affect testing were reported. The study was approved by the Institutional Research Ethics Committee of Universidad de Flores, on Nov 20, 2020 and conformed to the recommendations of the Declaration of Helsinki. After being informed of the purpose and experimental procedures, participants signed a written informed consent form.
Procedure
This cross-sectional comparative-correlational study was performed during the off-season over a 45-day period to allow assessing a large enough number of rugby players. Participants completed all physical tests during this period according to playing position, in consecutive weeks, as follows: front row, second row back row, half backs, centers and wings and full-backs (weeks 1 through 6, respectively). During the first testing session, each participant was tested for anthropometric characteristics (BM and height) and 30-m sprint performance. In the second session, a variety of jumping tasks were assessed (i.e., countermovement jump [CMJ], squat jump [SJ], Abalakov [ABK], drop jump [DJ]). Finally, in the third session, the one repetition maximum (1RM) in squat (1RM) and bench press (1RM) exercises were determined. Each session was performed on separated days over a 5-day period, with a 48-hour rest period, to avoid fatigue. Participants were also required not to perform intense exercise on the day before testing and consume their last meal at least 3 hours before the scheduled testing time. All sessions were fully supervised by a certified strength and conditioning specialist and performed at the same time of the day for each participant.
Testing procedures
Body mass (kg) and height (m) were determined using a scale (Seca 710, Seca Ltd., Hamburg, Germany) with players in a morning fasting state and wearing only underclothes. Before testing, all participants performed a standardized warm-up consisting of 5-min submaximal running followed by joint mobilization exercises and a specific warm-up for each assessment session.
Sprinting speed
Participants performed two 30-m sprints on a rugby pitch (natural turf), with 3-min of recovery between each trial. The warm-up protocol consisted of 5-min of low-intensity running, joint mobility, multidirectional displacements, and progressive 10 to 30-m sprints, with an overall duration of 20-min. The test started on a staggered position, just behind a line 0.5-m away from the first timing gate. Photoelectric cells (Chronojump, Boscosystem, Barcelona, Spain) were placed at 0, 10, 20, and 30-m. Participants were encouraged to run 30-m as fast as possible. For each attempt, the following split-times were recorded: 0–10 m (T), 10–20 m (T), 20–30 m (T) and 0–30 m (T). MSS was calculated by dividing the ratio of 10-m and the fastest 10-m split time (i.e. T or T), and SM was calculated by multiplying players BM by their respective MSS [22]. The best sprint according to the lowest T was recorded for further analysis. The intraclass correlation coefficients (ICC) and coefficients of variation (CV) for relative and absolute reliability were: T10 (ICC: 0.942 and CV: 1.88%), T30 (ICC: 0.991 and CV: 0.75%) and MSS (ICC: 0.976 and CV: 1.34%).
Jump tests
Jump tests were performed using a portable jump mat (Chronojump, Boscosystem, Barcelona, Spain) as previously described [17, 23]. Participants were instructed to keep their feet extended during the jump until landing. The specific warm-up protocol consisted of bodyweight lunges and squats, and finally three sets of two repetitions of each jump (CMJ, SJ, ABK, and DJ). Three repetitions of each jump were completed separated by 15 seconds of recovery. For the CMJ, players placed their hands on their hips and performed a countermovement to approximately 90 of knee flexion before immediately extending into a maximal vertical jump. The SJ was performed afterwards, following the exact same instruction with the exception that no countermovement was permitted. Abalakov was performed similarly to the CMJ but arm swing was allowed. For the DJ, participants stepped off a 30-cm box with their preferred jumping limb and dropped to the floor with both feet. They were instructed to jump as high as possible while minimizing contact time and allowed to swing their arms. A 2-min rest was set on each trial. Contact time from the DJ (DJ), flight time (DJ), and reactive strength index (RSI; flight time divided by contact time) were recorded and determined [24]. The following ICC and CV were obtained: CMJ (ICC: 0.984 and CV: 2.23%), SJ (ICC: 0.978 and CV: 2.66%), ABK (ICC: 0.983 and CV: 2.29%), DJ (ICC: 0.954 and CV: 4.25%), DJ (ICC: 0.927 and CV: 8.78%), DJ (ICC: 0.803 and CV: 5.57%).
Isoinertial squat loading test
The 1RM and 1RM were estimated using a linear position transducer (Chronojump, Boscosystem, Barcelona, Spain) for measuring movement velocity. The assessment began after a specific warm up protocol previously used [25]. Both exercises were assessed using a squat rack, a bench, and an Olympic barbell (Taurus, Argentina). The participants performed the full squat from an upright position, descending at a controlled velocity (0.50–0.70 m/s) until the thigh surpassed the horizontal plane with respect to the ground with the barbell resting freely on the upper part of the back. The participants were instructed to perform concentric actions at maximal velocity and were not allowed to jump or take the bar off of the shoulders. The initial load in the squat was set at 40 kg and gradually increased by 5–10 kg. Three repetitions were performed with each load with a 3-min rest interval between each set. The test was concluded when participants reached a mean propulsive velocity (MPV) close to 0.5 m/s and the 1RM value was estimated from the velocity attained with the heaviest load used, as previously described [25]. Bench press was performed starting from a complete extension of the elbows until the barbell touched the chest. To avoid bouncing, a pause of 1 second between the eccentric and concentric phase was interposed. The initial load of the test was set at 40 kg and gradually increased by 5–10 kg. Three repetitions were performed with each load with a 3-min rest interval between each set. When participants reached a MPV close to 0.3 m/s, the test concluded and the 1RM was estimated from the velocity attained with the heaviest load used during the test [26]. After estimating 1RM, the absolute loads used during the assessment were converted to % RM and grouped according to the following ranges: MPVs with low 30 to 50% RM – (MPV), moderate 50 to 70% RM – (MPV) and high loads 70 to 90% RM – (MPV). The mean of the MPV of each % are the reported variables and were recorded for further analysis. Once the 1RM values were obtained in each exercise, relative strength values were reported as the ratio between absolute 1RM and BM (SQ and BP) using a recommended allometric scaling for the aforementioned types of tests [27].
Statistical analysis
Data are presented as means and standard deviation (SD). The distribution of each variable was verified by the Shapiro-Wilk normality test. Test-retest reliability was measured by the coefficient of variation (CV) and Intraclass correlation coefficient (ICC) with 95% confidence interval (CI). A one-way ANOVA repeated measures was used to search for differences between playing positions. In addition, Cohen’s effect size (ES, 90% CI) was calculated. Threshold values for Cohen’s ES statistics were: 0.2 small, 0.6 moderate, 1.2 large, 2.0 very large, and 4.0 nearly perfect [28]. Cohen’s ES were corrected to Hedge’s which was reported to be preferable and more unbiased when samples were small (i.e. 20) [29]. Relationships between variables were determined using Pearson’s correlations () or Spearman for the case of non-normality. This analysis was calculated for forwards and backs separately. The values were interpreted as weak ( 0.39), moderate ( 0.40–0.69), or strong ( 0.70) [30]. Statistical significance was established at 0.05 [29, 31].
Results
Comparisons within the forwards specific playing positions are reported in Table 1. Front row forwards demonstrated significantly higher BM than F and F ( 0.001). Second row were taller than F and F ( 0.05), whereas no differences were observed between F and F.
With regards to lower-body strength, F displayed significantly higher 1RM than F, although no differences were found in SQ. No differences were observed for MPV across all loads in any of the forwards positions. Conversely, in upper-body strength, F showed significantly larger values in 1RM than F and F ( 0.05), with no differences observed in BP and MPV across all loads.
Regarding jumping ability, F and F showed a clear trend ( 0.042–0.078) towards higher jumps in all tasks and DJ compared to F. Moreover, F demonstrated faster sprint times and greater MSS than F ( 0.01), and non-significant lower T sprint times ( 0.061, ES 1.36) than F. No significant differences were observed for the rest of the variables reported herein.
Associations between performance measures in jumping ability, strength and sprint performance in forwards positions
MPV
MPV
MPV
CMJ
SJ
ABK
DJ
DJ
DJ
MSS
T
MPV
0.341
(0.002; 0.613)
MPV
0.141
0.284
(0.213; 0.462)
(0.066; 0.571)
CMJ
0.425
0.050
0.236
(0.095; 0.670)
(0.387; 0.298)
(0.116; 0.536)
SJ
0.450
0.101
0.197
0.884
(0.126; 0.687)
(0.429; 0.251)
(0.157; 0.506)
(0.779; 0.941)
ABK
0.472
0.039
0.182
0.895
0.804
(0.154; 0.702)
(0.308; 0.377)
(0.172; 0.494)
(0.798; 0.947)
(0.640; 0.898)
DJ
0.437
0.132
0.324
0.802
0.752
0.862
(0.110; 0.679)
(0.221; 0.455)
(0.022; 0.600)
(0.637; 0.897)
(0.556; 0.869)
(0.739; 0.929)
DJ
0.067
0.473
0.170
0.127
0.145
0.152
0.042
(0.397; 0.287)
(0.154; 0.702)
(0.184; 0.485)
(0.447; 0.220)
(0.461; 0.203)
(0.466; 0.196)
(0.375; 0.300)
DJ
0.453
0.148
0.312
0.797
0.756
0.868
0.996
0.062
(0.130; 0.689)
(0.206; 0.467)
(0.035; 0.592)
(0.629; 0.894)
(0.561; 0.871)
(0.750; 0.932)
(0.992; 0.998)
(0.393; 0.281)
MSS
0.092
0.171
0.100
0.572
0.521
0.694
0.729
0.196
0.728
(0.378; 0.525)
(0.307; 0.580)
(0.371; 0.530)
(0.173; 0.809)
(0.102; 0.783)
(0.363; 0.869)
(0.423; 0.886)
(0.270; 0.588)
(0.421; 0.885)
T
0.113
0.085
0.046
0.560
0.540
0.564
0.540
0.207
0.541
0.804
(0.539; 0.360)
(0.384; 0.519)
(0.417; 0.490)
(0.804; 0.156)
(0.793; 0.129)
(0.805; 0.162)
(0.793; 0.129)
(0.595; 0.259)
(0.794; 0.130)
(0.919; 0.560)
T
0.080
0.008
0.038
0.641
0.598
0.693
0.693
0.158
0.696
0.945
0.932
(0.516; 0.388)
(0.460; 0.448)
(0.484; 0.423)
(0.844; 0.277)
(0.823; 0.212)
(0.869; 0.362)
(0.869; 0.361)
(0.561; 0.306)
(0.870; 0.366)
(0.978; 0.864)
(0.832; 0.973)
Correlation is significant at the 0.05 level. Correlation is significant at the 0.01 level. The respective confidence intervals are presented in brackets. MPV: mean propulsive velocity against low-loads; MPV: mean propulsive velocity against moderate-loads; MPV: mean propulsive velocity against high-loads; CMJ: countermovement jump; SJ: squat jump; ABK: abalakov; DJ: drop jump; DJ: DJ contact time; DJ: DJ flight time; T: time in 10-m sprint; T: time in 30-m sprint; MSS: maximum sprint speed.
Associations between performance measures in jumping ability, strength and sprint performance in backs positions
MPV
MPV
MPV
CMJ
SJ
ABK
DJ
DJ
DJ
MSS
T
MPV
0.545
(0.215; 0.762)
MPV
0.336
0.601
(0.050; 0.634)
(0.286; 0.798)
CMJ
0.190
0.417
0.347
(0.197; 0.525)
(0.051; 0.683)
(0.038; 0.642)
SJ
0.314
0.543
0.448
0.790
(0.067; 0.614)
(0.212; 0.761)
(0.081; 0.707)
(0.601; 0.895)
ABK
0.335
0.149
0.413
0.705
0.702
(0.051; 0.634)
(0.245; 0.500)
(0.030; 0.689)
(0.450; 0.853)
(0.446; 0.852)
DJ
0.268
0.162
0.142
0.583
0.513
0.471
(0.126; 0.587)
(0.231; 0.510)
(0.260; 0.501)
(0.268; 0.785)
(0.172; 0.743)
(0.119; 0.718)
DJ
0.196
0.123
0.366
0.241
0.182
0.224
0.209
(0.536; 0.197)
(0.479; 0.270)
(0.659; 0.025)
(0.563; 0.145)
(0.519; 0.204)
(0.551; 0.162)
(0.177; 0.540)
DJ
0.263
0.169
0.134
0.566
0.505
0.469
0.995
0.212
(0.130; 0.584)
(0.225; 0.515)
(0.267; 0.495)
(0.245; 0.776)
(0.163; 0.739)
(0.116; 0.717)
(0.989; 0.997)
(0.175; 0.542)
MSS
0.304
0.135
0.241
0.461
0.412
0.469
0.551
0.052
0.535
(0.123; 0.6369
(0.293; 0.518)
(0.201; 0.601)
(0.081; 0.724)
(0.019; 0.6949
(0.070; 0.738)
(0.179; 0.784)
(0.367; 0.454)
(0.157; 0.776)
T
0.497
0.188
0.251
0.347
0.170
0.309
0.353
0.012
0.331
0.788
(0.754; 0.107)
(0.557; 0.242)
(0.608; 0.191)
(0.651; 0.057)
(0.529; 0.240)
(0.639; 0.117)
(0.668; 0.068)
(0.403; 0.421)
(0.654; 0.092)
(0.902; 0.570)
T
0.471
0.104
0.188
0.339
0.236
0.356
0.438
0.032
0.422
0.905
0.932
(0.739; 0.072)
(0.494; 0.322)
(0.565; 0.253)
(0.647; 0.064)
(0.577; 0.175)
(0.670; 0.065)
(0.720; 0.031)
(0.438; 0.385)
(0.709; 0.010)
(0.957; 0.793)
(0.850; 0.970)
Correlation is significant at the 0.05 level. Correlation is significant at the 0.01 level. The respective confidence intervals are presented in brackets. MPV: mean propulsive velocity against low-loads; MPV: mean propulsive velocity against moderate-loads; MPV: mean propulsive velocity against high-loads; CMJ: countermovement jump; SJ: squat jump; ABK: abalakov; DJ: drop jump; DJ: DJ contact time; DJ: DJ flight time; T: time in 10-m sprint; T: time in 30-m sprint; MSS: maximum sprint speed.
Comparisons within the backs specific playing positions are reported in Table 2. B were significantly heavier ( 0.05) than B and B, with no clear differences reported with regards to height. Concerning upper-body strength, B displayed a trend ( 0.075, ES 0.65) towards a higher 1RM than B. The B displayed greater ABK performance ( 0.01) than B, in addition to a shorter DJ and a larger RSI ( 0.01) when compared to the rest of positions. Regarding SM, B demonstrated moderate differences (ES 0.75; 0.068) compared to B. Small to moderate non-significant differences were found for MSS values in favor of B ( 0.188–0.059, ES 0.50–0.71). No differences were observed for the rest of the variables analyzed.
Table 3 depicts the correlation coefficients concerning data from the forwards. The MPV displayed moderate associations with jump height in all tasks and DJ ( 0.42, 0.05), whilst MPV showed positive and moderate correlations with DJ ( 0.05). Moreover, moderate to strong associations were observed between DJ, DJ, T, T and MSS (0.54, 0.05).
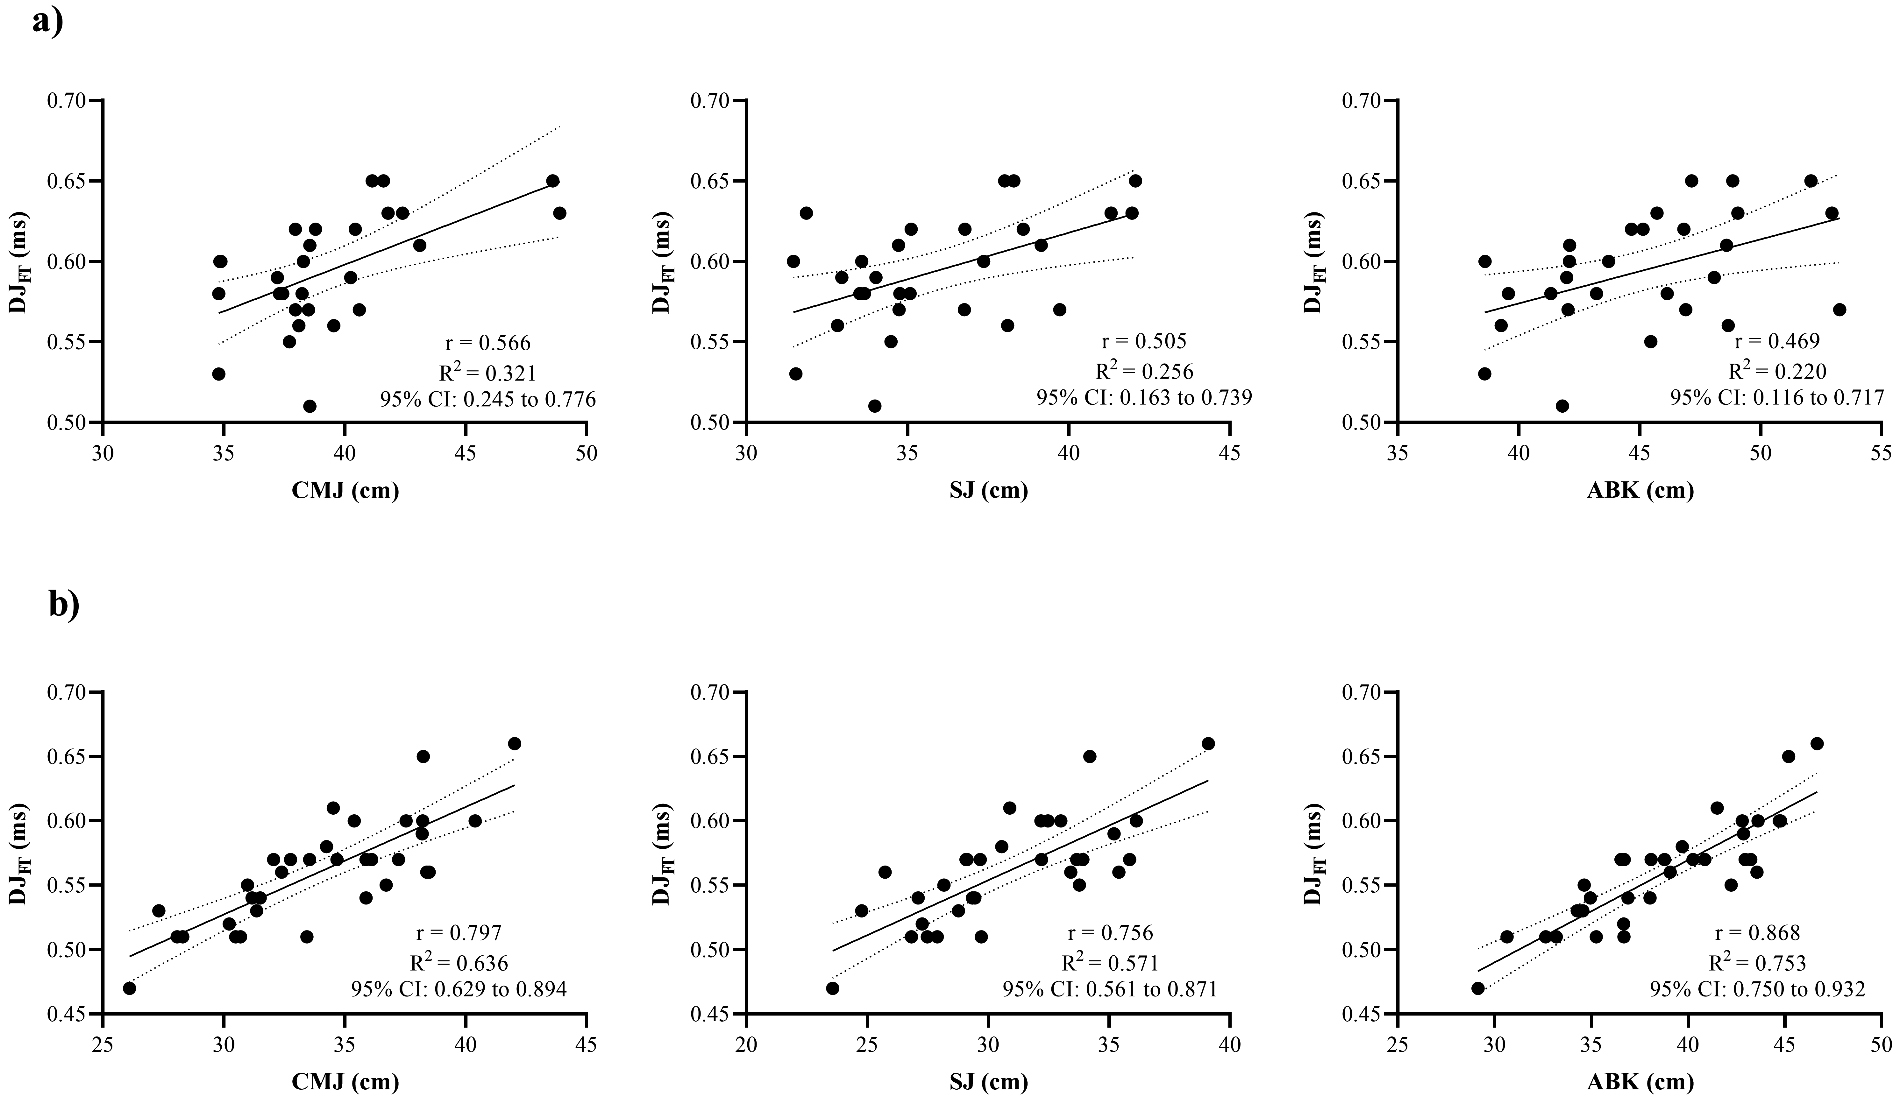
Table 4 displays the coefficients of correlation comprising the data from the backs. The MPV displayed moderate associations with both T and T ( 0.05), whilst MPV showed positive and moderate correlations with MPV ( 0.01). Moreover, and following the correlations observed in the forwards position, backs’ DJ and DJ were moderately associated with T and MSS (0.42 to 0.53, 0.05). Forwards ( 0.799 to 0.996, 0.001) and backs ( 0.469 to 0.995, 0.05) demonstrated moderate to strong correlations between DJ and jump height across all metrics analyzed (Fig. 1). Finally, RSI was only associated with all jump tasks in both positions ( 0.05; 0.330 to 0.407), whilst no significant associations were observed in any of the remaining variables.
a) Linear regression correlations between DJ and CMJ, SJ and ABK in the backs position. b) Linear regression correlations between DJ and CMJ, SJ and ABK in the forwards position. Dashed line demonstrates 95% confidence intervals (CI). R: Coefficient of determination of the regression line.
Discussion
The principal aim of this study was to examine the differences in physical performance and anthropometric traits within the forwards (F vs F vs F) and backs (B vs B vs B) units in amateur senior rugby players. The main results indicated that F were heavier and stronger than the other forwards (i.e., F and F) but displayed inferior jumping and sprinting abilities. Conversely, backs specific positions were found to be more similar, although B showed greater BM and SM when compared to B and B. Of note, RSI and DJ were also observed to be discriminating factors for the backs, with B exhibiting greater RSI and lower DJ than B and B. The unclear trends observed for the differences in these specific positions may account for the possibility of covering different roles, despite the technical and tactical differences that may exist in each playing position [32]. Regarding the secondary aim, our data indicated that explosive tasks such as sprinting and jumping were moderately associated, which is also confirmed by the relationships found between DJ (i.e., height and flight time) and speed-related (i.e., MSS, T30 and T10) variables in forwards and backs. Finally, significant relationships were observed between MPV and jump height (only in forwards) and sprint times (only in backs), whereas no associations were observed in the remaining variables of the present study.
In rugby, forwards are involved in scrums, lineouts, rucks, and mauls; hence, they should be taller and heavier and, as a result, possess high levels of strength and power to be effective [7]. Supporting previous research [9], our data confirm that F were heavier than F and F. In fact, F are required to drive the force of the scrum and are constantly involved in tackles, which explains why they are usually the heaviest players of the teams, presenting greater fat mass than F and F as previously reported [9, 15]. Likewise, our results demonstrated that, within the forwards, F were stronger in absolute terms (1RM and 1RM) but not in relative terms. Such findings confirm that the somatotypes of props and hookers (i.e. F) differ from F and F as they have to cope with the specific demands that they frequently experience during the game [33]. In practical terms, F may benefit from their larger BM and greater absolute strength to be able to successfully perform their specific positional roles, although fat free mass was also reported as a significant predictor of playing level classification [9].
F and F displayed better sprinting and jumping performances than F, which may be attributed to the fact that F and F play major roles in contesting ball possession in the lineout, being height and jumping ability key for such positions [33]. The main differences between F and the other positional roles were in terms of a higher height and, in addition, a decreased acceleration capacity (i.e., T) when compared to F. Again, these findings support previous observations [9] and may be explained by the specific in-match roles of both F and F. For the former, height is an obvious advantage; for the latter, the ability to rapid accelerate to get away quickly from the scrum, line-out, ruck, and maul is crucial [9]. The moderate to very large differences observed across all jump tasks in F and F (vs F) may reflect the ability to apply substantial amounts of force and power onto the ground, which can lead to an increase in vertical impulse and, thus, in maximal jump height [10]. Hence, despite the observed differences in maximum strength, it could be suggested that F and F possess a greater ability to produce strength and power relative to BM than the other forwards. In fact, this is confirmed by the very large differences in sprint times and MSS reported between F vs F. Notably, no differences were found in SM within the forwards specific positions, which confirms that BM may account (at least partially) for the variability reported in sprinting ability. In practical terms, this means that heavier players have a SM more influenced by BM than MSS.
Backs are usually the shortest and lightest players within a rugby team, possessing superior speed and agility capacities to rapidly move the ball forward, and accelerate away from defenders and out-maneuver opponents [34]. Despite this, no clear intra-group differences were found in physical and anthropometric measures between the backs. The present findings indicate that B were heavier and had greater SM than B and B, in addition to a greater upper-body absolute strength than B. Overall, the observed differences were not surprising as B typically have a higher number of contact situations with opposition players [33]. In fact, it was recently suggested that B training programs should focus on increasing their ability to repeat contacts [35], which seems a reasonable explanation as to why they presented a larger BM and SM compared to the rest of roles in this position. Reinforcing a previous study [15] and supporting the argument that the outside backs (i.e., B) require considerable speed to out-maneuver their opponents [16, 33], B demonstrated a greater MSS. The specific characteristics of each position had been previously described and it was reported that B should be able to sprint repeatedly and require training for improving their speed qualities, whereas B deal with higher impact loads (compared to other backs) [35]. In summary, present findings suggest that backs share more similarities that may also hinder the possibility to utilize a battery of fitness tests to differentiate players in each specific position.
Concerning RSI, this variable is considered to reflect an athlete’s ability to effectively use the stretch-shortening cycle (SSC) [24, 36]. The higher RSI demonstrated by B was attained by a shorter contact phase during DJs, which suggests a greater ability to quickly change from an eccentric to concentric contraction and, in turn, greater ‘explosiveness’ [37]. Still, further evidence is needed regarding the differences observed in RSI within the backs position. Notably, it has been previously suggested that subdividing a sample of forwards and backs to better identify the association between RSI variants for each group would be insightful owing to the existing positional differences [38]. In the present study no significant correlations were observed, despite that this analysis was performed separately. It is also important to note that, regardless of the greater RSI attained in B, this was not associated with a greater MSS, and may reinforce previous suggestions that RSI is influenced by, but not entirely dependent on, maximum strength capacity [24]. Future research should focus on the utilization of RSI as a valid indicator of performance in amateur rugby players.
Regarding the correlational analysis, a novel finding of the present study was that DJ and DJ were moderate to strongly associated to sprint times and MSS in both backs and forwards units. In line with Furlong et al. [19], our results confirm that variables involving rapid movements or fast eccentric-concentric muscle actions which are able to maximize the SSC tend to be related. In contrast, and as shown in previous research [19], DJ was not related to any other variable. This phenomenon can be attributed to the fact that contact times greater than 250 milliseconds (i.e., slow SSC) are not as important when performing fast rebounding movements [37]. In effect, the rugby players in our study exhibited a DJ typical of a slow SSC (270–380 ms); thus, it is not surprising that no meaningful associations were observed. Furthermore, the small to moderate correlations between sprint times, MSS and jump height across all tasks, indicated that other variables (e.g., lean BM, or relative strength and power) may conceivably influence the relationships between speed, vertical, and horizontal jumping ability [10]. This information may be used by coaches and practitioners to improve MSS given that this variable was correlated to all jump tasks, including DJ in both playing positions. Similar findings were previously reported in sprinters [39] where vertical jumps, but especially DJs, were considered useful training exercise to improve MSS.
The limitations of this study include that only one DJ height was used for all playing positions which may have affected the outcomes related to this measurement. Moreover, this research has a cross-sectional design, thus precluding inferences about the effects of different training schemes on these respective positional differences and on the magnitude of the interrelationships analyzed. Future studies are needed to better elucidate the differences in anthropometric traits and athletic performance within forward and back units, considering both professional and amateur rugby union players, possibly including a more comprehensive and general battery of physical and physiological assessments.
Conclusions and applications
Strength and power measures can discriminate between different performance levels [40], and also between specific playing positions in amateur rugby union. Thus, it is important to assess physical and anthropometric attributes to better select players for each position and monitor changes in strength-power-speed performance and BM over distinct training periods. The specialized anthropometric and physical characteristics found herein for F suggest that, for this position, BM and absolute strength are important aspects to consider. Moreover, training programs should also focus on improving sprint times and MSS (thus increasing SM). On the other hand, F and F should consider developing high relative strength values, jump heights and sprinting speed combined with large body dimensions (i.e., height and BM) in order to improve their SM. Thus, training strategies aimed at concomitantly induce hypertrophy and muscle power-speed gains are recommended. Considering B, training strategies should also aim to increase players’ BM and SM, indicating that MSS should not be neglected. Given the relationships observed, training strategies aimed at developing flight time during jump tasks should be prioritized. Particularly, DJ may be considered a valuable training and testing tool due to the associations found with sprint and jump performance measures. These findings may enhance current understanding of the specific positional characteristics and assist in the preparation of players to better cope with the specific game demands imposed by their positions.
Author contributions
All authors contributed equally, read and approved the final version of the manuscript.
Ethical considerations
The study was approved by the Institutional Research Ethics Committee of Universidad de Flores, on Nov. 20, 2020 and conformed to the recommendations of the Declaration of Helsinki. All participants signed a written informed consent form.
Funding
The authors report no funding.
Footnotes
Acknowledgments
The authors thank all the participants, coaches and rugby clubs for their participation and support during this study.
Conflict of interest
The author(s) declared no potential conflicts of interest with respect to the research, authorship, and/or publication of this article.
References
1.
CahillNLambKWorsfoldPHeadeyRMurrayS. The movement characteristics of english premiership rugby union players. J Sports Sci.2013; 31(3): 229-37. doi: 10.1080/02640414.2012.727456.
2.
OwenCTillKJonesBWeakleyJ. Testing methods and physical qualities of male age grade rugby union players: a systematic review. PLoS ONE.2020; 15(6): 1-37. doi: 10.1371/journal.pone.0233796.
3.
CunninghamDJShearerDADrawerSPollardBEagerRTaylorN, et al. Movement demands of elite under-20s and senior international rugby union players. PLoS One.2016; 11(11): 1-13.
4.
TakamoriSHamlinMJKieserDCKingDHumePYamazakiT, et al. Senior club-level rugby union player’s positional movement performance using individualized velocity thresholds and accelerometer-derived impacts in matches. J Strength Cond Res. 2020; Online Ahead of Print. doi: 10.1519/JSC.0000000000003523.
5.
QuarrieKLHopkinsWGAnthonyMJGillND. Positional demands of international rugby union: evaluation of player actions and movements. J Sci Med Sport.2013; 16(4): 353-9. doi: 10.1016/j.jsams.2012.08.005.
6.
Darrall-JonesJDJonesBTillK. Anthropometric, sprint, and high-intensity running profiles of english academy rugby union players by position. J Strength Cond Res.2016; 30(5): 1348-58. doi: 10.1519/JSC.0000000000001234.
7.
BrazierJAntrobusMStebbingsGKDaySHCallusPErskineRM, et al. Anthropometric and physiological characteristics of elite male rugby athletes. J Strength Cond Res.2020; 34(6): 1790-801. doi: 10.1519/JSC.0000000000002827.
8.
Hartmann NunesRFde Souza BezerraEOrssattoLBRMorenoYMLoturcoIDuffieldR, et al. Assessing body composition in rugby players: agreement between different methods and association with physical performance. J Sports Med Phys Fitness.2020; 60(5): 733-42. doi: 10.23736/S0022-4707.20.10487-0.
9.
FontanaFYColosioADe RoiaGFDa LozzoGPogliaghiS. Anthropometrics of Italian senior male rugby union players: from elite to second division. Int J Sports Physiol Perform.2015; 10(6): 674-680. doi: 10.1123/ijspp.2015-0014.
10.
WoodDJCoughlanGDelahuntE. Fitness profiles of elite adolescent irish rugby union players. J Strength Cond Res.2016; 32(1): 105-112. doi: 10.1519/JSC.0000000000001694.
11.
ZabaloySPareja-BlancoFCarlos-VivasJGálvez González,J. Determinant factors of physical performance in specific rugby playing positions. Sci Sports. 2020. In Press. doi: 10.1016/j.scispo.2020.06.011.
12.
BarrMJSheppardJMGabbettTJNewtonRU. Long-term training-induced changes in sprinting speed and sprint momentum in elite rugby union players. J Strength Cond Res.2014; 28(10): 2724-2731. doi: 10.1519/JSC.0000000000000364..
13.
CrewtherBTLoweTWeatherbyRPGillNKeoghJ. Neuromuscular performance of elite rugby union players and relationships with salivary hormones. J Strength Cond Res.2009; 23(7): 2046-2053. doi: 10.1519/JSC.0b013e3181b73c19.
14.
DuthieGM. A framework for the physical development of elite rugby union players. Int J Sports Physiol Perform.2006; 1(1): 2-13. doi: 10.1123/ijspp.1.1.2.
15.
SmartDJHopkinsWGGillND. Differences and changes in the physical characteristics of professional and amateur rugby union players. J Strength Cond Res.2013; 27(11): 3033-3044. doi: 10.1519/JSC.0b013e31828c26d3.
16.
DuthieGPyneDHooperS. Applied physiology and game analysis of rugby union. Sport Med.2003; 33(13): 973-91. doi: 10.2165/00007256-200333130-00003.
17.
MarkovicGDizdarDJukicICardinaleM. Reliability and factorial validity of squat and countermovement jump tests. J Strength Cond Res.2004; 18(3): 551-555. doi: 10.1519/1533-4287(2004)18<551:RAFVOS>2.0.CO;2.
18.
CunninghamDJWestDJOwenNJShearerDAFinnCVBrackenRM, et al. Strength and power predictors of sprinting performance in professional rugby players. J Sports Med Phys Fitness.2013; 53(2): 105-111.
19.
FurlongL-AMHarrisonAJJensenRL. Measures of strength and jump performance can predict 30-m sprint time in rugby union players. J Strength Cond Res. 2019. Online Ahead of Print. doi: 10.1519/JSC.0000000000003170.
20.
LindsayADraperNLewisJGiesegSPGillN. Positional demands of professional rugby. Eur J Sport Sci.2015; 15(6): 480-487. doi: 10.1080/17461391.2015.1025858.
21.
CampbellPGPeakeJMMinettGM. The specificity of rugby union training sessions in preparation for match demands. Int J Sports Physiol Perform.2018; 13(4): 496-503. doi: 10.1123/ijspp.2017-0082.
22.
JalilvandFBanoocyNKRumpfMCLockieRG. Relationship between body mass, peak power, and power-to-body mass ratio on sprint velocity and momentum in high-school football players. J Strength Cond Res.2019; 33(7): 1871-1877. doi: 10.1519/JSC.0000000000002808.
23.
ComfortPStewartABloomLClarksonB. Relationships between strength, sprint, and jump performance in well-trained youth soccer players. J Strength Cond Res.2014; 28(1): 173-177. doi: 10.1519/JSC.0b013e318291b8c7.
24.
DouglasJPearsonSRossAMcGuiganM. Reactive and eccentric strength contribute to stiffness regulation during maximum velocity sprinting in team sport athletes and highly trained sprinters. J Sports Sci.2020; 38(1): 29-37. doi: 10.1080/02640414.2019.1678363.
25.
Sánchez-MedinaLPallarésJPérezCMorán-NavarroRGonzález-BadilloJ. Estimation of relative load from bar velocity in the full back squat exercise. Sport Med Int Open.2017; 1(2): E80-8. doi: 10.1055/s-0043-102933.
26.
González-BadilloJJSánchez-MedinaL. Movement velocity as a measure of loading intensity in resistance training. Int J Sports Med.2010; 31(5): 347-352. doi: 10.1055/s-0030-1248333.
27.
JaricSMirkovDMarkovicG. Normalizing physical performance tests for body size: a proposal for standardization. J Strength Cond Res.2005; 19(2): 467-74. doi: 10.1519/R-15064.1.
28.
HopkinsWGMarshallSWBatterhamAMHaninJ. Progressive statistics for studies in sports medicine and exercise science. Med Sci Sports Exerc.2009; 41(1): 3-13. doi: 10.1249/MSS.0b013e31818cb278.
29.
LakensD. Calculating and reporting effect sizes to facilitate cumulative science: a practical primer for t-tests and ANOVAs. Front Psychol.2013; 4: 1-12. doi: 10.3389/fpsyg.2013.00863.
30.
Cohen. Applied Multiple Regression/Correlation Analysis for the Behavioral Sciences. Routledge; 2013.
31.
HopkinsWG. Spreadsheets for analysis of controlled trials, with adjustment for a subject characteristic. Sportscience.2006; 10: 46-51.
32.
NicholasCW. Anthropometric and physiological characteristics of rugby union football players. Sport Med.1997; 23(6): 375-396. doi: 10.2165/00007256-199723060-00004.
33.
QuarrieKLHandcockPToomeyMJWallerAE. The New Zealand rugby injury and performance project. IV. Anthropometric and physical performance comparisons between positional categories of senior A rugby players. Br J Sports Med.1996; 30(1): 53-56. doi: 10.1136/bjsm.30.1.53.
34.
DurandtJDu ToitSBorresenJHew-ButlerTMasimlaHJokoetI, et al. Fitness and body composition profiling of elite junior South African rugby players. South African J Sport Med.2009; 18(2): 38-45.
35.
YamamotoHTakemuraMIguchiJTachibanaMTsujitaJHojoT. In-match physical demands on elite Japanese rugby union players using a global positioning system. BMJ Open Sport Exerc Med.2020; 6(1): e000659. doi: 10.1136/bmjsem-2019-000659.
36.
DouglasJPearsonSRossAMcGuiganM. Kinetic determinants of reactive strength in highly trained sprint athletes. J Strength Cond Res.2018; 32(6): 1562-1570. doi: 10.1519/JSC.0000000000002245.
37.
FlanaganEPComynsTM. The use of contact time and the reactive strength index to optimize fast stretch-shortening cycle training. Strength Cond J.2008; 30(5): 32-38. doi: 10.1519/SSC.0b013e318187e25b.
38.
McMahonJJSuchomelTJLakeJPComfortP. Relationship between reactive strength index variants in rugby league players. J Strength Cond Res.2021; 35(1): 280-285. doi: 10.1519/JSC.0000000000002462.
39.
KaleMAşçiABayrakCAçikadaC. Relationships among jumping performances and sprint parameters during maximum speed phase in sprinters. J Strength Cond Res.2009; 23(8): 2272-2279. doi: 00124278-200911000-00013.
40.
JonesBWeavingDTeeJDarrall-JonesJWeakleyJPhibbsP, et al. Bigger, stronger, faster, fitter: the differences in physical qualities of school and academy rugby union players. J Sports Sci.2018; 36(21): 2399-2404. doi: 10.1080/02640414.2018.1458589.