Heavy-intensity cycling and running work-rate associated to VO 2max affects isokinetic strength,the dynamic control ratio but not the conventional H:Q ratio
Free accessResearch articleFirst published online May, 2022
Heavy-intensity cycling and running work-rate associated to VO 2max affects isokinetic strength,the dynamic control ratio but not the conventional H:Q ratio
Bilateral strength asymmetry and fatigue predispose athletes to various injuries and conventional methods appear to be poor predictors of lower extremity muscular performance under NF conditions.
OBJECTIVE:
The purpose of the study was to compare the conventional Hcon/Qcon (HQR) ratio and the dynamic control ratio (DCR: Hecc/Qcon) under non-fatiguing (NF) and fatiguing (F) conditions and verify the effects of heavy-intensity constant running and cycling exercise on the isokinetic performance.
METHODS:
Twenty healthy male participants performed running and cycling VOmax at work-rate associated with the achievement of VOmax (TTE). Isokinetic muscle strength performance was tested at 60 and 180/s before and after these sessions with 48-hour intervals. Quadriceps (QFR) and hamstring (HFR) muscle fatigue rates were also calculated during these sessions. Blood lactate concentration was measured before and two-minutes after running and cycling TTE.
RESULTS:
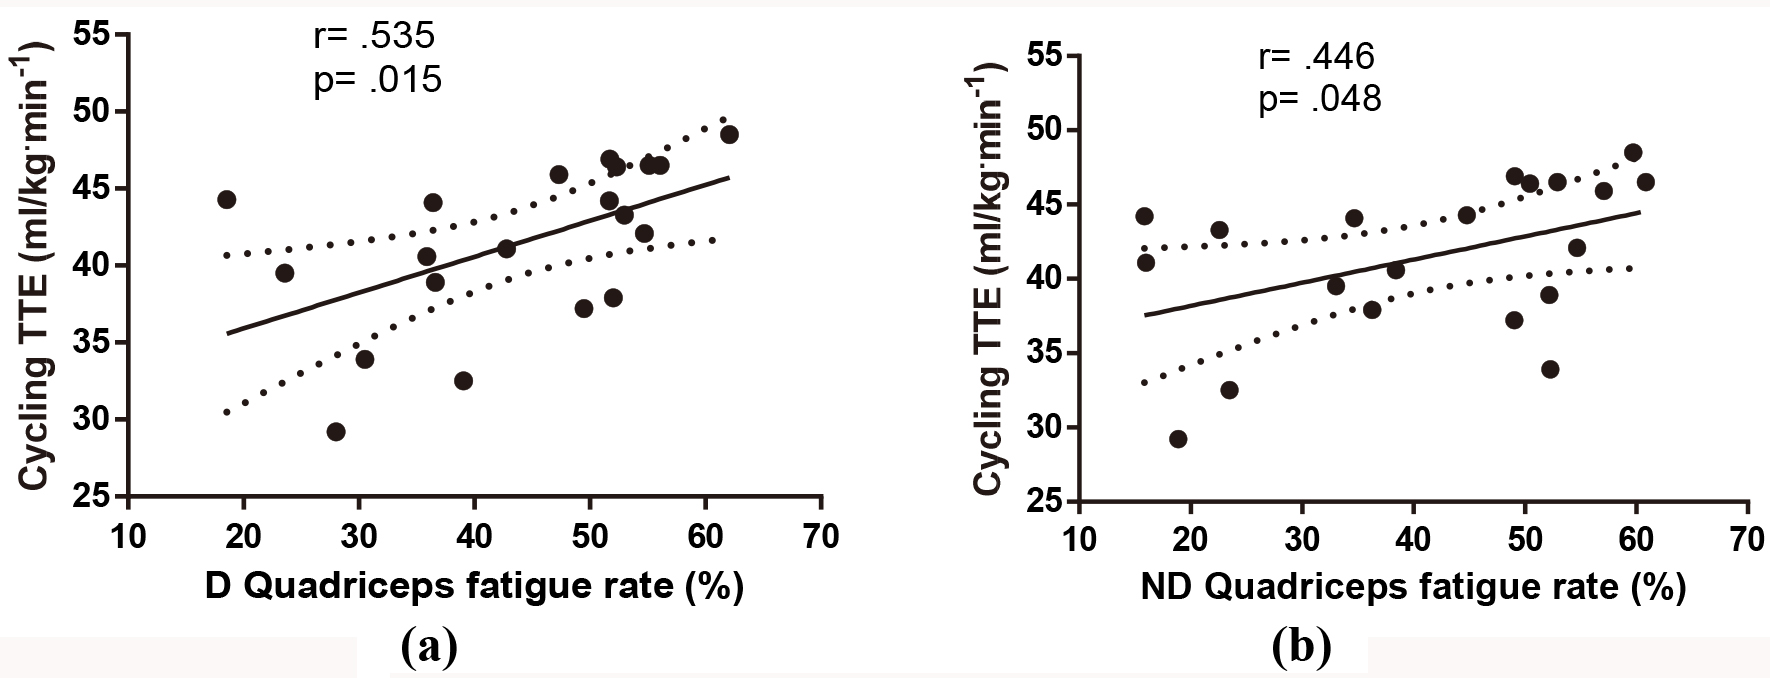
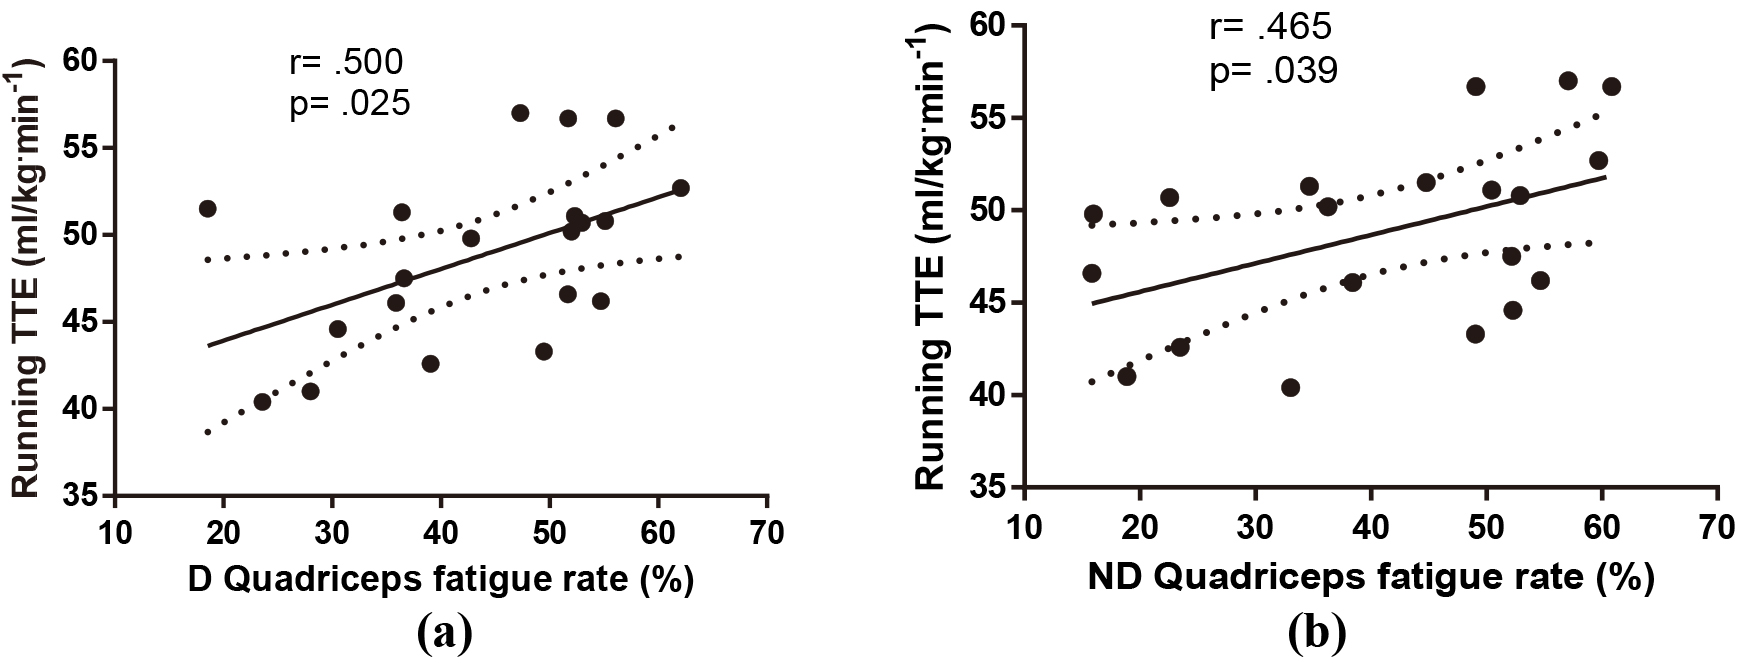
No between-condition differences were found for the HQR while the DCR decreased significantly at 180/s following cycling and running sessions ( 0.05). Cycling TTE was positively correlated with in dominant ( 0.535, 0.015) and non-dominant ( 0.446, 0.048) QFR. Positive correlations were also found between running TTE and dominant ( 0.500, 0.25) and non-dominant ( 0.465, 0.039) HFR.
CONCLUSIONS:
The DCR obtained at fast angular velocities following a strenuous exercise seems to be the best indicator of muscle performance while its assessment under F conditions reveals higher ratios compared to NF conditions and conventional methods.
Quadriceps (Q) and hamstring (H) muscle groups control the movements of the knee and hip joints and the recruitment patterns of these muscles increase with increasing exercise intensities during cycling and running. Both muscle groups enhance the different amount of contributions during the performance, and the power generated is associated with the co-activation patterns of these muscles [1]. However, the contractions of agonist and antagonist muscle groups and their different contractile mechanism lead to higher DCR during functional movements [2]. Thus, eccentric-concentric muscular contractions during the performance require a higher DCR ratio since a higher ratio is associated with lower metabolic cost [3]. Additionally, both during cycling and running, and improved bioenergetics capacity has shown to be an important element to maintain high mechanical propulsive efficiency and offset the onset of increased local muscular fatigue during the time to exhaustion [4, 5] that leads to an exercise-induced reduction in maximal voluntary muscle force [6]. Specifically, during high-intensity exercises, the proper relaxation between activation cycles is essential for efficient muscle function as fatigue provokes a decrease in the ability to continue to maximum performance [7]. Nevertheless, the association between hamstrings-to-quadriceps ratio on cycling and running performance has not been sufficiently described.
Both cycling and running incorporate concentric and eccentric phases of the H and Q muscle activity, and their activation may vary due to power output, lateral preference, technique, body position, training status, and fatigue [7]. Furthermore, accumulated muscle fatigue has shown to negatively impact agonist and antagonist co-activation of the H and Q during exercise [8]. Additionally, fatigue resulted from a prolonged exercise has reported to also carried over into the recovery phase following a strenuous activity [9]. In this regard, maintaining muscular activity may negatively affect the continuation of optimal cadence, pedal technique, and energy expenditure during cycling, while it may be attributed to mechanical stress during running under fatigued conditions [10]. As a result of moderated muscle-burst activation, duration, and intensity [11] during these testing modalities, fatigue serves as a major risk factor by altering muscle shock-absorbing capacity, coordination of the locomotor system [12], neuromuscular input, and output pathways [13]. In this context, the evaluation of neuromuscular performance under non-fatigued conditions may not present valid and precise results regarding muscular performance and/or injury risk which could be caused by fatigue and muscular imbalances.
Furthermore, in terms of an injury prevention strategy, exercise performance and injury risk have been related to functional asymmetries of the lower extremity [14]. Bilateral asymmetry, a form of limb laterality [15], has been reported to vary with the competitive situation, running speed, pedaling cadence, exercise intensity, and exercise duration [16]. Since strength imbalances in the lower extremity may also be transferable to the mechanics of endurance performance, which may lead to poor technique, imbalance of force generation, and/or bilateral co-activation of the lower extremity muscles, it is important to evaluate bilateral asymmetry-related neuromuscular performance under F conditions [17]. To the best of our knowledge, no study to date examined the association between the heavy-intensity cycling and running time to exhaustion (TTE) performance, bilateral asymmetry, HQR and DCR. Hence, the objective of this study was twofold: (1) first, to compare the HQR and DCR under NF (prior to cycling and running TTE) and F conditions (following cycling and running TTE), and (2) to verify the effects of heavy-intensity constant running and cycling exercise on these ratios in physically active male participants.
Methods
Study participants
All participants were informed about the equipment and familiarized with the experimental procedures before they underwent testing sessions. A total of 20 healthy male participants (21.47 2.39 years, height: 176.88 5.80 cm, weight: 73.46 8.04 kg, lean body mass: 64.02 5.58 kg, percent body fat: 12.49 4.72%), volunteered to participate in this study. All participants gave written informed consent prior to participating in the study approved by Mersin University Institutional Review Board in compliance (Protocol number: 377861, date of approval: 24.03.2017) with the ethical standards of the Helsinki Declaration.
The inclusion criteria applied in the research were healthy, physically active (e.g. at least 3 times in a week) male participants aged between 18 and 30 y, who were not suffering from any kind of acute or chronic disease that would limit their ability to participate in the study, refusal to give informed consent, failure to adhere to pre-test requirements, evidence of altered training/fitness were excluded from the study.
Data collection
The anthropometric parameters (body weight, lean body weight, percent body fat) were assessed using bioelectrical impedance analysis (Tanita 418-MA Japan) before VO and T test sessions. Height was measured with a stadiometer in the standing position (Holtain Ltd. U.K.). Preliminary testing sessions were applied in the assessment of the maximum fatigue intolerance point of each participant for cycling and running TTE.
Forty-eight hours of recovery was allowed between each session to optimize performance. In the first visit to the laboratory, participants underwent an isokinetic strength testing at CON-CON 60/s, CON-CON 180/s, CON/ECC 60/s and CON/ECC 180/s angular velocities in the assessment of bilateral symmetry. In the second visit to the laboratory, participants underwent a progressive treadmill test to determine VO and vVO. In the following session the TTE test was carried out at a constant speed until volitional exhaustion on a treadmill. These tests were also adapted to cycling ergometer to determine exercise intensity associated with maximal oxygen uptake (VO) and TTE. Athletes performed both treadmill and cycling tests over a 48-hours interval with two separate visits to the laboratory. Heart Rate (HR) was also monitored and recorded throughout VO and TTE test sessions using a 12-lead ECG.
Muscle strength assessment
The HQR and DCR were calculated using the maximal repetitions prior to and after TTE at both velocities. For the test, the participants were seated on the Humac Norm Cybex CSMI chair in an upright position, with the hips flexed at an angle of 90 and using pelvic and thigh straps. The RoM was kept at 90 from full extension and gravity correction was performed. One session was performed after a standardized warm-up period (5 min cycling at 70 W) and the other session was performed after a constant running and cycling vVO. The participants performed five maximal efforts at CON-CON 60/s, CON-CON 180/s, CON/ECC 60/s and CON/ECC 180/s to determine maximal peak moments of knee extensor and flexors. A 5 min rest period was allowed between cycles during isokinetic testing. The participants were instructed to exert effort as hard and as fast as possible for all contractions. The participants underwent the same protocol for both legs during all isokinetic testing sessions. Q and H fatigue rate were also determined for each set following each cycling and running TTE test session. Q fatigue rate was calculated as the percent decline in peak moment performance during the 5 repetitions of reciprocal knee contractions from first to the second test and also first to the third set: (MPME of 5 reps in the first set – MPME of 5 reps in second set/MPME of 5 reps in the first set). The mean of these values were used as Q fatigue rate. This formula was also used to determine the H fatigue rate [18].
On the other hand, to evaluate the magnitude of isokinetic bilateral asymmetry index (BAI) between the dominant (D) leg and non-dominant (ND) leg following both treadmill and cycling TTE tests, the bilateral asymmetry index was calculated as follows [19].
The assessment of vVO, and TTE on treadmill
VO, vVO, and TTE were measured in a preliminary test session using a progressive exercise protocol on a treadmill. Oxygen consumption was measured breath by breath through a gas analyzer (CareFusion MasterScreen CPX, Germany) and subsequently averaged over 15-second intervals. Before each test, the automated gas analyzer was calibrated according to the manufacturer’s recommendations and using standard gases of known concentration. All participants maintained a standing position on the treadmill and were asked to hold the handrails before the device was initialized for a test session. Then, the treadmill speed was set to 5 kmh (0% slope) and increased every minute by 1 kmh. Following this warm-up process, the test was started when the speed reached 8 kmh. Throughout the tests, participants received verbal encouragement and they were asked to rate their perceived exertion on Borg’s scale at the end of each minute. The test continued until at least two of the following criteria were obtained: a plateau in VO despite an increase in running speed: a respiratory exchange ratio (RER) above 1.1; HR over 90% of the predicted maximal HR. If the stage of 1 min could not be completed, the velocity of the previous stage was recorded as vVO. In the following session, the participants underwent a TTE test using vVO on a treadmill under the same laboratory conditions. Following a 10-min warm-up period at 60% vVO, the speed was immediately increased (in less than 20 s) up to vVO. The participants were then encouraged to run to their volitional exhaustion. The time from when the vVO was first attained until participants’ volitional exhaustion was recorded to the nearest second as TTE. The test was ended when the participants failed to continue running at the required velocity despite verbal encouragement.
Physiological characteristics of participants (mean SD)
Variables
Treadmill
Cycling
VO (mlkgmin)
57.04
5.87
63.58
4.11
TVO (mlkgmin)
59.89
4.46
64.85
15.20
Time to exhaustion (seconds)
513.89
255.21
431.44
221.97
Heart rate (beat/min)
184.13
12.70
181.48
9.73
Blood lactate concentration (mmol/mL)
10.74
3.09
11.03
2.85
Respiratory exchange ratio
1.04
0.05
1.15
0.03
Rate of perceived exertion
18.00
1.63
19.00
1.76
Dominant quadriceps fatigue rate (%)
33.56
10.31
43.85
12.12
Non-dominant quadriceps fatigue rate (%)
31.17
21.10
39.37
11.33
Dominant hamstring fatigue rate (%)
41.11
15.12
35.36
19.22
Non-dominant hamstring fatigue rate (%)
37.15
10.36
33.21
14.58
Note. VO: Maximum oxygen consumption, vVO: velocity at VO, TVO: Time to exhaustion at VO.
The assessment of intensity at VO (VO) and TTE on cycle ergometer
VO, VO, and TTE were also acquired in a preliminary test session using a progressive exercise protocol on Ergoline Ergoselect 100/200 cycle ergometer over a 48 h interval with two separate visits under the same laboratory conditions. In the first visit, athletes underwent a progressive cycle ergometer test to determine VO and VO. The initial intensity was 50 Watt and participants were asked to pedal between 95–100 rpm on a cycling protocol that consisted every stage of 2-min with a load increase of 50W. If the participants could not complete the 2-min intervals, the load of the previous stage was recorded as VO. The load that VO elicit was recorded as VO and used to determine TTE on the following test session. Throughout the test, the Borg scale was also used to determine the rate of perceived exertion of participants. Before TTE testing session participants underwent a 10-min warm-up at 60% of their VO and the intensity at which the participants exercised was progressively increased so that they reached their VO in 30 s and using verbal encouragement they were told to maintain this intensity until they felt exhausted. The TTE was recorded as the time from when the VO was first attained until the point when the participant was unable to maintain the prescribed cycling frequency of 80 rpm. The test was terminated when the participants failed to continue the pedaling rate at the required exercise intensity despite verbal encouragement.
Assessment of blood lactate concentration
The participants were seated after the interventions and blood samples were collected from the earlobe using Lactate Pro 2 handheld analyzer (LT-1730, Arkray Inc, Kyoto, Japan) before and 2 minutes after completion of cycling and running TTE testing sessions to determine blood lactate concentrations.
Statistical analysis
Descriptive statistics were used to summarize data whilst Pearson product-moment correlation determined the correlations of the variables at a 95% confidence interval. One-way repeated measures ANOVA and student’s -test analysis were used to compare inter- and intra-session differences. Distribution of normality was tested and log-transformed data were compared by paired-samples -tests. Intraclass Coefficient (ICC) and Intraclass Coefficient Confidence Intervals (ICC CI 95%) were determined to represent the proportion of variance in a set of scores that is attributable to the true score variance. To describe differences related to equations, effect sizes were calculated as the difference between means divided by the pooled standard deviation. An effect size of 0.20–0.50 was considered small, 0.50–0.80 medium, and 0.80 considered as large using Cohen’s criteria. The level of statistical significance was set at 0.05 and 0.001 for all comparisons. The statistical analysis was performed with SPSS version 20.0 (SPSS Inc., Chicago, IL, USA). GraphPad Software GraphPad Prism 6 was used for graphical expression.
Results
Data on the physiological characteristics of participants are shown as mean SD in Table 1.
Intra-session comparisons of asymmetry index and the declines in isokinetic peak moment, work and power parameters following running and cycling time to exhaustion tests
The declines in the PM, work and power parameters following TTE for both exercise modalities are presented in Table 2.
Intra-group comparisons of BAI and the declines in muscle strength parameters at CON/ECC 180/s following running and cycling time to exhaustion tests ( 20)
Session 1
Session 2
Session 3
Variable
Running
Cycling
Running
Cycling
Running
Cycling
Asymmetry Index Extension (%)
2.19
4.61
2.99
3.56
3.17
1.93
3.94
2.11
2.37
1.25
4.11
11.36
Asymmetry Index Flexion (%)
7.46
4.95
9.35
5.21
9.13
13.48
8.56
17.54
8.11
11.33
9.87
10.53
Extension Moment Decline (Nm)
13.29
21.19
15.21
9.53
21.06
25.63
29.21
21.36
18.27
17.52
23.17
18.24
Flexion Moment Decline (Nm)
35.67
20.75
30.41
18.56
27.10
36.22
29.30
33.25
25.26
30.20
26.21
27.36
Extension Work Decline (Joules)
15.42
22.01
21.37
15.14
25.43
26.91
27.38
19.86
26.37
17.83
25.00
18.73
Flexion Work Decline (Joules)
41.44
22.87
37.27
17.23
35.70
13.31
37.74
32.12
30.25
11.29
31.38
16.56
Extension Power Decline (Watt)
18.74
15.71
21.21
13.36
19.98
26.27
24.33
20.18
18.21
19.17
20.03
21.36
Flexion Power Decline (Watt)
37.45
24.09
30.28
20.35
33.35
12.26
30.35
18.45
31.24
17.56
32.21
13.87
Note. Values are presented as mean SD. Asterisks (*) indicates significant differences in BAI and the declines in muscle strength parameters obtained at CON/ECC 180/s angular velocity following running and cycling time to exhaustion at the 0.05 significance level.
Concentric (CON) knee extension (KE) and eccentric (ECC) knee flexion moments at 180/s, before (PRE) and after (POST) running exercise at the 0.05 significance level. 20
Variable
Isokinetic knee extension
Isokinetic knee flexion
Pre
Post
% change
Pre
Post
% change
KE (con) – KF (con) 60/s
235.28 45.52
241.23 40.52
2.53 8.11
131.25 23.36
137.23 29.53
4.56 6.75
KE (con) – KF (con) 180/s
180.21 30.25
187.41 37.21
4.00 6.57
119.35 30.21
126.22 28.78
5.76 8.26
KE (con) – KF (ecc) 60/s
310.32 68.63
319.18 41.29
2.86 5.51
177.56 40.87
185.27 30.26
4.34 5.33
KE (con) – KF (ecc) 180/s
335.43 52.57
308.23 41.20
8.11 10.12
186.93 30.45
173.51 37.98
7.18 6.21
Note. Values are presented as mean SD. Asterisks (*) indicates significant changes in concentric (CON) knee extension (KE) and eccentric (ECC) knee flexion moments at 180/s, before (PRE) and after (POST) running exercise at the 0.05 significance level.
Concentric (CON) knee extension (KE) and eccentric (ECC) knee flexion moments at 180/s, before (PRE) and after (POST) cycling exercise at the 0.05 significance level. 20
Variable
Isokinetic knee extension
Isokinetic knee flexion
Pre
Post
% change
Pre
Post
% change
KE (con) – KF (con) 60/s
227.40 37.25
239.11 29.55
5.15 3.56
129.34 31.36
127.65 30.32
1.31 4.17
KE (con) – KF (con) 180/s
186.13 51.27
191.35 44.23
2.80 5.11
135.32 43.21
137.54 37.23
1.64 5.12
KE (con) – KF (ecc) 60/s
331.56 51.69
335.32 47.55
1.13 3.37
186.93 55.21
193.25 41.32
3.38 6.27
KE (con) – KF (ecc) 180/s
356.35 49.98
311.26 51.55
12.65 11.25
197.25 39.33
185.11 39.78
6.15 7.56
Note. Values are presented as mean SD. Asterisks (*) indicates significant changes in concentric (CON) knee extension (KE) and eccentric (ECC) knee flexion moments at 180/s, before (PRE) and after (POST) cycling exercise at the 0.05 significance level.
Intra-session comparisons of asymmetry index and the declines in muscle strength parameters following running and cycling time to exhaustion tests showed significant differences between two exercise modalities. Extension moment, work and power decline data obtained at CON/ECC 180/s after cycling performance were significantly higher compared to running (29.21 21.36 vs. 21.06 25.63, 0.034; 21.37 15.14 vs. 15.42 22.01, 0.023; 24.33 20.18 vs. 19.98 26.27, 0.039), respectively. However, intra-session comparisons of the declines in strength parameters following running and cycling time to exhaustion tests revealed that the declines in the flexion moment, work and power parameters obtained at CON/ECC 180/s after a running performance were significantly higher compared to than those in cycling (35.67 20.75 vs. 30.41 18.56, 0.032; 41.44 22.87 vs. 37.27 17.23, 0.041; 37.45 24.09 vs. 30.28 20.35, 0.037), respectively. The results of the One-way repeated measures ANOVA analysis revealed statistically significant differences among sessions with regards to asymmetry index and the declines in muscle strength parameters following running and cycling time to exhaustion tests ( 0.05). Additionally, isokinetic knee extension (con) and flexion (ecc) moments at 180/s were found significantly decreased after both running (Table 3) and cycling (Table 4) exercise compared to baseline parameters ( 0.05).
Mean percent changes in the hamstrings/quadriceps ratios calculated by the conventional method at 60/s and 180/s, and the functional method at 60/s and 180/s, before (PRE) and after (POST) three sessions of running and cycling exercise. 20
Variable
Running
Cycling
Pre
Post
% change
ICC
ICC CI 95%
Pre
Post
% change
ICC
ICC CI 95%
Hcon/Qcon – 60/s
0.57
0.58
1.75
0.94
0.90–0.99
0.51
0.50
1.96
0.93
0.90–0.96
Hcon/Qcon – 180/s
0.69
0.70
1.45
0.91
0.87–0.99
0.63
0.64
1.59
0.89
0.87–0.94
Hecc/Qcon – 60/s
0.81
0.78
3.70
0.95
0.89–0.97
0.85
0.82
3.53
0.94
0.90–0.98
Hecc/Qcon – 180/s
1.17
1.10
5.98
0.97
0.95–0.99
1.22
1.13
7.38
0.93
0.88–0.95
Note. Asterisk (*) indicates the significant differences in conventional and dynamic control ratios obtained in pre-and-post test at both angular velocities ( 0.05).
The associations between quadriceps fatigue rate in the (a) dominant (D) limb and cycling VO; (b) non-dominant (ND) limb and cycling TTE.
The associations between hamstring fatigue rate in the (a) dominant (D) limb and running VO; (b) non-dominant (ND) limb and running TTE.
Intraclass coefficient (ICC) and Intraclass coefficient confidence intervals (ICC CI 95%) were determined to represent the proportion of variance in a set of scores that is attributable to the true score variance. No significant differences between PRE and POST running and cycling exercise were found for 60/s Hcon/Qcon, 180/s, Hcon/Qcon and 60/s Hecc/Qcon for both flexion and extension isokinetic contractions. Hcon/Qcon and Hecc/Qcon at 60/s and 180/s were compared among three sessions to compare and test the reproducibility prior to and after both running and cycling exercise (Table 5). The results of the One-way repeated measures ANOVA analysis revealed statistically significant decreases in post test Hecc/Qcon strength ratio at 180/s following both running and cycling exercise compared to baseline parameters.
Associations between neuromuscular capacity and fatigue test performance after running and cycling TTE
The results of Pearson product-moment correlation coefficient revealed significant positive correlations between cycling TTE and both DQFR ( 0.535, 0.015) and NDQFR ( 0.446, 0.048). Positive significant correlations were also found between running TTE and both DHFR ( 0.500; 0.25) and NDHFR ( 0.465, 0.039), respectively.
Discussion
The quantification of neuromuscular performance is essential to understanding the basis of movement, normalizing metabolic and cardiovascular responses to a given task and determining the effects of training, muscle disuse, and rehabilitative treatments [20]. The method of quantifying such performance, however, can also be biased depending on whether the method used is sufficient to detect muscular imbalances, athletic overuse, high-impact use of the knees, or biomechanical alterations associated with fatigue. Due to their complementary roles in the evaluation of neuromuscular performance, this study sought: (1) to compare H(con)/Q(con) and H(ecc)/Q(con) strength ratios under NF and F conditions, and (2) to verify the effects of heavy-intensity constant running and cycling TTE on the HQR and DCR in healthy male participants.
The results of this study demonstrate that H(ecc)/ Q(con) at 180/s significantly decreased following cycling and running TTE (Table 5). In addition, QFR and HFR in D and ND limb was found positively correlated with cycling TTE (Fig. 1a and b) and running TTE (Fig. 2a and b). Although cycling is a non-weight bearing activity and primarily includes concentric muscle contractions [21], an equal hamstring to quadriceps (H:Q) ratio is desirable during the pedal cycle. Miura et al. asserted that only concentric muscle actions are involved during cycling [22]. It has also been reported that positive relationships between the EMG activity of concentric exercise and the pedal load also lead to greater concentric muscle actions during cycling [23]. The greater decline in Q muscle strength following a high-intensity TTE in the current study was extending previous findings [21, 22, 23].
Additionally, intra-session comparisons of asymmetry index and the declines in muscle strength parameters following running and cycling TTE showed significant discrepancies. Extension moment, work, and power decline after the cycling performance were found significantly higher compared to running (Table 2). These findings reveal that localized muscle fatigue is only one component of the acute fatigue experienced during maximal effort exhaustive cycling, which also involves energetic, respiratory, and/or cardiovascular factors [24, 25]. Similarly, the extent of central fatigue (i.e., decrease in voluntary activation level and reduced neural drive) and peripheral fatigue (i.e., muscle fatigue) have shown to be associated with exercise intensity during fatigue, employing cycling exercises at different constant-loads to exhaustion [26]. Thus, the fatigue that resulted in the Q during the propulsive phase of the pedaling cycle during TTE may have been caused by a greater decline in the average extension moment, work, and power compared to running TTE (Table 2). In-vivo assessment of muscle contractility also showed that exercise-induced muscle stiffness occurred in Q after the exercise was accompanied by a decrease in the voluntary torque, reduced peak moment, longer electromechanical delay and contraction time, and reduced rate of force development [27]. The changes in muscle viscosity resulting from fatigue have also been shown to affect the natural capacity of muscles to absorb mechanical shock due to the increased adaptation process to mechanical stress [28]. In this regard, the reductions in Q may be related to diminished motor-neuron excitability, muscle damage, or central activation loss resulting from excitation-contraction coupling impairments during cycling TTE.
Contrary to cycling, running is a load-bearing activity that requires the leg muscles to perform substantial eccentric work [29]. Strength loss under eccentric conditions is 6–7% greater following running exercise than under concentric conditions [30]. The activation of H also decreases during treadmill running due to the backward motion of the treadmill [31]. Negative correlations have been reported between eccentric knee flexion (0.957) during a run to exhaustion at vVO. The local muscular endurance of the knee flexors have been shown to highly correlated with the changes in running mechanics [32]. Similarly, the eccentric muscle strength of H muscles after running TTE was found decreased in the current study (Table 2). Intra-session comparisons also revealed greater declines in the flexion moment, work, and power parameters after a running performance (Table 3). These findings reveal that eccentric muscle strength plays an essential role in maintaining running performance during TTE.
On the other hand, the repeated transient impact of vertical ground reaction force has shown to cause an abrupt collision force equal to about 1.5- to 3-fold the body weight during running [33]. Furthermore, increased mechanical power at the knee joint has been reported due to the muscles being exposed to a heavier load with the increase in velocity [34]. The current study also showed that running TTE was positively correlated with HFR both in the D limb ( 0.500, 0.025) and ND limb ( 0.465, 0.039). Taking such repeated impacts into account, one could speculate that participants with higher local muscle resistance in H muscles had fewer changes in kinematic variables during the run, enabling them to cope with muscle fatigue and prolong the TTE at their vVO. The greater strength loss after running exercise may have resulted from increased muscle damage during eccentric contractions rather than metabolic changes. In this regard, increased HFR during running as opposed to lower QFR may provide some indication as to why hamstring muscles are at greater risk of injury. To this end, the assessment of H:Q ratio and fatigue parameters during different exercise modalities under NF conditions may not mimic the actual muscular performance. It may also lead to an imprecise evaluation of muscular fatigue and H:Q ratio.
Conclusions
The results of the current study revealed that DCR, knee flexor and extensor eccentric moments significantly decreased after running and cycling work-rate associated to VO due to peripheral muscle fatigue, but not the HQR. Additionally, the results showed that isokinetic contractions at fast angular velocities seemed to be the best indicator of the effects of previous running and cycling exercises on the observed H:Q ratios, specifically when the functional method of calculation is used.
To better understand the effects of neuromuscular fatigue on cycling and running performance, additional research with large prospective cohort studies and a greater sample size, including both genders from various age groups, should be conducted and should include activities from different sports branches under different muscle contraction conditions using different angular velocities. Consequently, the study’s results suggest that it would be crucial to screen H:Q ratio under F conditions in terms of a precise injury risk indicator and injury prevention strategy. Additionally, identifying patterns of muscle fatigue related to changes in muscle moments following a heavy-intensity exercise could help diagnose different muscle states or provide insights for muscle rehabilitation in athletes. More detailed studies should be focused on delay fatigue, especially in H muscle groups, to help establish more effective strategies in preventing and rehabilitating injury resulting from inadequate interventions that thoroughly underestimate the effect of fatigue in the evaluation of H:Q ratios.
Ethical considerations
All participants gave written informed consent prior to participating in the study approved by Mersin University Institutional Review Board in compliance (Protocol number: 377861, date of approval: 24.03.2017) with the ethical standards of the Helsinki Declaration.
Funding
None.
Footnotes
Acknowledgments
To the 20 participants who volunteered to be part of the study.
Conflict of interest
The research was conducted in the absence of any commercial or financial relationships that could be construed as a potential conflict of interest. The results of the current study do not constitute an endorsement of the product by the author or the journal. Given his role as an Editorial Board Member, Gökhan Umutlu had no involvement nor access to information regarding the peer review of this article.
References
1.
da SilvaJCLTarassovaOEkblomMMAnderssonERönquistGArndtA. Quadriceps and hamstring muscle activity during cycling as measured with intramuscular electromyography. Eur J Appl Physiol.2016; 116: 1807-1817.
2.
ChanKMMaffulliNKorkiaPRaymondCT. Principles and Practice of Isokinetics in Sports Medicine and Rehabilitation, Williams & Wilkins, Hong Kong, 1996.
3.
ØyvindHSGorelickMLS. Relationship between functional hamstring: quadriceps ratios and running economy in highly trained and recreational female runners. J Strength Cond Res.2014; 28(8).
4.
FigueiredoPZamparoPSousaAVilas-BoasJPFernandesRJ. An energy balance of the 200 m front crawl race. Eur J Appl Physiol.2011; 111(5): 767-77.
5.
FernandesRJVilas-BoasJP. Time to exhaustion at the VO2max velocity in swimming: a review. J Hum Kinet.2012; 32: 121-134.
6.
GandemiaSC. Spinal and supraspinal factors in human muscle fatigue. Physiol Rev.2001; 81: 1725-89.
7.
HugFDorelS. Electromyographic analysis of pedaling: a review. J Electromyogr Kines.2009; 19: 182-198.
8.
BogdanisGC. Effects of physical activity and inactivity on muscle fatigue. Front Physiol.2012; 3: 142.
9.
WeirJPKeefeDAEatonJFAugustineRTTobinDM. Effect of fatigue on hamstring coactivation during Isokinetic knee extensions. Eur J Appl Physiol.1998; (78): 555-559.
10.
LeirdalSEttemaG. The relationship between cadence, pedaling technique and gross efficiency in cycling. Eur J Appl Physiol.2011; 111(12), 2885-2893.
11.
ArndtAEkenmanIWestbladPLundbergA. Effects of fatigue and load variation on metatarsal deformation measured in vivo during barefoot walking. J Biomech.2002; 35(5): 621-8.
12.
JamesCRScheuermannBWSmithMP. Effects of two neuromuscular fatigue protocols on landing performance. J Electromyogr Kinesiol.2010; 20(4): 667-75.
13.
MiuraHArakiHMatobaHKitagawaK. Relationship among oxygenation, myoelectric activity, and lactic acid accumulation in vastus lateralis muscle during exercise with constant work rate. Int J Sports Med.2000; 21: 180-184.
14.
HodgesSJPatrickRJReiserRF. Effects of Fatigue on Bilateral Ground Reaction Force Asymmetries During the Squat Exercise. J Strength Cond Res.2011; 25(11): 3107-17.
15.
SerrienDJIvryRBSwinnenSP. Dynamics of hemispheric specialization and integration in the context of motor control. Nat. Rev. Neurosci.2006; 7(2), 160e166.
16.
CarpesFPCarlos Bolli Mota MotaCBFariaIE. On the bilateral asymmetry during running and cycling – a review considering leg preference. Phys Ther Sport. 2010; 11(4): 136-42.
17.
FarrellKCReisingerKDTillmanMD. Force and repetition in cycling: possible implications for iliotibial band friction syndrome. The Knee.2003; 10(1): 103-109.
18.
ErdoğanATUmutluGAcarNE. Evaluation of shoulder strength characteristics in overhead sports and range of motion related changes during isokinetic testing. Isokinet Exerc Sci.2019; 27(1): 1-9.
19.
KobayashiYKuboJMatsubayashiTMatsuoAKobayashiKIshiiN. Relationship between bilateral differences in single-leg jumps and asymmetry in isokinetic knee strength. J. Appl. Biomech.2013; 29: 61-67.
20.
SlonigerMACuretonKJPriorBMEvansEM. Lower extremity muscle activation during horizontal and uphill running. J. Appl. Physiol.1997; 83(6): 2073-2079.
21.
RobergsRARobertsSO. Exercise Physiology: Exercise, Performance and Clinical Applications. St Louis: Mosby, 1997.
22.
MiuraKIshibashiYTsudaEOkamuraYOtsukaHTohS. The effect of local and general fatigue on knee proprioception. Arthroscopy, 2004; 20(4): 414-8.
23.
ShinoharaMKouzakiMYoshihisaTFukunagaT. Mechanomyography of the human quadriceps muscle during incremental cycle ergometry. Eur J Appl Physiol.1997; 76: 314-319.
24.
MilletGYLepersR. Alterations of neuromuscular function after prolonged running, cycling and skiing exercises. Sports Med.2004; 34: 105-116.
25.
ByrneCTwistCEstonR. Neuromuscular function after exercise-induced muscle damage: theoretical and applied implications. Sports Med.2004; 34: 49-69.
26.
ChalchatEGennissonJLPeñaililloLOgerMMalgoyreACharlotKBourrilhonCSiracusaJGarcia-VicencioS. Changes in the Viscoelastic properties of the vastus lateralis muscle with fatigue. Front Physiol.2020; 11(307): 2-3.
27.
SiracusaJCharlotKMalgoyreAConortSTardo-DinoPEBourrilhonC, et al. Resting muscle shear modulus measured with ultrasound shear-wave elastography as an alternative tool to assess muscle fatigue in humans. Front. Physiol.2019; 10: 626.
28.
ChalchatEGennissonJLPeñaililloLOgerMMalgoyreACharlotKBourrilhonCSiracusaJGarcia-VicencioS. Changes in the viscoelastic properties of the vastus lateralis muscle with fatigue. Front Physiol.2020; 11(307): 2-3.
29.
HeidenTBurnettA. The effect of cycling on muscle activation in the running leg of an olympic distance triathlon. Sports Biomech, 2003; 2: 35-49.
30.
LepersRPoussonMMaffiulettiNAMartinAVan HoeckeJ. The effects of a prolonged running exercise on strength characteristics. Int J Sports Med.2000; 21: 275-80.
31.
WaldhelmAFisherRA. Lower extremity muscle activation during over ground versus treadmill running. MOJ Yoga Physical Ther.2016; 1(1): 00003.
32.
HayesPRBowenSJDaviesEJ. The relationships between local muscular endurance and kinematic changes during a run to exhaustion at vVO2max. J Strength Cond Res, 2004; 18(4): 898-903.
33.
LiebermanDEVenkadesanMWerbelWADaoudAID’AndreaSDavisISMang’EniROPitsiladisY. Foot strike patterns and collision forces in habitually barefoot versus shod runners. Nature.2010; 463: 531-535.
34.
ArampatzisABrüggemannGPMetzlerV. The effect of speed on leg stiffness and joint kinetics in human running. J Biomech.1999; 32: 1349-1353.