
Abstract
BACKGROUND:
Volleyball player’s performance depends on a combination of technical-tactical skills and an optimum level of general and specific physical fitness.
OBJECTIVE:
The purpose of the study was to compare the results of three isometric strength tests with the results of four specific volleyball performance tests using a novel Multidimensional Modelling Approach.
METHODS:
In a cross-sectional study 80 male (age
RESULTS:
Principal Component Analysis, with 51.38% to 64.87% of variances explained, was used to group results from multiple tests into a single score: isometric force (F
CONCLUSIONS:
The findings derived from the isometric strength tests are not related to those obtained from specific volleyball performance tests. However, the advantages of isometric tests and their findings may be of a comparative clinical value in management of sports injury in volleyball players.
Introduction
Volleyball is an intermittent sport that requires players to participate in frequent short bouts of high-intensity exercise, followed by periods of low-intensity activity [1]. The game is characterized by a large number of various jumps, sprints, and high-intensity directional changes occurring repeatedly during each rally [2, 3]. Numerous researchers highlight hierarchical importance of certain abilities as volleyball specific abilities, jumping being mentioned most frequently as a dominantly manifested activity and a crucial factor in-game efficiency [4]. Besides jumping, agility is mentioned as crucially needed to successfully defend the court and transition into attack [5], as well as upper body strength, an integral part of every attacking action [6]. Volleyball player’s performance, similarly to any other athlete’s performance depends on a combination of technical and tactical skills as well as an optimum level of general and specific physical fitness [7]. These dimensions are all connected forming an overall athletic profile related to the sport in which athlete competes. Moreover, the need to observe such groups of inter-connected abilities is driven by their confirmed use in talent identification [1].
In contrast with the aforementioned specific abilities, general or basic physical abilities usually include conditions and testing procedures that are somewhat different from the activities in a given sport [8]. Isometric strength is considered to be one of general physical abilities, describing the neuromuscular function through maximal voluntary contractions. Advantages of these procedures include high reliability [9, 10] and controlled conditions, emphasized by the fact that there is not any actual movement. Moreover, this type of testing usually provides at least two variables for analysis: maximal isometric force produced (F
Previous research has demonstrated the importance of F
With the development of isometric strength testing procedures [9], it has become more common for sport practitioners and scientists to monitor volleyball players abilities using this technique. Moreover, the connection of isometric strength testing and abilities which are considered an integral part of the volleyball game has been the topic of a large number of studies [8, 18]. However, almost all of these examinations have observed the influence or a relationship between a single isometric strength test with one specific volleyball performance test. Taking into account that there are more abilities manifested in a game of volleyball, a need emerges for an extensive approach in comparing isometric strength and specific volleyball performance tests. Therefore, in a novel approach, the purpose of the present study was to compare the conjoint results of three isometric strength tests with the results of four specific volleyball performance tests.
Methods
Participants
The subject sample consisted of 80 male (age
Isometric ankle extensors strength measurement procedure.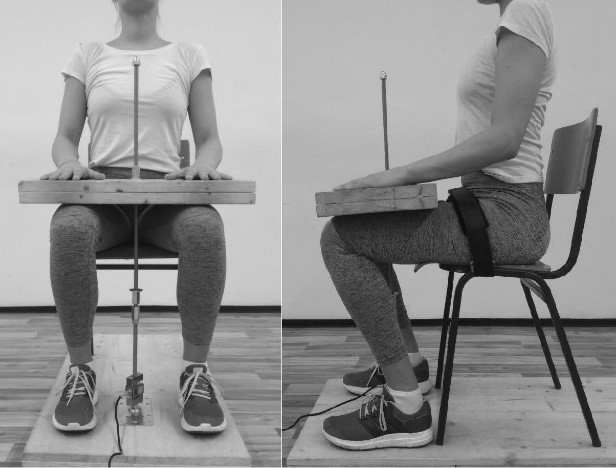
This was a cross-sectional study examining the physical performance data from 6 tests performed with volleyball athletes. Each subject performed two testing sessions separated by a day of rest. During the first day, subjects performed anthropometric and isometric strength tests, and during the second day of testing specific volleyball performance tests.
Body stature and body mass were assessed with a standard anthropometer (GPM, Swiss Made) and a digital scale (FitScan UM-028F, Tanita), respectively. Variables obtained from all isometric strength tests were maximal force (F
Testing sessions consisted of a 5-minute general warm-up, followed by 3 minutes specific warm-up for each test.
Bilateral isometric ankle plantarflexors strength (APF)
Following an explanation of the testing procedure subjects performed two familiarization attempts separated by 1-minute rest and three trials of measuring the maximal ankle extensor muscle force with 2 minutes of rest between trials [7]. In order to evaluate the isometric strength of the APF, participants were seated on the chair with knees and ankles bent, so that the thighs were parallel to the ground, and knees were in line with toes, thereby ensuring the leg position which is similar to the squatting and pre-jumping positions (Fig. 1). Subject’s thighs were firmly strapped to the chair, preventing him from performing any movement in his knees or hip joints. Subjects were instructed to sit on the front 2/3 of the chair, with back straight and legs hip-width apart. The strain-gauge force transducer (Hottinger, Type S9, Darmstadt, Germany; range 10 kN; tensile/compressive sensitivity 2 mV/N) position was exactly between the feet or two points of pressure during the isometric force production of ankle joint extensors. The strain-gauge was firmly fixed to the plate which was under the subject’s feet and connected by a thin metal rod to the plate on subject’s upper leg so that the force of upward plantar flexion push would be directly transferred and recorded by the strain gauge force transducer. The position of the plate on the subject’s upper leg ensured that there wouldn’t be any unpleasant or painful sensations during the testing, which could affect the results. A specially designed software-hardware system (Isometrics Lite, ver. 3.1.1) was used for data collection and processing. The force-time signal was sampled at 500 Hz and low-pass filtered (10 Hz) using a fourth-order (zero-phase lag) Butterworth filter [22]. Gravity correction was provided with baseline force in rest subtracted from all force recordings during an active phase. The onset of the contraction was defined as the point in time where the first derivative of the force-time curve exceeded the baseline by 3% of its maximum value. For the purpose of measurement, the participants were instructed to push as hard and fast as possible against the footplate by plantar flexing their ankle as if pushing on a gas pedal. Subjects performed three repetitions, and the best attempt (highest result of multiplied F
Unilateral isometric handgrip strength (HG)
The test was conducted in accordance with the procedures described in previous studies [13, 23]. Each subject was tested while sitting upright, gripping the measuring device (Fig. 2) with the hand tested, while the arm was extended in the natural posture alongside the body. The hand gripping the device was approximately 5 to 10 cm away from the body. The examinees were not allowed to move from the initial position during the test trial, nor could they lean the hand or the device against the thigh or any other part of the body. The power grip, for which all the fingers are flexed around the device, was chosen as it could produce a higher level of force than the other grips (the precision grip, the manipulative grip, or various tool and pinch grips). The subjects’ handgrip strength was measured unilaterally, to obtain the results for left (HGL) and right (HGR) hand. Subjects performed two repetitions on both hands, and the best attempt (highest result of multiplied F
Unilateral isometric handgrip strength measurement device.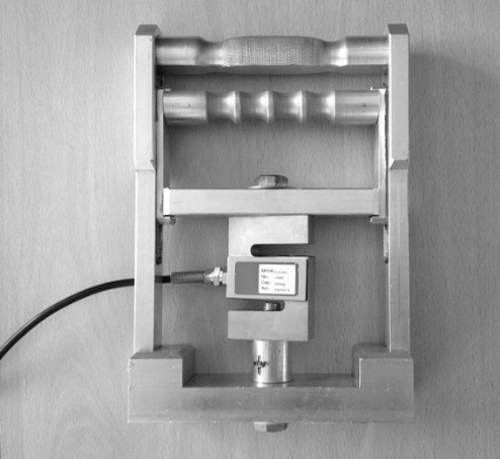
Test for isometric lumbar extensor muscles strength was carried out using a standardized procedure and a dynamometric probe with a structure specially designed for this purpose [7]. Subjects were standing on a platform with feet a hip-width apart, facing a barbell rack. The barbell was firmly attached to a strain gauge force transducer. At its bottom, the probe was connected to the platform. The subjects were grasping the barbell, in position with arms and legs extended at the elbow and knee joints, while the body was in a half-forward bent position, with the chest protruded (Fig. 3). After having assumed a proper body position, subjects were instructed to perform a maximum contraction of the lumbar muscles in an attempt to make the extension movement. The examiner instructed them to lift as fast and as hard as possible. Subjects performed three repetitions, and the best attempt (highest result of multiplied F
Isometric lumbar strength measurement procedure.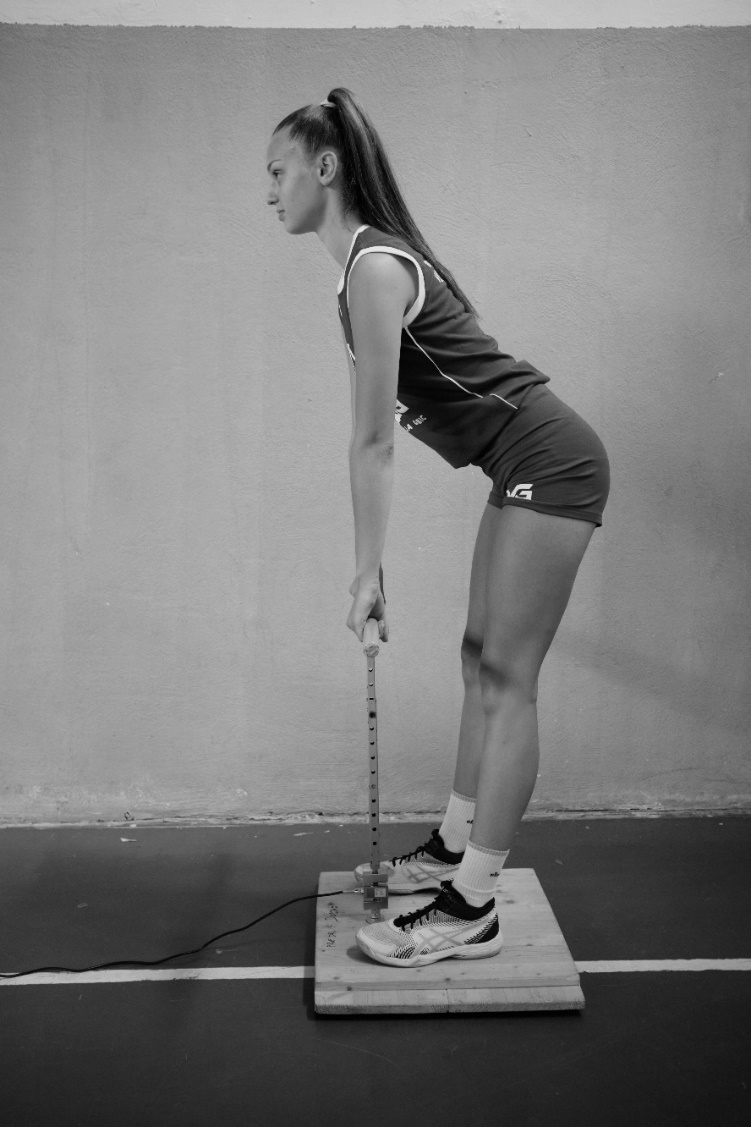
The test was conducted in accordance with procedures described in the literature [4]. The subject started the CMJ in the standing position, with hands on hips. On the signal, he dropped into the squat position, and then immediately jumped as high as possible, without releasing his hands from the hips. The depth of knee flexion used during each CMJ was individually determined by each subject. The Optojump photoelectric cells (Microgate, Bolzano, Italy), which consist of two parallel bars (one receiver and one transmitter unit, each measuring 100
Countermovement jump with arm swing (CMJa)
The test was conducted in accordance with the procedures described by previous studies [4]. The subject started the CMJa in the standing position, with relaxed arms in natural position. On the signal, he dropped into the squat position, and then immediately jumped as high as possible, with the arm swing. The depth of knee flexion, as well as the arm swing, used during each CMJa was individually determined by each subject. The Optojump photoelectric cells (Microgate, Bolzano, Italy), which consist of two parallel bars (one receiver and one transmitter unit, each measuring 100
Modified X test (X)
In order to assess subjects’ agility, we used photocells (PAT 01, Uno lux, NS, Serbia) as a part of the standardized procedure. Subjects had the task to run as fast as they could through five points (A, B, C, D and E) placed so that they shape the letter X (Fig. 4). The initial position of the subject was behind the starting line (dashed line at the A point) on its middle part, and facing the B point. Time measurement started with the subject intercepting the infrared beam, aligned with the starting line (dashed line) positioned in the centre of the square with 4.5 m edges. Subjects were always facing the running direction and performed 4 forward and back distances to each of the corners of the square in the following order: (1) from point A to point B; (2) after 180
Modified X test procedure scheme.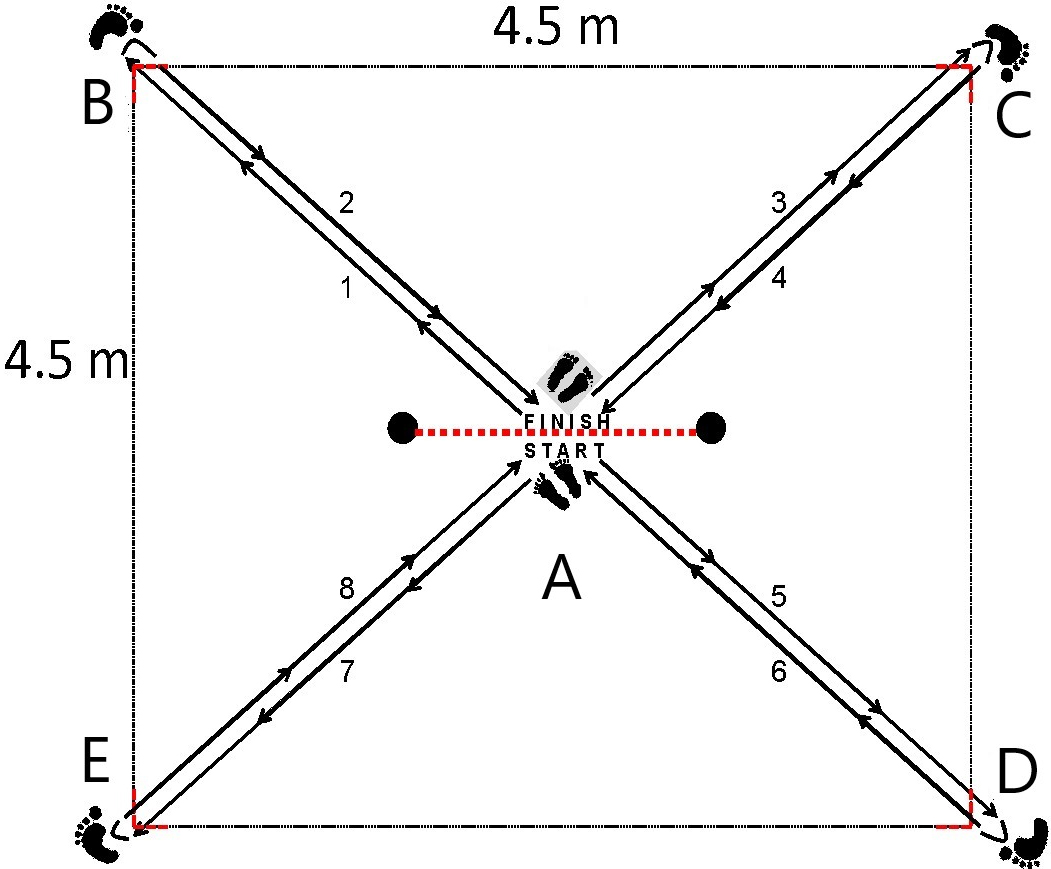
The goal of this test was to measure upper body strength and explosive power. Subjects were instructed to stand behind the line with feet parallel and hip-width apart, facing the direction to which the ball was going to get thrown [25]. The medicine ball (2 kg) was held with both hands. Subjects were instructed to bring the medicine ball back behind the head, then throw it forward as far as possible. The distance in cm from the starting position to where the ball landed was taken as the final result. Three trials were recorded, and the best one was taken for further analysis.
Statistical analysis
All the raw data were initially analyzed by applying the basic descriptive statistical methods in order to calculate the mean value (Mean), the standard deviation (SD), the coefficient of variation (cV%) as well as the minimum (Min) and the maximum value (Max).
Data were evaluated using Keiser-Meyer-Olkin (KMO) and Bartlett’s test, to confirm sphericity of the data for both male and female subjects’ samples and its adequacy. The principal component analysis (PCA) with the explorative model was used to determine the main factors underlining the general and specific physical abilities data matrixes, as well as each components’ contribution to the factor variability. PCA (Bartlett method) was also used for defining general physical abilities by multidimensional transformation into one score number (F
Descriptive statistics of both subject samples
Descriptive statistics of both subject samples
Abbreviations: HGR
Principal component analysis structure matrix
Abbreviations: HGR
Pearson correlations results between single variables of both samples
Abbreviations: HGR
Regression analysis results of F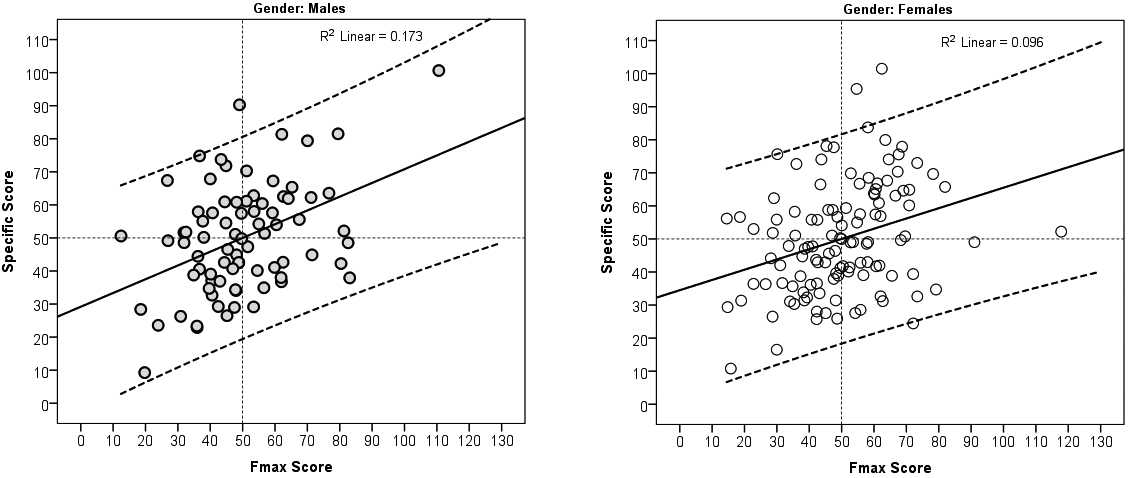
Regression analysis results of RFD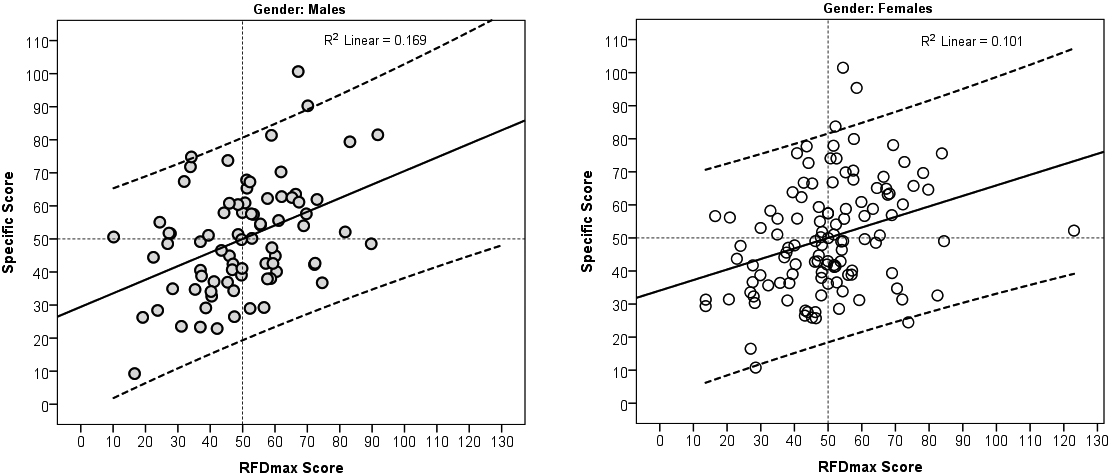
Pearson Correlation was used to determine the levels of the relationships between the individual test results, as well as the correlations between Score values of variables from isometric strength testing and specific physical abilities area. After that, Simple linear regression was used to investigate the influence of F
All the statistical analyses were calculated using the SPSS 22.0 software, while statistical significance was defined at the level of a 95% probability, for the value of
The results for the PCA are presented in Table 2. The initial KMO analysis has shown a high enough sampling adequacy, at the level of 0.666, indicating that the PCA was justified. Bartlett method indicator was statistically significant (Sig.
Pearson correlations between Score values of both samples
Pearson correlations between Score values of both samples
The correlations between the individual variables shown in Table 3 were statistically significant in 48/66 cases for both samples, with X test correlating significantly with other tests the least for female sample (2/11), and CMJ for male sample (5/11). Correlation coefficients were ranging from low (
The regression analysis showed 17.3% and 9.6% influence of F
The main findings from our study suggest that the results from isometric strength tests, as well as specific volleyball performance tests, can be grouped into a single factor each (Table 2) with principal components explaining variances ranging 51.4–64.9%. Calculated score values from the isometric strength tests had low, but statistically significant correlations with specific abilities score (Table 4). The main observed relationships between the individual variables of men were the high coefficients of correlations between F
The present isometric handgrip results of volleyball players (Table 1) are comparable with those reported in previous studies which focused on similar groups of subjects [6, 26, 27, 28]; the F
Isometric strength is believed to have a moderate relationship to volleyball specific abilities, which is well documented for HG tests associated with upper body strength (
Dimension reduction has been previously suggested by the authors [41] to be used for a better understanding of the relationships between different groups of abilities. This procedure makes it possible to unite a greater number of physical abilities, describing a certain sport, into a single Score value comparable to other variables. Although previous PCA [42] studies on vertical jumping accounted for a higher percentage of variance (ranging from 74.1% to 78.8%) the reliability scores of the extracted rotated principal components revealed the validity of our findings (Table 2). PCA grouped variables describing the general physical abilities (F
Low to moderate relationships were also reported in the previous studies [8], with slightly stronger correlations for RFD
One limitation of the present study is the unequal gender sample size, a consequence of more female volleyball players being able to participate in the study. Another relate to the age of the participants, around 16, thus not allowing generalization into adult volleyball players.
Conclusions
The main finding of this study is that findings derived from general isometric strength tests are not related to those obtained from specific volleyball performance tests. On the other hand, isometric strength tests of the type described in this study are easy to perform using affordable yet accurate devices which may provide some relevant information regarding Fmax and RFDmax, especially with respect to lumbar and plantarflexion strength. Especially, in case of an injury to specific body parts (e.g. back or ankle), the availability of results recorded in a systematic way (e.g. once a year using the same protocol), enables comparison to pre-injury level, when functional tests cannot still be performed. This may be a substantial advantage in this sport which presents with a significant rate of injuries [44].
Author contributions
CONCEPTION: Nikola Majstorović, Goran Nešić and Milivoj Dopsaj.
PERFORMANCE OF WORK: Nikola Majstorović, Vladimir Grbić, Zoran Savić and Aleksandar Vićentijević.
INTERPRETATION OR ANALYSIS OF DATA: Nikola Majstorović.
PREPARATION OF THE MANUSCRIPT: Nikola Majstorović and Goran Nešić.
REVISION FOR IMPORTANT INTELLECTUAL CONTENT: Nikola Majstorović and Milivoj Dopsaj.
SUPERVISION: Goran Nešić and Milivoj Dopsaj.
Ethical considerations
The study was conducted in accordance with the requirements of the Helsinki declaration and recommendations guiding physicians in biomedical research involving human subjects [21]. The research was approved by the Ethics Commission of the Faculty of Sport and Physical Education, University of Belgrade (Number 484-2). Written informed consent was obtained from all participants.
Funding
The study was partly supported by the grant III47015 of the Research Council of the Republic of Serbia.
Footnotes
Acknowledgments
None.
Conflict of interest
No potential conflict of interest was reported by the authors.