
Abstract
BACKGROUND:
Flywheel (FW) load represents a new trend among resistance exercise (RE) modalities; however, protocols and acquisition systems to measure FW-RE parameters are not yet fully researched and developed.
OBJECTIVE:
To assess the reproducibility and criterion validity of a prototype FW-RE acquisition system.
METHODS:
Thirty-eight student volunteers completed the low-row FW testings with a test-retest break of 1 week. Force (F), power (P) and velocity (
RESULTS:
An excellent correlation was found between FW and LC parameters (
CONCLUSIONS:
The FW device and acquisition system described in this study has shown adequate criterion validity and good-to-excellent reproducibility of mechanical RE parameters for sports-diagnostic purposes. However, a familiarization session is necessary to obtain true measurements of a performance when using the FW based assessement in women.
Introduction
Flywheel (FW) load presents a new trend in resistance exercise (RE) modalities. In contrast to weight-stack load, the angular momentum (AM) of the wheel, which is created in the concentric part of a muscle contraction on a FW device, causes episodes of increased muscle activation [1] and produces higher mechanical forces (F) and power (P) in the eccentric part of the contraction [2]. This phenomenom, known as “eccentric overload” [1, 2], increases the efficiency of exercising because of all the positive effects of eccentric contraction [3]. Even though superiority to gravity-depended load is questionable, FW training was shown to be effective in developing muscular hypertrophy, maximal strength, power and functional tests in the vertical and horizontal plain [4]. Given that muscular adaptations were brought about with markedly fewer repetitions in the FW compared with gravity-dependent load, it seems that flywheel training can be recommended as a particularly time-efficient exercise paradigm [5].
Establishing the reproducibility and criterion validity of an apparatus is the first step in ensuring the interpretatibility of findings relating to human muscle performance [6]. While the presence and magnitude of the overload between FW loading conditions in training has already been examined [7, 8], and strength and conditioning coaches already and regularly utilise this training tool [3, 9, 10], the study of the reproducibility and validity of FW-RE parameters, measured using different tools, is still lacking [11]. However, assuming equal conditions and ideal reproduction of the test scores, the analysis allows one to state with statistical confidence, based on a previous reproducibility study, whether a change (difference) in the scores reflects normal fluctuations (the confounding part) or if that it is the result of an exercise protocol or rehabilitation intervention [6].
The main difference of a FW load with respect to gravity-dependent load resistance exercise is that in FW exercise the force does not have a constant gravitational component, so, in these devices, the resistance is proportional only to acceleration. Power and force can vary depending on the speed and technique of the execution, even with the same FW used. The principle of measuring force (F), power (P) and work (W) on a flywheel device relies on the measurement of the flywheel’s angular acceleration (
Recently, there has been an increase of interest on the market for FW devices – especially in the fields of research, sports and health care. There have also been some measuring systems used that were never validated, thus the absolute values and reproducibility of gathered information could be misleading in exercise parameters characterization, load prescription and exercise results interpretation. This study assessed the measurement characteristics of a prototype FW acquisition system. The main goal of our research was to assess test-retest reproducibility and criterion validity – comparing the observed values with a load cell (LC) – so the prototype system could be safely used in training and research purposes.
Methods
Participants
A sample of 36 healthy recreational athletes, 18 women and 18 men, students in a Faculty of Sport, with no history of upper extremity injuries volunteered to participate in the study. All participants completed the first and second bout of FW-based testing with a test-retest break of 1 week. The baseline characteristics of men were: age 20
Study protocol
The study was designed as a criterion-related validation study and reproducibility study in a test-retest manner, with a 1-week break period between the two tests. At the start, body mass and height were measured at the testing facility. Measurements were performed on a custom-made low-row FW device using a low-row handle. We used a single FW load with mass moment of inertia (MMI) 0.072 kg
Technical drawing of the custom-made FW device and measuring system.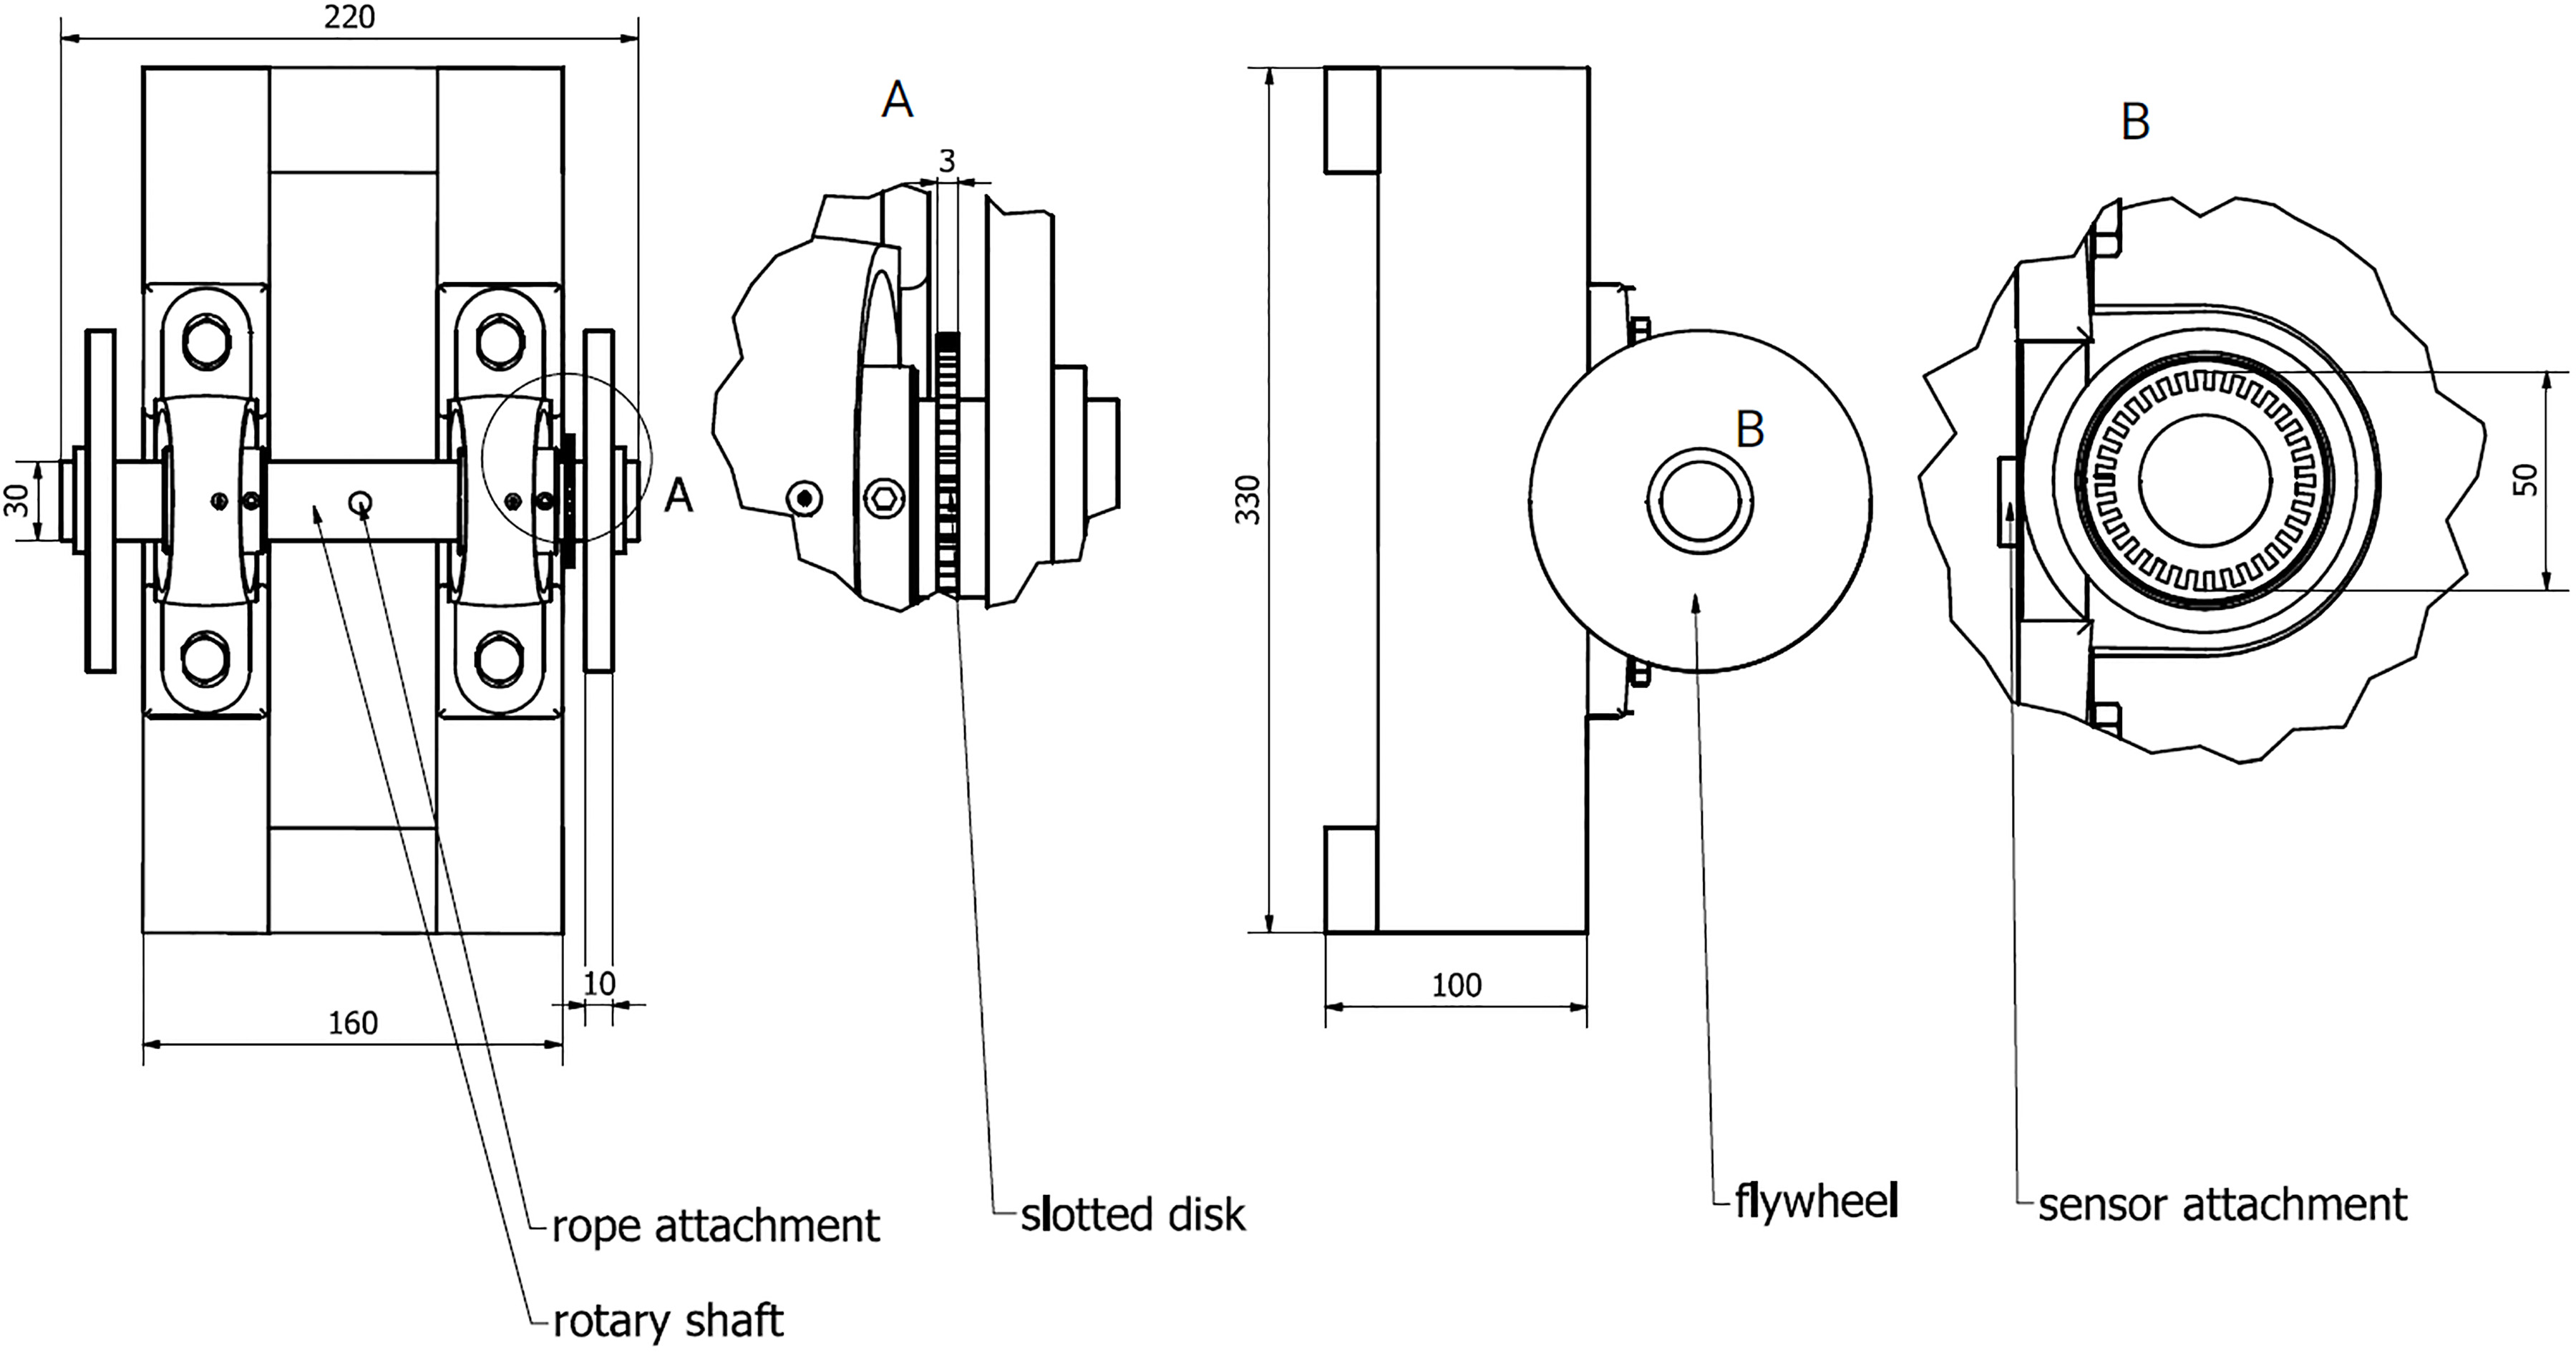
Before the experiment, a familiarization protocol was implemented to introduce participants to inertial FW training. All tests were preceded by a standardized warm-up and performed at the same time of the day (
The test and retest were performed with the participants in the same sitting (low-row) position (Fig. 2). After the general warm up, each subject performed 10 submaximal low-row repetitions as part of a special warm up. During the testing, subjects performed 3 introductory and 5 “all out” [12] repetitions; prior to that it had been established that the number of repetitions that should be performed to maintain high power output values varies between 5 and 12, and that it was partially influenced by the inertial load used [7]. Participants were verbally encouraged by the investigator to exert their maximal effort. The exercise execution amplitude was individually adjusted, and it was equalized among sessions. Subjects performed two sets on each visit, with 60 seconds of rest between the sets and were evaluated by the same experienced examiner.
Testing setup. The participant in the standardized upright-sitting (low-row) position when executing horizontal pulls.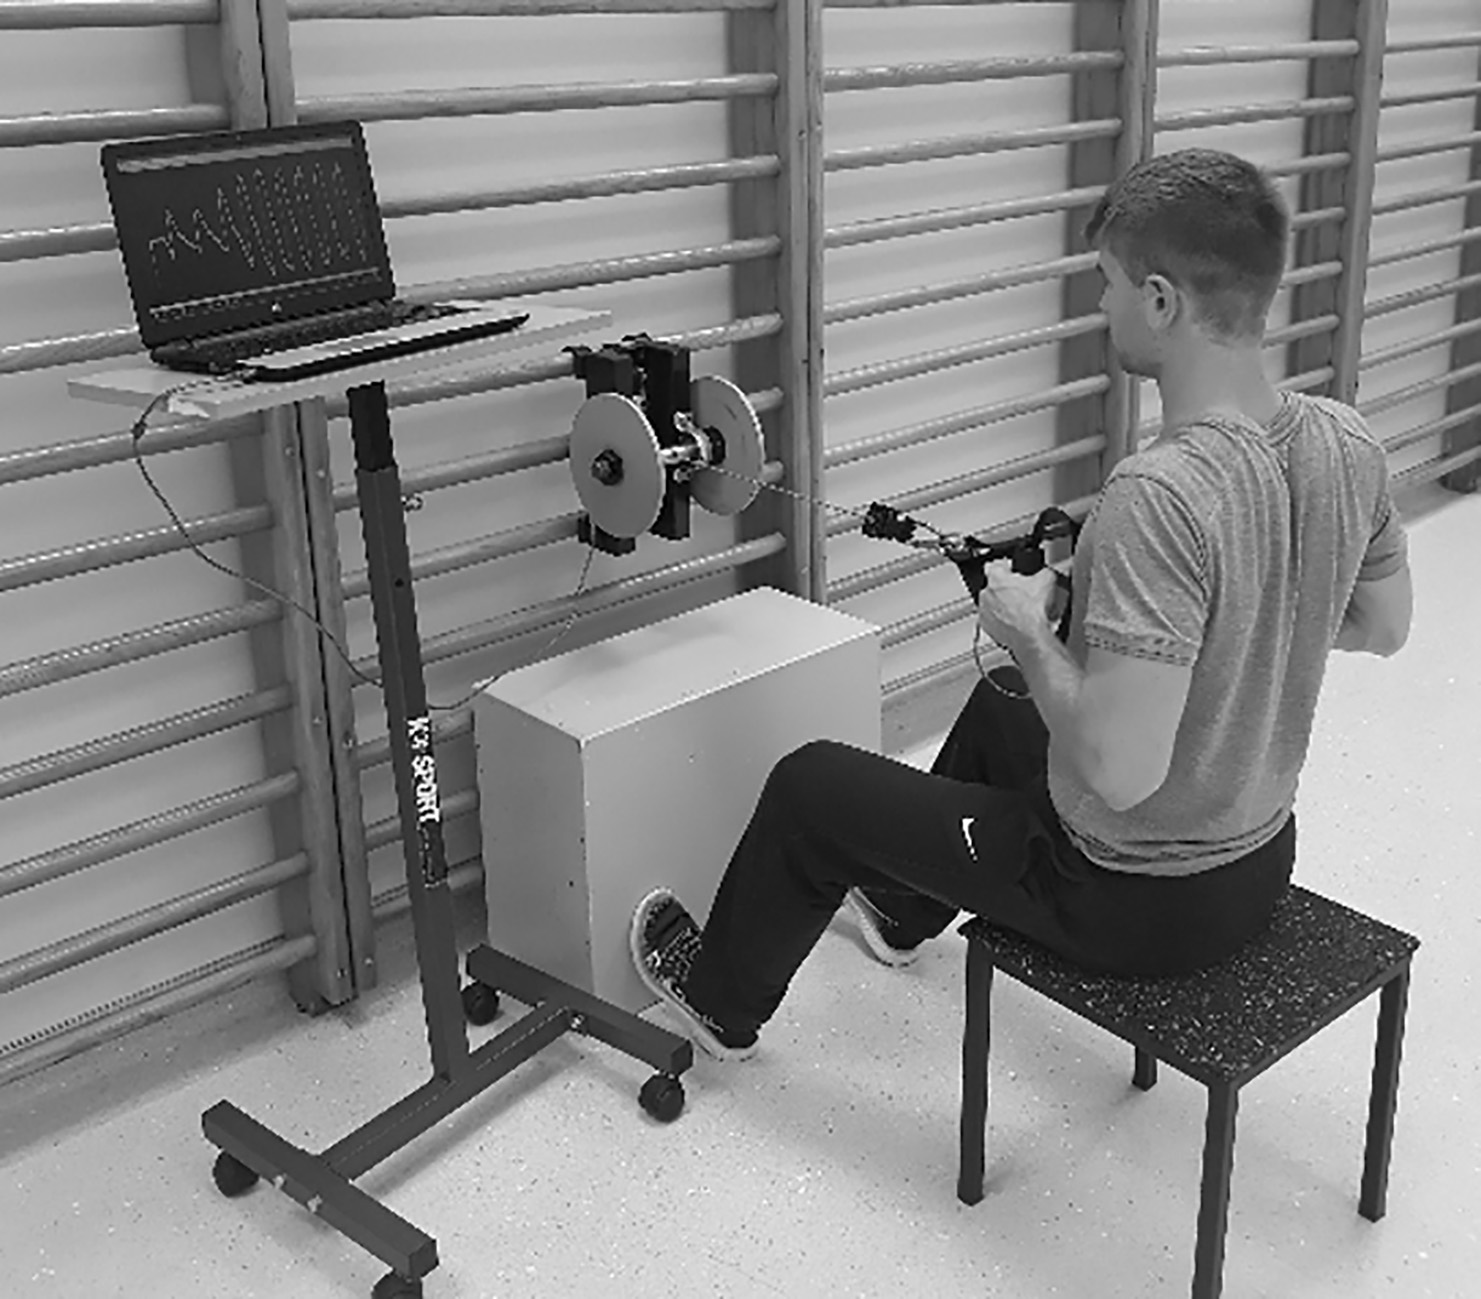
Validity measurements for men
FW – flywheel; LC – load cell; F
Parameters were simultaneously collected using a pilot, custom-made FW data acquisition system and with a reliable and precise LC (Force sensor, Forsentek Co., Shenzhen, China) mounted on the pulling rope; these represented the criterion measure. The pilot system was based on signals, originating from a photocell sensor (Slot-type Optocoupler Module Speed Measuring Sensor for Arduino/51/AVR/PICCG, JingJiang, China) that detects the holes in a slotted disk (diameter 50 mm, 35 teeth) mounted on the flywheel shaft. Signals from the FW acquisition system were recorded at 100 Hz, interpolated (1000 Hz) and then, together with the LC signal, smoothed using a low pass filter. Parameters from the pilot FW acquisition system followed the fundamental Newton’s laws and were calculated as follows: v
Validity measurements for women
FW – flywheel; LC – load cell; F
Reproducibility measurements of the FW and the LC RE parameters for men
d
Reproducibility measurements of the FW and the LC RE parameters for women
d
The mechanical variables used for data analysis were peak concentric (peak con F) and peak eccentric force (peak ecc F), mean concentric force (mean F), mean linear concentric velocity (mean v), and mean concentric power (mean P). The repetition with the highest peak con F value from each of the two test sessions was used in further analysis. Data was entered into a master spreadsheet (Microsoft Excel) and were calculated using the IBM SPSS Software for Windows (version 25, SPSS Inc., Chicago, IL, USA). Parameters were presented as means and standard deviations. All parameters were firstly checked for outliers and for normality of distribution with Shapiro-Wilk’s test. Paired samples
The qualitative assessment of systematic changes between testing systems and test-retest means were performed using Bland-Altman plots [15]. These graphs can illustrate systematic variations around the zero line and address the issue of heteroscedasticity, which occurs when the inter-device or inter-session differences are not equal to the mean value of the measurements. The significance level was set at
Results
There were statistically significant intra-device mean differences between the variables: peak con F, peak ecc F, mean F and mean P. LC in general provided lower values in men (Table 1) and women (Table 2), excluding mean velocity. Significant Pearson product moment correlations for a FW acquisition system and a LC parameters were very strong for men (Table 1) and women (Table 2).
Table 3 presents the ICC, the absolute and the relative reproducibility statistics for men. The evaluation of ICC for the FW acquisition system parameters, based on the 95% confidence interval of the ICC estimate, revealed good-to-excellent test-retest agreement. The LC parameters revealed moderate-to-excellent test-retest agreement. The SEM values reached up to 121 N (4.0%) for peak ecc F and SRD up to 0.045 m/s (12.2%) for mean velocity in the case of LC parameters.
Bland-Altman plots for qualitative inter-device measurement agreement for test and retest measurements for men and women. Inter-device differences (diff) are plotted against the means of the two measuring devices for the measured mechanical parameters. The solid line represents the mean and the dotted lines the limits of the agreement (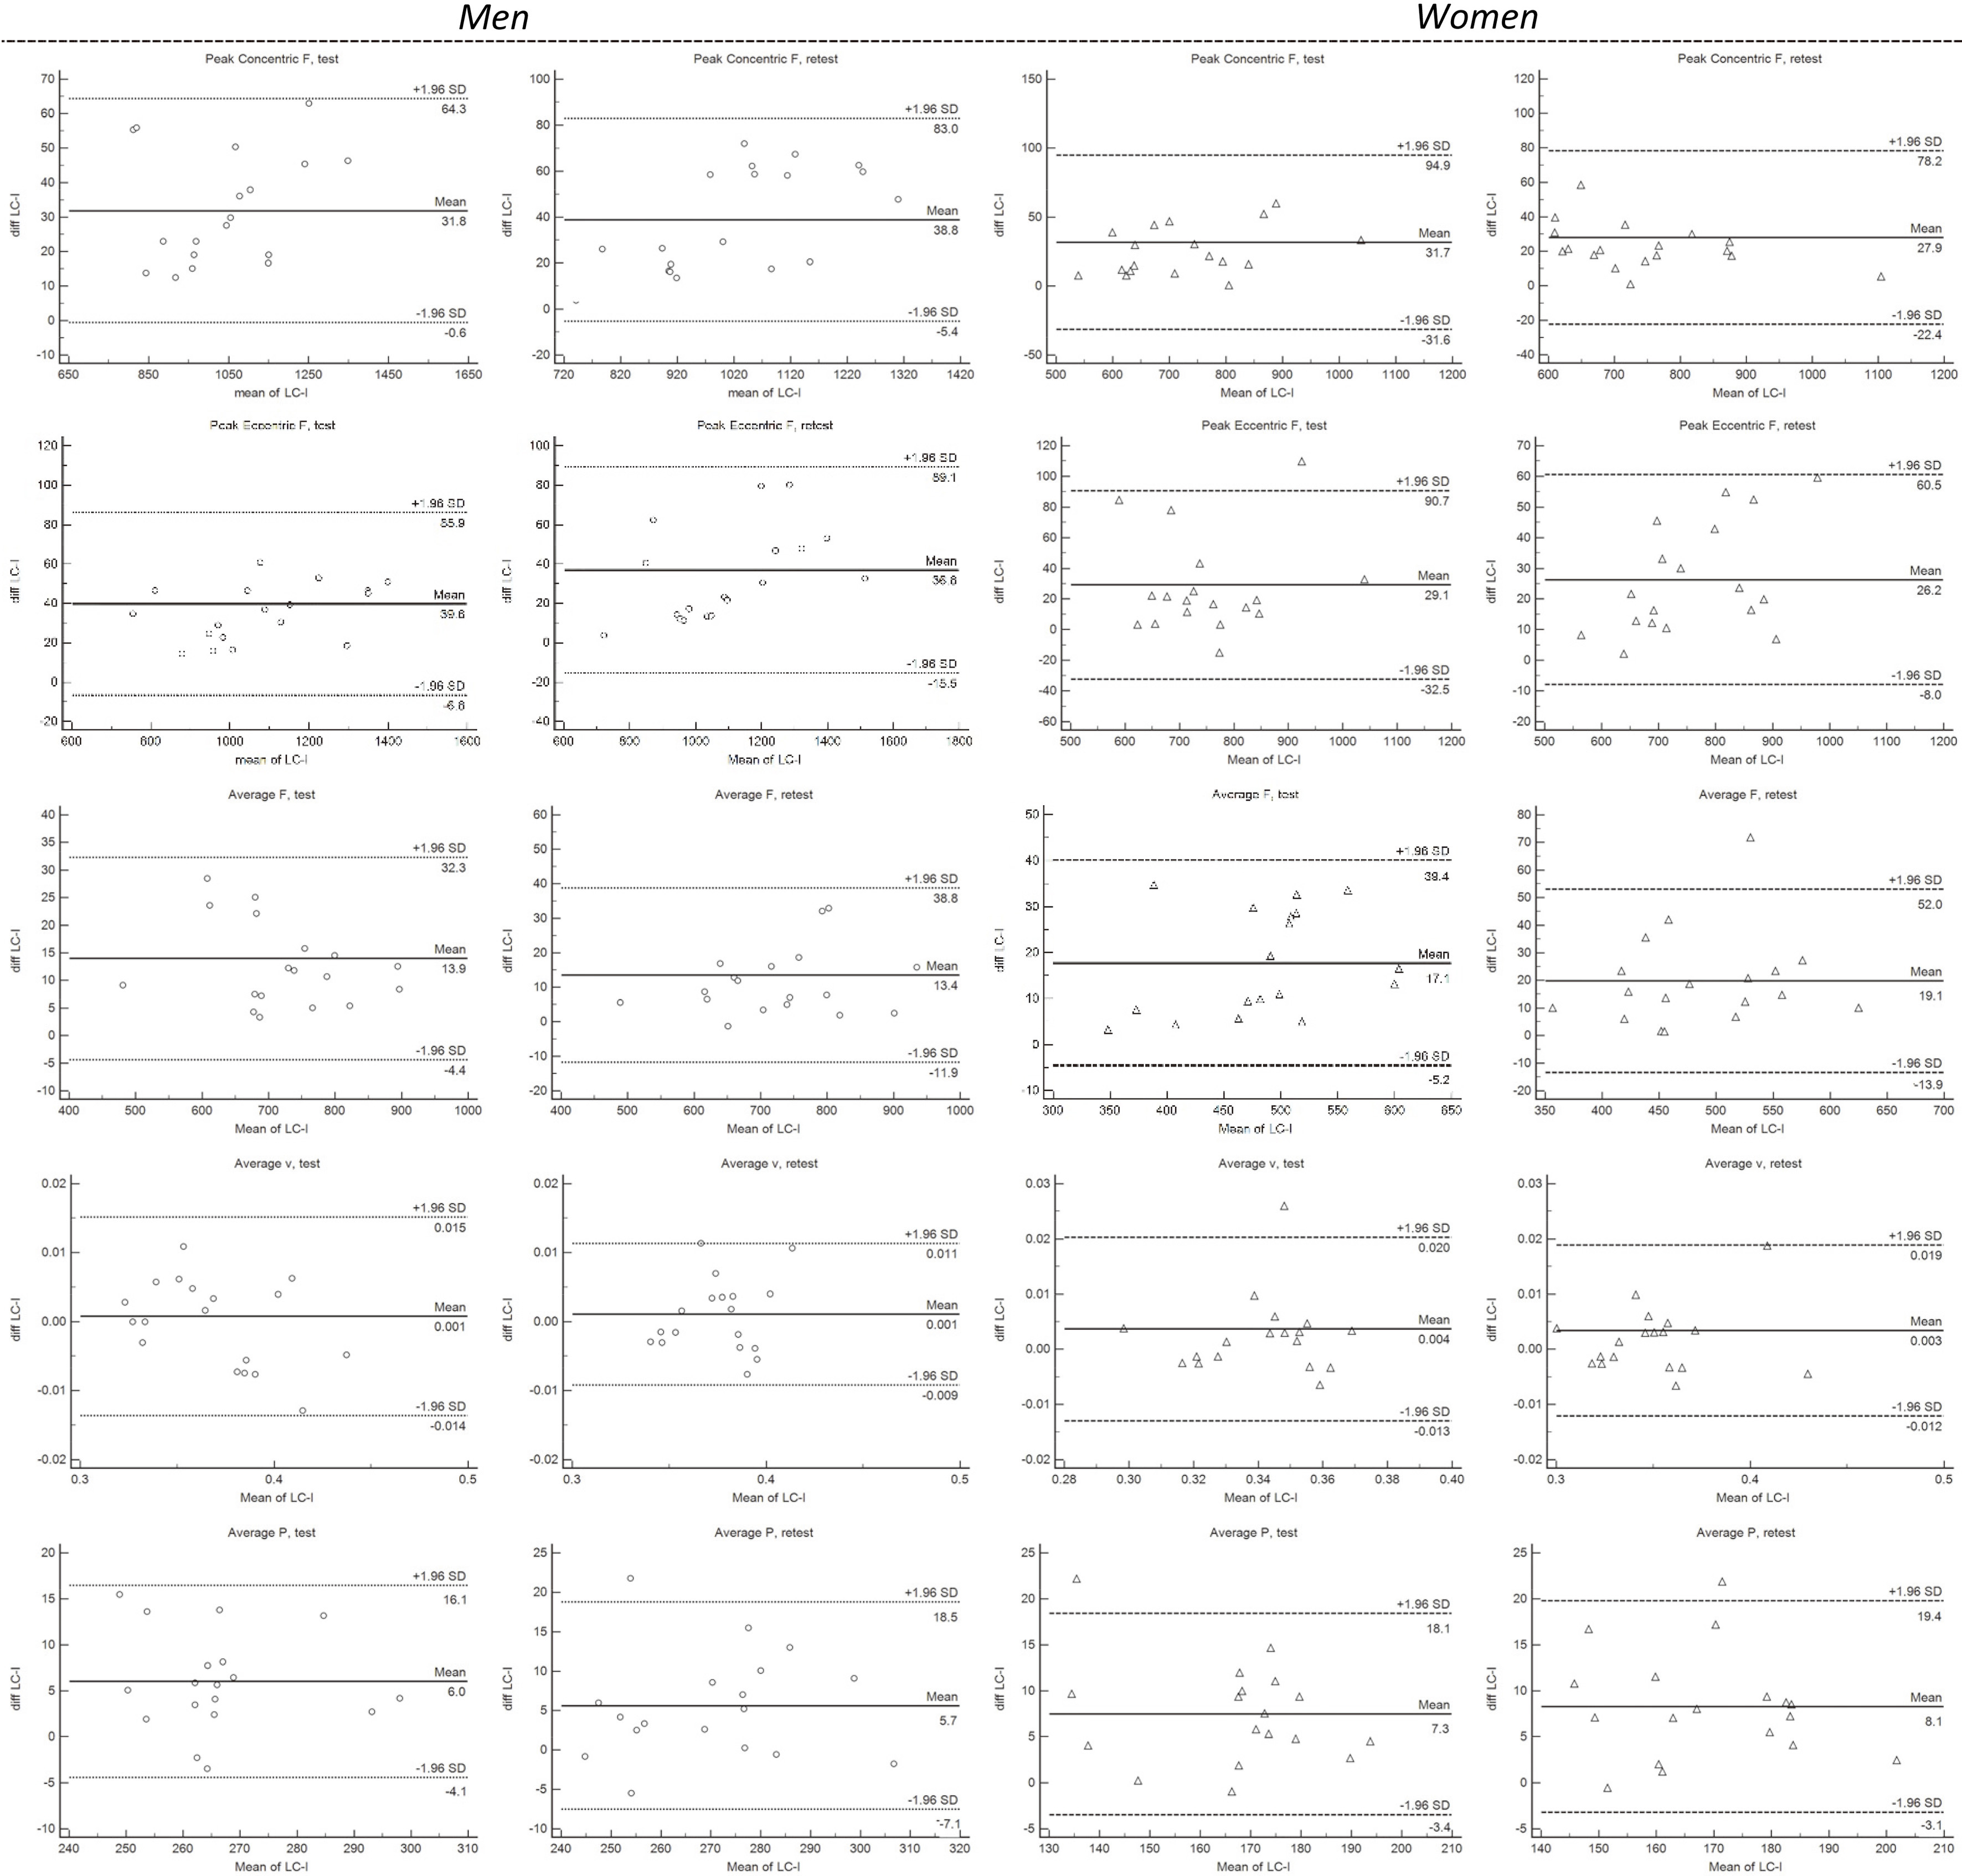
Bland-Altman plots for qualitative test-retest measurement agreement for men and women. The test-retest differences are plotted against the means of the two test sessions for the measured mechanical parameters. The solid line represents the mean and the dotted lines the limits of the agreement (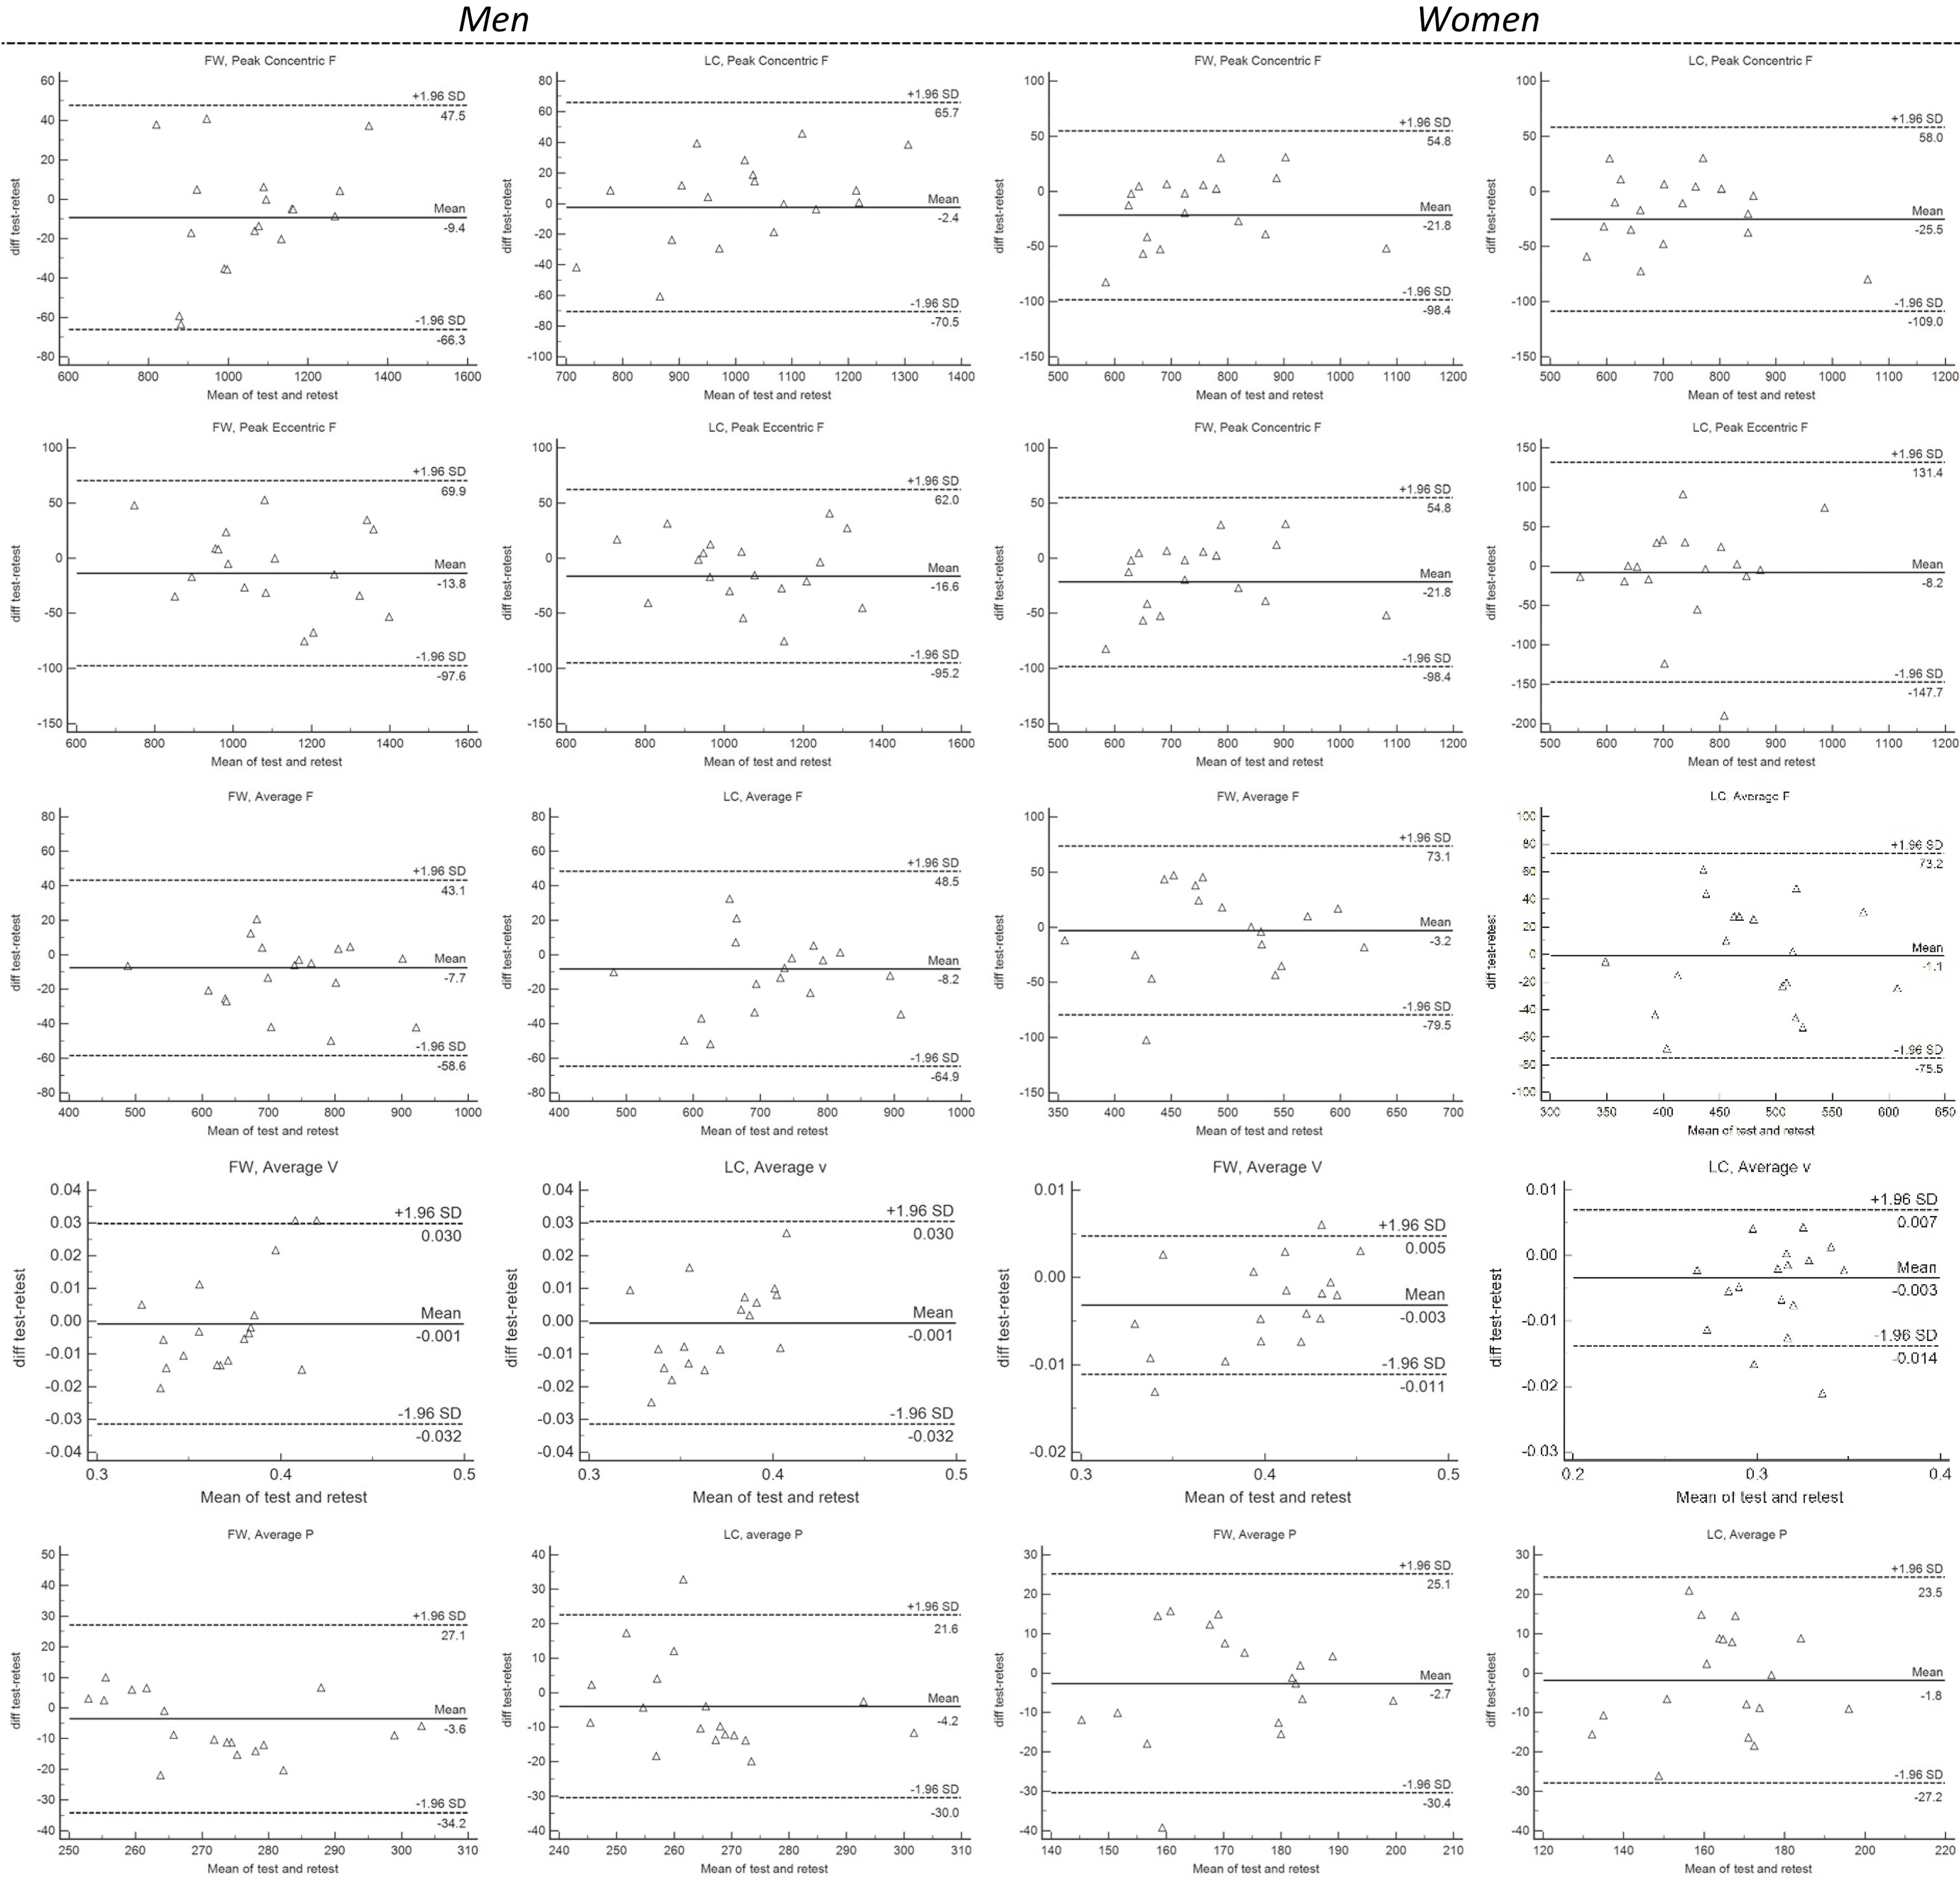
In terms of the reproducibility for women (Table 4), the ICC for the FW acquisition system reveals moderate-to-exellent test-retest agreement for all parameters. Values were lower in the first session, indicating a different performance between test and retest regardless of the measuring system used. The SEM values reached up to 63 N (8.2%) for FW peak ecc F and in the case of SRD up to 192 N (25.1%) for LC peak ecc F.
Furthermore, the qualitative results via Bland- Altman plots showed homoscedasticity in all measured parameters in the case of test and retest measures. There was evidence of systematic positive bias comparing FW acquisition system to LC values in men and women (Fig. 3) namely – there were generally more values above the zero line than below it, illustrating significantly higher peak con F, peak ecc F, mean F, mean v and mean P measured using the FW acquisition system.
Finally, the Bland-Altman plots showed good agreement between test and retest observations and homoscedasticity in all measured parameters for men and women (Fig. 4). There were generally more values below the zero line than above it, illustrating significantly higher values observed during the retest.
The primary finding of our study was that the custom-made FW acquisition system for measuring RE parameters and the testing protocol used have shown an excellent correlation to LC parameters (
Up until now, only a few studies have been specifically designed to assess the reliability or criterion validity scores for specific training parameters during flywheel exercises [11, 16]. Carrol et al. [8] showed a very high intra-session ICC for mechanical parameters (ICC
The high correlation between the prototype FW device’s aquisition system and the LC support the costum-made device’s validity in measuring the RE variables, albeit some statistically significant inter-device mean differences in test and retest sessions were found. A number of issues arise from this finding. The bias could be the effect of the indirect parameter calculation from angular frequency. Moreover, the mechanical factors, such as a loose load cell attachment between the handle and the rope, variability in starting position and tempo of the exercise execution could influence the testing result. It should be noted that, although the mean bias observed in our research was significant, the magnitude of this bias was relatively small (up to 4.2% for peak con F among women).
In spite of the high ICC values, we may still not infer that a test is suitable for clinical practice. A test should display small measurement errors [18] and should be able to identify real changes in groups and individuals [19]. With respect to the reproducibility of the findings, a very striking finding was the differences in the SEMs between men and women, which indicate a genuinely greater error margin in measuring RE parameters when using the FW device in the latter group. The SRD in relation to the mean (SRD%) was calculated to check if the test could detect real strength changes in individuals, as it could be more easily interpreted due to its independent units of measurement [6]. The SRD% scores for the FW system ranged from 4.9–10.5% for men and 4.4–22.7% for women. These values seem reasonably low to detect real changes in F, P and v parameters in a group of individuals in sports-diagnostics settings [3, 4, 20, 21], while the use in clinical settings is questionable, due to a higher measurement error. This is especially true for women. We assume that it is likely that multiple familiarization sessions are necessary to obtain true measurements of a performance when using the FW based assessment among subjects unfamiliar with this modality prior to any clinical decision making. Finally, in this study, we were not monitoring whether repetitions were executed with maximal effort. We believe that it would be useful to provide real time monitoring of consecutive repetitions using coefficient of variation as potential parameter, as is used in some isokinetic dynamometers.
Given the great number of athletes, conditioning professionals and researchers employing FW-RE paradigm, studies assessing P, F, v which are produced during FW-RE using different MMI are still warranted. The FW device’s measuring system together with reproducibility information gained from our study could help toward fine-tuning and personalizing FW-RE training protocols for a wide range of exercises and people, from elite athletes to patients suffering from various diseases [20].
To sum up, based on the ICC values, it can be concluded that the custom-made FW device and acquisition system used in our study showed adequate validity (compared to a load cell) and good-to-excellent test-retest reproducibility for mechanical parameters. Trivial, although significant mean bias was found. These findings suggest that mechanical parameters calculated based on signals from low-cost frequency-based sensor demonstrate acceptable levels of validity and reproducibility for sports-diagnostic and training purposes, and as a foundation for future experimental work. Still, future research is needed in order to assess the test-retest reproducibility, in order to make it possible to detect changes that indicate real improvement in clinical settings due to higher measurement error found in our study.
Footnotes
Acknowledgments
Authors would like to thank all participants for their efforts during the study. TK received a research fellowship from the Slovenian Research Agency for PhD studies (Grant No. 630-72/2019-1).
Conflict of interest
The authors declare that they have no conflict of interest derived from the outcomes of this study.