
Abstract
BACKGROUND:
Validity may refer to the inter-workout similarity of data from novel hardware to a device deemed the “gold standard”. The degree of familiarization to novel hardware may impact subsequent validity outcomes produced from repeated workouts.
OBJECTIVE:
To compare physiological, performance and perceptual variables to squats done with a barbell to those done with an exoskeleton intended as hardware for manned space flights.
METHODS:
Subjects made four laboratory visits. They did two familiarization sessions on the exoskeleton, followed by two workouts in which the sequence of the exercise hardware examined was determined by a coin flip. Per workout they did four repetitions each against four loads (23, 34, 45 and 57 kg) separated by 90-second rests. For the final two visits the same dependent variables were obtained before, during and after workouts. Z-scores identified outliers that were eliminated from further analyses. Dependent variables were compared with paired t-tests, Cohen’s d effect size, Bland-Altman plots and Pearson product moment correlation coefficients.
RESULTS:
Less than 1% of our data were outliers. Values for our dependent variables generally exhibited considerable inter-workout similarity.
CONCLUSIONS:
Exoskeleton findings were similar to those from a barbell and warrant continued inquiry, such as with microgravity simulation in human subjects.
Introduction
For new exercise hardware validity, which refers to the similarity of its data to a device deemed the “gold standard” by practitioners, must be established before novel equipment are accepted by the scientific community [23]. Perhaps this is most true for hardware to be used during space flight, as microgravity is a novel setting in which humans incur significant muscle mass and strength losses [5, 20]. Hardware to abate in-flight losses must impart sufficient resistance with minimal space, mass and power needs in order to comply with the space craft environment. They include a robotic exoskeleton (Institute of Human and Machine Cognition; Pensacola, FL, USA) that enable squats to be performed without requiring gravity to operate or is impacted by a user’s body mass. This is achieved by a pair of actuators that create a loading stimulus independent of gravity. A side view of the exoskeleton, and depiction of squats done on the device, appear in Fig. 1. Hardware validity is impacted by the degree and type of familiarization given prior to testing [10, 28, 32]. Familiarization aims to limit learning effects with repeated testing to reduce systematic errors to the eventual data collected [28].
Side view of the exoskeleton and a depiction of squats done on the device.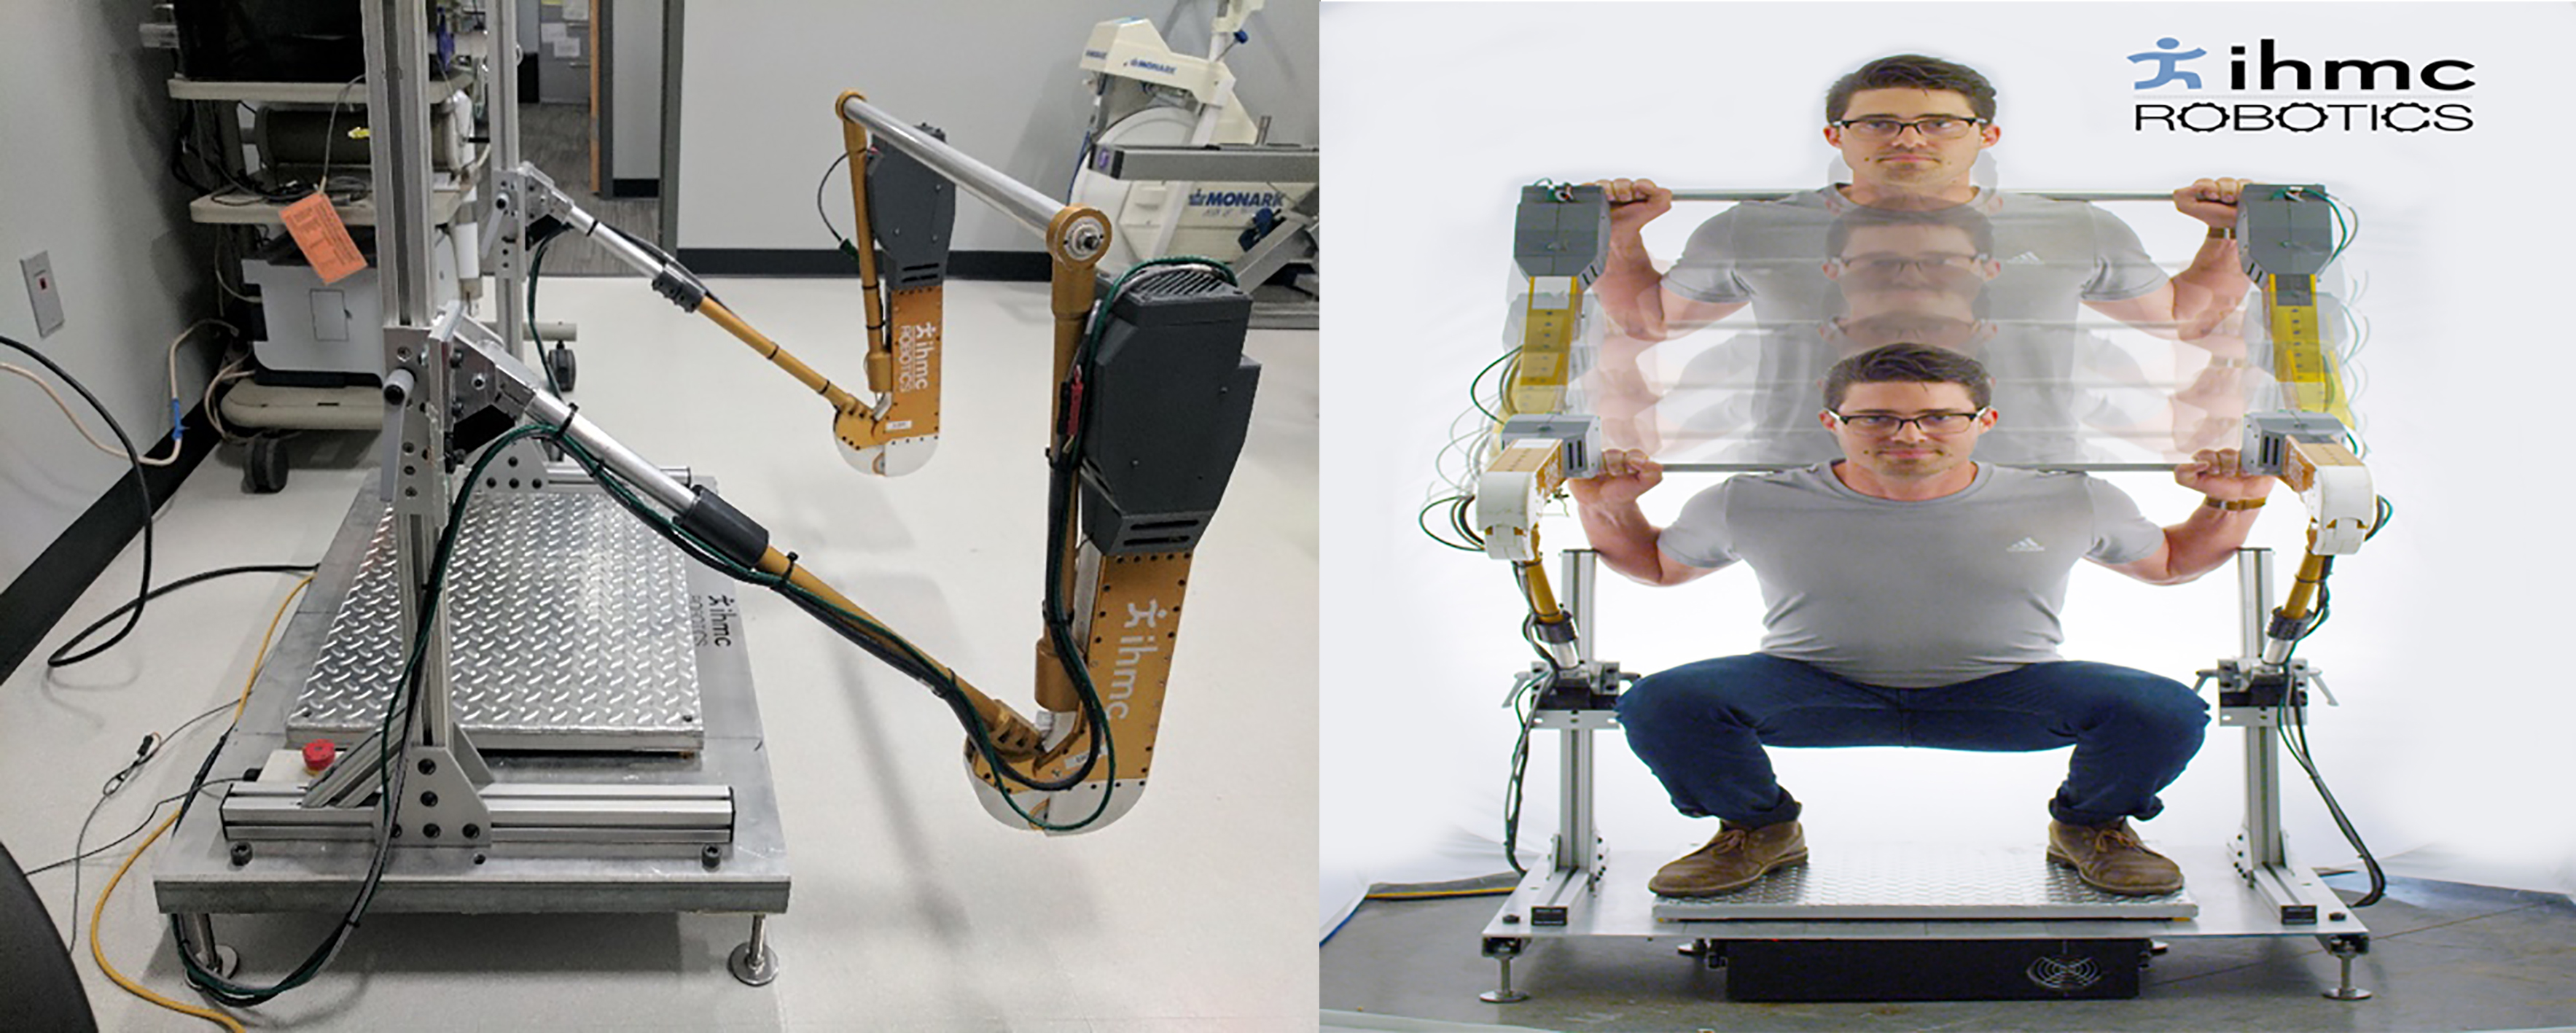
To date however, only one published paper examined the validity of the exoskeleton’s squat data [27]. That paper used Z-scores to identify outliers, and t-tests, Cohen’s d and Pearson product moment correlation (PPMC) coefficients to compare data from separate workouts done with the exoskeleton and a barbell [27]. Results included a large range of values. Roughly 10% of the total data set were outliers. Average t-test, Cohen’s d and PPMC values were 1.6, 0.51 and 0.37 respectively. The lower validity was attributed to the lack of familiarization to squats done on the exoskeleton, as the device was only available to the investigators for a limited time [27]. It was concluded more research was needed before exoskeleton could serve as in-flight hardware.
Familiarization reduces the intra-subject, and ultimately inter-workout, variability seen in studies that include repeated testing [10]. Intra-subject variability may be considered the most important type of measurement in validity studies [10]. As test data is collected, prior familiarizarion should improve data stability and validity of the device under inquiry [14, 15]. Familiarization may abate learning effects prior to repeated testing, yet some think it is not necessary [10, 26, 39]. Differences may be related to methodological issues. Some claim if familiarization entails a fixed protocol whereby a set number of repetitions and/or trials are practiced, it does not adequately address intra-subject variability, as individual subjects learn study-specific tasks at different rates [10].
Robotic exoskeletons, like the one in Fig. 1, are under consideration for use during long-term space flights such as manned missions to Mars. Yet the lack of familiarization, which likely led to higher intra-subject variability and lower validity values in the prior study, reduces the likelihood of the Fig. 1 device’s use as in-flight hardware [27]. The objective of our study was therefore to compare physiological, performance and perceptual responses derived from squats done on the Fig. 1 exoskeleton to those from a barbell, whereby the latter serves as the “gold standard”. Similar inter-workout responses help establish the exoskeleton’s validity and may improve the likelihood of its use for long-term manned space flights. Unlike the prior study [27], our subjects performed two familiarization sessions on the exoskeleton prior to two workouts. We hypothesize that squats on the exoskeleton, with familiarization prior to testing, will evoke similar inter-workout responses as those produced when the same exercise is done with a barbell.
Subjects
The study was approved in advance by The University of Louisville’s Institutional Review Board. Subjects (11 men, 4 women) gave informed written consent, and filled out a medical questionnaire, before participating. They were free of the following conditions: diabetes, asthma, hypertension, tachycardia, ischemia, arrhythmias, hyperthyroidism, and convulsive disorders. Since our study does not entail inter-gender strength comparisons, but instead compares the similarity of inter-workout values from squats done with a barbell and exoskeleton, we took the liberty to include men and women in our sample.
General experimental design
Per subject, our study has four laboratory visits. The first two were familiarization sessions in which subjects squatted on the exoskeleton in order to become accustomed to the device; first sessions included anthropometric data collection prior to the exoskeleton squats. The last two visits were workouts whereby subjects squatted against resistance provided by one type (barbell, exoskeleton) of hardware. Per subject, a coin flip determined workout sequence. It was workouts where the dependent variables that comprise our test data were collected.
Anthropometric data
The following anthropometric data were obtained from subjects as they stood barefoot in a relaxed upright posture: height, body mass, as well as upper, lower and total leg lengths. Height and body mass were recorded from a stadiometer (Detecto; Webb City, MO, USA). Leg lengths were measured in triplicate with a cloth tape from the left side of subject’s bodies and averaged. Total leg length measurements were the distance from the anterior superior iliac spine to the lateral malleolus of the fibula. Upper leg lengths equaled the distance from the anterior superior iliac spine to the inferior surface of the femur’s lateral condyle. Lower leg lengths spanned the distance from the fibula’s head to the lateral malleolus. Body fat percentage was assessed with bioelectrical impedance (RJL Systems; Clinton Township, MI, USA). Subjects were told to come to our laboratory well hydrated to improve the impedance measurement’s accuracy. Once anthropometric data were collected, first visits continued with familiarization to exoskeleton squats.
Familiarization
All our subjects were familiar with the barbell squat. Each had a 1RM in excess of 73 kg. Yet none had prior experience with the exoskeleton. Thus for their first two visits they practiced squat repetitions on the exoskeleton over a large range of loads (0–57 kg) that were controlled by the device’s computer software. Subjects did a 5-min stretching protocol to lengthen the prime movers (knee, hip, and ankle extensors) used in the squat exercise, followed by exoskeleton repetitions. Depths were recorded with a goniometer. Per subject, depths were replicated for all workout repetitions with the exoskeleton and barbell. Repetitions were done with their feet shoulder width apart and toes pointed 45
Exoskeleton
The exoskeleton’s is equipped with motor-driven actuators on the upper arm of each side of the device. Each actuator generates an artifical load and directs it to the lower arm found on the same side of the exoskeleton. Those loads are not impacted by gravity or the body masses of our subjects. Connections between the upper and lower arms create a hinge joint. The lower arm of the device was clamped to a fixed post that created a second hinge joint. The height of the exoskeleton could be adjusted for subjects 157.5–190.5 cm tall, which corresponds to NASA astronaut height requirements. The exoskeleton’s design permits 66 cm of vertical bar displacement per repetition. Sensors within the exoskeleton provide feedback to the motor-driven actuators, so that a constant downward load is applied to subjects throughout each repetition.
Workouts
For their last two visits subjects did identical squat workouts on two different forms of hardware: a barbell and the exoskeleton. For those visits they did a workout exclusively with only one type of hardware. To begin their final visits, they sat quietly for 10 min so the measurements reflected their pre-exercise state; at that time they put on a heart rate monitor and watch (Polar; Kempele, Finland), as well as had a surface electrode (Trigno™ Wireless EMG System; Natick, MA, USA) applied over their left leg’s vastus lateralis (VL). Before electrode placement, the skin surface was cleaned and marked with indelible ink. Electrodes were applied 10 cm superior to the femur’s lateral epicondyle on the leg’s ventral surface and oriented parallel to the VL’s muscle fibers. To ensure electrode position was the same between workouts, subjects were given a pen and instructed to reapply ink. After the 10-min pre-exercise period concluded we recorded resting heart rate (HR), surface electromyography (sEMG) data and obtained 1–2 fingertip blood drops that were placed on a test strip inserted within a calibrated device (Accusport; Hawthorne, NY) to measure blood lactate concentrations ([BLa
Subjects as they appeared at the start of the squat protocol for our workouts.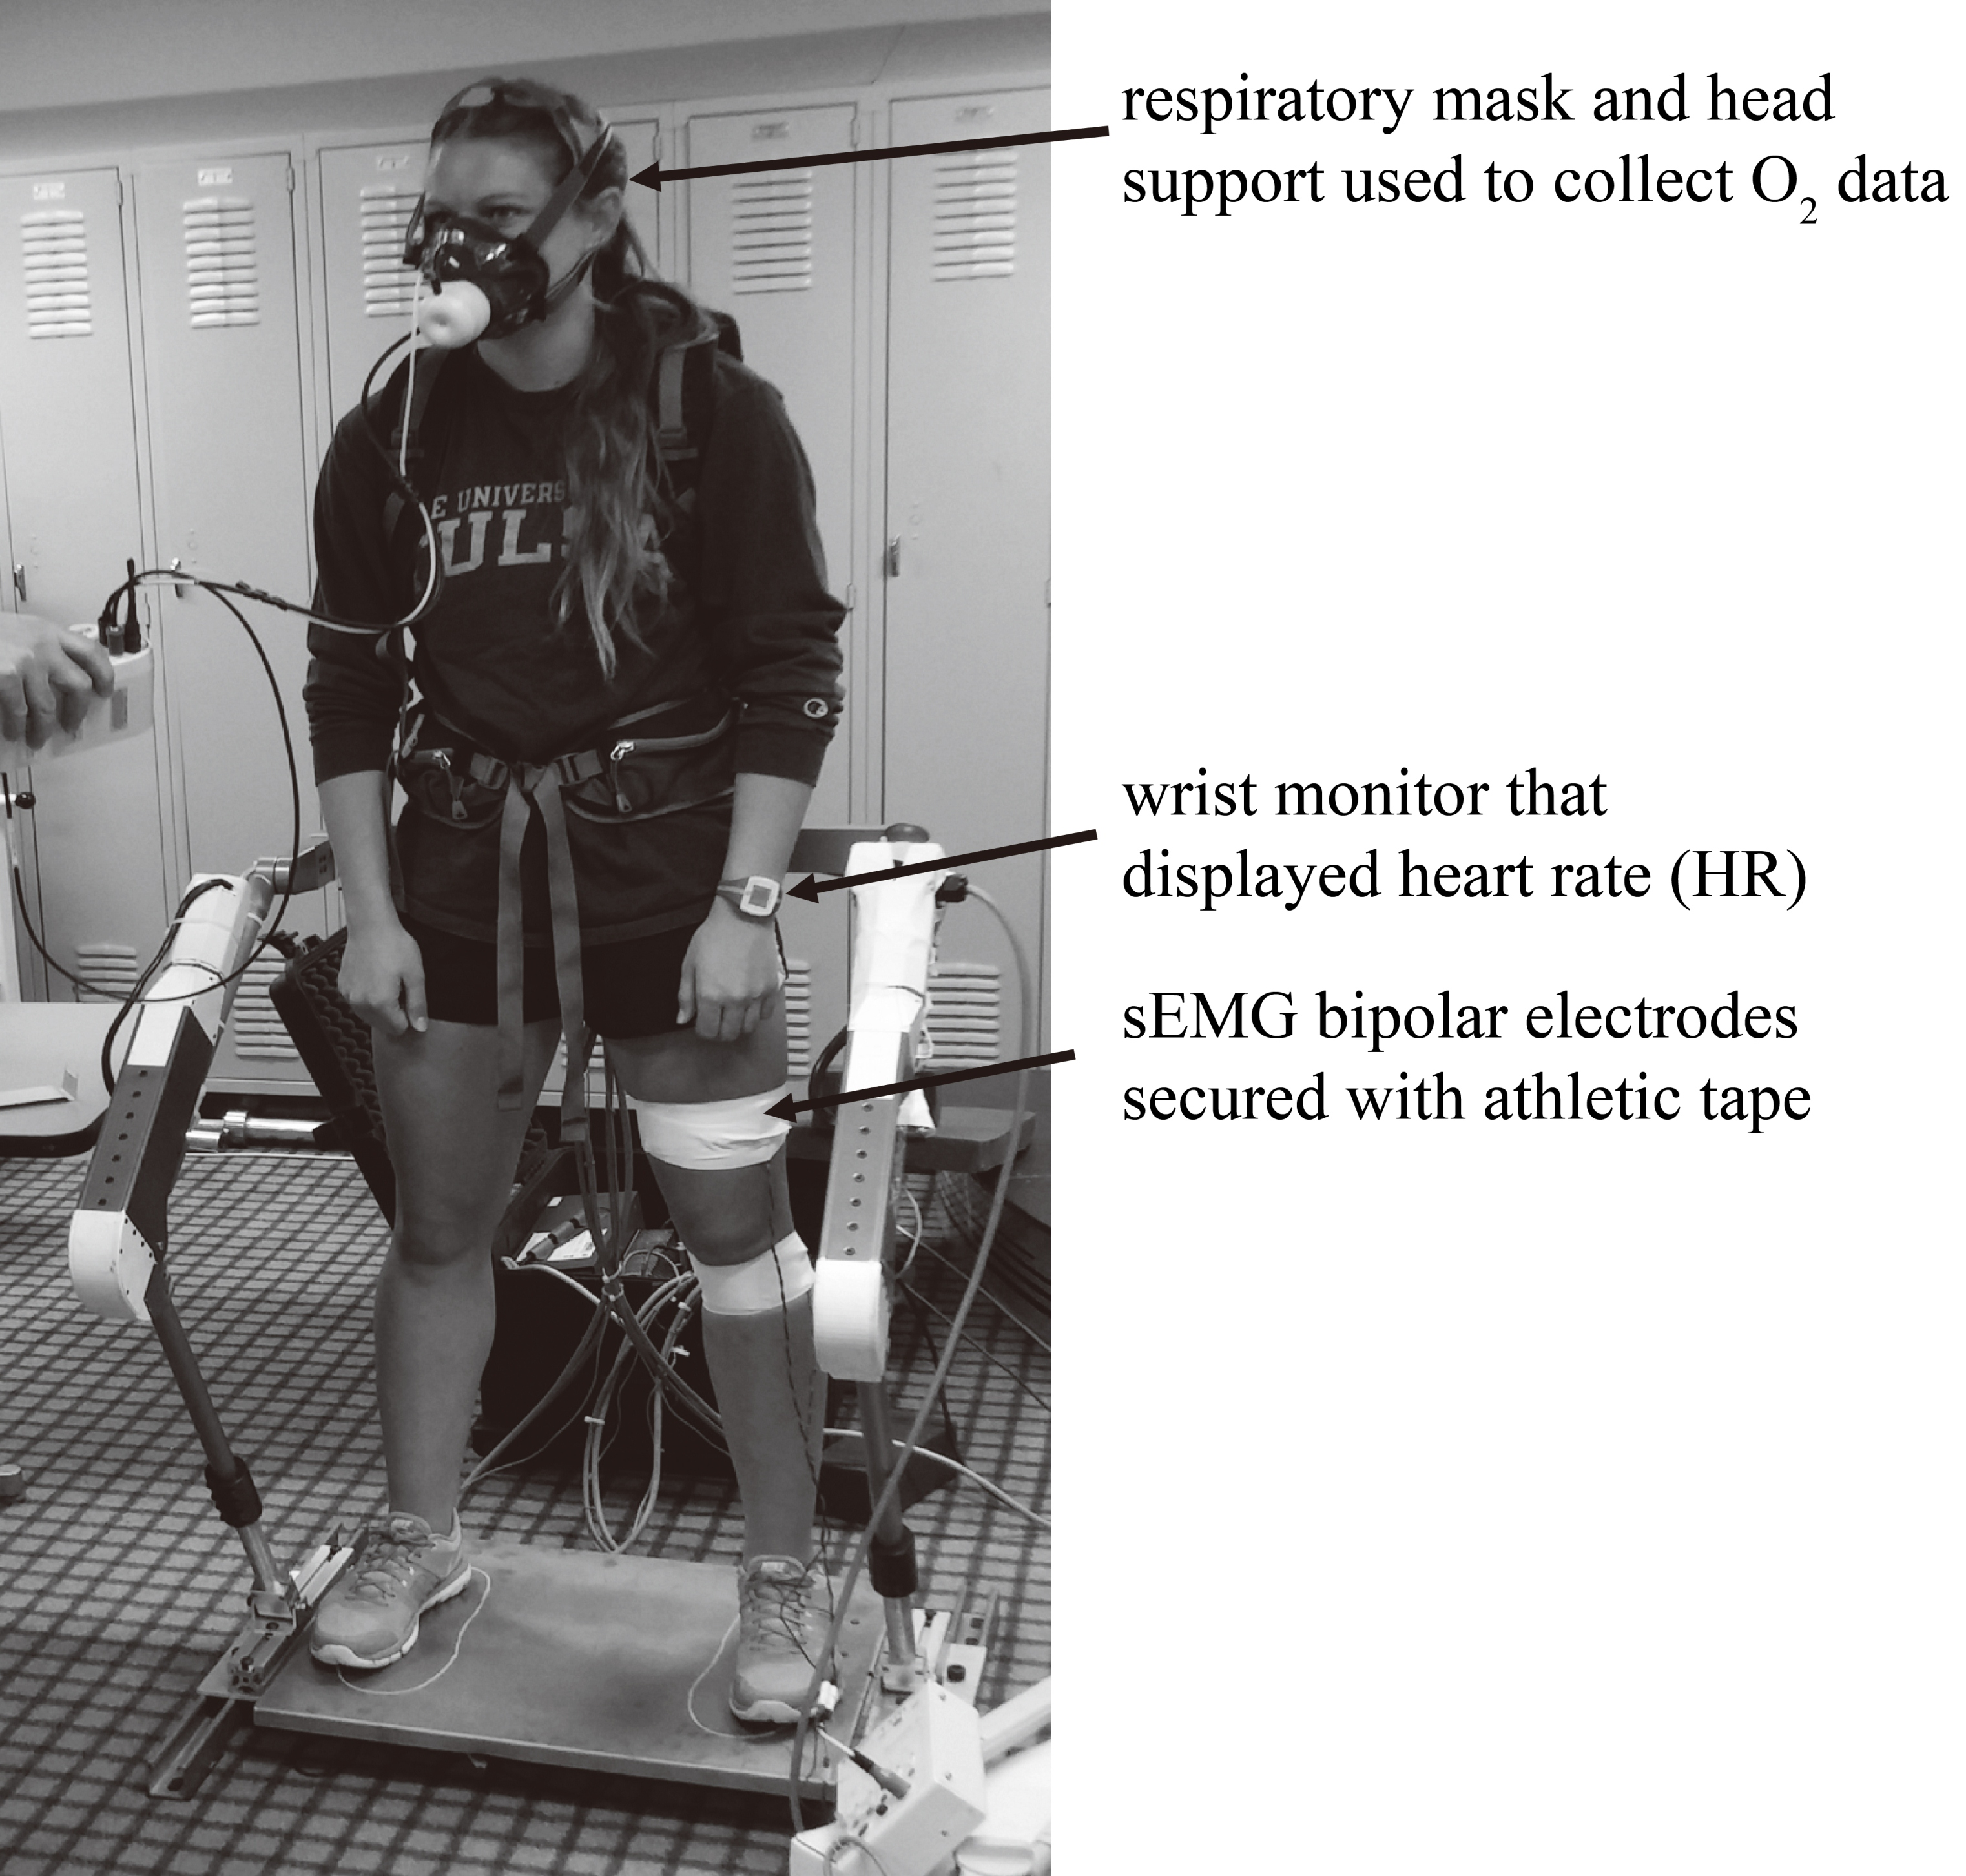
The sEMG signals were band-passed filtered (20–450 Hz) and sampled at 2000 Hz with software (Delsys Acquisition 4.2; Natick, MA, USA) and analyzed with a custom MATLAB script. Signals were center-smoothed with a 100-point moving average filter to identify when transitions between eccentric (ECC) and concentric (CON) phases occurred during workout repetitions. The sEMG signals were shifted so the average voltage was zero, and amplitudes were analyzed with a root mean square (RMS) envelope and 200-point window. ECC and CON phases were interpolated with a 0.02% step. RMS amplitudes were averaged from 10–90% of the cycles for both the ECC and CON phases per repetition. Since ECC and CON portions were determined from sensor data, and upward and downward movement does not precisely coincide with ECC and CON activity, using 10–90% of cycle ensured amplitudes only included data for the respective phase.
After pre-exercise data were obtained, subjects did a stretching protocol identical to that done at their familiarization sessions. They then stood motionless in front of the hardware (exoskeleton, barbell) to be used for that given workout, and had a respiratory mask and hose attached to their head so oxygen (O
The protocol was the same regardless whether done with a barbell or the exoskeleton. Subjects did four repetitions each, in good form to their pre-determined squat depth, against loads in the following order: 23, 34, 45 and 57 kg. Repetitions were done in cadence to a metronome at 50 beats
After the fourth set concluded subjects stood motionless. At 5-min post-exercise HR and [BLa
To assess our data’s inter-workout similarity, as well as the exoskeleton’s validity as exercise hardware, we examined the same dependent variables from both workouts with multiple statistical tests. However our data were first analyzed with Z-scores to identify outliers. Z-scores were computed as: (individual score – mean)/sd. Values that exceeded the
Since many of our dependent variables are inter-related, a one-way MANOVA with a Bonferroni adjustment for multiple comparisons was performed [39]. MANOVA allows us to test for significant inter-workout differences as it controls type I error rates. MANOVA also accounts for inter-dependencies among our variables, which increased our ability to detect significant inter-workout differences [18]. We used a 0.05 alpha value to denote significance for our MANOVA computation. We also examined our data for compliance to ANOVA assumptions (normality, independence, equal variances).
To assess the validity of the exoskeleton we examined our dependent variables with paired t-tests to assess absolute inter-workout differences. To exhibit a high degree of inter-workout similarity our t-test values should be less than 1.0 [27]. Cohen’s d effect size assessed the relative difference between paired values, and Bland-Altman plots analyzed the level of agreement between paired values from the workouts. Per dependent variable, Cohens d calculates the inter-workout difference between mean values and divides it by the standard deviation; values less than 0.4 are said to exhibit a high degree of inter-workout similarity, and those equal to 0.2 and 0.5 denote “small” and “medium” differences respectively [27, 31]. Bland-Altman plots display absolute differences between two measurements as a function of a subject’s mean value [2]. Per dependent variable, we also measured the magnitude of relationship between our workouts with PPMC coefficients, as was done in prior studies that examined validity [9, 26, 29, 37].
Anthropometric data
Anthropometric data
Raw free weight workout metabolic, performance, HR and RPE data
Raw exoskeleton workout metabolic, performance, HR and RPE data
Inter-workout HR, metabolic, performance and RPE results
All subjects completed four visits and none were injured from their project participation. Z-scores show less than 1% of our data were outliers and MANOVA results included non-significant differences. Anthropometric data for our female, male and total sample appear in Table 1. The raw data for our free weight metabolic, performance, HR and RPE variables, appear in Table 2. Corresponding exoskeleton values appear in Table 3. Tables 2 and 3 data were normally distributed. Table 4 shows t-test, Cohens d and PPMC inter-workout values for metabolic, performance, HR and RPE dependent variables. Results generally show more inter-workout peak force, as compared to peak velocity, variability. In particular, lighter loads had more peak force variability. Table 4 t-test results show 17 dependent variables had values less than 1.0. Cohens d results show eight dependent variables had values less than 0.2 and 17 produced values less than 0.4, while only one exceeded 0.5. PPMC results varied greatly. Generally lower PPMC values were produced by our performance-based dependent variables. In contrast, generally better relationships occurred with our post-exercise HR, metabolic and perceptual-based dependent variables.
Tables 5 and 6 display the raw VL sEMG data outcomes from our free weight and exoskeleton workouts respectively. Tables 5 and 6 data are presented by load, repetition and contractile mode. Our sEMG data were normally distributed. Inter-workout sEMG t-test, Cohens d and PPMC results appear in Table 7 and are displayed by load, repetition and contractile mode. ECC, as compared to CON, actions produced more variability. Results include only three inter-workout t-test values that exceed 1.0. They all occurred with ECC actions done against 23 kg. Cohens d results show 14 and 32 sEMG dependent variables less than 0.2 and 0.4 respectively.
VL sEMG raw data from free weight workouts
VL sEMG raw data from free weight workouts
VL sEMG raw data from exoskeleton workouts
VL inter-test session sEMG results
Due to the similarity of our Bland-Altman plots and the number of dependent variables examined, we chose one plot to represent our entire data set. Figure 3 shows a Bland-Altman plot of our pre-exercise [BLa
Bland-Altman pre-exercise [BLa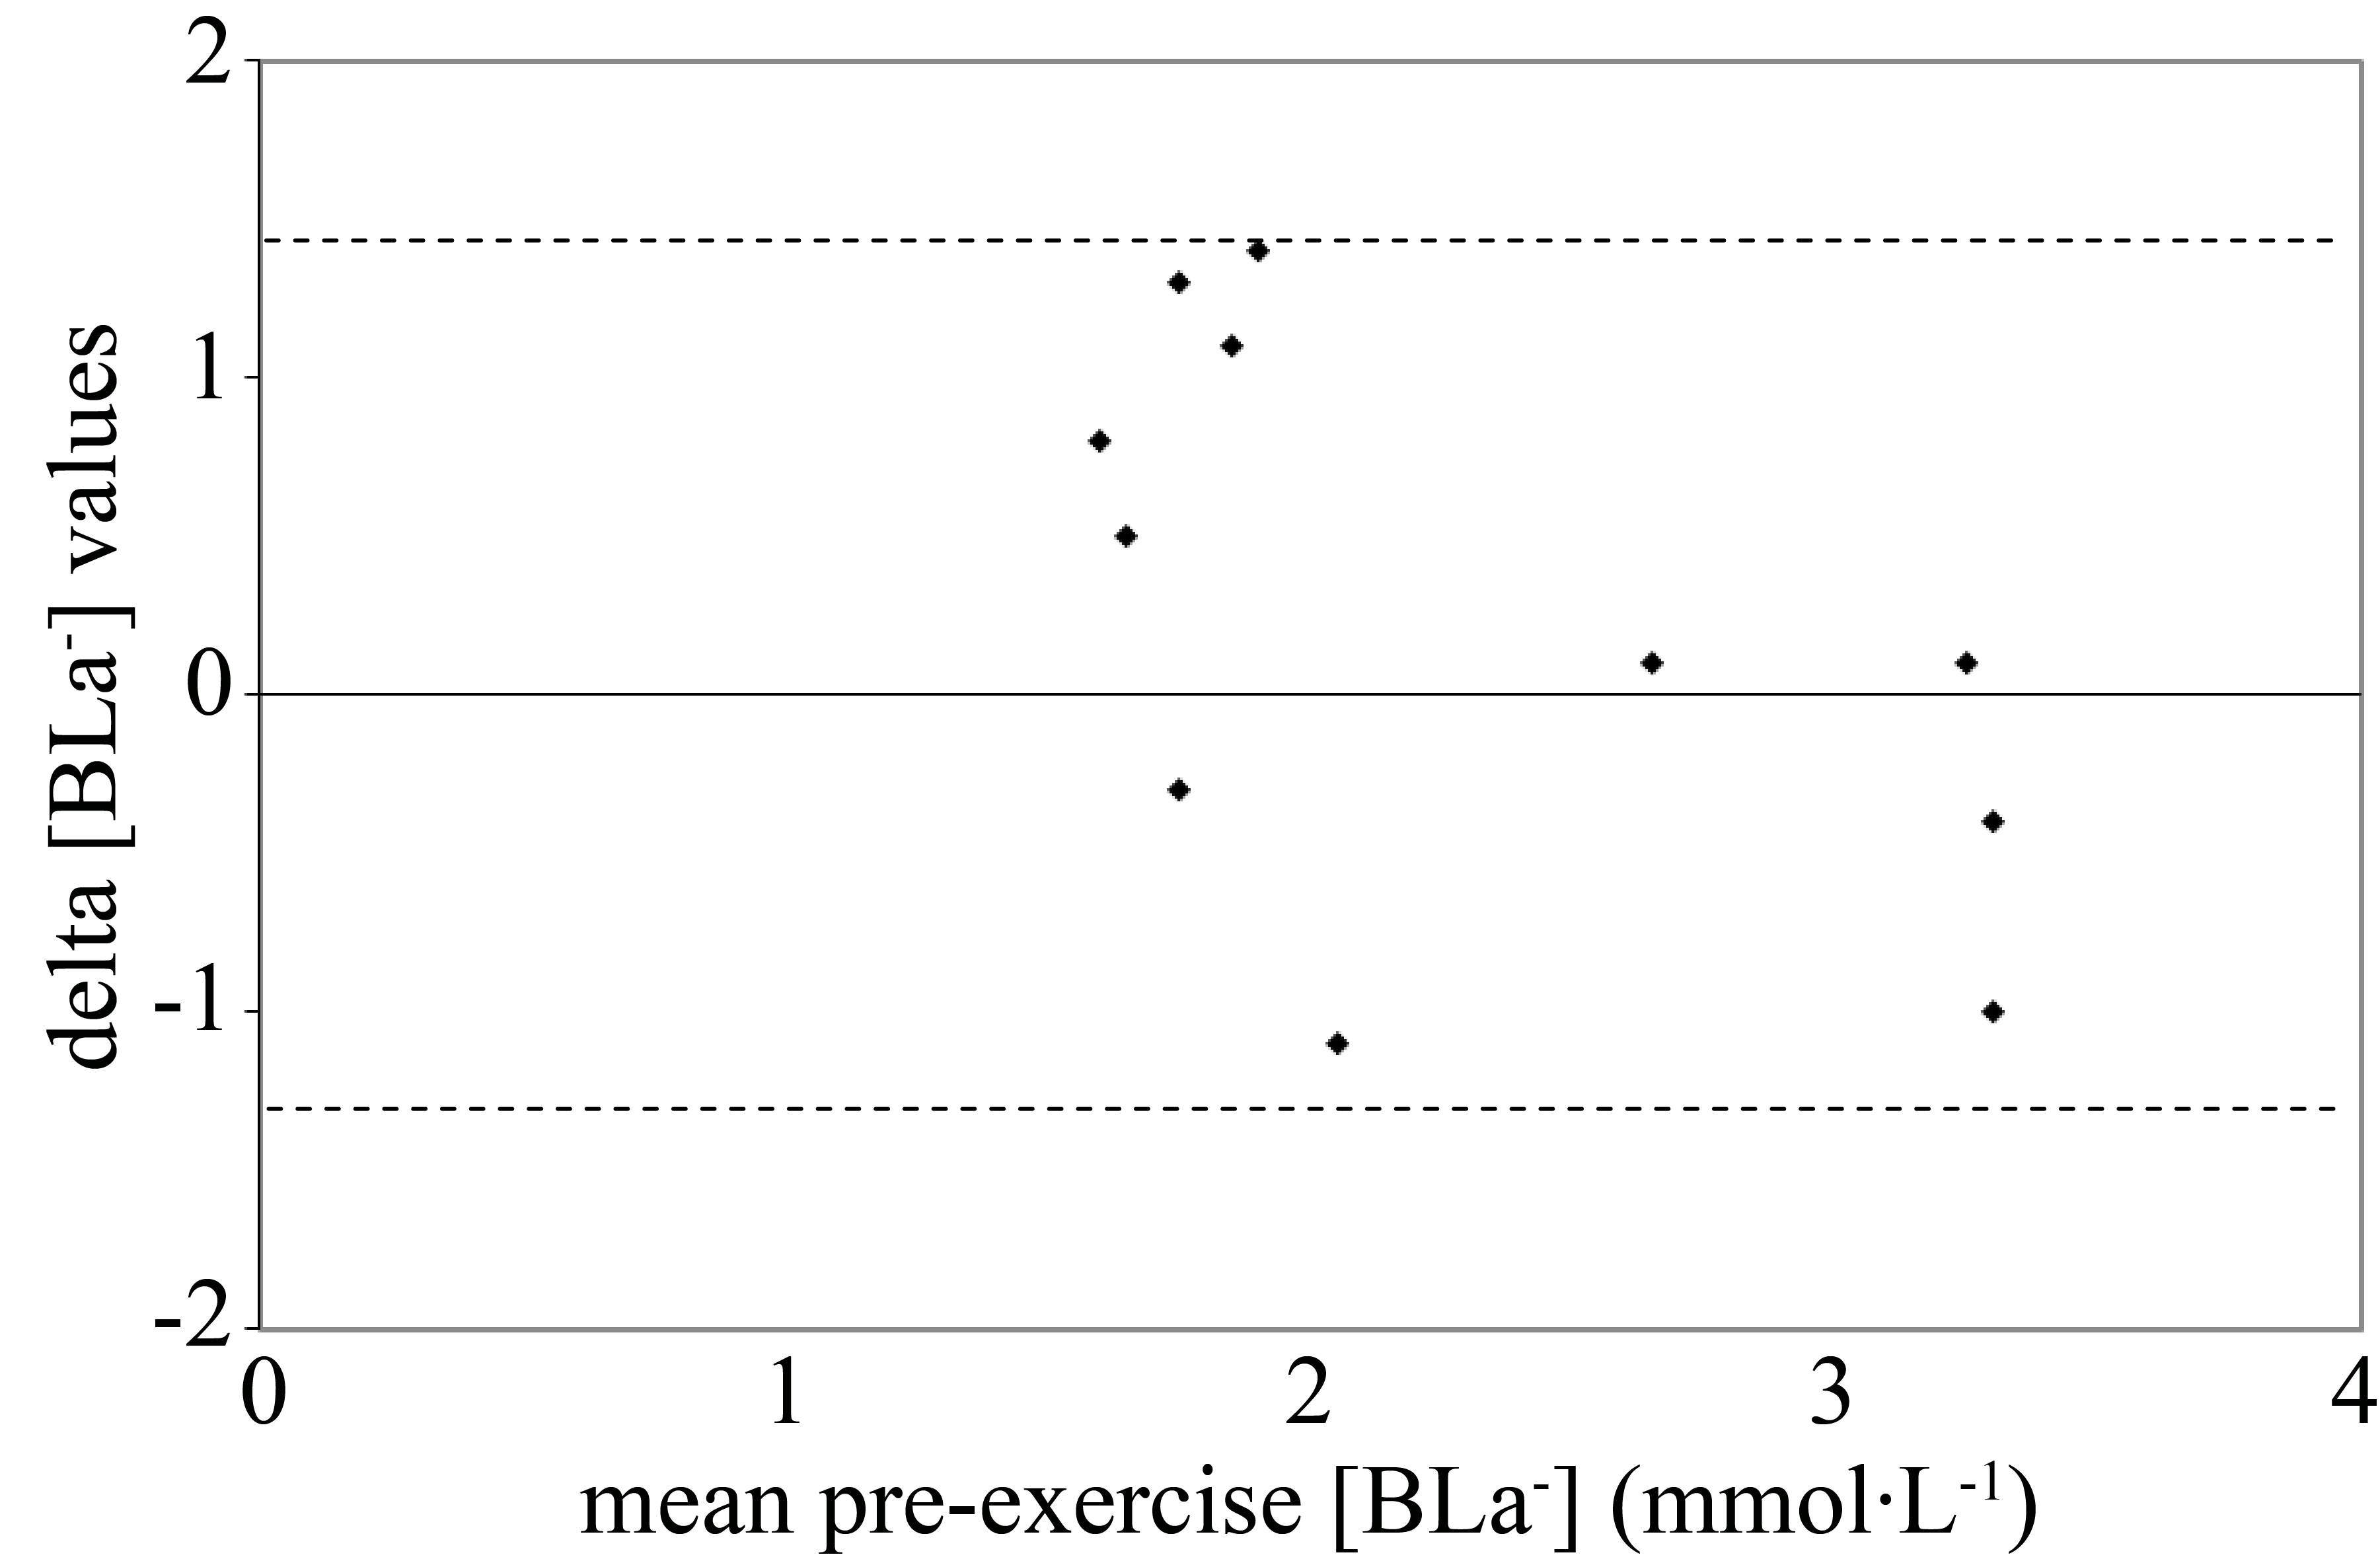
Challenges to develop resistive exercise hardware for long-term space flights persist, such that some question if manned missions to Mars are tenable and safe for humans [5, 21]. Since it exceeds projected exercise hardware space, mass and power limits for Mars missions, NASA’s Advanced Resistive Exercise Device (ARED) is impractical for such flights [5]. In contrast, with its ability to provide a gravity-independent loading stimulus for the squat exercise without ARED’s limitations, the robotic exoskeleton is potential hardware that may address this issue. However the validity of the exoskeleton has been questioned [27]. Current results affirm our hypothesis with multiple statistical analyses that each examined the inter-workout similarity of our dependent variables.
Paired t-tests assess absolute inter-workout differences [27]. To achieve acceptable levels of validity, values less than 1.0 are desirable [27]. Paired t-tests were used to examine the differences between actual and age-estimated maximal heart rate and VO
Cohen’s d measures relative inter-workout differences. Cohen’s d values of 0.2 and 0.5, referred to as “small” and “moderate” differences respectively, were derived from the behavioral and social sciences [31]. It was suggested, due to differences in the treaments used and the potential for change among variables, those values were inappropriate for strength training research [31]. Revised Cohen’s d values for strength training suggest that those less than 0.8 denote small effect sizes for the type of subjects examined in our study [31]. Our results include, across all dependent variables examined, an average value of 0.24; in contrast the prior exoskeleton study had an average value of 0.51 [27]. Regardless of which scale is used, our results suggest minimal inter-workout differences.
Bland-Altman analyses plot delta measurements for paired values as a function of their mean [17]. They also identify heteroscedasticity and outliers; the former occurs when observed differences become greater as mean values increase, which implies increases in variability are a function of absolute measurement magnitude [17]. Despite their utility, few exercise studies employed Bland-Altman plots. Gait performance was examined over repeated test sessions done by stroke patients and identified 6% of the data as outliers [17]. Prior exercise studies with Bland-Altman plots examined intra- and inter-workout responses to novel hardware [6, 8]. Results included much test-retest agreement and less than 1% of the data were outliers, all inter-workout values [6, 8]. Our Bland-Altman results are like those from prior studies that administered familiarization prior to testing and used similar types of subjects [6, 8].
PPMC coefficients are used to assess validity [1, 11, 33, 35, 38]. Our PPMC coefficients produced an average value, across all dependent variables examined, of 0.52. Prior exercise studies used PPMC coefficients to examine RPE values as a correlate to HR in order to assess the validity of the perceptual measurements [9, 29, 37]. A mean PPMC value of 0.58 was seen between HR and RPE for exercise done by African-Americans [22]. In young females the HR-RPE PPMC coefficient was measured at 0.66 [29]. An unusually high correlation (
Intra-subject variability is considered by some to be the most important measurement in validity studies [10]. Our results show more variability for peak force, versus peak velocity, values. This is likely because our metronome controlled the cadence at which subjects squatted and limited our peak velocity variability. In contrast there was no procedure that controlled force exertion. Yet current results, particularly in light of the prior exoskeleton study, reinforce the need for familiarization [10, 27].
The ability of familiarization to yield similar inter-workout responses is due to several factors that include the type and duration of familiarization, the length of inter-test time intervals and types of subjects used [13, 24, 30, 32]. In regards to the latter, athletes may need less familiarization than sedentaries [16, 19, 25]. In addition subjects’ age, which may relate to their physical activity levels, impacted familiarization requirements to measure knee extensor strength; with less familiarization needed for younger, versus older, women [30]. More intense exercise tests also warrant greater familiarization, as higher degrees of physical exertion elicit learning effects when measured over multiple sessions [4, 14, 39]. In support of the last statement, 40 men did eight test sessions, without prior familiarization, to measure peak squat strength [28]. Only 30% achieved their peak strength by the third session, and over 50% needed at least six sessions [28]. Without familiarization, it was implied at least 9–10 trials were needed to obtain accurate values. It was concluded that familiarization was needed before tests when large muscles were engaged, and the number of sessions before tests should increase above that which is usually administered [28].
Different types of familiarization exist. They all aim to limit the intra-subject variability in subsequent test data in order to elicit similar inter-test session responses. While most familiarization strategies entail a fixed number of sessions, repetitions and durations to the stimulus under inquiry, they may not be as helpful to subjects who learn study procedures more slowly. Thus a fixed familiarization protocol lessens the validity of data provided by slow learners, since their subsequent test data exhibits less stability over repeated measurements [10]. In contrast we administered an individualized familiarization protocol, which did not limit subject’s exposure to the exoskeleton. Instead they did as many practice repetitions as they wished until they felt comfortable exercising on the device. We felt individualized familiarization was necessary given the exoskeleton’s novelty. Our results suggest subsequent workouts produced more stable data and less intra-subject variability. A recent vertical jump study also used individualized familiarization prior to testing and concluded it reduced intra-subject variability and improved statistical power [10]. Thus our hypothesis was affirmed, and we had less data variablity than the prior exoskeleton study, not only because we familiarized subjects, but also due to the type of familiarization administered [27].
While our statistical analyses supported our hypothesis, current results should be interpreted cautiously since there are study limitations. Though the exoskeleton is being considered for use aboard long-term manned space flights, our squat protocol is likely not sufficient to abate the lower body muscle mass and strength losses incurred by astronauts [20, 34, 36]. In addition, the exoskeleton used in this study has a maximum loading capacity of 59 kgs. Loading capacities of 136–182 kg for the squat exercise are more appropriate to reduce the in-flight muscle mass and strength losses produced by long-term space missions [20, 34, 36]. However due to its novelty and considerable promise as in-flight hardware, continued research with the robotic exoskeleton is warranted.
Footnotes
Acknowledgments
We thank our subjects and Dr. Peter Neuhaus for the use of the exoskeleton.
Conflict of interest
The authors have no conflicts of interest to report.