The purpose of this investigation was to examine the effects of two back squat exercise protocols on recovery responses of maximal unloaded velocity (Vmax) and angular acceleration (ACC240, ACC500) of the knee extensors.
METHODS:
Fourteen resistance-trained men (mean SD: age 22.07 2.6 years) and sixteen women (age 21.75 1.0 years) performed maximum voluntary contractions at 240 s and 500 s before (Pre) and after (Post0-Post30) a squat exercise using either a power-endurance (PE) (5 16 at 40% one-repetition maximum), or controlled hypertrophic (CH) (5 8 at 80% one-repetition maximum) protocol.
RESULTS:
There was a significant main effect for time ( 0.001) in which ACC240 was greater at Pre compared to Post0, Post15 and Post30 ( 0.001–0.023), no differences were observed at Post7 ( 0.186). For ACC500, all post-recovery time phases (Post0-Post30) were lower than Pre ( 0.001). A sex intensity time ( 0.040) interaction was observed for Vmax where only the CH protocol was significantly decreased ( 0.019) for the males at Post0. All other post-recovery time phases for Vmax were lower compared to Pre for both protocols ( 0.002–0.025).
CONCLUSIONS:
Similar fatigue and recovery-related responses were observed between genders in regards to ACC and Vmax following volume-matched PE and CH squat protocols. Knowing that a variety of populations implement compound movements into their resistance training routines, the present findings suggest that ACC and Vmax may be negatively affected following moderate to heavy exercise for up to 30 minutes. Thus, assessing ACC and Vmax post-exercise may be a valuable measure in identifying the residual consequences of fatigue over a short-term recovery period.
A majority of fatigue-related research utilizes maximal and rapid strength characteristics while examining static muscle performance [1, 2]. Angular acceleration (ACC), which is defined as the ability to generate velocity rapidly [3], and maximum unloaded velocity (Vmax) may be better suited for assessing variations in dynamic muscle function [3]. Previous research that investigated muscle function utilized muscle strength- and/or power-related measures to identify deficits in performance [1, 4]. Specifically, Häkkinen [1] observed a decrease in isometric force of the knee extensors following a fatiguing squat protocol (20 1 100% one-repetition maximum; 1-RM) in both males (24.1%) and females (20.5%). Similarly, Conchola et al. [4] observed acute deficits in maximal and rapid strength capacities of the knee extensors following two separate free-weight back squat protocols (5 8 at 80% 1-RM and 5 16 at 40% 1-RM). Furthermore, Marshall et al. [5] demonstrated similar acute deficits in maximal force following squat protocols (5 4 at 80% 1-RM) with differing inter-set rest intervals. While decreases in maximal strength have been observed post-exercise, assessing differences between sex (males and females) as well as other modes of measurement (dynamic, ACC and Vmax) may reveal another important aspect regarding functional deficits in performance. For example, Häkkinen [1], and Linnamo et al. [6] observed lower levels of overall fatigue (maximum strength) for the leg extensors for females compared to males. As the aforementioned investigations assessed acute recovery responses post-exercise, these studies only assessed maximal and rapid force, thus, to the author’s knowledge, no previous research assessed gender differences following exercise protocols for ACC and Vmax. Additionally, no previous studies assessed recovery patterns from ACC and Vmax by gender. Examining and comparing these variables by gender may permit better understanding of physiological characteristics as well as practical responses from exercise based movements. Although rate of torque development (RTD) is a functionally significant indicator of rapid and forceful muscle actions, it may be limited in its practical application due to its conventional assessment during an isometric contraction in which muscle length and joint angle remains unchanged. While previous research generally assessed fatigue recovery patterns related to isometric force production, to the authors knowledge, only one study has assessed the impact of exercise on ACC [7]. Nguyen et al. [7], reported ACC deficits of 11–12% immediately, 8–9% at 24 hours, and 10% at 48 hours after performing an eccentric muscle damaging protocol for the elbow flexors (6 10 at 30 s). Although force production is essential for athletic performance [2, 8, 9], it may not provide the most appropriate indicator of deficits in acceleration and velocity [10, 11, 12] following exercise. Specifically, previous authors examined force-velocity (F-v) profiles for identifying the capacity of ballistic performance – ability to accelerate body mass as much as possible in the shortest time possible [11] – for improvement through tailored training programs. The importance of examining a practical bout of exercise utilizing varying forms of resistance exercise protocols may provide novel information regarding the acute (0–30 min) time-course effects of ACC and Vmax. Subsequently, the use of different free-weight back squat protocols with matched training volumes may elicit different responses on maximal and rapid velocity. Additionally, previous literature (although assessing strength) have seen significant differences between sex (males vs. females) in regards to maximal and rapid strength characteristics after performing matched exercise protocols [1, 6]. Previous literature suggests that these findings could be related to muscle perfusion, differences in cross-sectional area, metabolic processes and ATP utilization [13, 14]. While decreases in performance may occur post-fatigue, there has been considerable evidence that fatigue is not caused by a single factor, but that the mechanisms underlying the force reduction are task specific [15, 16]. Furthermore, it is important to note that muscle power has been shown to be negatively affected more than maximal force following a dynamic fatigue protocol [17] and this reduction in force-producing capacity may lead to deficits in subsequent muscular performance, thus hindering physical ability post-exercise. Consequently, due to the explosive nature of a power-endurance (PE) exercise protocol, it follows that ACC and Vmax may be impacted to a greater amount than from a controlled-hypertrophic (CH) exercise protocol. Therefore, the purpose of the present study is to examine the effects of a power-endurance (PE) versus a controlled hypertrophic (CH) free-weight back squat exercise on the acute post-exercise recovery responses of maximal velocity and acceleration characteristics to the knee extensors. We hypothesized that the women would be more fatigue resistant compared to the men following both exercise protocols and that the PE protocol would elicit a greater amount of fatigue for ACC and Vmax compared to the CH protocol.
Materials and methods
Experimental subjects
Fourteen resistance-trained men (mean SD: age 22.07 2.6 years; height 175.02 8.80 cm; mass 85.21 8.4 kg; squat 1-RM 144.16 20.98 kg; squat 1-RM to mass ratio 1.71 0.30) and sixteen women (mean SD: age 21.75 1.0 years; height 163.84 8.23 cm; mass 67.56 8.98 kg; squat 1-RM 92.61 19.94 kg; squat 1-RM to mass ratio 1.37 0.33) volunteered to participate in this investigation. All participants were engaged in a structured weight training program that involved the lower body (including the free-weight back squat exercise) for a minimum of at least 6 months prior to the study. None of the participants reported taking any ergogenic supplements (i.e. caffeine or creatine) prior to the study, nor reported any musculoskeletal injuries of the lower extremities, within one year prior to testing. This study was approved by the University Institutional Review Board for human subject’s research, and prior to any testing each participant voluntarily completed an informed consent document and health history questionnaire.
Procedures
This study used a randomized, within-subjects design to investigate the acute effects of two different fatigue-inducing protocols using the free-weight back squat exercise on angular acceleration (ACC) at 240 s (ACC240), 500 s (ACC500), and maximum unloaded velocity (Vmax). Participants performed maximum voluntary contractions (MVCs) of the knee extensors before (Pre) and 0 (Post0), 7 (Post7), 15 (Post15) and 30 min (Post30) following a free-weight back squat workout involving either a PE (5 16 at 40% 1-RM) or a CH (5 8 at 80% 1-RM) loading protocol.
Back squat 1-RM and exercise protocol
The back squat 1-RM and exercise protocols were performed in a multi-purpose adjustable Commercial Power Rack (RockSolid Fitness, Rutland, VT, USA) with a standard Olympic barbell (20.45 kg). With feet positioned shoulder width apart, participants used a high bar placement and squatted starting from an upright position and descending until a 90 angle at the knees was achieved [18]. An elastic band was set to provide the participants with kinesthetic feedback of when 90 was attained [4]. Each back squat 1-RM assessment was performed at a cadence of 60 bmin (using a digital metronome), resulting in a tempo of 2 seconds for both the eccentric and concentric contraction phases, ensuring a consistent rhythm throughout each repetition [19, 20]. The back squat 1-RM testing began with a warm-up of 10 repetitions at 50% of the estimated maximal load. Following a rest period of 3 min, the back squat 1-RM was determined by selecting an initial load ( 90% of their 1-RM), and subsequently applying incremental (2.27–9.09 kg) loads [21] until the participant could not complete a repetition using proper technique to depth or could no longer maintain the cadence (60 b min) of the metronome. Additional trials were performed until the 1-RM was determined within 2.27 kg and the 1-RM was achieved in 5 trials. The highest successfully completed 1-RM was used in determining the load for the subsequent squat exercise protocols. During all testing, parallel safety bars were set 2–4 inches below the participant’s 90 squat depth and a two-person spot was provided for all trials [4, 5].
Participants were randomly assigned to either the PE or CH squat protocol on separate occasions (4–7 days following 1-RM testing and 7 days separated the experimental protocols). Each testing session began with a 5-minute warm-up on a cycle ergometer (Monark Exercise 828E, Vansbro, Sweden) at a self-selected low-intensity followed by a set of 10 repetitions at 50% of participant’s 1-RM followed by either the PE or CH exercise protocols. The PE protocol consisted of 5 sets of 16 repetitions at an intensity of 40% of the participant’s 1-RM and the CH protocol consisted of 5 sets of 8 repetitions at 80% of the participant’s 1-RM. These loading schemes were selected to provide an equal total-volume between both protocols, while allowing for characteristics of each protocol to be exhibited (light load-explosive velocity vs. heavier load-slow velocity) [4]. During both protocols, 2 min of rest were allotted between each set, and a cadence of 60 b min was used for the repetitions during the fatigue protocols. Additionally, the same loading tempo as the 1-RM assessment (i.e., 2 second eccentric; 2 second concentric) was utilized for the CH protocol, however, for the PE protocol, participants were instructed to perform the concentric portion of each repetition “as rapidly and explosively as possible” while keeping their feet flat on the floor [4]. Although participants were instructed to perform ballistic concentric contractions during the PE protocol, the present study did not include assessments of bar displacement (i.e., Power and Velocity) during each repetition.
Maximal voluntary contractions
MVCs were performed with the right leg using a calibrated Biodex System 4 isokinetic dynamometer (Biodex Medical Systems, Inc. Shirley, NY, USA). Participants were seated with straps placed over the trunk, pelvis, and thigh and the input axis of the dynamometer aligned with the lateral condyle of the knee. Prior to testing, participants performed a 5-min warm-up on a cycle ergometer (Monark Exercise 828E, Vansbro, Sweden) at a self-selected low-intensity workload, followed by three submaximal isokinetic knee extensor muscle actions (60 s) at 75% of their perceived maximal effort. Following the warm-up, participants performed three MVCs each at 240 s and 500 s (Vmax). Vmax was used to assess the maximum shortening capacity of the muscle-limb unit [22]. The order of testing was randomized and one minute of recovery was provided between each contraction. For all MVCs, participants were instructed to “kick up” as “hard and fast as possible” [23]. The range of motion was set to move from 90 to 10 of leg extension (0 horizontal plane) [23]. Immediately following all sets and repetitions of the exercise protocol, participants randomly performed three MVCs at 240 s and at 500 s (Vmax) for each post-time phase (i.e., Post0, Post7, Post15, and Post30 min).
Estimated quadriceps muscle cross-sectional area
Estimated quadriceps muscle cross-sectional area (eQCSA) of the right thigh was determined using thigh circumference to the nearest 0.1 cm and skinfold measurements to the nearest 0.5 mm. Similar to Housh et al. [24], anthropometric measures were all taken on the right side of the body, with participants standing in a weight-bearing, erect position. A mid-thigh circumference was obtained using a tension-gauged measuring tape (Gullick II; Country Technologies, INC., Gays Mills, Wisconsin) and skinfolds were measured using a Lange caliper (Beta Technology, Santa Cruz, California). For mid-thigh circumference measurements, participants were asked to equally distribute their weight with feet shoulder width apart while positioning their right leg at roughly 90 degrees on an 18” box. Skinfold measurements were obtained from the anterior thigh, mid-way between the inguinal crease and proximal border of the patella [24]. Estimated quadriceps muscle CSA (cm) was calculated using the equation of Housh et al. [24]:
Quadriceps CSA (2.52 mid-thigh circumference in cm) – (1.25 anterior thigh skinfold in mm) – 45.13
Signal processing
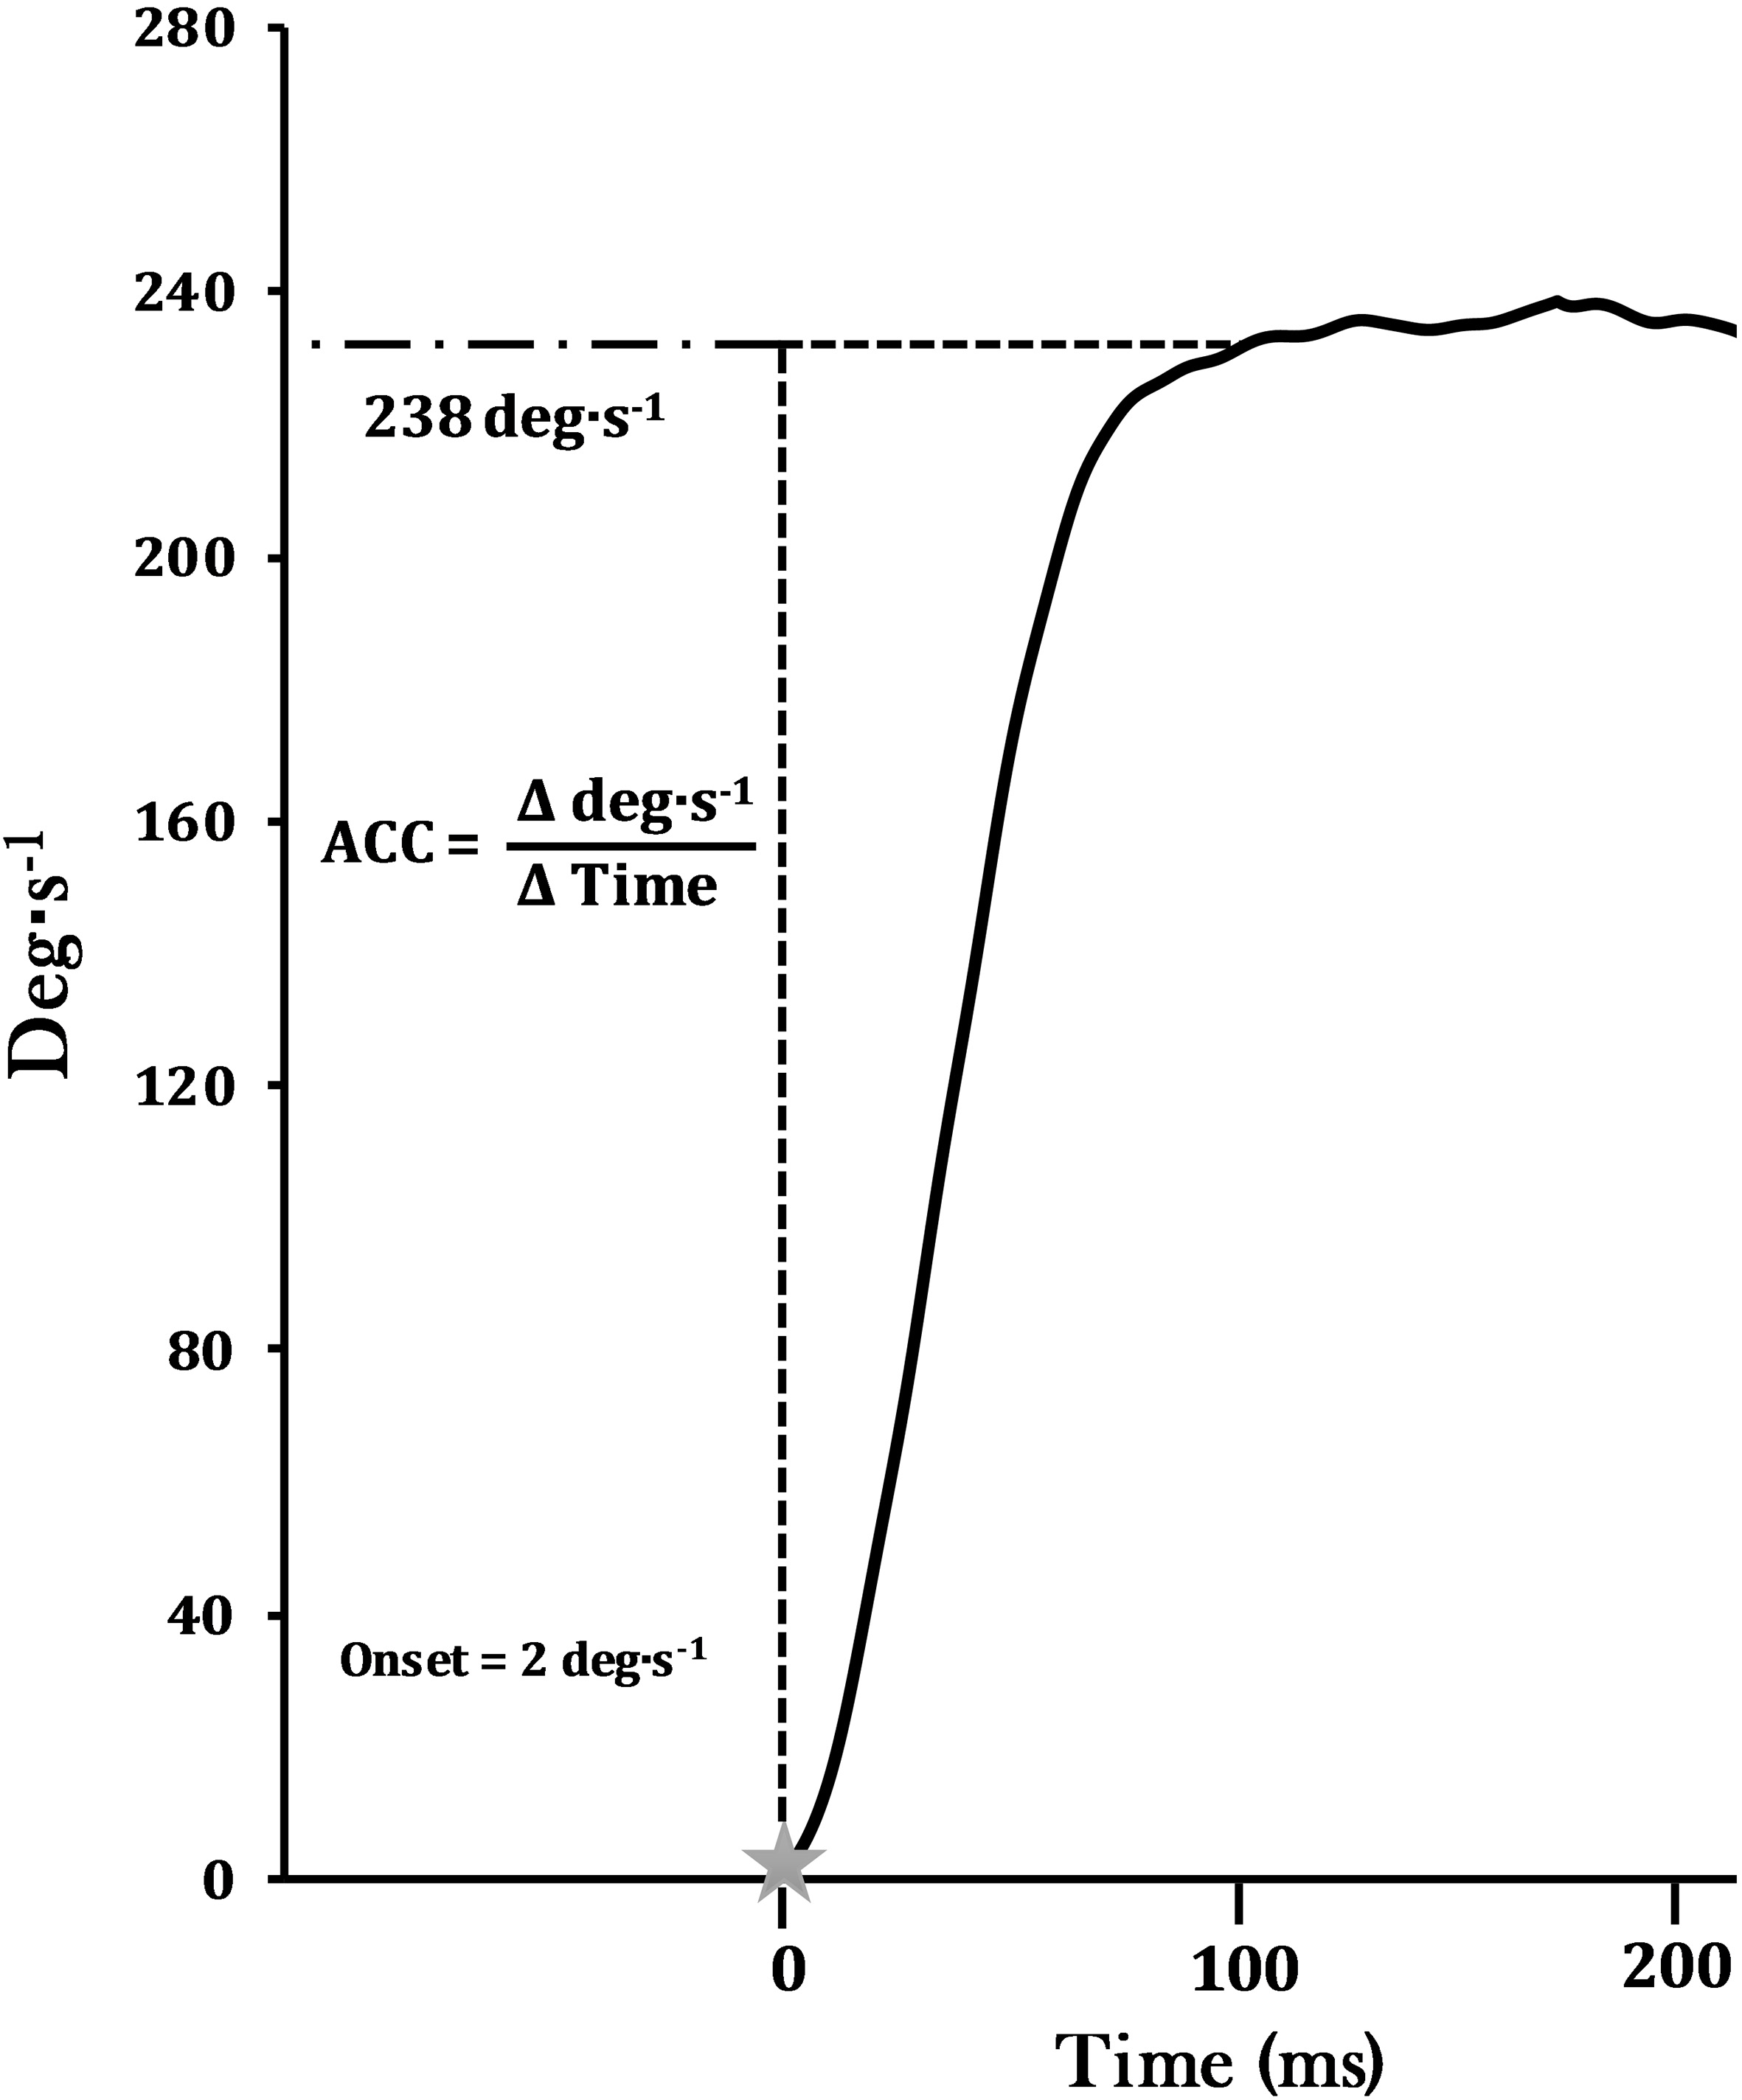
The velocity (deg s signal was sampled at 2 KHz with a Biopac data acquisition system (MP 150WSW, Biopac Systems Inc.; Santa Barbara, CA) stored on a personal computer (Dell Inspiron, Dell Inc., Round Rock, TX) and processed offline with custom written software (Labview 8.5, National Instruments, Austin, TX). The scaled velocity signal was filtered using a fourth-order, zero-phase shift, low pass Butterworth filter with a 10-Hz cutoff frequency. Vmax was calculated as the highest velocity attained during the unloaded MVC. ACC (deg s) was determined as the linear slope of the velocity-time curve ( velocity/ time) for the 240 deg s (ACC240) (Fig. 1) and maximal unloaded velocity (ACC500) contractions. ACC was calculated from the onset of velocity to the point where the signal reached 2 deg s below the target velocity level (238 deg s) and at 2 deg s below Vmax for ACC240 and ACC500, respectively. These procedures acquired the linear portion of the rate of rise in velocity, while excluding the deceleration or “rounding off” of the signal observed at the edge of the velocity plateau. The onset of velocity was determined as the point when the velocity signal reached a threshold of 2 deg s above baseline. The MVC with the highest ACC or Vmax was used for all analyses. In addition, the range of motion (ROM, deg) for both the acceleration and deceleration phases of the contraction were calculated [25].
Angular acceleration (ACC; deg s) was determined as the linear slope of the velocity-time curve ( velocity/ time) for the 240 deg s (ACC240) (as shown) and maximal unloaded velocity (ACC500) contractions. ACC was calculated from the onset of velocity to the point where the signal reached 2 deg s below the target velocity level, which was at 238 deg s and at 2 deg s below Vmax for ACC240 and ACC500.
Statistical analyses
Three separate, 3-way mixed factorial ANOVAs [Sex (males vs. females) intensity (CH vs. PE) time (Pre vs. Post0 vs. Post7 vs. Post15 vs. Post30)] were used to analyze ACC240, ACC500 and Vmax. When appropriate, follow up analyses included one-way repeated measures ANOVAs and -tests with bonferonni-corrections on either the simple main effects or main effects collapsed across the opposing variable. In the case of the violation of sphericity Greenhouse-Geisser results were reported. Partial eta squared () values were reported to estimate ANOVA effect sizes. Statistical analyses were performed using PASW software version 20.0 (SPSS Inc, Chicago, IL, USA), and an alpha level of 0.05 was used to determine statistical significance.
Mean () and marginal mean values for angular acceleration (ACC; deg s) and maximal velocity (Vmax; deg s) variables for all time phases for the 40% and 80% 1-RM squat protocols
Variable (Intensity)
Gender
Pre
Post0
Post7
Post15
Post30
ACC240 (40%)
Collapsed
1932.93
266.65
1655.02
355.46
1840.22
262.58
1864.73
278.14
1836.17
260.51
ACC240 (80%)
1909.34
330.13
1639.88
375.38
1860.48
256.35
1748.25
335.37
1816.68
278.37
ACC240 marginal mean
1921.14
298.39
1647.45
365.42*
1850.35
259.47
1806.49
306.76*
1826.42
269.44*
ACC500 (40%)
Collapsed
2976.00
308.01
2626.01
346.67
2851.27
288.14
2806.98
322.05
2812.37
296.34
ACC500 (80%)
3017.50
311.80
2550.14
388.73
2836.81
316.56
2785.71
261.04
2792.10
283.15
ACC500 marginal mean
2996.75
309.91
2588.08
367.70*
2844.04
302.35*
2796.35
291.55*
2802.24
289.75*
Vmax (40%)
Male
491.48
9.03
481.41
15.75*
477.96
24.01*
476.50
21.79*
479.73
16.70*
Female
484.76
7.78
475.90
14.59*
479.57
11.69*
478.89
11.26*
479.37
11.29*
Vmax (80%)
Male
487.81
11.27
456.90
36.64*†
477.33
12.33*
468.99
24.47*
469.76
21.31*
Female‡
483.04
7.95
467.90
16.79*
472.03
16.54*
476.15
10.55*
475.29
13.29*
Significantly lower compared to Pre ( 0.001–0.025). ‡Significantly lower compared to Vmax (40%) ( 0.046). †Significantly lower compared to Vmax (40%) at Post0 ( 0.027).
Results
Means and SD values for velocity data are presented in Table 1. Absolute ACC240, revealed no sex intensity time (F 1.56; 0.207), nor sex time (F 1.06; 0.361), sex intensity (F 0.62; 0.436), or intensity time (F 2.42; 0.077) interactions. There was however a significant main effect for time (F 17.10; 0.001, 0.379) in which ACC240 was greater at Pre than at Post0 ( 0.001), Post15 ( 0.023) and Post 30 ( 0.015). In addition, Post0 was significant from all following time points ( 0.001–0.015). However, no significant differences were observed between Post7 and all other time points (i.e. Post15 and Post30; 0.05). Absolute ACC500 revealed no sex intensity time (F 1.64; 0.192), nor sex time (F 2.19; 0.119), intensity sex (F 2.28; 0.142) or intensity time (F 1.62; 0.198) interactions. There was however a significant main effect for time (F 33.64; 0.001, 0.546) in which ACC500 was greater at Pre than all post-recovery time phases (Post0-Post30; 0.001). Additionally, ACC500 remained significantly reduced at Post0 in comparison to all following time phases (Post7-Post30; 0.001). However, while still reduced from Pre, there were no significant differences between Post7-Post30 ( 0.05).
For Vmax, a significant sex intensity time interaction (F 3.005; 0.040) was observed. Four separate two-way ANOVAs were utilized in decomposing the model (time intensity for males and females only, sex time for the PE intensity only, and sex time for the CH intensity only). No time intensity interaction was observed for the females (F 2.41; 0.05). There was a main effect for intensity (F 4.72; 0.046, 0.24) in females, in which pairwise comparisons revealed that PE was greater than CH ( 0.046). In addition, a main effect for time (F 12.67; 0.001, 0.458), was observed, in which Vmax was greater at Pre than all post-recovery time phases (Post0-Post30) ( 0.001–0.005). A significant time intensity interaction was observed (F 3.77; 0.027) for males, in which all post-recovery time phases (Post0-Post30) were lower for both the PE ( 0.002–0.025) and CH ( 0.002–0.012) protocols compared to Pre. However, when comparing intensities at each time phase, the CH protocol was significantly lower ( 0.019) than the PE protocol at Post0. No inter-intensity differences were observed at Pre, Post7, Post15 and Post30 ( 0.113–0.896).
Discussion
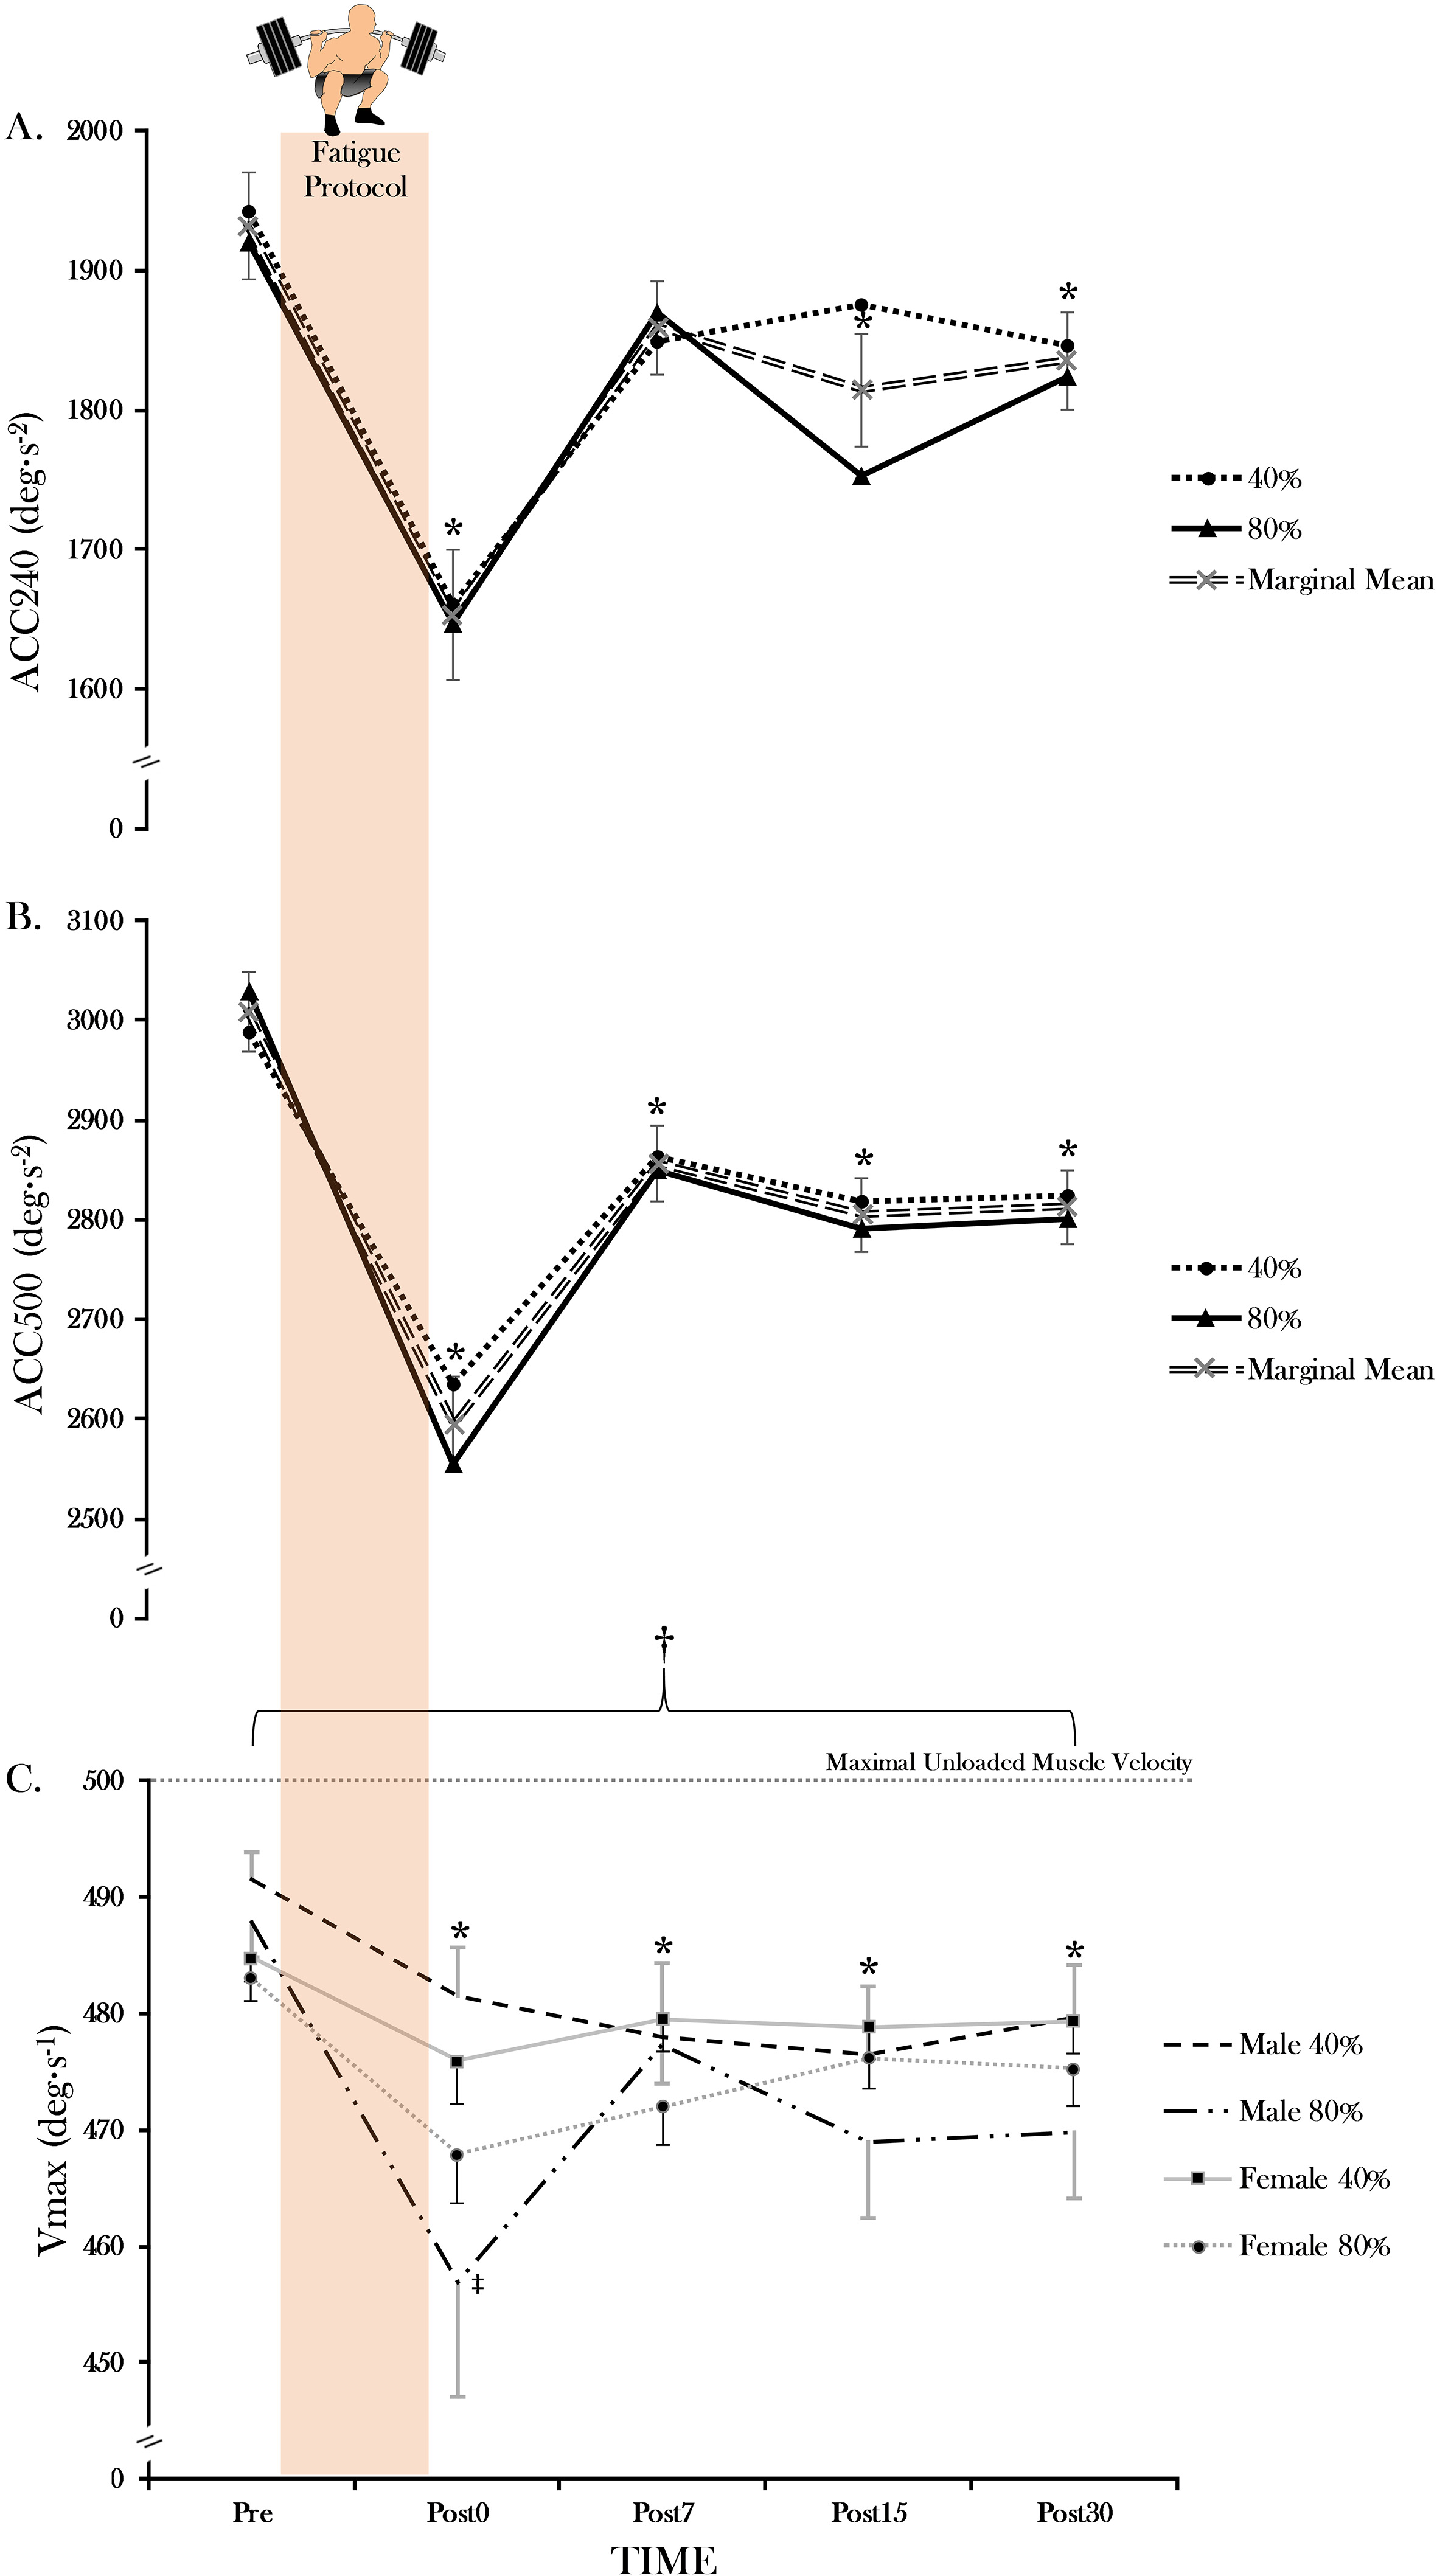
The primary findings of the present investigation revealed no intensity or sex differences for ACC240 or 500 when performing either the PE or CH free-weight back squat protocol. While ACC240 and 500 remained negatively affected post-exercise (Fig. 2A and B), a significant sex-specific intensity difference for Vmax was present in which the men exhibited a significant difference at Post0 for the CH protocol compared to the PE protocol (Table 1). All Vmax values post-exercise were significantly decreased throughout recovery (Post0-Post30) (Fig. 2C).
Mean (SEM) values for (A) angular acceleration (ACC; deg s) 240, (B) ACC500, and (C) maximal velocity (Vmax; deg s) variables for all time phases for the 40% and 80% 1-RM squat protocols. *Significantly lower compared to Pre ( 0.002–0.025). Significant sex intensity time interaction ( 0.040). Significantly lower compared to Vmax (40%) at Post0 ( 0.027) for males.
The present findings observed a significant decrease in ACC following the completion of the squat protocols. Specifically, ACC240 was lower at Post0, Post15, and Post30 compared to Pre and ACC500 was lower at all post-recovery time points (Post0-Post30) compared to Pre (Fig. 2A and B). The variable ACC has been defined as velocity divided by the time to reach that velocity and may result from increases in torque production [5, 25]. Being that force equals the product of mass and acceleration, increasing ACC while mass remains constant positively affects force production. Therefore, the ability to reach top speed quickly (ACC) may be more advantageous to human performance than simply attaining a greater top speed [5, 25, 26]. Previously, studies investigated the effects of age [3, 27] and training on ACC [26, 28]. However, there is a paucity of literature on the effects of fatigue on ACC for the knee extensors. While no previous research assessed acute recovery of ACC ( 30 minutes post workout) for the knee extensors, Nguyen et al. [7] observed a decrease in ACC240 up to 72 hours post-fatigue for the elbow flexors. Interestingly, Nguyen et al. [7] and the present study assessed different muscle groups and revealed similar deficits ( 11–12% and 14%) for ACC240 immediately following the exercise protocols. Although direct comparisons between the present study and Nguyen et al. [7] are impractical due to the method of fatigue (compound movements vs. eccentric muscle actions), and different muscle groups (knee extensors vs. elbow flexors), it is important to note the negative exercise-induced effect on ACC performance [7, 29]. For the present study, ACC240 and 500 were negatively affected post-exercise. Although no significant difference was observed between Pre and Post7 ( 0.186) for ACC240, there was still a 4% reduction at Post7 (mean SD; 1850.35 259.47) compared to Pre (1921.14 298.39; Table 1; Fig. 1). These time-course effects for ACC240 are similar to the ACC500 recovery responses ( 4–5% performance reduction) at Post7, in which a substantial amount of performance restoration ( 9–10%) was observed, and maintained throughout recovery (Post7-Post30). Thus, no attributable physiological mechanism may explain the differential recovery patterns observed for ACC240 at Post 7. Ultimately, similar fatigue-related responses occurred with both genders. The present study’s findings may be attributed to controlling for overall training volumes. Controlling for overall training volume may have prevented different levels of peripheral fatigue which could have occurred through alterations in calcium kinetics and cross-bridge cycling rates [30, 31]. In addition to peripheral fatigue, stimulation of groups III and IV chemoreceptor afferent neurons, which have inhibitory effects on the -motoneurons innervating the fatigued muscle [32], could have also negatively affected performance. Consequently, these fatigue-related alterations may explain why the rapid muscle contraction processes were negatively affected post-exercise. Nevertheless, while the present study saw similar fatigue and recovery related responses between genders, future studies may look at different dynamic exercises and recovery responses with more in-depth analysis of muscular contractions (EMG, MMG, muscle biopsy, co-activation, etc.).
While limb angular acceleration is an important indicator of movement capacities, the ability to generate maximum unloaded velocity may be an equally sensitive and important measurement to assess. Velocity is a principal contributor to muscle power (i.e., power force velocity) and may help identify the specific component of power most susceptible to acute fatigue. Additionally, Vmax has been used to assess potential differences in age [3, 33], gender [27], and acute muscle fatigue [34]). An interesting finding from the present study was the significant sex-specific difference between exercise protocols for our male subjects. The CH protocol elicited greater amounts of fatigue at Post0 compared to the PE protocol (6.34 vs. 2.05%). The immediate fatigue response sustained from the CH compared to the PE protocol could be attributed to higher metabolic by-product accumulation (hydrogen ions), as a result of greater muscle mass in our male subjects, as evidenced by their significantly ( 0.011) greater (78.06 8.58 cm vs 62.64 15.47 cm) eQCSA. While cellular mechanisms are directly related to Vmax, muscle fiber type may play a significant factor. Specifically, fast-twitch (FT) muscle fibers have a substantially greater power capacity compared to slow twitch (5–10 vs. 3–4 times more powerful) [30]. Since the knee extensor muscles are predominantly FT (56.3–70.5%) [35], it is possible that the present findings could be credited to the greater utilization of FT muscle fibers with heavier intensities during the CH protocol [36]. Aside from the intensity difference for males at Post0, all Vmax values were significantly decreased for both genders throughout recovery (Post0-Post30). These findings are similar to Butelli et al. [34] who observed a significant deficit in maximal velocity (31%) immediately after performing a maximal cycling protocol. While the present study performed dissimilar fatiguing protocols (resistance exercise vs. cycling) and assessed recovery for an extended period of time ( 30 min), the overall decrease of Vmax was similar throughout all of recovery. Thus, with the current study implementing both a high-intensity, slow velocity and low-intensity, fast velocity exercise-intervention, increases with hydrogen ion production, and slowing of the sarcolemma and t-tubule conduction may have also occurred [37, 38]. While there was a significant sex and intensity difference, future recovery-based ( 30 min) research is needed for assessing maximum velocity of the knee extensors and flexors, following a variety of fatiguing tasks (static or dynamic) across different populations and activity levels
Conclusions
Knowing that a variety of populations implement compound movements into their resistance training routines, the present findings suggest that ACC and Vmax may be negatively affected following moderate to heavy exercise. Thus, assessing ACC and Vmax following exercise may be a valuable measure in identifying the residual consequences of fatigue over a short-term recovery period. Given Vmax was significantly decreased for at least 30 minutes post-exercise, the present findings may suggest inclusion of this variable when building a performance profile (i.e., Force-velocity profile) and assessing fatigue related responses post-exercise (strength, power, and velocity). Although maximal and rapid velocity capabilities between genders responded similarly following fatiguing bouts of exercise, it is unclear as to whether ACC and Vmax are sensitive enough measures to reveal gender differences following this type of fatiguing protocol. Future studies may consider implementing different exercise protocols and more in-depth analyses of muscular contractions to distinguish potential sex- and recovery-related differences in ACC and Vmax. Furthermore, a recovery period of up to 30 min may yield impaired physiological and functional characteristics for individuals who perform tasks similar to the present study. Thus, clinicians, practitioners, and strength and conditioning professionals may use caution when designing lower-extremity exercises, as velocity characteristics may be diminished for an acute period of time (0–30 minutes) post-exercise. While the present investigation used an isokinetic dynamometer to assess ACC and Vmax, we acknowledge that not everyone has the ability to utilize this mode assessment. In addition, the present study included resistance-trained individuals, thus, the recovery responses may greatly differ compared to sedentary or older populations. Lastly, the present study controlled for overall total volume between the training protocols. While this may be common for recreational and lab based training, the present exercise protocols may not be applicable across all activity levels.
In summary, the present investigation observed similar fatigue and recovery-related responses between genders in their ability to generate velocity rapidly (ACC) following PE and CH squat protocols. Similarly, apart from the intensity difference for males at Post0, all Vmax values post-fatigue were significantly decreased throughout all of recovery (Post0-Post30). Given the importance of maximal and rapid velocity capacities in many sports and tasks of daily living (e.g., accelerating, cutting, stepping, etc.) [2, 7, 34], the present findings reveal that a practical bout of lower body resistance exercise may reduce velocity capabilities for up to 30 minutes following a single exercise.
Footnotes
Conflict of interest
None of the authors has any conflict of interest to disclose.
Abbreviations
References
1.
HäkkinenK. Neuromuscular fatigue and recovery in male and female athletes during heavy resistance exercise. Int J Sports Med.1993; 14(2): 53-9.
2.
ThompsonBJRyanEDSobolewskiEJSmithDBConcholaECAkehiK, et al. Can maximal and rapid isometric torque characteristics predict playing level in Division I American collegiate football players? J Strength Cond Res.2013; 27(3): 655-61.
3.
ThompsonBJConcholaECPalmerTBStockMS. Effects of aging on maximal and rapid velocity capacities of the leg extensors. Exp Gerontol.2014; 58: 128-31.
4.
ConcholaECThieleRMPalmerTBSmithDBThompsonBJ. Acute Postexercise Time Course Responses of Hypertrophic vs. Power-Endurance Squat Exercise Protocols on Maximal and Rapid Torque of the Knee Extensors. J Strength Cond Res.2015; 29(5): 1285-94.
5.
MarshallPWMRobbinsDAWrightsonAWSieglerJC. Acute neuromuscular and fatigue responses to the rest-pause method. J Sci and Med in Sport.2012; 15(2): 153-8.
6.
LinnamoVHäkkinenKKomiP. Neuromuscular fatigue and recovery in maximal compared to explosive strength loading. Eur J Appl Physiol Occup Physiol.1997; 77(1-2): 176-81.
7.
NguyenDBrownLCoburnJJudelsonDEurichAKhamouiA, et al. Effect of delayed-onset muscle soreness on elbow flexion strength and rate of velocity development. J Strength Cond Res.2009; 23(4): 1282-6.
8.
AagaardPSimonsenEBAndersenJLMagnussonPDyhre-PoulsenP. Increased rate of force development and neural drive of human skeletal muscle following resistance training. J Appl Physiol.2002; 93(4): 1318-26.
9.
MarshallPMcEwenMRobbinsD. Strength and neuromuscular adaptation following one, four, and eight sets of high intensity resistance exercise in trained males. Eur J Appl Physiol2011; 111(12): 3007-16.
10.
SamozinoPRejcEDi PramperoPEBelliAMorinJB. Optimal force-velocity profile in ballistic movements–altius: citius or fortius? Med Sci Sports Exerc.2012; 44(2): 313-22.
11.
SamozinoPMorinJBHintzyFBelliA. A simple method for measuring force, velocity and power output during squat jump. J Biomech.2008; 41(14): 2940-5.
12.
SamozinoPEdouardPSangnierSBrughelliMGimenezPMorinJB. Force-velocity profile: imbalance determination and effect on lower limb ballistic performance. Int J Sports Med.2014; 35(6): 505-10.
13.
HunterSK. Sex differences in human fatigability: mechanisms and insight to physiological responses. Acta Physiol (Oxf).2014; 210(4): 768-89.
14.
Esbjornsson-LiljedahlMBodinKJanssonE. Smaller muscle ATP reduction in women than in men by repeated bouts of sprint exercise. J Appl Physiol (1985). 2002; 93(3): 1075-83.
15.
EnokaRMStuartDG. Neurobiology of muscle fatigue. J Appl Physiol.1992; 72(5): 1631-48.
16.
GandeviaSC. Spinal and supraspinal factors in human muscle fatigue. Physiol Rev.2001; 81(4): 1725-89.
17.
JamesCSaccoPJonesD. Loss of power during fatigue of human leg muscles. J Physiol.1995; 484(1): 237-46.
18.
PinciveroDGreenRMarkJCampyR. Gender and muscle differences in EMG amplitude and median frequency, and variability during maximal voluntary contractions of the quadriceps femoris. J Electromyog Kinesiol.2000; 10(3): 189-96.
19.
HattinHCPierrynowski,MRBall,KA. Effect of load, cadence, and fatigue on tibio-femoral joint force during a half squat. Med Sci Sports Exerc.1989; 21(5): 613-8.
20.
ThieleRMConcholaECPalmerTBDefreitasJMThompsonBJ. The effects of a high-intensity free-weight back-squat exercise protocol on postural stability in resistance-trained males. J Sports Sci.2014; (ahead-of-print): 1-8.
21.
BrownLEStrengthNAssociationC. Strength Training: Human Kinetics; 2007.
22.
Van RoieEDelecluseCCoudyzerWBoonenSBautmansI. Strength training at high versus low external resistance in older adults: effects on muscle volume, muscle strength, and force–velocity characteristics. Exp Gerontol.2013; 48(11): 1351-61.
23.
WeirJPKeefeDAEatonJFAugustineRTTobinDM. Effect of fatigue on hamstring coactivation during isokinetic knee extensions. Eur J Appl Physiol Occup Physiol.1998; 78(6): 555-9.
24.
HoushDJHoushTJWeirJPWeirLLJohnsonGOStoutJR. Anthropometric estimation of thigh muscle cross-sectional area. Med Sci Sports Exerc.1995; 27(5): 784-91.
25.
BrownLESjostromTComeauMJWhitehurstMGreenwoodMFindleyBW. Kinematics of biophysically asymmetric limbs within rate of velocity development. J Strength Cond Res.2005; 19(2): 298-301.
26.
MurrayDBrownLZinderSNoffalGBeraSGarrettN. Effects of velocity-specific training on rate of velocity development, peak torque, and performance. J Strength Cond Res.2007; 21(3): 870-4.
27.
YamauchiJMishimaCNakayamaSIshiiN. Aging-related differences in maximum force, unloaded velocity and power of human leg multi-joint movement. Gerontol.2010; 56(2): 167-74.
28.
BrownLEWhitehurstM. The effect of short-term isokinetic training on force and rate of velocity development. J Strength Cond Res.2003; 17(1): 88-94.
29.
SenefeldJYoonTBementMHunterS. Fatigue and recovery from dynamic contractions in men and women differ for arm and leg muscles. Muscle Nerve.2013; 48(3): 436-9.
Bigland-RitchieBDawsonNJohanssonRLippoldO. Reflex origin for the slowing of motoneurone firing rates in fatigue of human voluntary contractions. J Physiol.1986; 379(1): 451-9.
33.
LarssonLGrimbyGKarlssonJ. Muscle strength and speed of movement in relation to age and muscle morphology. J Appl Physiol.1979; 46(3): 451-6.
34.
ButtelliOSeckDVandewalleHJouaninJMonodH. Effect of fatigue on maximal velocity and maximal torque during short exhausting cycling. Eur J Appl Physiol Occup Physiol.1996; 73(1): 175-9.
35.
JohnsonMAPolgarJWeightmanDAppletonD. Data on the distribution of fibre types in thirty-six human muscles: an autopsy study. J Neurol Sci.1973; 18(1): 111-29.
36.
FryAC. The role of resistance exercise intensity on muscle fibre adaptations. Sports Med.2004; 34(10): 663-79.