Studies have shown that Running Anaerobic Sprint Test (RAST) is population specific.
OBJECTIVE:
To investigate the validity of RAST in assessing the anaerobic power of young soccer players.
METHODS:
Thirty-one volunteer young amateur soccer players underwent a standardized WAnT test and a RAST test in random order. Peak power (PP), average power (AP), minimum power (MP), fatigue index (FI), blood lactate (LA), heart rate (HR) and ratings of perceived exertion (RPE) were determined during the tests.
RESULTS:
No significant differences were found between RAST-PP and WAnT-PP. RAST-AP and RAST-FI were significantly lower than that of WAnT whereas, RAST-MP was significantly higher than WAnT-MP. RAST-LA was significantly lower than WAnT-LA; however, mean and peak RAST-HR were significantly higher than WAnT. RPE responses were found to be similar between the tests. PP, AP and MP from the two tests were significantly correlated. The standard errors of the estimates values for PP, AP and MP were 78.5 W, 44.4 W and 38.7 W, respectively. Peak and mean HRs from two tests were significantly correlated. No significant association was present between RAST-LA and RAST-RPE, and WAnT-LA and WAnT-RPE, respectively.
CONCLUSIONS:
Although recruiting different physiological and metabolic processes, RAST may be used in place of WAnT to assess the anaerobic characteristics of young soccer players.
Soccer is an intermittent and high-intensity sport which demands a high level of aerobic and anaerobic energy production [1]. Match and training analysis results in young players revealed that players perform low intensity aerobic activities in large proportion of the total match and training durations [2] and also a number of activities that demand anaerobic performance, such as sprints, jumps, change of direction, negative and positive accelerations, and tackles [3]. Match analyses of young players (U9–U20) through global positioning systems or video-recording methods showed that, during a 70–90 min game players covered distances of between 4000–8800-m [4, 5, 6]. It has also been found that during a game not only total, but also high-intensity running distances increased with age [5]. Harley et al. [6] showed that in elite U12–U16 soccer players, 30% of the total distance covered on average include high-intensity runs, 12% very high-intensity runs, and 3.6% sprints. It was reported that high-intensity activities comprise less than 10% of the total match time [4, 6]. A high level of relationship between the match activity profiles of young soccer players and field test results, such as repeated sprint and intermittent endurance tests [7, 8], suggests that players’ physiological capacities are important for their match performances. Therefore, in order to achieve a high level of match performance in young soccer players, it is important to improve their physiological capacity parallel to their technical and tactical skills, and to monitor their progression at different intervals during the training period.
Physical characteristics of participants
Mean Sd
Age (yrs)
15.9
1.0
Height (cm)
174.4
7.0
Body weight (kg)
62.7
10.6
Body fat (%)
17.6
4.1
There are number of tests that are commonly implemented in the evaluation of anaerobic power and capacity. The Wingate Test (WAnT), probably the best-known test for evaluating anaerobic power, is a 30-second cycling test which is performed with a standard protocol in a laboratory condition [9]. On the other hand, Running Anaerobic Sprint Test (RAST), which was inspired by the WAnT, is an easy-to-implement, low-cost and non-technical-skill-requiring field test for evaluating anaerobic power and capacity [10]. The first RAST studies demonstrated strong associations between power parameters measured by RAST and WAnT [10]. In addition, RAST was proven to be a reliable and valid test by a recent study conducted on young soldiers [11]. In variance with the above, in a study on university soccer players, the physiological and power variables of RAST and WAnT were not correlated [12]. Similarly, in another study RAST was useful for assessing anaerobic power, although invalid for evaluating anaerobic capacity in U20 soccer players [13]. These findings suggested that power parameters obtained from RAST are population specific, and its results show some variability when compared with WAnT. Generally, the laboratory tests are more reliable and valid than the field tests; however, because they are expensive and equipment dependent, they may not be readily accessible for young amateur and/or youth system players and for their coaches who have limited resources.
Hence the aim of this study was to examine the relationships between the RAST- and WAnT-assessed physiological responses and power parameters of young soccer players, and to determine if RAST can be used in this population.
Methods
Participants
A total of 31 volunteer amateur young soccer players aged between 14–17 yrs with no lower extremity injury (Training year 3.0 1.7 y), participated in this study (Table 1). The study was approved by the Non-Interventional Clinical Research Ethics Board (GO-15/707-17). Each participant was given detailed information about the study, signed an informed consent form and instructed to avoid strenuous activities the day before and on testing days, and any caffeinated beverages before tests.
Participants underwent WAnT and RAST tests in random order, in 5–7 day intervals between 16:00 and 18:00 pm to minimize any circadian rhythm effect.
Measures
Anthropometric measurements
Height and body weight (BW) were measured by a stadiometer (Holtain, UK) and an electronic scale (Tanita TBF 410A, USA) respectively. Body fat percentages (BF%) were determined by skinfold measurements taken at triceps, biceps, subscapular and suprailiac by using skinfold callipers (Holtain, UK). Age specific body density values were estimated using the Durnin-Womersley [14] formula. BF% was calculated by the following formula [15]: BF% [(4.57/D)–4.142] 100, where D represents body density.
Wingate anaerobic power test
WAnT test was performed on an electromechanical cycle ergometer (Monark 894E, Sweden). Prior to testing, each participant performed a 5-minute warm-up against a workload of 60–90 W on cycle ergometer. In the 2 and 4 minutes during the warm-up, participants pedalled at their maximum speeds for 5-s in order to get used to the actual testing speed. Following the warm-up, a 3-min dynamic stretching and 2-min of passive rest were given. Before beginning the test, adjustments in the ergometer were made to ensure an optimal cycling position. The WAnT was conducted according to the widely accepted recommendations for standardization for 30-s against a resistance at 75 g.kg of BW [9]. The participants were verbally motivated during the tests. Peak power (PP), average power (AP), and minimum power (MP) were calculated automatically and fatigue index (FI) was calculated with the following formula: FI [(PP–MP)/PP] 100.
Running Anaerobic Sprint Test
RAST was performed on an artificial turf training field. Initially the BW of each participant was measured, followed by a warm-up period which included a 5-min run at a self-determined pace, 5–7 exercises of dynamic stretching, and a couple of 10–15-m sprints. Three to five minutes of passive recovery were given following the warm-up sessions, and participants performed 6 35-m sprints with 10-second passive recovery. Sprint times were determined by the telemetric chronometers (Fusion Sport, Australia). Sprint direction was alternated for each sprint so that the finishing position of one sprint became the start of the next. For starting signals 5-s countdowns were used. Participants were verbally motivated during the tests. Power outputs for each sprint and values for PP, AP and MP were determined by the formula below, and FIs were calculated by the same formula as in WAnT.
Blood lactate measurements
Resting (LA), after the test (LA), and 3, 5, and 7 minutes of passive recovery period blood LA (LA) concentrations were measured from the earlobe blood samples by a calibrated electro-enzymatic hand analyser (Nova Lab, USA).
Heart rate measurements
Resting, testing, and post-test HRs were recorded with 1-second intervals using telemetric HR monitors (Polar RS800, Finland). Resting HR (HR) was obtained by averaging the data belonging to the last 5 minutes of the 20-minute sitting resting records. The average values of the beginning and end-test HR data were calculated as the “mean HR” (HR), and the maximum values were recorded as the “peak HR” (HR).
Ratings of perceived exertion (RPE) measurements
RPE was determined immediately after the completion of WAnT and RAST tests by using the Borg 6–20 RPE scale [16]. The use of the scale was explained to participants and RPE was recorded at the end of each test.
Statistical analyses
Data are presented as mean SD. Normal distribution of the data was tested using the Kolmogorov-Smirnov test. Paired sample t-test was used to assess the differences between the RAST and WAnT power outputs and physiological responses. Effect sizes of mean differences (ES) were estimated using Cohen’s d-test, and ES magnitudes were classified according to the Hopkins’ Scale: 0.0–0.2 trivial; 0.2–0.6 small; 0.6–1.2 moderate; 1.2–2.0 large; 2.0 very large [17]. The differences between the end-of-test and recovery LA and HR values were evaluated using 2 4 (Test Time) two-way repeated-measures ANOVA. Bonferroni post hoc test was performed for significant time effects. The assumption of sphericity of repeated measures was validated through Mauchly test. In cases of invalid sphericity assumptions, Greenhouse Geisser correction for 0.75, or Huynh-Feldt correction for 0.75 were applied accordingly [18]. Limits of agreement (LoA) for PP, AP and MP values from WAnT and RAST tests were assessed using Bland-Altman plots [19]. Pearson correlation coefficients and standard errors of the estimates (SEE) were calculated to establish the relationships between the power variables from WAnT and from RAST. The magnitudes of the relationships between the variables from both tests were classified as follows: 0.0–0.30 low; 0.31–0.49 moderate; 0.50–0.69 high; 0.70–0.89 very high; 0.90–1.00 perfect [17]. All analysis were executed in SPSS software (Ver. 16.0), and statistical significance was set at 0.05.
Results
Power output, FI and RPE values obtained from the RAST and WAnT tests are shown in Table 2. The RAST-PP values were lower than the WAnT-PP values but this difference was not significant ( 0.194). On the other hand, the RAST-AP were significantly lower than the WAnT-AP values ( 0.007). As opposed to the case with the AP, RAST-MP were found to be higher than the WAnT-MP, which was statistically significant ( 0.010). When compared with the RAST-FI values, the WAnT-FI values were significantly higher ( 0.001), but RPE scores were similar ( 0.217). All calculated ES values for the power variables, and RPE, were classified as “small” ( 0.24, 0.52, 0.49, 0.23), whereas the ES classification for the FI scores was “moderate” ( 0.67).
Power Outputs, FI and RPE values obtained during WAnT and RAST
WAnT
RAST
p
PP (W)
609.3
130.6
587.6
152.9
0.194
AP (W)
483.7
94.7
458.5
105.4
0.007
MP (W)
343.5
67.5
366.9
84.2
0.010
FI (%)
42.9
7.8
36.7
7.8
0.001
RPE
17.0
1.4
17.4
1.2
0.217
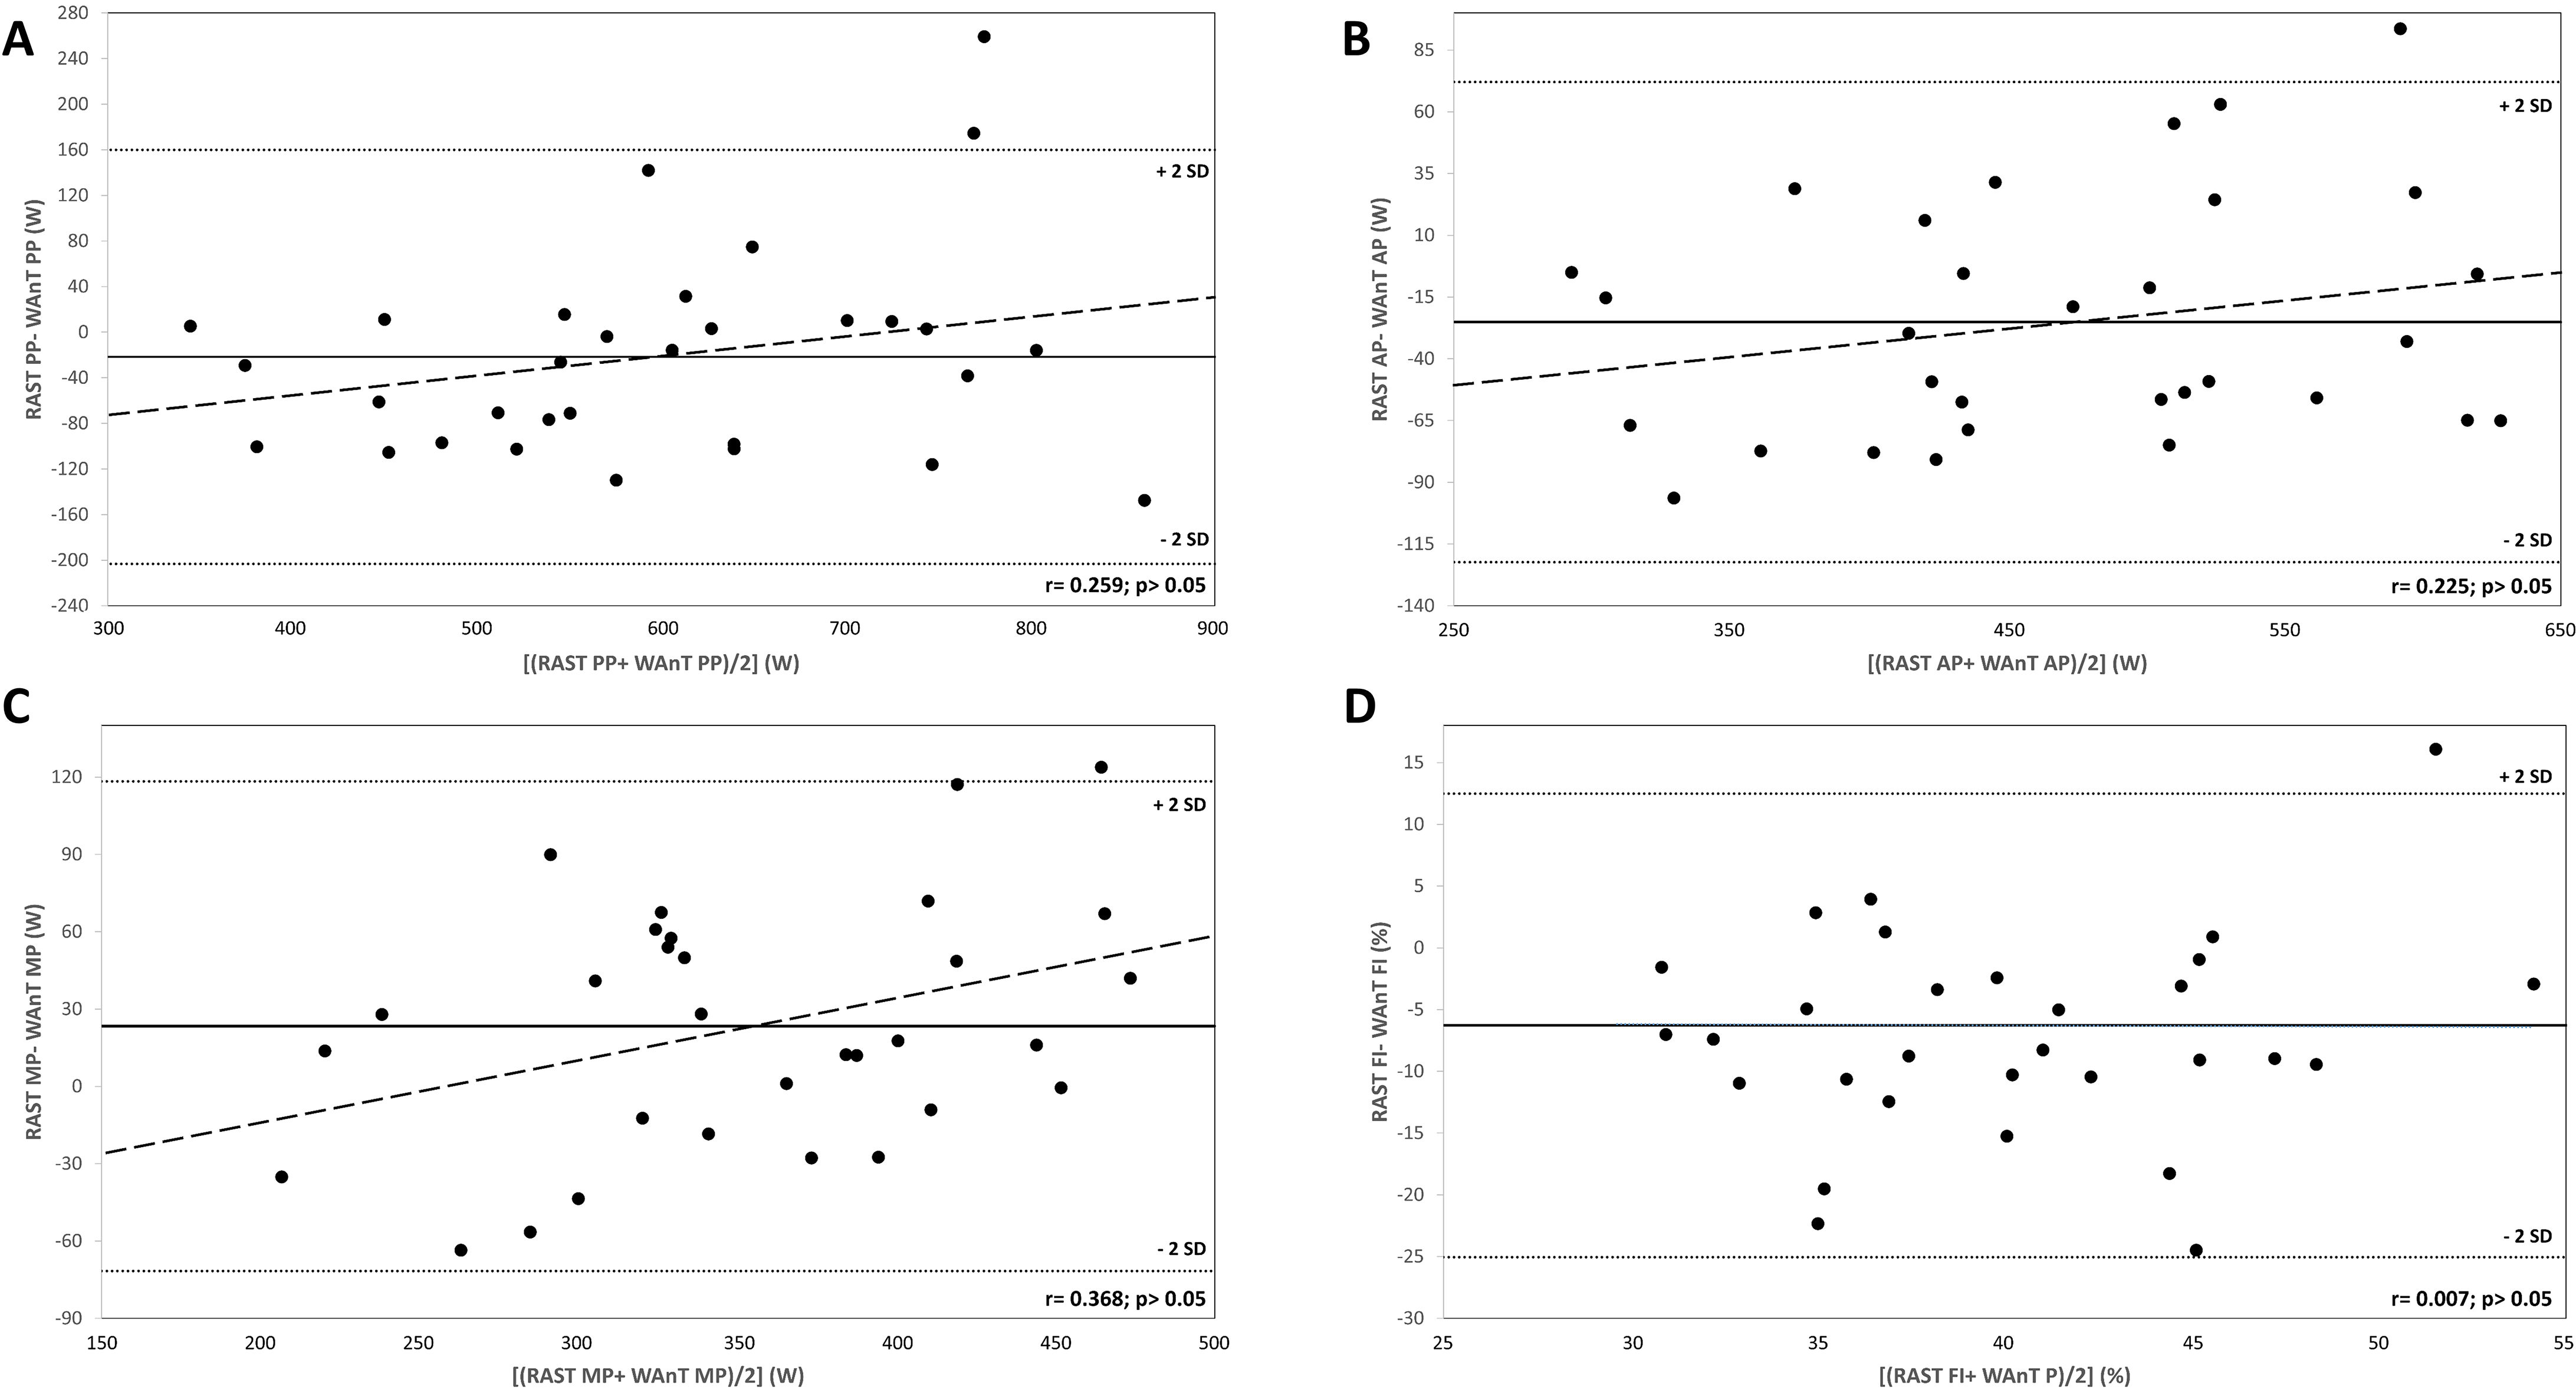
Bland-Altman plots showing the limits of agreement for the PP, AP and MP values from WAnT and RAST. Midline: Mean of error (difference), Dots: Upper and lower agreement limits, Dashes: The line representing the relationship between the error (difference) and power values. A Peak power, B Average power, C Minimum power, D Fatigue index.
The LoA for the PP, AP, MP and FI values are demonstrated on Fig. 1A–D. The Bland-Altman plot for the measured PP, AP, MP and FI from WAnT and RAST showed a mean difference of 21.6 90.8 W (Fig. 1A), 25.2 48.6 W (Fig. 1B), 23.4 47.5 W (Fig. 1C) and 6.3 9.4% (Fig. 1D) respectively. Similarly the 95% LoA ranged from 203.2 to 159.2 W for PP, from 122.4 to 72.0 W for AP, from 71.6 to 118.4 W for MP and from 25.1 to 12.5% for FI. For PP 93.5%, for AP, MP and FI on the other hand, 97.5% of the mean differences of the participants were distributed within the 2SD intervals (Fig. 1A–D). No association was found between differences in PP, AP and FI values and mean values of PP, AP and FI measured from WAnT and RAST ( 0.259, 0.160 for PP; 0.225, 0.223 for AP; 0.007, 0.971 for FI) however, there was an association between the differences in MP values measured from WAnT and RAST and mean values measured from WAnT and RAST ( 0.368, 0.042).
There was a high level of correlation between the RAST and WAnT-PP values ( 0.806; 0.000). Similarly, the AP and MP values from RAST were highly and significantly correlated with those from WAnT ( 0.887 and 0.826, respectively; 0.000). The calculated SEE values for PP, AP and MP were 78.5 W, 44.4 W and 38.7 W, respectively. No significant association was present between the FI values from RAST and WAnT ( 0.275; 0.05).
LA and HR values measured after WAnT and RAST and during recovery period
LA (mmol.L)
HR (beat-min
LA
3 min.
5 min.
7 min.
HR
3 min.
5 min.
7 min.
WAnT
7.3
0.32
11.0
2.1
12.1
1.9
11.9
1.8
187.4
8.2
120.1
12.9
112.6
11.7
108.9
11.9
RAST
6.4
0.31
10.2
2.0
11.0
2.2
11.1
2.0
196.2
7.3
121.1
14.0
114.0
12.9
112.6
11.5
0.05 WAnT significantly higher than RAST; 0.05 RAST significantly higher than WAnT; 0.05 significantly higher than LA; 0.05 significantly higher than LA 3 min.; 0.05 significantly lower than HR; 0.05 significantly lower than HR 3 min.; 0.05 significantly lower than HR 5 min.
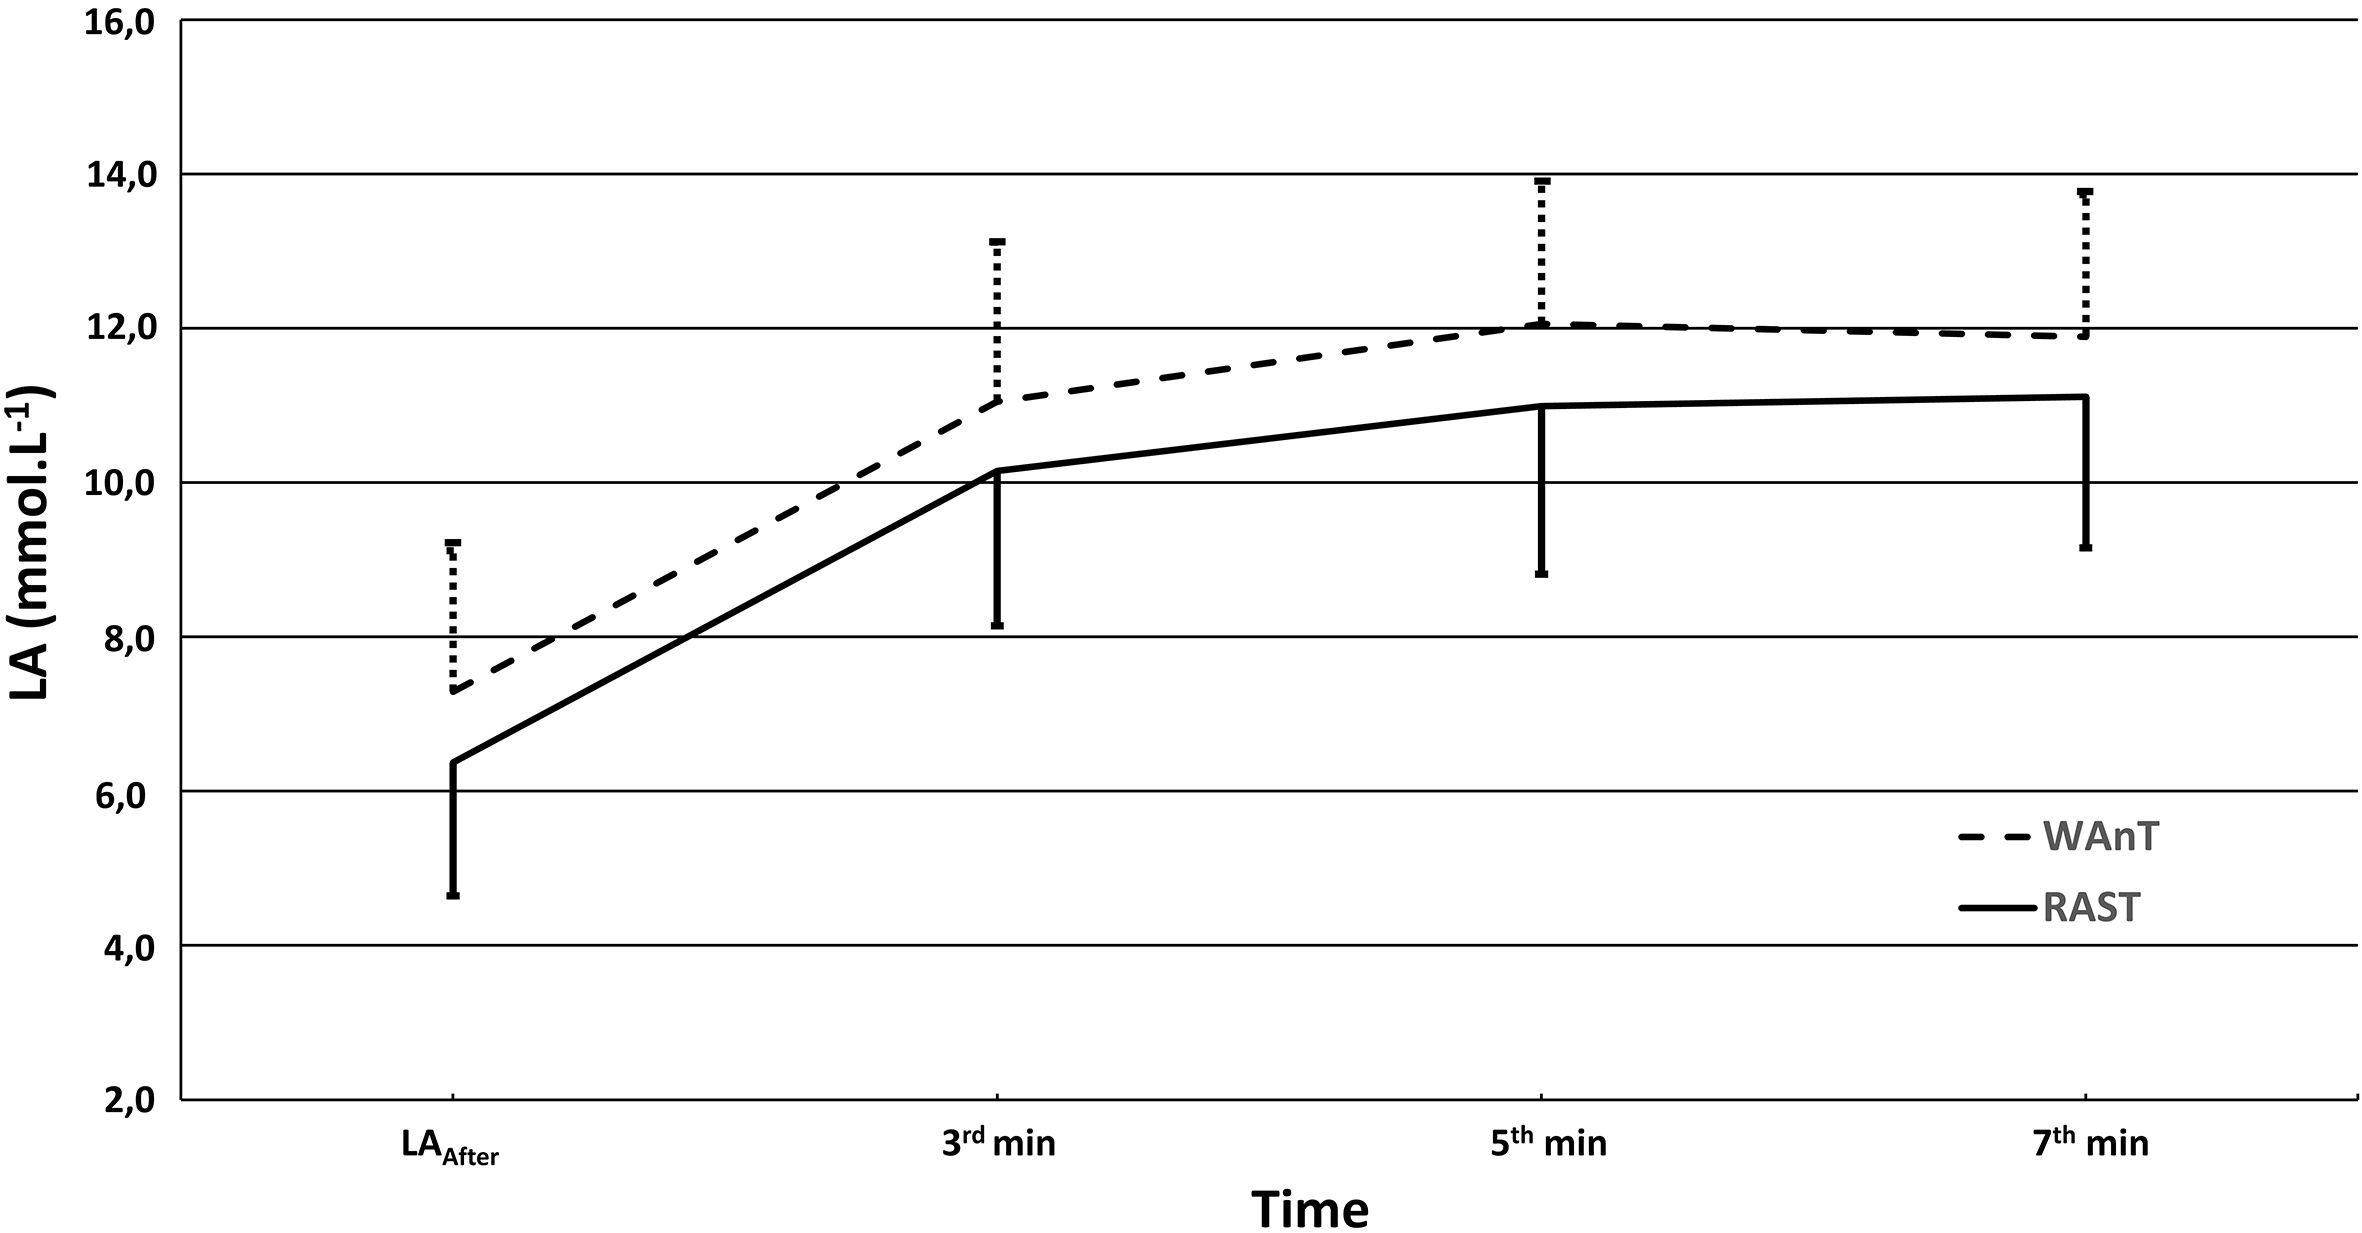
Time plot of WAnT- and RAST-measured after the test and recovery blood LA concentrations. Results are reported as mean and SD.
The RAST- and WAnT-LA concentrations and HR values did not reveal any significant differences (1.26 0.04 and 1.35 0.06 mmol.L, 0.05; 80.0 12.6 and 81.9 8.1 bpm, 0.05; respectively). The ES values for LA and HR were trivial ( 0.19 and 0.20 respectively). The HR value during RAST (183.9 8.7 bpm) was significantly higher than that was recorded during WAnT (172.8 12.2 bpm) ( 0.000). The ES value that was calculated for HR was classified as moderate ( 1.33 and 0.96 respectively). HR ( 0.589, 0.000) and HR ( 0.419, 0.024) values from the two tests showed high and moderate levels of associations. Conversely, no association was present between the LA concentrations ( 0.143, 0.05) and RPE values ( 0.023, 0.05) of two tests.
LA and LA concentrations and HR values after RAST and WAnT are listed in Table 3. The results showed that the performed tests had significant effects on the blood LA concentrations ( 0.011). LA and LA concentrations measured after WAnT were significantly higher than the concentrations after RAST (Fig. 2). Similarly, the effect of time on blood LA concentrations was also statistically significant ( 0.000). High levels of blood LA concentrations were detected during the recovery period. The 3, 5 and 7 minute blood LA levels were significantly higher than the LA values ( 0.000). The 5 and 7 minute LA levels were similar ( 0.05) and both were significantly higher than the 3 minute ( 0.000). On the other hand, Test x Time interactions were found to be insignificant ( 0.05).
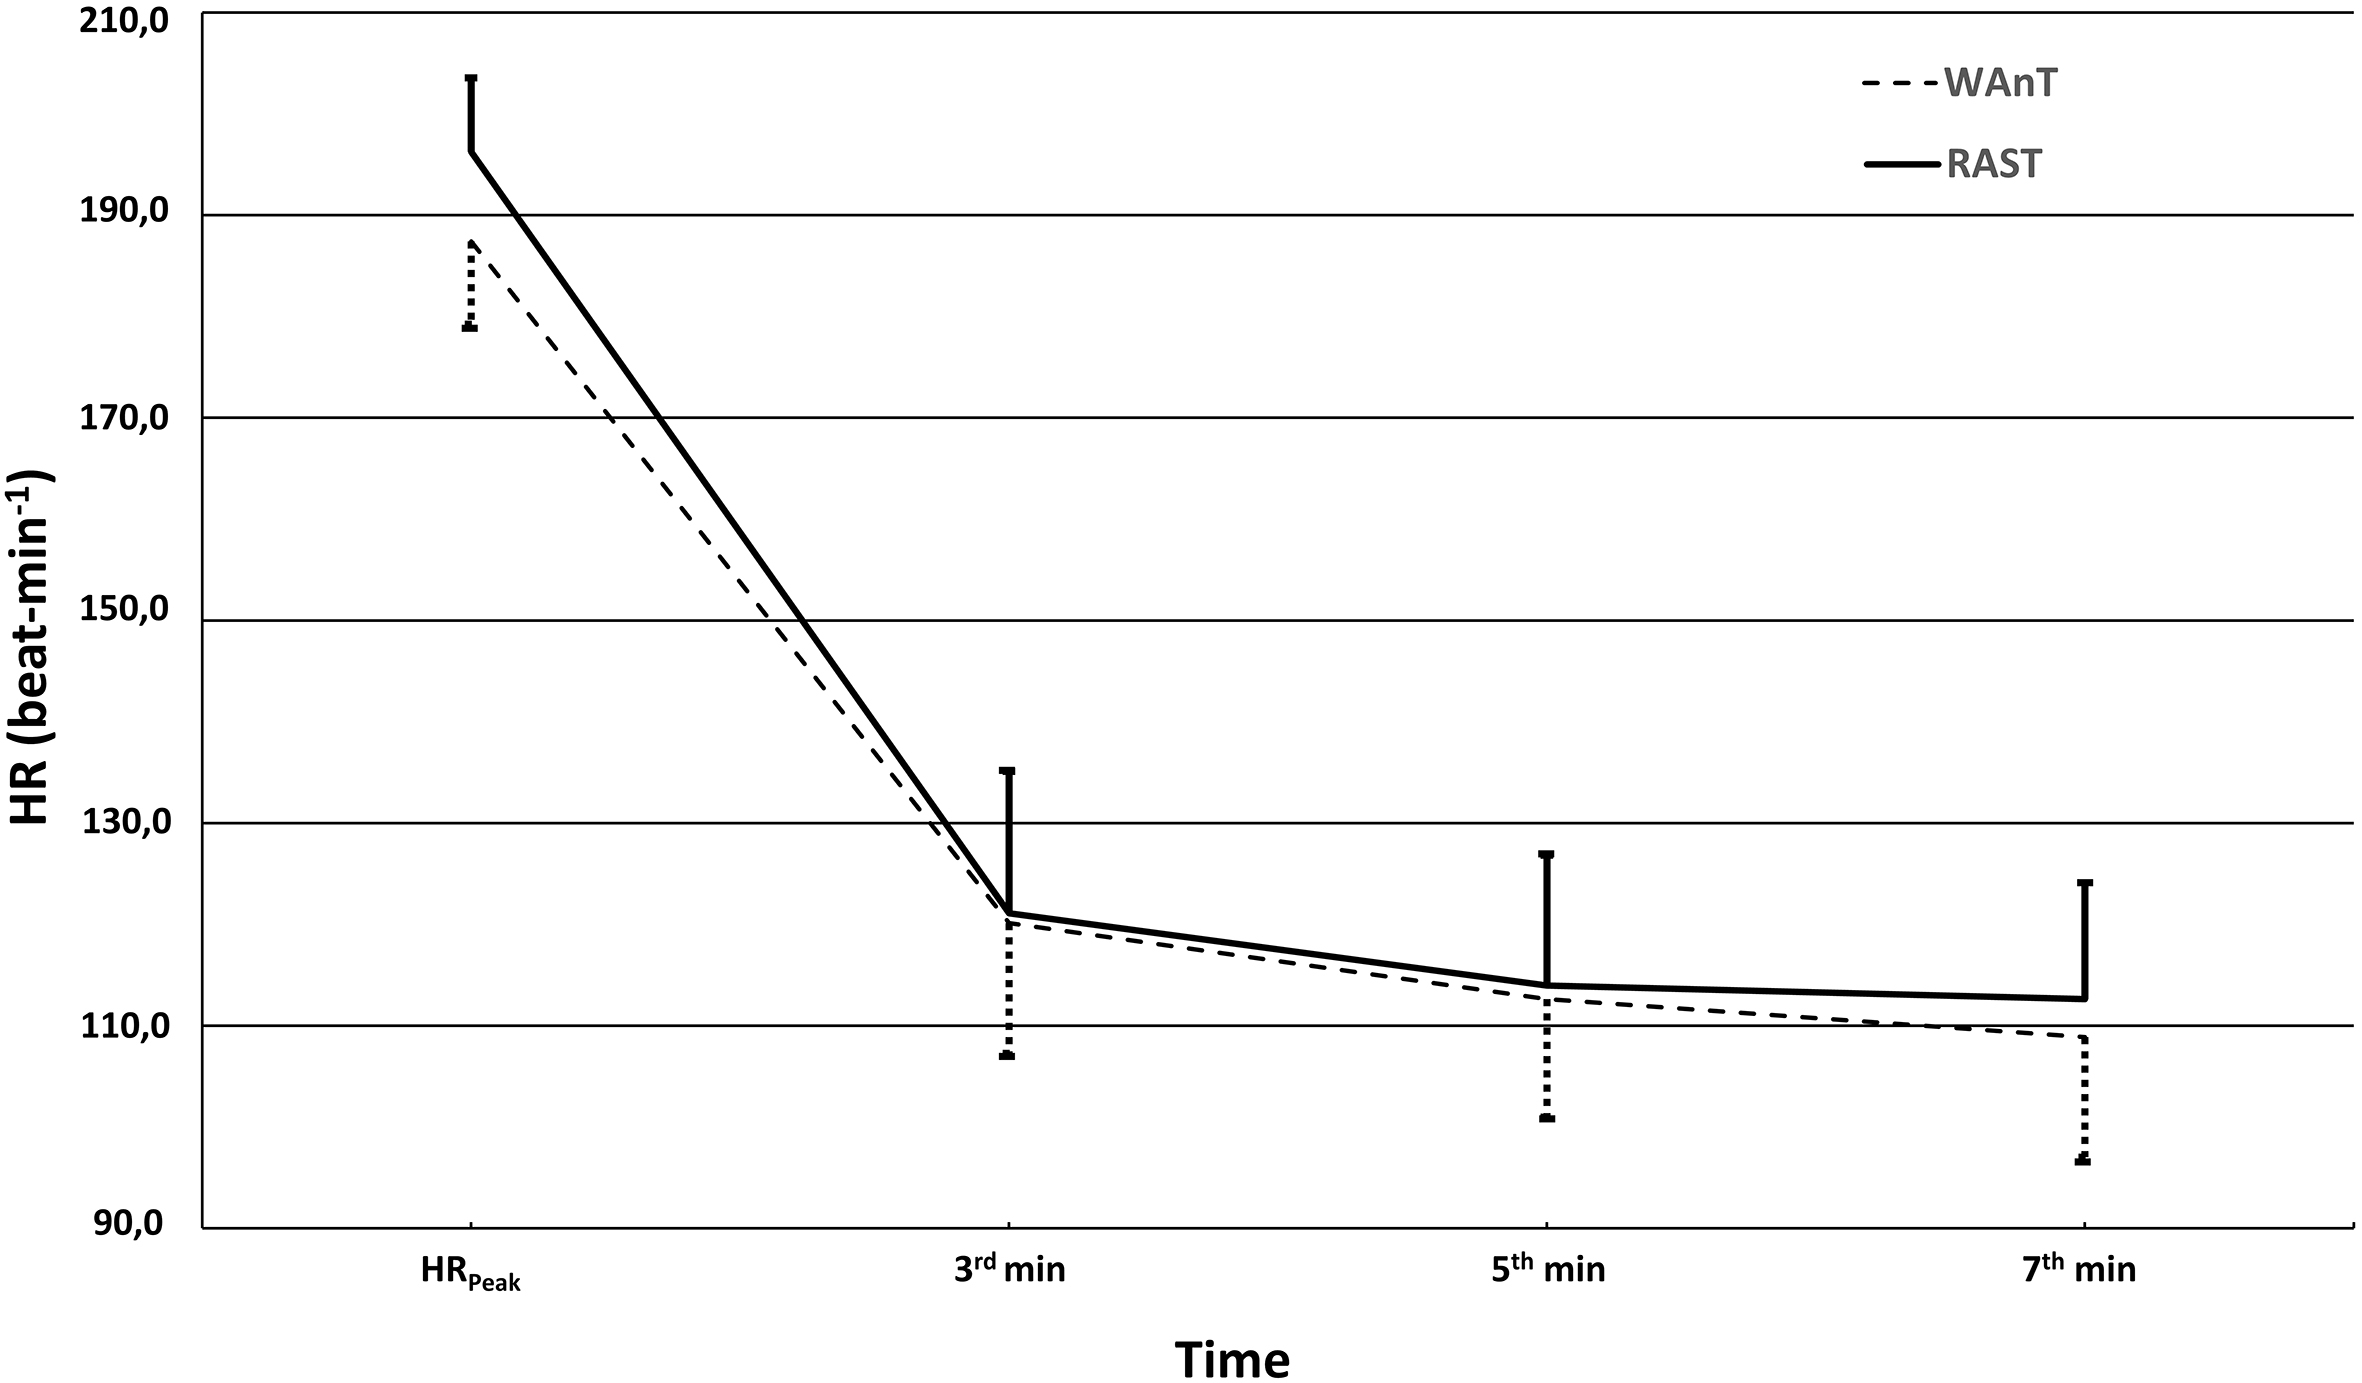
The repeated measures ANOVA indicated that the performed tests also had significant effects on HR values ( 0.014). Conflicting with the case of blood LA concentrations, the WAnT-measured HR and HR were lower than those measured from RAST (Table 3). The effect of time on the HR values was statistically significant ( 0.000). HRs substantially decreased during the recovery period as expected. The 3, 5 and 7 minute HR were significantly lower than the HR ( 0.000) and previous HR ( 0.03) (Fig. 3). The Test x Time interactions for the HR values were significant ( 0.000).
Time plot of WAnT- and RAST-measured HR and recovery HR values. Results are reported as mean and SD.
Discussion
The main finding of our study indicated that RAST can be used in place of WAnT to evaluate the anaerobic power of young soccer players, despite the differences in physiological responses. As stated before, the RAST, a field test that was inspired by the WAnT, assesses anaerobic power by calculating the PP, AP, MP and FI values as in WAnT. Significant correlations ( 0.785) was found between 100-m, 200-m and 400-m performances and RAST-PP and AP scores in sprinters [20, 21]. In a study of trained soldiers, significant relationships was determined between the RAST-PP and AP values and 35-m, 50-m, 100-m, 200-m and 400-m sprint times (0.99 for PP and 0.86 for AP, 0.78 for PP and 0.68 for AP, 0.62 for PP and 0.64 for AP, 0.67 for PP and 0.76 for AP, 0.46 for PP and 0.68 for AP, respectively) [11]. On the other hand, in a more recent study of soldiers, low correlations were reported between the RAST outputs and 50-m, 100-m and 300-m sprint with no correlation with 100-m [22]. These associations support the notion that RAST is an anaerobic test that can be used to evaluate anaerobic power. On the other hand, validation studies of RAST have shown that, the RAST power parameters are population specific, and subject to some degree of variation when compared with WAnT.
In our study, RAST was performed on an artificial turf with the participants wearing soccer cleats, in order to achieve a high level of ecological validity for the power variables. Contrary to the previous studies [11, 12, 23], our results did not reveal any significant differences between the RAST- and WAnT-PP values. On the other hand, in our study the RAST-AP values were lower than the WAnT values, in accordance with the previous reports [11, 12, 23]. In addition we found that the MP scores from RAST were statistically higher than those from WAnT.
The correlation between the PP, AP and MP values from these two tests were high; with low SEE values. Significant high associations were previously reported [10] between RAST- and WAnT-PP and AP ( 0.82, 0.75, respectively), consistent with our findings. In contrast low correlations were found between the RAST- and WAnT-PP and -AP ( 0.46; 0.53, respectively) in trained soldiers [11]. Similarly, in another study with futsal players the PP, AP and MP from RAST and WAnT showed low correlations ( 0.59; 0.64; 0.45 respectively) when compared with our findings [24]. Keir et al. [12], in their study on 8 university soccer players, on the other hand, could not establish any significant associations between the power parameters obtained from RAST and WAnT. All of these findings indicated that the power parameters measured by RAST may show variations depending on the target population.
The mean differences (bias) between the RAST- and WAnT-power parameters were low, and their distribution fell within the LoA of 2SD. In previous studies related with validity of RAST, no data was found for comparison of Bland-Altman plots. On the other hand in a study by Bongers et al. [25] which determined the validity of pediatric RAST by using Bland-Altman plots in 65 healthy boys and girls between the ages of 6 to 19 years (mean age 10.0 2.8 yrs, median 9.7 and 9.8 yrs, respectively), mean bias (128.9 164.7 W) between pediatric RAST- and WAnT-PP was higher than that of the present study (Fig. 1A). However, in the same study mean bias (0.3 86.5 W) between RAST- and WAnT-AP was lower than that of the present study (Fig. 1B). In addition, LoA (from 34.9 to 294.6 W for PP, from 86.1 to 86.8 W for MP) [25] that was calculated for power parameters, was similar to the LoA of the present study (Fig. 1A and B). According to the Bland-Altman plots no significant association was found between difference of measurement and mean of measurements for PP, AP and FI, except for MP. These findings indicated that the differences between the RAST- and WAnT-PP, AP and FI were constant and independent of the magnitude of the measurement (i.e. homoscedascity). However, the difference of measurement and the mean of measurement for MP between RAST and WAnT had a significant positive correlation, indicating that the MP was underestimated at low values and overestimated at high values in the present sample (i.e. heteroscedasticity). The correlation coefficients, SEE values and Bland-Altman plot results altogether suggest that RAST can be used in young soccer players to evaluate their anaerobic power.
The LA and HR values from the two tests were statistically similar, which demonstrates that the participants performed each test with comparable physiological and hormonal background. On the other hand, the physiological responses of our participants to RAST and WAnT tests were different. The LA, RPE scores and FI indicated that the players were exceedingly exhausted during both tests. Peak LA after RAST (11.1 mmol.L) was higher than the results of the previous studies on U17 and national soccer players of varying age-groups and training levels, young elite basketball players and sports school students; whereas this value was lower than those of U20 and university soccer players, and well-trained healthy male participants [11, 12, 13, 26]. No associations were found between RAST and WAnT-LA. Besides, not only the LA, but also LA concentrations were higher after WAnT. The 5 and 7 minute LA concentrations were similar, which suggests that participants reached the peak blood LA concentrations within 5-min after the tests. According to these results the anaerobic glycolytic metabolism was different for these two tests, however this metabolism was higher for WAnT. On the other hand, insignificant Test x Time interaction for the LA indicated that the blood LA elimination rates during the passive recovery periods after both tests were similar. There is a limited number of studies regarding the physiological responses to WAnT and RAST. Keir et al. [12] demonstrated that, the peak VO and peak LA responses to WAnT and RAST were similar; however, the VO and HR values that were measured during RAST were significantly higher than WAnT. The VO findings of the Keir et al. [12] and the LA findings of our study may be accepted as some evidence for the assumption that RAST bears a more aerobic characteristic than WAnT. As known, RAST is performed against participants own body weight; however, an external resistance is used during the WAnT. Unlike pedalling exercises, running also activates the upper limb and the postural muscles, therefore seemingly the oxygen transport systems get more active during RAST.
The HR values from the two tests were higher than those measured in sports school students [26] and mountain bikers [23]. In addition HR and HR values measured during RAST were higher than the values measured during WAnT and also significant associations were found between the HR values measured during the two tests. Keir et al. [12] reported that HR values of university students during RAST were similar with those recorded during WAnT, which is in accordance with our findings; however, their RAST- and WAnT-HR values were not associated. Conversely in mountain bikers, RAST- and WAnT-HR and HR values were similar [23]. The high HR values during RAST were reflected in the recovery values, as well. The HR values recorded during the passive recovery periods following RAST were significantly higher than the values after WAnT. In variance with the LA concentrations, the HR values showed significant Test x Time interaction which demonstrated that the recovery-period dynamics of the HR values were test-dependent. The observed differences between the circulatory responses may be due to RAST’s having more aerobic characteristic than WAnT [12], or due to the increased cardiac output volumes, in order to meet the oxygen requirements of the activated upper limb and postural muscles during sprints. The HR values during high-intensity runs are generally higher than those recorded during cycling exercises [20].
The mean RPE scores after RAST and WAnT were similar indicating that the participants were similarly exhausted while exerting similar levels of effort during both tests. Yet, the scores did not represent any significant relationships showing that the individual levels of exertion were variable and the levels of perceived difficulty were not systematic. In other words, one who perceived RAST as a highly difficult test might found WAnT easy, or vice versa. On the other hand, the young soccer players in our study reported higher RPE scores than professional adult soccer players after both tests [27]. In this study, the physiological responses (higher LA in WAnT vs higher HR in RAST) were not reflected in RPE scores. Therefore, we speculate that in this age group RPE score assessments may be problematic and using this parameter alone can be misleading.
The RAST-FI values were similar to the values reported in previous studies (32.4%–47%) [16, 21, 22, 23, 24, 27]. Resembling RPE, the WAnT- and RAST-FI values were equally nonrevealing regarding any associations. However, WAnT-FI was significantly higher than RAST. The RAST- and WAnT-PP values were similar, blood LA and AP values were higher in WAnT, and WAnT-MP values were lower. As a result, WAnT showed higher degrees of power decrement. During WAnT a limited number of muscle groups are activated against an external resistance, and effort is exerted continuously. During RAST, on the other hand, work is performed against participants’ own body weight, a greater number of muscle groups are activated while running, and the effort is exerted continuously. These facts may be the reason for the different neuro-mechanical and metabolic processes between the two tests. EMG measurements on the lower extremity muscles during WAnT determined decreases in its frequency spectrum with significant decrements in the power outputs but without any change in amplitude [28, 29]. These findings were interpreted as a consequence of metabolite accumulation which might lead to decreases in myofibril activation rates and significant levels of attenuation in stimulus transmission towards the CNS via afferent neurons (metabolic receptors) [28, 29]. On the other hand, in a study with professional soccer players, Brocherie et al. [27] indicated that during RAST important changes in sprinting mechanics like increase in contact time of foot, stride time and frequency took place together with decreases in both neuromuscular activation and rate of muscle oxygenation. These findings show that when compared to WAnT, the fatigue in RAST is a more complex phenomenon, associated with several neurophysiological and metabolic factors.
Conclusion
The findings of our study demonstrate that RAST may be used for assessing the anaerobic power of young soccer players in place of the common laboratory test, the WAnT, although the physiological responses showed some variations. During RAST, execution of movements is more specific to team sports like soccer and the test can be easily applied by coaches and trainers during training or assessment of anaerobic performance.
Footnotes
Acknowledgments
This study is supported by Hacettepe University Scientific Research Projects Coordination Unit. Project Number: THD-2016-9398.
Conflict of interest
The authors declare no conflict of interest.
References
1.
ReillyTBangsboJFranksA. Anthropometric and physiological predispositions for elite soccer. J Sports Sci.2000; 18(9): 669-83.
2.
AbadeEAGonçalvesBVLeiteNMSampaioJE. Time-motion and physiological profile of football training sessions performed by under-15, under-17, and under-19 elite Portuguese players. Int J Sports Physiol Perform.2014; 9(3): 463-70.
3.
WisloeffUHelgerudJHoffJ. Strength and endurance of elite soccer players. Med Sci Sports Exerc.1998; 30: 462-7.
4.
CastagnaCD’ottavioSAbtG. Activity profile of young soccer players during actual match play. J Strength Cond Res.2003; 17(4): 775-80.
5.
GotoHMorrisJGNevillME. Motion analysis of U11 to U16 elite English Premier League Academy players. J Sports Sci.2015; 33(12): 1248-58.
6.
HarleyJABarnesCAPortasMLovellRBarrettSPaulD, et al. Motion analysis of match-play in elite U12 to U16 age-group soccer players. J Sports Sci.2010; 28(13): 1391-7.
7.
CastagnaCManziVImpellizzeriFWestonMAlvarezJCB. Relationship between endurance field tests and match performance in young soccer players. J Strength Cond Res.2010; 24(12): 3227-33.
8.
Fernandes-da-SilvaJCastagnaCTeixeiraASCarminattiLJGuglielmoLGA. The peak velocity derived from the Carminatti Test is related to physical match performance in young soccer players. J Sports Sci.2016; 34(24): 2238-45.
9.
InbarOBar-OrOSkinnerJ. The Wingate anaerobic test: development, characteristics, and application. Champaign (IL): Human Kinetics.1996.
10.
ZacharogiannisEParadisisGTziortzisS. An evaluation of tests of anaerobic power and capacity. Med Sci Sports Exerc.2004; 36(5): S116.
11.
ZagattoAMBeckWRGobattoCA. Validity of the running anaerobic sprint test for assessing anaerobic power and predicting short-distance performances. J Strength Cond Res.2009; 23(6): 1820-7.
12.
KeirDAThériaultFSerresseO. Evaluation of the running-based anaerobic sprint test as a measure of repeated sprint ability in collegiate-level soccer players. J Strength Cond Res.2013; 27(6): 1671-8.
13.
AndradeVZagattoAKalva-FilhoCMendesOGobattoCCamposE, et al. Running-based anaerobic sprint test as a procedure to evaluate anaerobic power. Int J Sports Med.2015; 36(14): 1156-62.
14.
DurninJVWomersleyJ. Body fat assessed from total body density and its estimation from skinfold thickness: measurements on 481 men and women aged from 16 to 72 years. Br J Nutr.1974; 32(1): 77-97.
15.
BrožekJGrandeFAndersonJTKeysA. Densitometric analysis of body composition: revision of some quantitative assumptions. Annals of the New York Academy of Sciences.1963; 110(1): 113-40.
16.
BorgGA. Psychophysical bases of perceived exertion. Med Sci Sports Exerc.1982; 14(5): 377-81.
17.
HopkinsWMarshallSBatterhamAHaninJ. Progressive statistics for studies in sports medicine and exercise science. Med Sci Sports Exerc.2009; 41(1): 3-13.
18.
WinterEEstonRLambKL. Statistical analyses in the physiology of exercise and kinanthropometry. J Sports Sci.2001; 19(10): 761-75.
19.
BlandJMAltmanD. Statistical methods for assessing agreement between two methods of clinical measurement. The Lancet.1986; 327(8476): 307-10.
20.
MilletGPVleckVEBentleyDJ. Physiological differences between cycling and running. Sports Med.2009; 39(3): 179-206.
21.
ParadisisGTziortzisSZacharogianniE. Correlation of the running-based anaerobic sprint test (RAST) and performance on the 100 m. 200m and 400 m distance tests. J Hum Mov Stud.2005; 49: 77-92.
22.
BeckWRZagattoAMGobattoCA. Repeated sprint ability tests and intensity-time curvature constant to predict short-distance running performances. Sport Sci Health.2014; 10(2): 105-10.
23.
QueirogaMRCavazzottoTGKatayamaKYPortelaBSTartarugaMPFerreiraSA. Validity of the RAST for evaluating anaerobic power performance as compared to Wingate test in cycling athletes. Motriz: Revista de Educação Física.2013; 19(4): 696-702.
24.
RezaARastegarM. Correlation between Runningbased Anaerobic Sprint Test (RAST) field tests, Sargent jump and 300 yard shuttle run tests with laboratory anaerobic Wingate test in evaluation of indoor soccer player’s anaerobic readiness. Annals of Biological Research.2012; 3(1): 377-84.
25.
BongersBCWerkmanMSBloklandDEijsermansMJVan der TorrePBartelsB, et al. Validity of the pediatric running-based anaerobic sprint test to determine anaerobic performance in healthy children. Pediatr Exerc Sci.2015; 27(2): 268-76.
26.
AtanSAFoskettAAliA. Motion analysis of match play in New Zealand U13 to U15 age-group soccer players. J Strength Cond Res.2016; 30(9): 2416-23.
27.
BrocherieFMilletGPGirardO. Neuro-mechanical and metabolic adjustments to the repeated anaerobic sprint test in professional football players. Eur J Appl Physiol.2015; 115(5): 891-903.
28.
HunterAGibsonASCLambertMINobbsLNoakesTD. Effects of supramaximal exercise on the electromyographic signal. Br J Sports Med.2003; 37(4): 296-9.
29.
StewartDFarinaDShenCMacalusoA. Muscle fibre conduction velocity during a 30-s Wingate anaerobic test. J Electromyogr Kinesiol.2011; 21(3): 418-22.