Isokinetic dynamometry is widely considered the gold standard in mechanical muscle performance testing. Invariably, the moment-position raw data obtained from the dynamometer is directly analysed although kinematic inaccuracies may inherently exist.
OBJECTIVE:
To quantify the differences between two processing methods of isokinetic raw data: one based on the device’s own software and one using a hybrid kinematic procedure.
METHODS:
Seventy-six healthy male participants performed unilateral concentric knee extensor (Qcon) (90 ROM) and eccentric knee flexor (Hecc) tests (110 ROM) at 150/s. The knee angles were recorded by two high-speed cameras per body side.
RESULTS:
Compared to isokinetic data, kinematic analysis revealed reduced knee ROM of 17 for Qcon and of 21 for Hecc. Thus, the mean ‘isokinetic’ angular velocity declined to 121 and 122/s, respectively. The angles of peak moment changed significantly (5 for Qcon, 20 for Hecc). Contractional work decreased (20%) only for Qcon. The moments and angles derived from analysis of the DCR at the equilibrium point (DCRe) rose by 7% and 20% respectively when the isokinetic raw data were linked with kinematic data. The comparison of both processing methods revealed very high (R 91%) and high (R 69%) relationships for DCRe moments and angles.
CONCLUSIONS:
Isokinetic raw data comprise kinematic inaccuracies caused by axis misalignment, evasive movements and anatomical features. Although a hybrid kinematic procedure is more time-consuming, it may enable a more valid clinical interpretation of the test findings.
Isokinetic dynamometry is considered the gold standard in mechanical muscle testing while knee muscles were accorded most of the attention [1, 2]. Several studies examined the concentric and eccentric moment-velocity characteristics of different muscles by analysing data obtained from the dynamometer [3, 4, 5]. However, only a few studies executed a kinematic analysis to quantify kinematic inaccuracies caused by axis misalignment, evasive movements and anatomical features [4, 6, 7]. To our knowledge, there is only one experimental study contrasting a pure isokinetic with a hybrid kinematic analysis. Verdonck et al. [7] analysed reciprocal concentric knee extensions and flexions in a sitting position at 60/s and 180/s by comparing a stationary and an instationary tibial pad. The displacement of the knee joint in relation to the axis of the dynamometer was smaller when the stationary cuff was used. Higher contraction speed produced larger deviations of knee angle values, especially at the moment of full knee extension. In contrast to the instationary pad, the selected isokinetic speed was reduced when a stationary cuff was applied [7]. The knee axis trajectories resembled antero-caudal opened check marks induced by the combined rotation and translation of the femur on the tibial plateau during knee extension [7, 8, 9]. This anatomical characteristic is a major limitation of isokinetic knee tests being susceptible to some considerable measuring inaccuracies [4, 6].
It has not yet been established how the kinematically analysed range of motion (ROM) and moment-angle relations diverge from isokinetic data. Furthermore, differences between discrete tests of knee extensors in supine position and knee flexors in prone position are still unchartered while the relationship of both procedures concerning the assessment of thigh muscle balance needs clarification.
Regarding previous research, the present study aimed to quantify the difference between a pure isokinetic and a hybrid kinematic analysis of discrete concentric and eccentric knee extensor and flexor tests using a stationary shin pad. The hypotheses were:
The isokinetic ROM and the mean angular velocity show lower values when a kinematic analysis is executed.
Kinematic analysis demonstrates modified moment-angle relations so that angles of peak moment and the contractional work differ.
Both processing methods reveal a significant relation concerning parameters of thigh muscle balance.
Examining these aspects is important for professionals conducting maximal strength tests because it improves the understanding on how the body moves during isokinetic exercise.
Material and methods
Participants
Seventy-six healthy male participants (mean SD, age: 21.3 4.4 years, height: 181.7 7.1 cm, mass: 75.7 8.2 kg) gave their written informed consent to voluntarily participate in the study. All of them took part in regular training in different sports (e.g., track and field, handball, cycling, etc.) and were familiar with lower extremity resistance training. Exclusion criteria were a hamstring strain injury or some sort of knee injury within the last year. The local ethics commission’s approval was confirmed. All participants were free of injuries, pain or other limitations that might have inhibited maximum force exertion.
Instruments
All isokinetic tests were carried out at the active isokinetic dynamometer IsoMed 2000 (D&R Ferstl GmbH, Hemau, Germany). A stationary double shin pad for unilateral knee flexion and extension was attached to the motor’s axis. Data were recorded by the manufacturer’s computer software IsoMed analyze V.2.0 at 200 Hz. Two high-speed video cameras (acA640-120gc, Basler AG, Ahrensburg, Germany) per body side captured the motion during isokinetic tests at 100 fps (TEMPLO 8.2.358, Contemplas, Kempten, Germany). Headlights (Bar Fly 200, Kino Flo Lightning Systems, Burbank, CA, USA) improved the visibility of the retro-reflective markers attached to the participant’s body (Ø 8–14 mm). Kinematic recording and analyses were performed with VICON Peak Motus (V10.0.1, New York, NY, USA) after a static calibration using a rigid three-dimensional frame (L W H: 90 60 30 cm).
Procedures
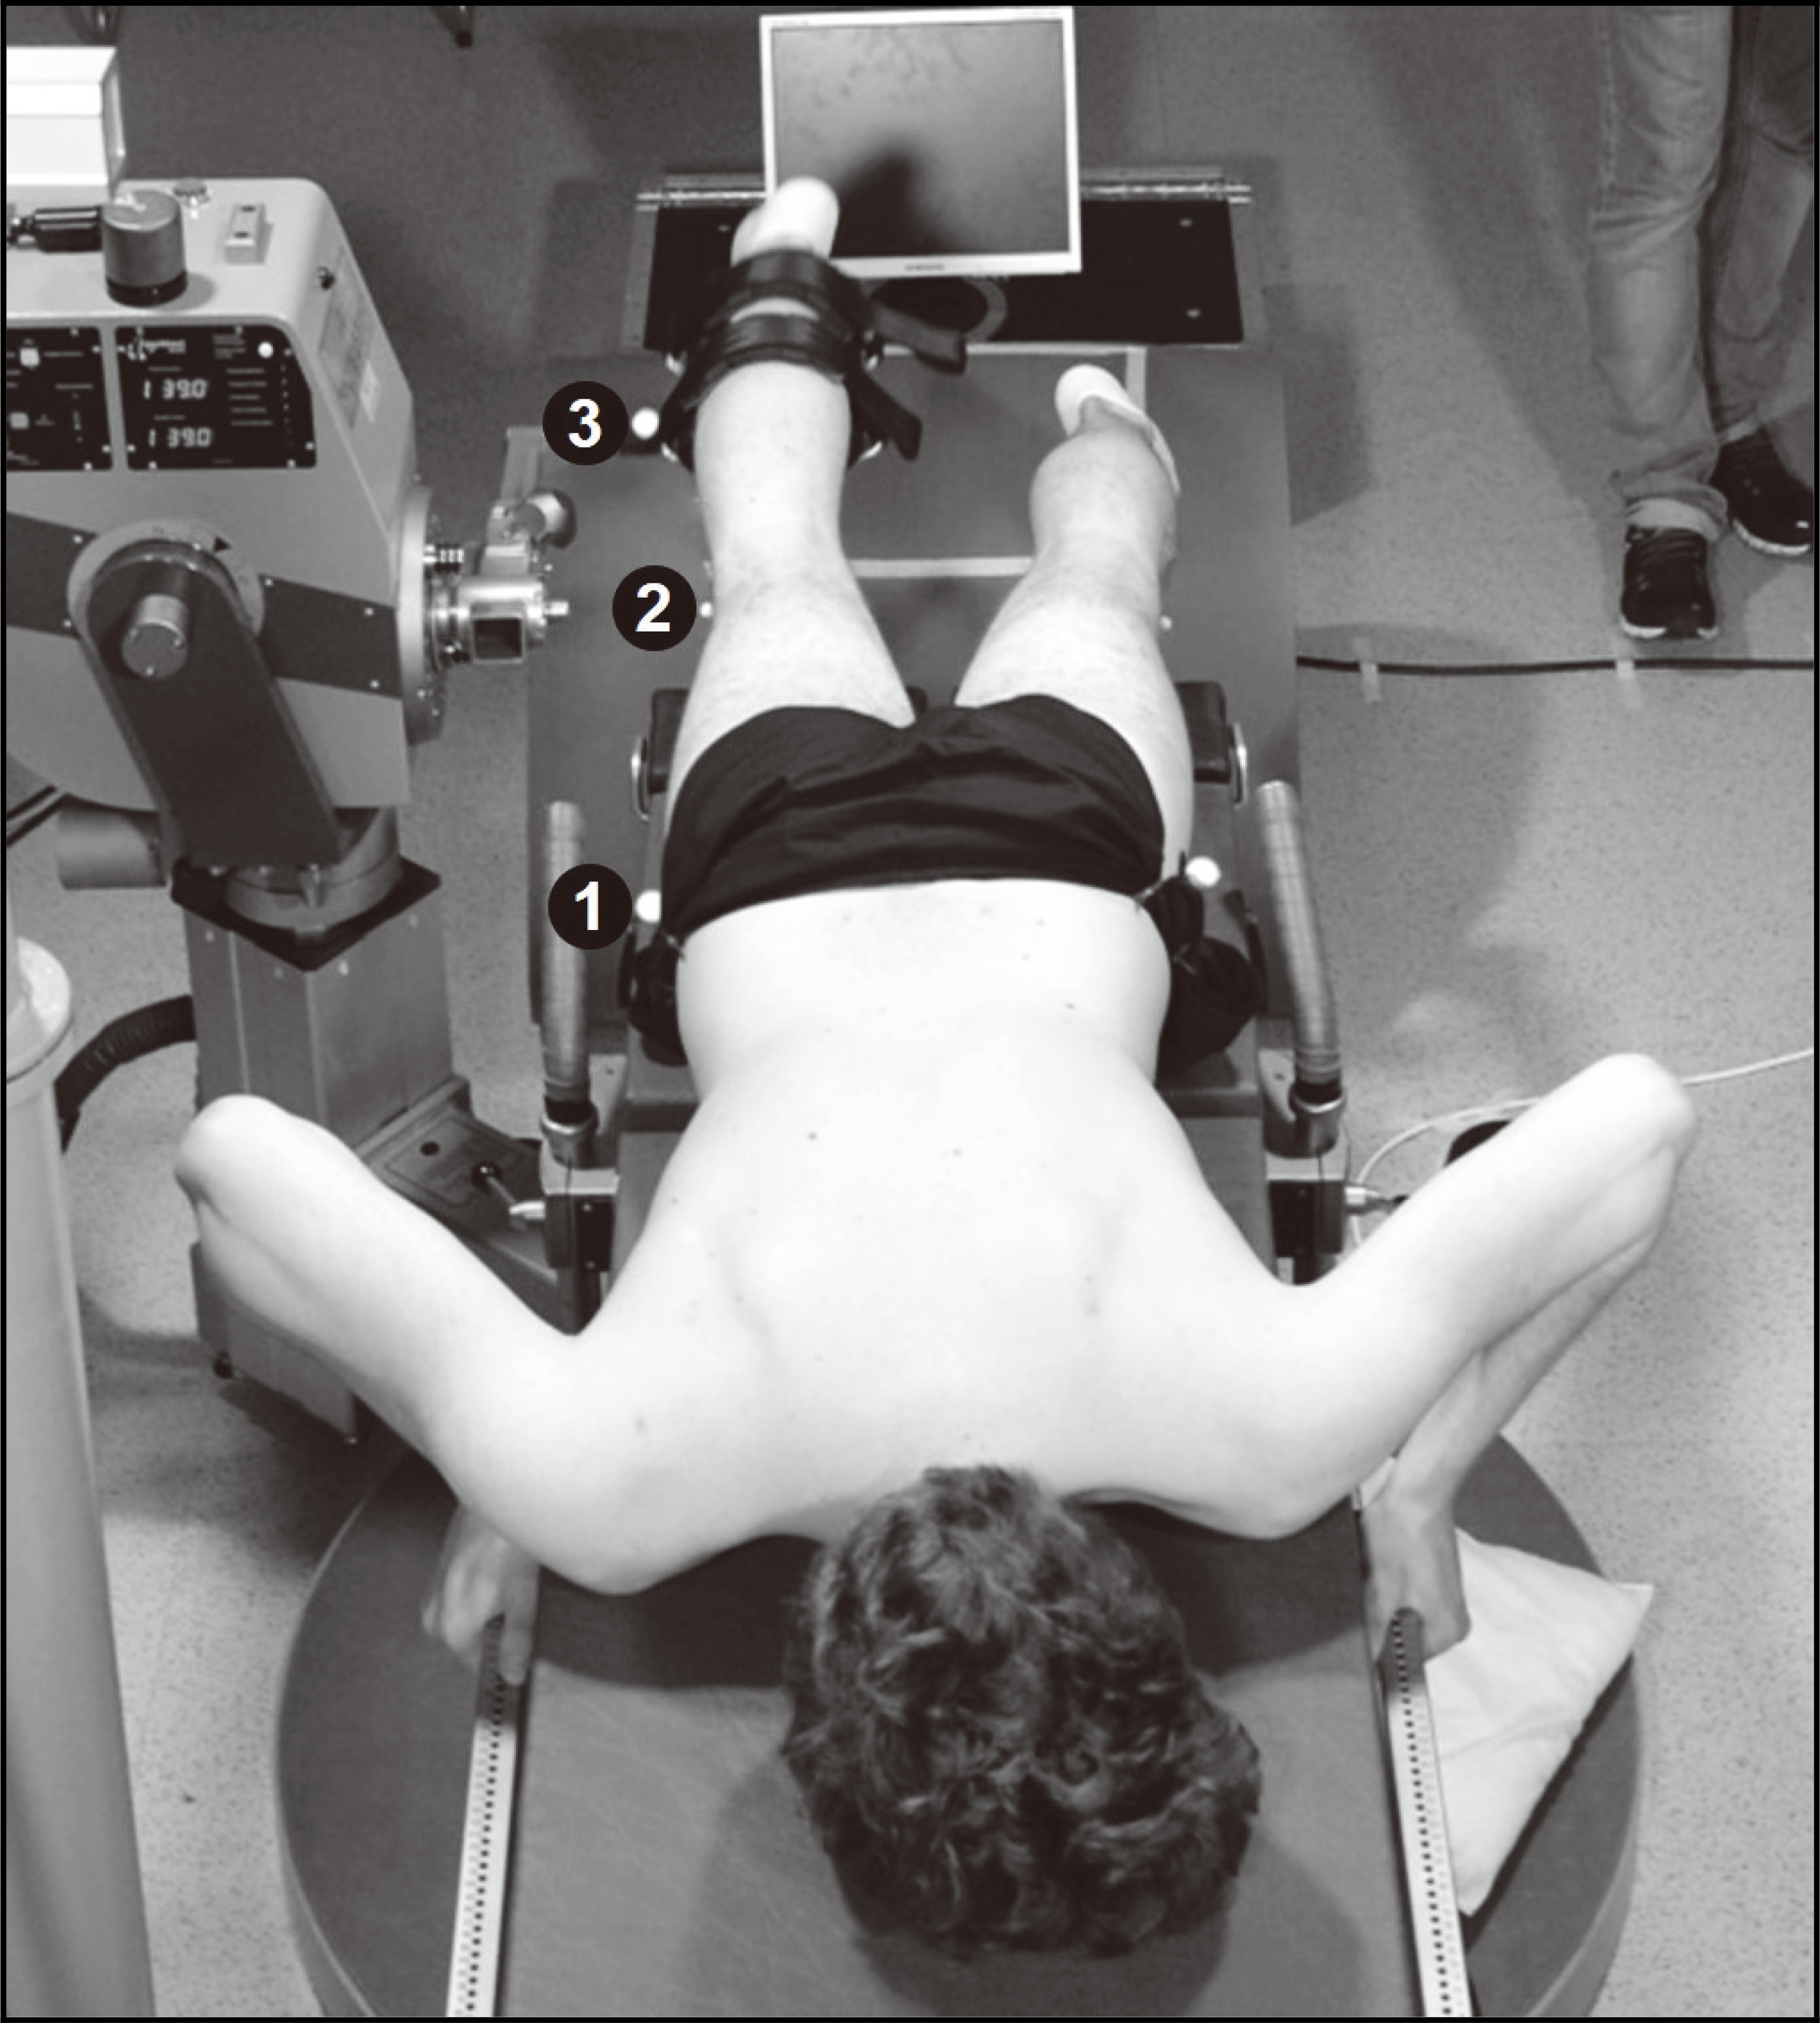
Each participant performed a familiarisation session followed by a testing session separated by a minimum of 48 h and a maximum of one week. After determining their mass, the participants performed an individual warm-up (jogging, stretching) for ten minutes followed by the participant’s positioning and fixation on the dynamometer. The succeeding unilateral knee tests matched a protocol with proven reliability [10, 11]. It involved both legs starting with a randomised test condition. Then, a stratified order was executed so that the fatigue of one limb is minimized (e.g. left extensor, right flexor, left flexor and right extensor). In a pre-activated muscular state at 90 knee flexion, the dynamometer axis was aligned with the participants’ lateral femoral epicondyle by means of a laser pointer [8]. Two spherical retro-reflective markers per body side were attached to anatomical landmarks (trochanter major, lateral femoral epicondyle). Another marker was placed on the horizontal part of the lever arm (Fig. 1).
Eccentric knee flexor tests in supine position. Three retro-reflective markers at the hip (1), knee (2) and lever arm (3) served to provide data for a kinematic analysis of the isokinetic tests.
The distal part of the double shin pad was fixed by a strap approximately 2–3 cm proximal to the medial malleolus. After a static gravity correction measurement, the participants conducted an isokinetic warm-up at 60/s consisting of 15 submaximal concentric (con) and eccentric (ecc) repetitions of the respective muscle group. Prior to each testing condition, the respective angular position of full knee extension was kinematically measured.
For the eccentric knee flexor tests (110–0 ROM), participants were asked to lie prone (extended hip) by pushing their trunk with the hands to the lounger promoting higher flexor moments compared to seated and supine position [12, 13]. Concentric knee extensions (0–90 ROM) were performed in supine position (extended hip) with handgrips providing sufficient stability [8]. All tests were performed as discrete movements in a single direction which is recommended to obtain reliable isokinetic measurements [14]. The angular velocity was set at 150/s. The return of the tested leg into starting position always occurred passively at 120/s [12, 13]. Each set consisted of five repetitions (two submaximal, three with maximum effort). The last three repetitions were selected for further analysis. Due to the adjustment of the dynamometer and the change of body position between the four test conditions, the inter-test pause lasted about three minutes. Strong verbal encouragement was rendered.
Data processing and statistical analyses
Raw data were recorded by the manufacturer’s soft- ware and stored as ASCII files. These were processed by a self-developed software written in C++ isolating the isokinetic range of motion ( 1% deviation of angular velocity). To reduce oscillations of the derived moment-angle-curves, a 5 order Butterworth low-pass filter with a cut-off frequency of 6 Hz was applied [12, 13]. For each testing condition (left and right Hecc and Qcon), all three trials were analysed by determining the gravity-corrected peak moment (PM), the angle of peak moment (APM) and the contractional work (CW). The dynamic control ratio at the equilibrium point (DCRe) represents the intersection point of the three maximally performed eccentric knee flexor and concentric knee extensor moment-angle curves [11, 15, 16]. For each body side, the DCRe with the highest moment was chosen out of nine intersection points for further analyses. DCRe moment and angle values demonstrated good reliability at 150/s (ICC 0.8, SEM 10%) [11]. Normalization to body mass enabled inter-individual comparison [17]. As the isokinetic tests of the knee flexors and extensors are performed throughout the largest possible range of motion (110 and 90, respectively), CW was normalized to body mass and knee joint angle [10, 18].
Concerning the kinematic analysis, the knee angle was calculated three-dimensionally by correcting the angular displacement derived from the lever arm movement by the values obtained from the static measurements in full knee extension. Afterwards, sagittal plane kinematics were extracted for further analysis [8].
As no inter-limb differences became apparent, the values of both limbs were averaged. For all data, normal distribution was confirmed by the Kolmogorov-Smirnov-test ( 0.10). Dependent t-tests were applied for exploring the differences between the two processing methods. Pearson correlation analyses determined the strength of the linear regressions between the selected parameters. The level of significance was set at 0.05. All statistical tests were executed with SPSS V.23.0 (SPSS Inc., Chicago, Illinois, USA). According to the rule of thumb for interpreting the effect size, a Cohen’s d of 0.8 and 0.2 were rated as high and negligible. The spans between 0.5–0.8 and 0.2–0.5 were subsequently interpreted as medium and low, respectively [19]. The determination coefficients (R) of the analysed linear relationships are interpreted as very high ( 81%), high (49–81%), moderate (25–49%), low (9–25%) and negligible ( 9%) [19].
Kinematic parameters obtained from isokinetic concentric knee extensor (Qcon) and eccentric knee flexor (Hecc) tests at 150/s. Significant differences between the isokinetic and kinematic analysis emerged at 0.05 and constituted a large effect size with d 0.8
Isokinetic analysis
Kinematic analysis
Difference
p-value
Cohen’s d
Qcon
Initial loss of ROM []
0.8
0.1
14.1
4.7
13.
3
0.001
4.00
Acceleration ROM []
11.8
0.1
7.5
1.7
4.
3
0.001
3.57
Isokinetic ROM []
73.6
0.2
57.1
2.6
16.
5
0.001
8.95
Deceleration ROM []
2.9
0.1
5.3
1.1
2.
4
0.001
3.07
Final loss of ROM []
0.9
0.1
6.0
2.9
5.
1
0.001
2.49
Mean isokinetic [/s]
149.9
0.1
121.1
5.6
28.
8
0.001
7.27
Hecc
Initial loss of ROM []
0.8
0.1
5.4
5.0
4.
6
0.001
1.30
Acceleration ROM []
11.7
0.1
6.7
1.0
5.
0
0.001
7.04
Isokinetic ROM []
93.8
0.2
72.9
3.1
20.
9
0.001
9.52
Deceleration ROM []
2.8
0.1
7.3
0.8
4.
5
0.001
7.89
Final loss of ROM []
0.9
0.1
17.7
5.4
16.
8
0.001
4.40
Mean isokinetic [/s]
149.9
0.1
122.1
4.4
27.
8
0.001
8.93
Strength parameters obtained from isokinetic concentric knee extensor (Qcon) and eccentric knee flexor (Hecc) tests at 150/s. Significant differences between the isokinetic and kinematic analysis emerged at 0.05 and constituted a large effect size with d 0.8
Isokinetic analysis
Kinematic analysis
Difference
p-value
Cohen’s d
Qcon
PM [Nm/kg]
2.30 0.24
APM []
63.3
7.8
58.0
5.8
5.
3
0.001
0.77
CW [mJ/(kg)]
40.4
3.9
32.4
3.7
8.
0
0.001
2.11
Hecc
PM [Nm/kg]
1.89 0.24
APM []
14.8
6.8
34.6
6.5
19.
8
0.001
2.98
CW [mJ/(kg)]
26.0
3.7
25.5
3.1
0.
5
0.449
0.15
DCRe parameters
Moment [Nm/kg]
1.82
0.26
1.94
0.32
0.
12
0.001
0.41
Angle []
31.9
6.4
38.5
8.5
6.
6
0.001
0.88
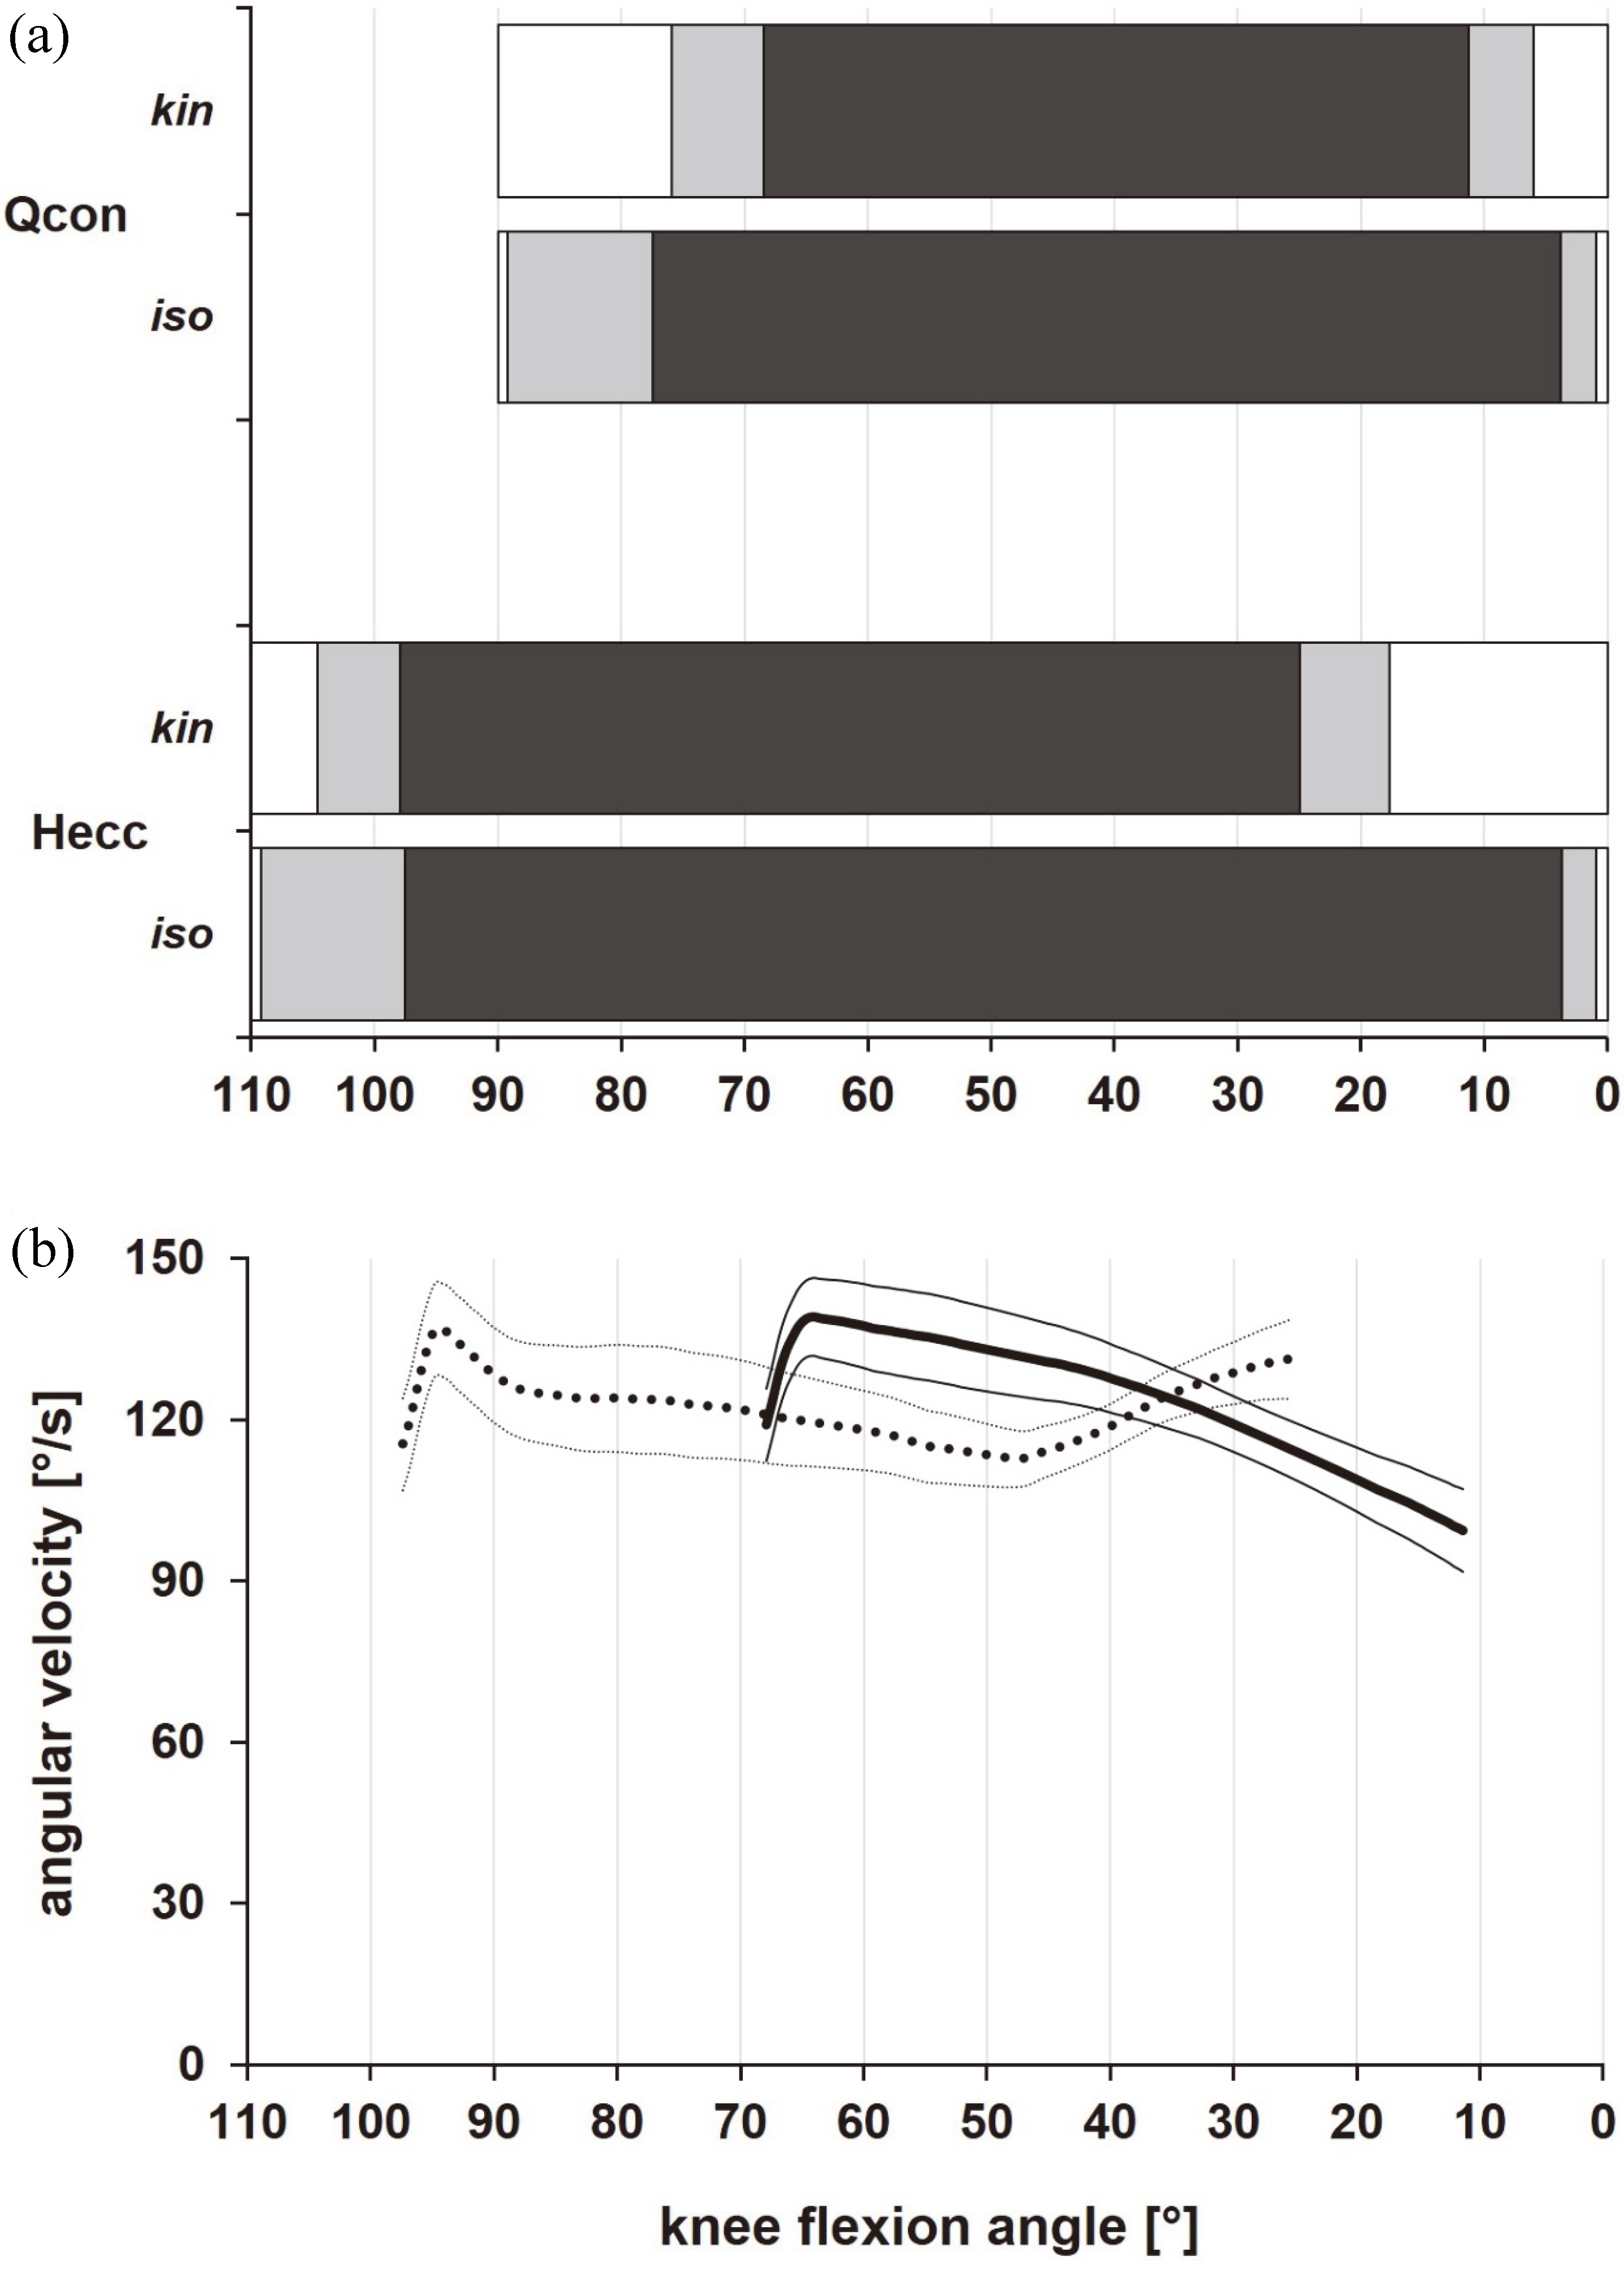
Kinematic differences of the knee flexion angle during isokinetic concentric knee extensor (Qcon) and eccentric knee flexor (Hecc) movements comparing a pure isokinetic (iso) and a hybrid kinematic (kin) procedure. (a) The white areas represent the initial and final losses of range of motion (ROM), the light grey parts illustrate the acceleration and deceleration ROM and the dark grey section shows the remaining ‘isokinetic’ ROM. (b) The thick lines represent the average time courses for Qcon (solid line) and Hecc (dashed line) within the ROM where isokinetic data indicate a constant angular velocity. The thin lines illustrate the positive and negative standard deviations.
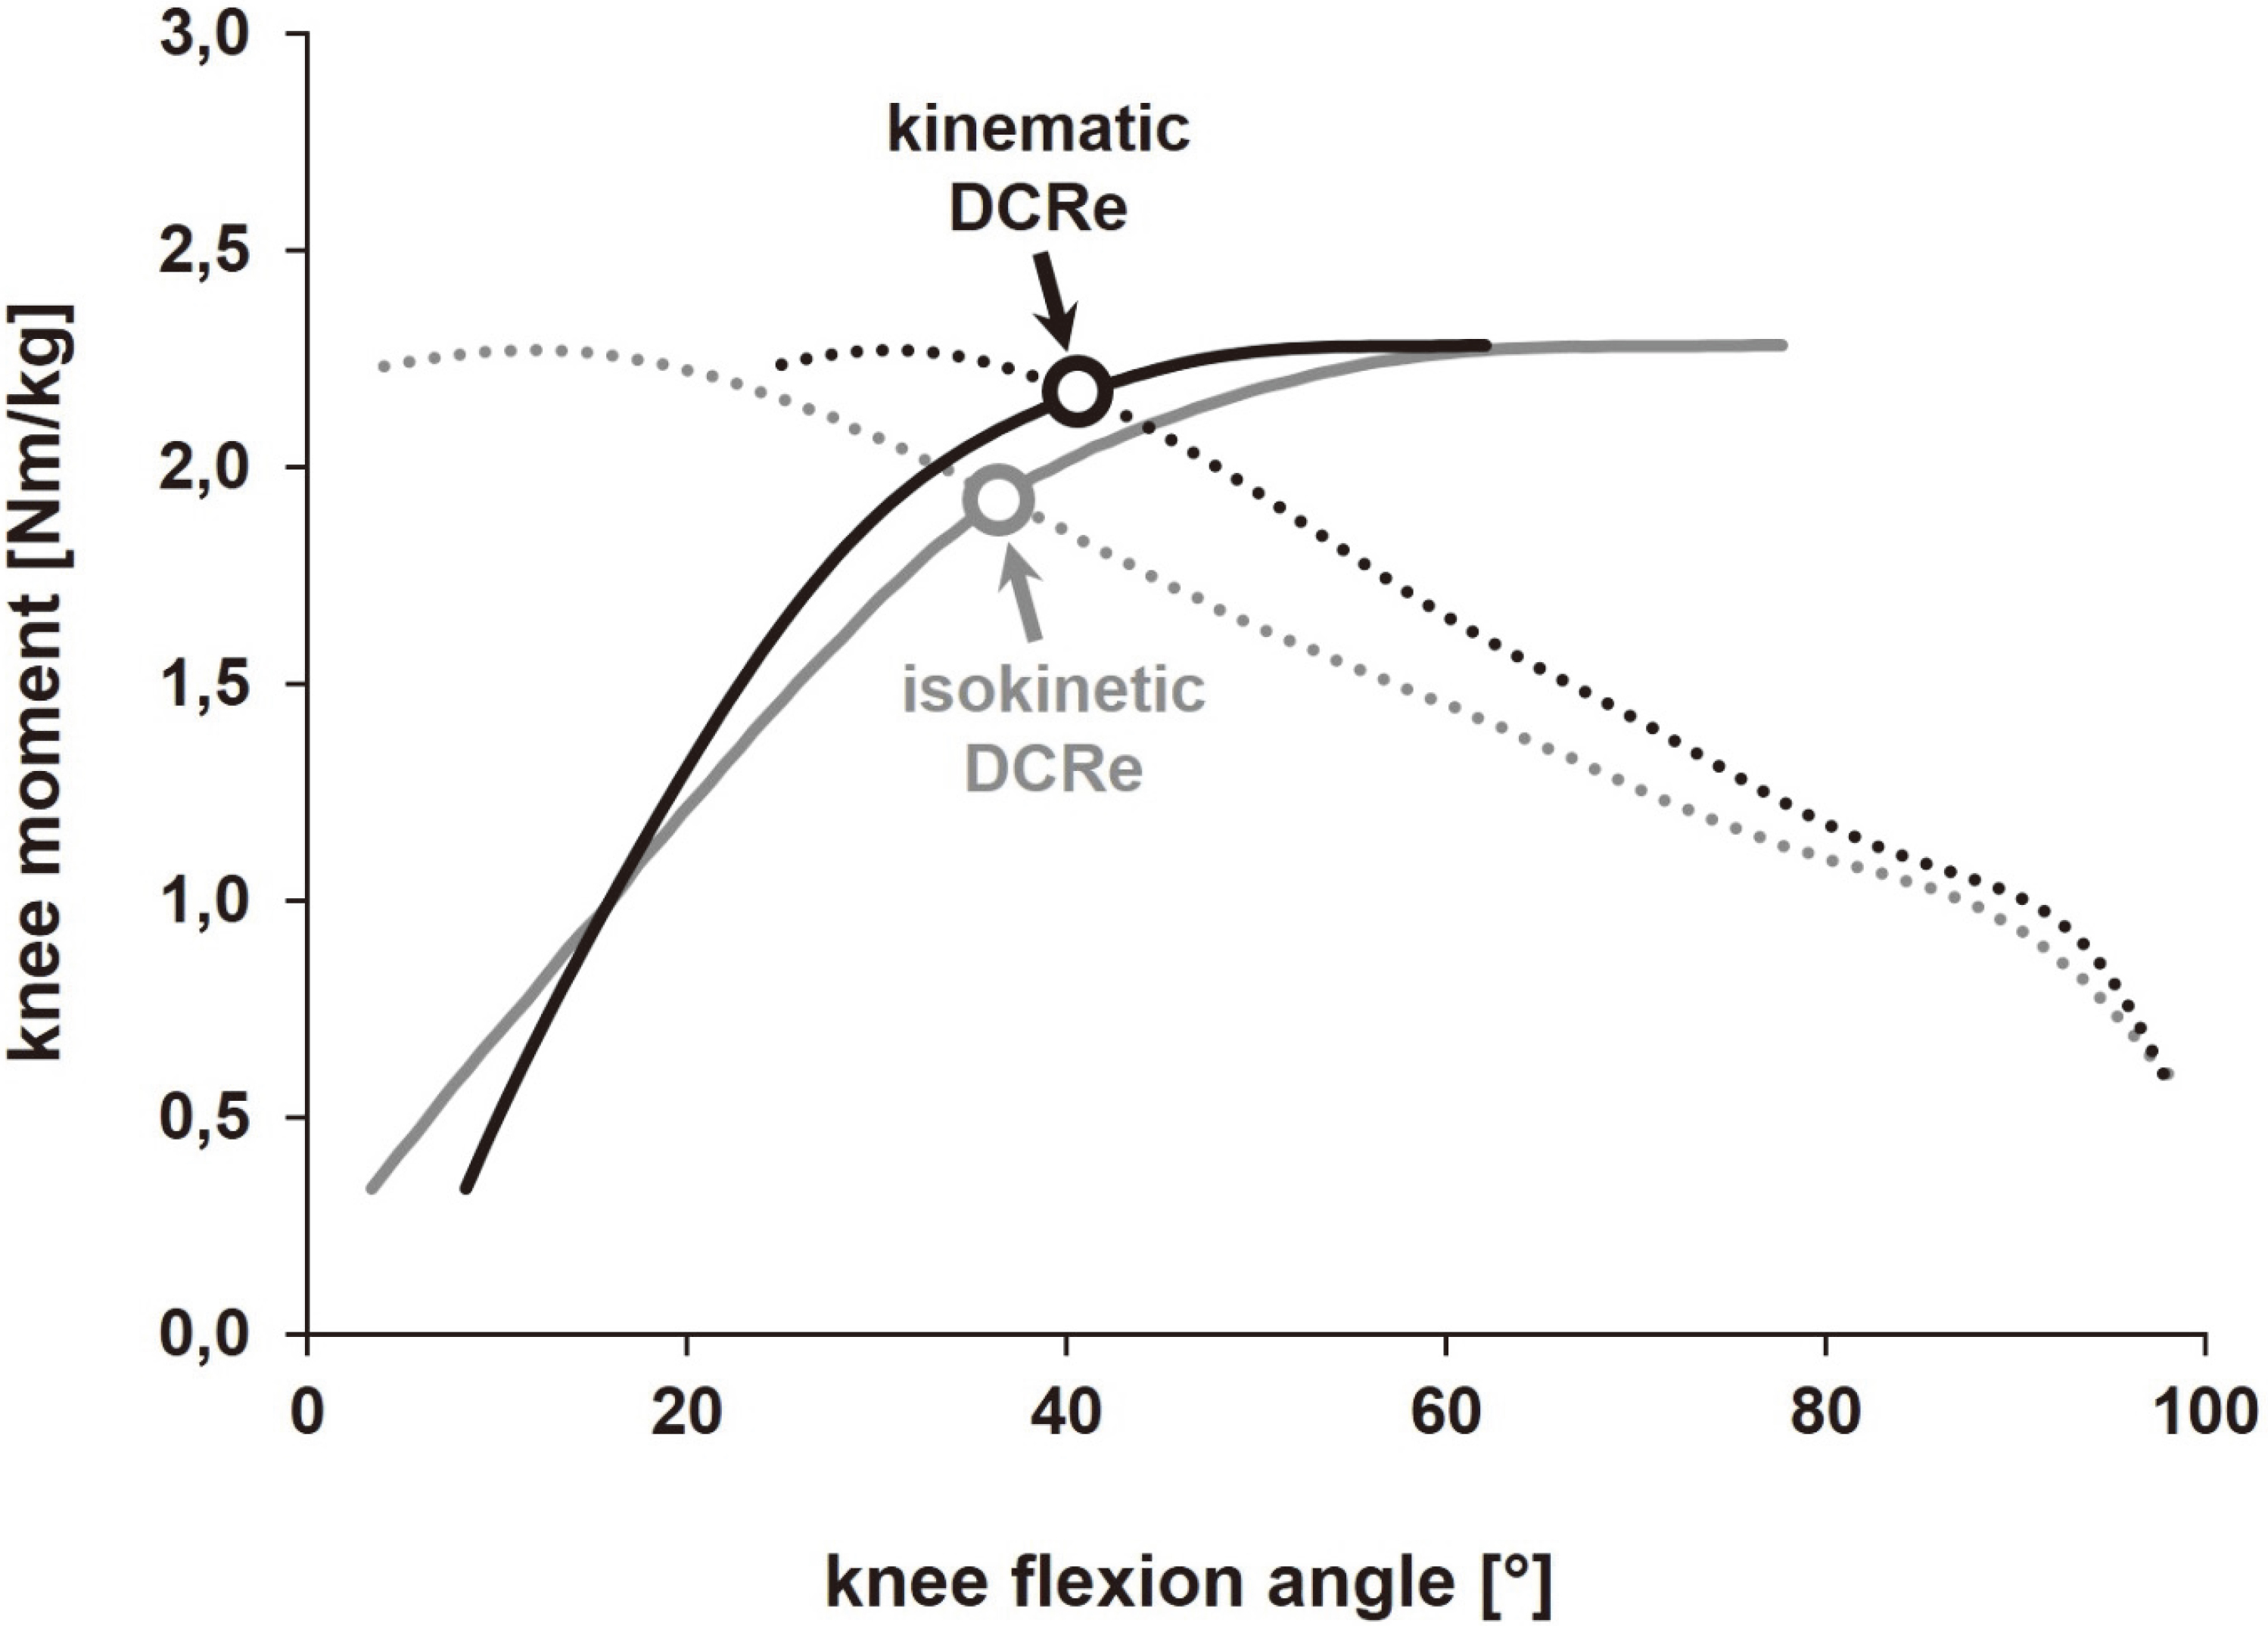
Representative isokinetic concentric knee extensor (Qcon; solid lines) and eccentric knee flexor (Hecc; dashed lines) moment-knee flexion angle curves obtained from a pure isokinetic (grey) and a hybrid kinematic analysis (black) at 150/s. The circles highlight the location of the respective dynamic control ratio at the equilibrium point (DCRe).
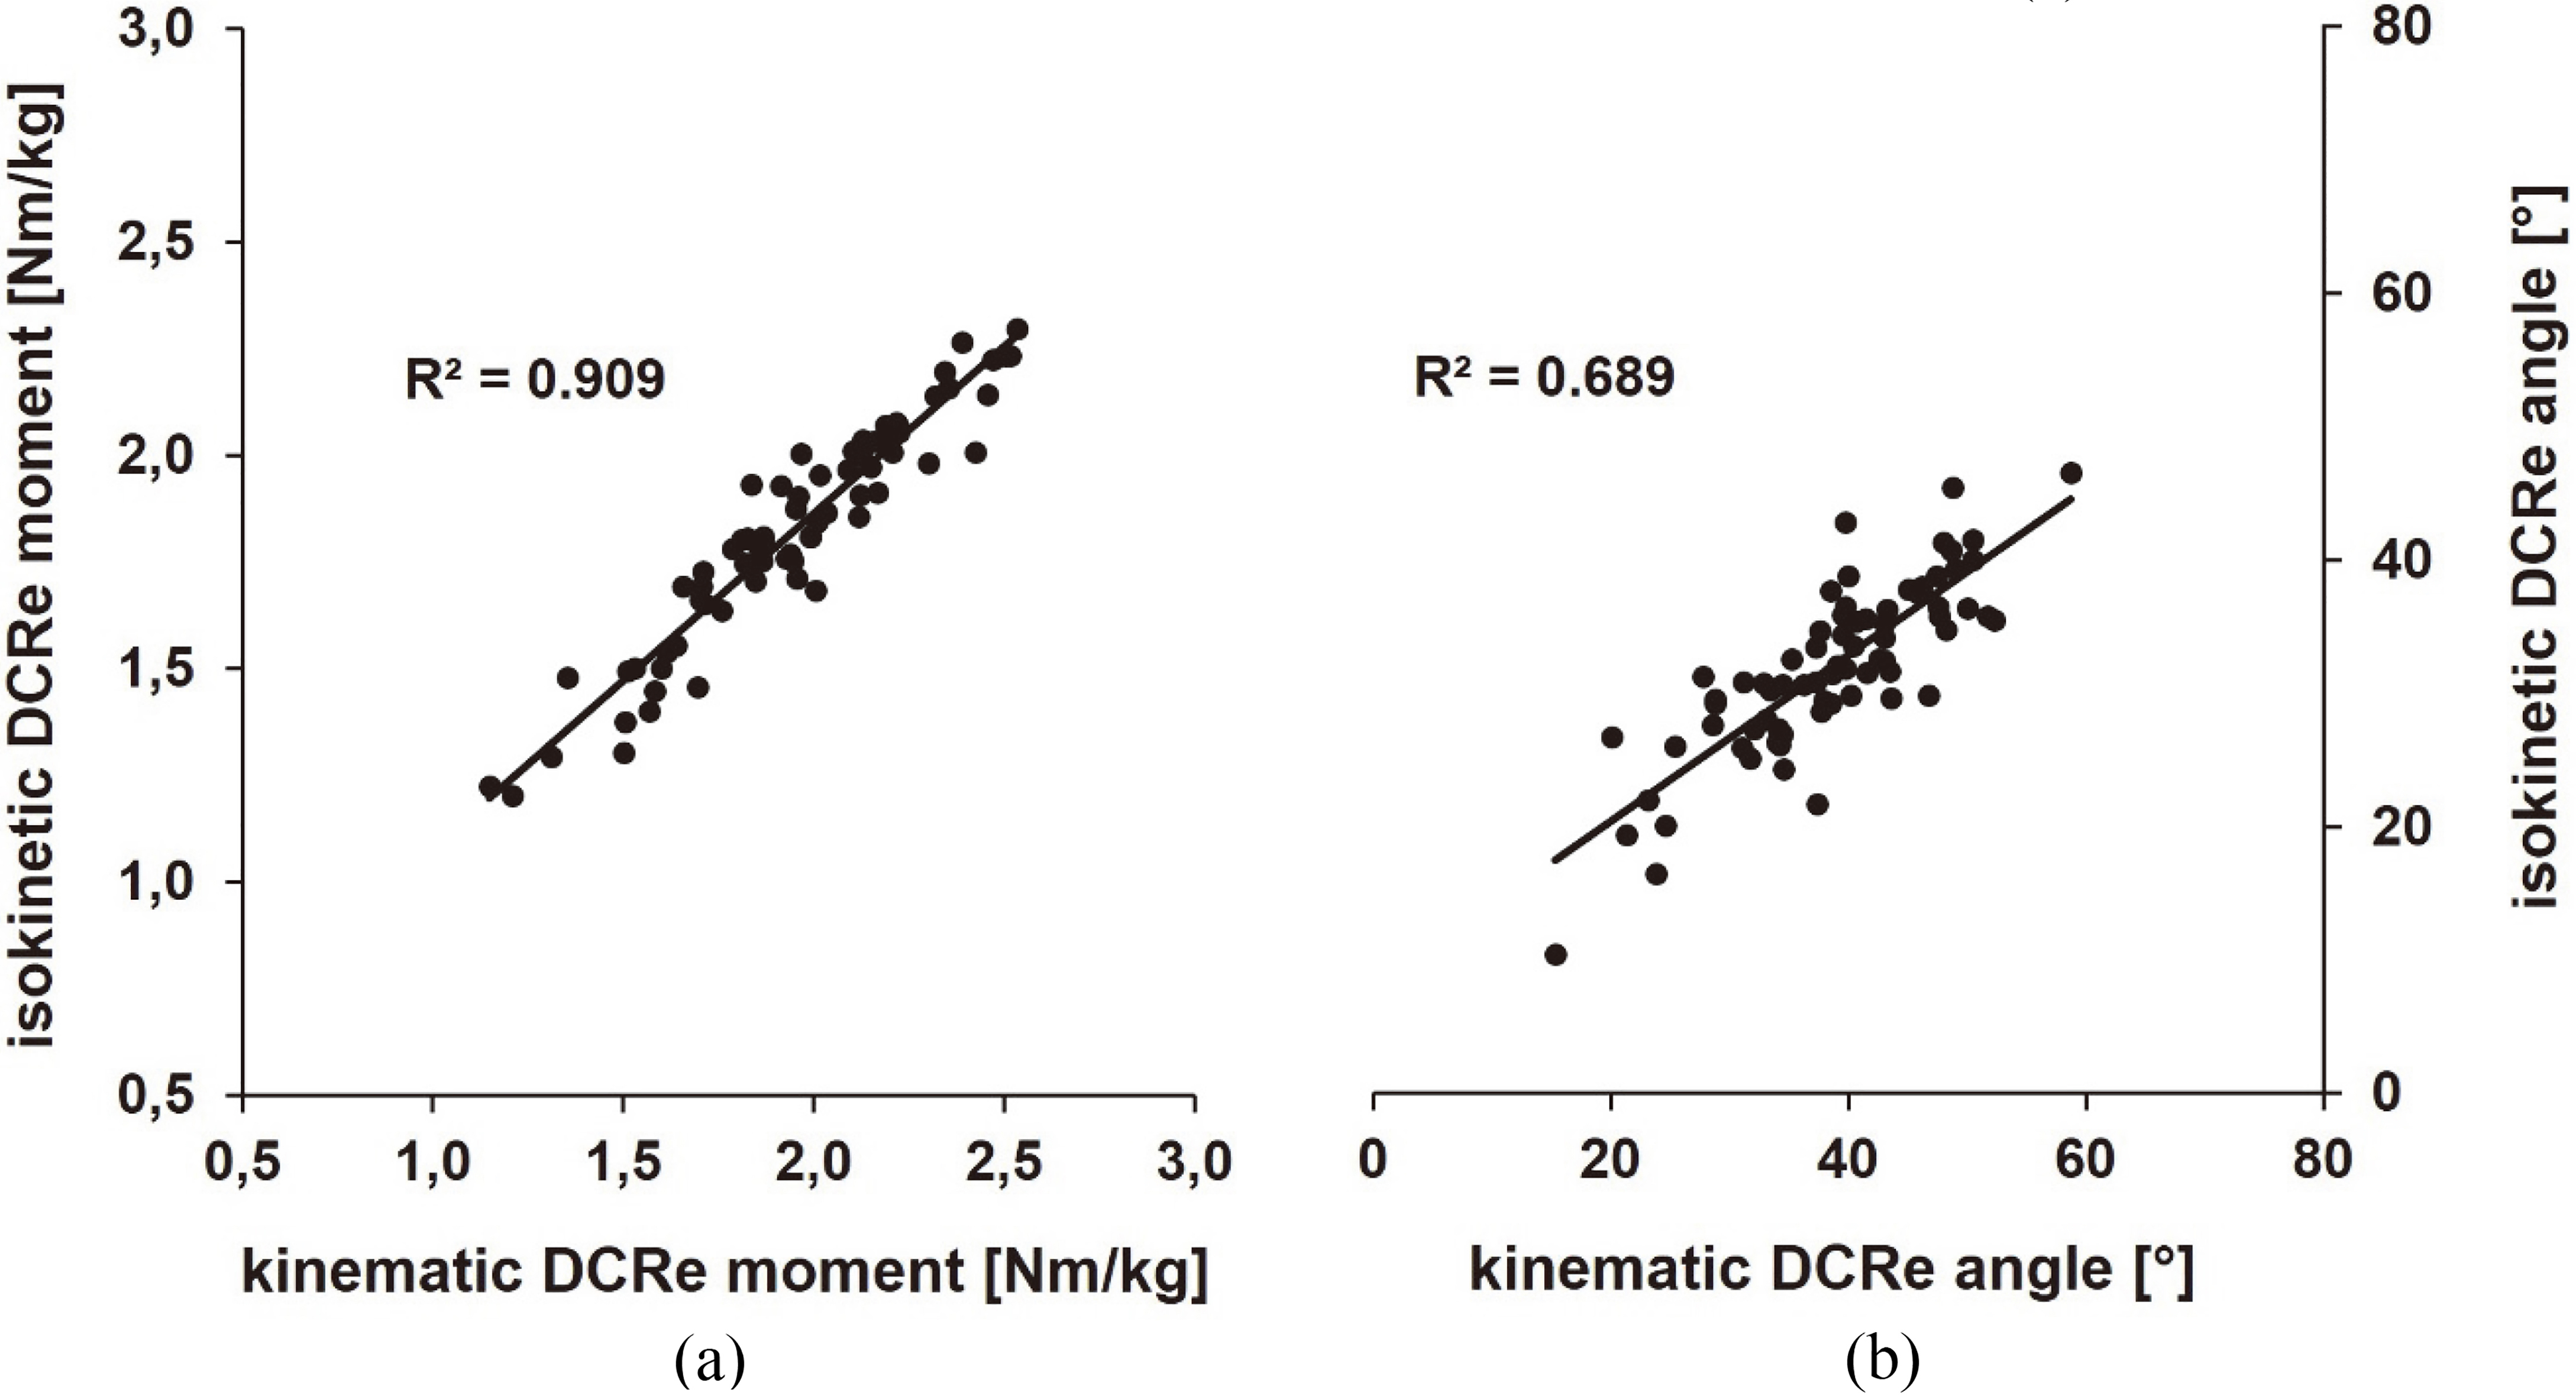
Significant linear relationships (p 0.05) between (a) DCRe moments and (b) angles derived from a pure isokinetic (y-axis) and a hybrid kinematic analysis (x-axis).
Results
Table 1 lists the kinematic differences of isokinetic concentric knee extensor (Qcon) and eccentric knee flexor (Hecc) tests at 150/s comparing the pure isokinetic with the hybrid kinematic analysis. All examined parameters significantly diverged ( 0.05) and large effect sizes ( 0.8) became apparent. Figure 2a illustrates how the knee’s ROM differed between the two processing methods. Initial losses during Qcon and Hecc were 13.3 and 4.6 larger when kinematic data were used (Table 1). The same was true for final losses whereas the amount was greater for Hecc (5.1 and 16.8). Kinematically derived acceleration ROMs of Qcon and Hecc was reduced (4.3 and 5.0) whereas deceleration ROMs were extended (2.4 and 4.5). This lead to reductions in isokinetic ROM of 16.5 for Qcon and of 20.9 for Hecc so that mean angular velocities were reduced to 121/s and 122/s (Table 1, Fig. 2a). However, kinematic knee extension velocity was not constant during isokinetic lever arm motion (Fig. 2b).
For Qcon, kinematically derived contractional work (CW) and angles of peak moments (APM) were significantly lower when a hybrid kinematic analysis was executed (Table 2). The corresponding effect sizes were moderate and large. Concerning Hecc, kinematic APM were 20 larger constituting a large effect. The CW of Hecc was not different. Due to these differences, the kinematically determined intersection point of concentric knee extensor and eccentric knee flexor moment-angle curves was modified (Fig. 3). DCRe moments and angle values increased both, whereas the effect size was larger for DCRe angles (Table 2).
When comparing the DCRe parameters obtained by the pure isokinetic and the hybrid kinematic procedure, significant linear relations became apparent (Fig. 4). The correlations were very high for DCRe moments (R 91%) and high for DCRe angles (R 69%).
Discussion
The aim of the present study was to quantify the differences between a pure isokinetic and a hybrid kinematic procedure when analysing isokinetic concentric knee extensor and eccentric knee flexor tests at 150/s. This angular velocity was used as all tested isokinetic parameters, relating to the DCRe, have been shown to manifest good relative and absolute reliability scores [11]. The following discussion is divided according to the three aforementioned hypotheses.
The isokinetic ROM and the mean angular velocity show lower values when a kinematic analysis is executed
With regard to the present results this hypothesis can be confirmed as the kinematically derived isokinetic ROM were reduced by 16 and 21 for Qcon and Hecc. The same was true for the mean angular velocities (29/s and 28/s) (Table 1, Fig. 2). These results comply with previously published theoretical considerations [6] and experimental findings [7] which examined the use of stationary shin pads. These characteristics can be explained by the combined rotation and translation of the femur on the tibial plateau moving approximately 3 cm upwards or rather in anterior direction during knee extension [7, 8, 9]. Consequently, an exact axis alignment is not possible. To increase the ROM and mean angular velocity, it is advisable to use an instationary cuff [6, 7]. When using a stationary shin pad, it might be reasonable to perform initial axis alignment in full knee extension.
However, it is still unclear how much and in which phases the kinematic ROM is reduced compared to isokinetic raw data. During Qcon, early evasive movements of the hip in anterior direction might have led to the great amount of initial loss of ROM (13) (Table 1, Fig. 2a). The final loss of ROM (5) can be attributed to the abovementioned anatomical features of the knee joint. In contrast to this, the initial loss of ROM during Hecc is rather small (5), but hip flexion might have caused a substantial reduction at the movement’s end (17). These evasive hip movements are inter-individually different which is manifested by the respective standard deviations (Table 1). For both testing conditions, kinematic analysis revealed a smaller acceleration ROM compared to the isokinetic data (4 for Qcon, 5 for Hecc). This feature might be explained by the fundamental strategy of the human body to increase its force capacity by reducing the contraction speed [20]. The fact that the deceleration ROM is slightly greater (2 for Qcon, 5 for Hecc) can be attributed to the shank’s moment of inertia.
The reduced amount of the mean ‘isokinetic’ angular velocities and their time courses (Fig. 2b) resembled with results obtained at 180/s [7]. These findings support the fact that isokinetic movements contain neither constant angular velocity [7] nor constant fascicle velocity [20].
Kinematic analysis demonstrates modified moment-angle relations so that angles of peak moment and the contractional work differ
As suggested, kinematic and isokinetic data significantly diverged from each other (Table 2, Fig. 3). Previously published studies dealing with this topic are not known. Due to the fact that the ‘isokinetic’ ROM obtained from kinematic analysis was significantly reduced, the APM was 5 lower for Qcon and 20 higher for Hecc (Table 2, Fig. 3). The isokinetic values of APM correspond to previously published work [3, 10, 15, 18]. The varying amount of the observed difference may be justified by the two-sided compression of ROM during Qcon because isokinetic ROM is equally lower at the beginning (9) and the end (7) of the movement compared to the isokinetic raw data (Table 1, Fig. 2a). In contrast, kinematic and isokinetic analysis of Hecc showed identical knee flexion angles at the beginning of the isokinetic movement ( 0), but a 21 lower knee flexion angle at its end. The kinematically analysed CW of Qcon was significantly lower, whereas Hecc revealed no difference (Table 2). The reason for this discrepancy is not yet clear.
Both processing methods reveal a significant relation concerning parameters of thigh muscle balance
The intersection point of eccentric knee flexor and concentric knee extensor moment-angle curves relates to thigh muscle balance by involving kinetic and kinematic data [11, 15, 16]. It quantifies acute [18] and chronic [15] adaptations to training regimen. However, no investigations have so far demonstrated that DCRe moments (7%) and angle (20%) values rise when a kinematic analysis is performed. Thus, the observed increases of both parameters (Table 2) is a new finding which is caused by the shifts of the moment-angle curves (Fig. 3).
As suggested, DCRe moments and angles showed significant relationships when their isokinetic and kinematic values were compared (Fig. 4). The very high (R 91% for DCRe moments) and high (R 69% for DCRe angles) correlations revealed that there was quite a consistent measuring inaccuracy when isokinetic data were analysed. These results emphasize that the implemented analysis procedure depends on the application of the isokinetic tests [4]. If the kinematics is expected to remain relatively stable during multiple tests (e.g., during intra-individual tests) and/or when a fast feedback is needed (e.g., clinical context), the use of isokinetic data might be the method of choice. By contrast, the kinematic analysis should be performed if inter-individual comparisons are of importance (e.g., for elite athletes) and/or for addressing specific research questions.
Limitations and further research
A major limitation of the present study is that no hip kinematics were recorded. These would have enabled to quantify the evasive movements which might have caused the initial loss of ROM during Qcon and the final loss during Hecc. Additionally, the conversion of measured moments into resultant ones could not be executed [4]. This procedure requires separate static calibrations which must be performed for each condition. Therefore, the rigid frame has to be placed in extension of the dynamometer axis. Fixation might have reduced axis misalignment especially by decreasing sagittal trajectory length and displacement of the knee joint axis [8] which will minimize kinematic inaccuracies [6]. To fulfil this task, the applied fixation has to be tight which may impair the comfort of the participants. It must be kept in mind that axis alignment can not be optimal, but only optimized to a certain anatomical lower limit [6, 7, 9].
Further research studies should investigate if an axis alignment in full knee extension will actually lead to increased ROM and mean angular velocities during isokinetic knee tests. The analysis of slower angular velocities will help to generalize the findings derived from tests at 150/s. Furthermore, the results request a clarification regarding the question whether differences between the pure isokinetic and the hybrid kinematic analysis are clinically relevant in detecting bilateral differences and changes over time for example after injuries such as ACL tears. The present results support a broad application of kinematic analysis during isokinetic tests – especially for future scientific studies – because the obtained results may enable a more reliable and robust interpretation. However, a hybrid kinematic procedure is more time-consuming and needs more effort in preparation of the test environment and the participants.
Conclusions
Isokinetic raw data will always comprise kinematic inaccuracies caused by axis misalignment, evasive movements and anatomical features. A hybrid kinematic analysis revealed several significant differences during isokinetic concentric knee extensor and eccentric knee flexor tests. Compared to isokinetic data, kinematic range of motion and mean angular velocity were reduced. Strength and thigh muscle balance parameters were modified, while latter ones showed strong relations between these two processing methods. Although a hybrid kinematic procedure is more time-consuming, its results may enable a more reliable and robust interpretation.
Footnotes
Acknowledgments
The study was not funded and there is no conflict of interest. The authors would like to thank all participants who volunteered to participate in this study and demonstrated great motivation and commitment.
Conflict of interest
None to report.
References
1.
BaltzopoulosVBrodieDA. Isokinetic dynamometry. Applications and limitations. Sports Med.1989; 8(2): 101-16.
2.
KannusP. Isokinetic evaluation of muscular performance: implications for muscle testing and rehabilitation. Int J Sports Med.1994; 15(Suppl 1): S11-8.
3.
WestingSHSegerJY. Eccentric and concentric torque-velocity characteristics, torque output comparisons, and gravity effect torque corrections for the quadriceps and hamstring muscles in females. Int J Sports Med.1989; 10(3): 175-80.
4.
ArampatzisADe MonteGMorey-KlapsingG. Effect of contraction form and contraction velocity on the differences between resultant and measured ankle joint moments. J Biomech.2007; 40(7): 1622-8.
5.
GülchRW. Force-velocity relations in human skeletal muscle. Int J Sports Med.1994; 15(Suppl 1): S2-10.
6.
ReimannUVerdonckAJWiekM. The influence of joint displacement on torque, angle and angular velocity during isokinetic knee extension/flexion. Theoretical considerations. Isokinet Exerc Sci.1997; 6(4): 215-21.
7.
VerdonckAJReimannUWiekM. The influence of joint displacement on torque, angle and angular velocity during isokinetic knee extension/flexion. An experimental investigation. Isokinet Exerc Sci.1997; 6(4): 223-33.
8.
AltTRichertMSchwarzYMKnickerAJStrüderHK. Minimal fixation suffices for supine isokinetic knee extension: A kinetic and 3D kinematic analysis. Isokinet Exerc Sci.2016; 24(4): 301-11.
9.
SmidtGL. Biomechanical analysis of knee flexion and extension. J Biomech.1973; 6(1): 79-92.
10.
AltTKnickerAJStrüderHK. Factors influencing the reproducibility of isokinetic knee flexion and extension test findings. Isokinet Exerc Sci.2014; 22(4): 333-42.
11.
AltTKnickerAJStrüderHK. The dynamic control ratio at the equilibrium point (DCRe): introducing relative and absolute reliability scores. J Sports Sci.2017; 35(7): 688-93.
12.
WorrellTWDenegarCRArmstrongSLPerrinDH. Effect of body position on hamstring muscle group average torque. J Orthop Sports Phys Ther.1990; 11(10): 449-52.
13.
BohannonRWGajdosikRLLeVeauBF. Isokinetic knee flexion and extension torque in the upright sitting and semireclined sitting positions. Phys Ther.1986; 66(7): 1083-6.
AltTKnickerAJStrüderHK. The effects of angular velocity and training status on the Dynamic Control Equilibrium. Sports Med Int Open. 2017; 01(01): E23-E29.
16.
CoombsRGarbuttG. Developments in the use of the hamstring/quadriceps ratio for the assessment of muscle balance. J Sports Sci Med.2002; 1(3): 56-62.
17.
JaricS. Muscle strength testing: use of normalisation for body size. Sports Med.2002; 32(10): 615-31.
18.
AltTNodlerYTSeverinJKnickerAJStruderHK. Velocity-specific and time-dependent adaptations following a standardized Nordic Hamstring Exercise training. Scand J Med Sci Sports. 2017; Epub ahead of print.
19.
CohenJ. Statistical power analysis for the behavioral sciences. 2nd ed. Hillsdale, NJ: Erlbaum; 1988.
20.
IchinoseYKawakamiYItoMKanehisaHFukunagaT. In vivo estimation of contraction velocity of human vastus lateralis muscle during “isokinetic” action. J Appl Physiol.2000; 88(3): 851-6.