We examined the relationships among and differences between muscle size and strength, specific tension (MQ), echo intensity (MQ), and functional performance in physically active younger and older women.
METHODS:
Measurements included maximal voluntary isometric knee extension contractions (MVICs), maximal velocity sit-to-stand (STS) movements, and muscle cross sectional area (mCSA), MQ, and MQ of the rectus femoris (RF).
RESULTS:
There were no differences in MQ ( 0.96) or physical activity levels ( 0.29). MQ and MQ were not related in the younger women, but were related in the older women ( 0.50). MVIC was related to mCSA ( 0.75) in the older women, but was not significantly related to MQ or MQ in either age group.
DISCUSSION:
Physical activity may maintain MQ in aging. We suggest that studies examining changes in skeletal muscle with aging utilize both traditionally calculated muscle quality (specific tension) and ultrasound EI.
Sarcopenia, defined as the age-related loss of skeletal muscle mass [1, 2], is a multi-dimensional issue that effects approximately 5–13% of older adults 60 years or older and 11–50% of adults 80 years and older [3]. Sarcopenia is associated with decreased muscular strength, functional impairment, physical disability accompanied by a loss of independence, and an increased risk for falls and death [3, 4, 5, 6]. It appears, however, that there is a dissociation between the loss of skeletal muscle mass and the loss of strength with sarcopenia [7]. Specifically, Metter et al. [8] reported age-related decreases in muscle strength that occurred independent of changes in muscle mass. Consequently, Metter et al. [8] suggested that a relative index describing the strength per unit of muscle mass termed “muscle quality” also synonymous with specific tension (MQ), be used to monitor changes in muscle function with aging and/or sarcopenia. Traditionally, MQ has been assessed by examining the maximum amount of torque produced by a muscle (i.e. rectus femoris) normalized to the size of the muscle. It has since been suggested that the quality, rather than the quantity, of muscle tissue may be more functionally relevant to older adults [9, 10].
The quantitative gray-scale analysis of skeletal muscle ultrasound images, known as echo intensity (MQ), has been shown to be moderately to strongly related to MRI-based gray-scale assessments [11]. Consequently, MQ has garnered attention and utilization as an alternate measure of muscle quality in younger and older adults [9, 12, 13]. Further, MQ has been shown to be sensitive to intramuscular fibrous tissue [14] and fat content [15], intramuscular glycogen content, and tissue hydration status [16, 17, 18]. Previous studies have observed relationships between MQ or the attenuation of computed tomography images and intramuscular lipid content in older adults [19, 20]. Overend et al. [21] found that older men have a 59% greater accumulation of non-muscle tissue (i.e., fat and connective tissue) in their quadriceps femoris muscles than younger men. Therefore, previous studies have attributed age-related decreases in MQ to infiltration of fat in skeletal muscle [22, 23, 24]. It has been shown that physical activity prevents the infiltration of fat in skeletal muscle [25]. In addition, Radaelli et al. [26] observed a reduction in MQ following 13- and 20-weeks of resistance training in older women. It is unclear, however, if differences in MQ may exist in physically active younger and older adults.
The chair stand or sit-to-stand (STS) test is a component of the short physical performance battery (SPPB), which was developed by the National Institute on Aging for the objective assessment of lower extremity functionality in older adults [27]. The STS test assesses lower body function and consists of standing up from a seated position, without assistance from the upper body, five times as quickly as possible [27]. Recently, several studies have examined power production during a single STS as a better indicator of functional ability in older adults [28, 29, 30]. However, no studies to our knowledge have examined age-related differences in power development and movement velocity during a maximal effort STS.
Therefore, the purpose of this study was to examine the relationships among and differences between muscle size and strength, MQ, MQ, and functional performance in physically active younger and older women. Based on previous studies [4, 31, 32], we hypothesized that muscle strength, size, and quality, and power production and movement velocity during the STS would be lower in older than younger women, and that there would be direct relationships among these variables. Based on data presented by Goodpaster et al. [25] that physical activity prevented the infiltration of fat in skeletal muscle and due to the sensitivity of MQ to skeletal muscle lipid content, we further hypothesized that MQ would not be significantly different between physically active younger and older women. We also hypothesized that MQ and MQ would demonstrate a small to moderate relationship.
Methods
Participants
Seventeen younger (age range: 20–24 years old) and 18 older (age range: 69–80 years old) women volunteered to participate in this study (see Table 1 for descriptives). Participants were recruited from the university’s campus and surrounding areas. To be included in this study, participants had to be free from musculoskeletal dysfunctions or circulation/edema pathologies involving the hip, knee, or ankle. Participants also had to be fully independent and able to visit the laboratory for testing. This study was approved by the University Institutional Review Board for human participants research (IRB # ED-15-144; Date Approved: 10/26/2015). Prior to any testing, each participant completed an informed consent document and health history questionnaire, which included self-reported levels of physical activity. Physical activity was assessed from a customized physical activity questionnaire that asked each participant if they participated in physical activity (i.e. aerobic, anaerobic or recreational sports). If they answered yes, then participants were asked to provide details regarding the type, frequency, and duration of physical activity completed each week.
Research design
All participants were required to visit the lab on one occasion and were instructed to refrain from lower body exercise during the 24 hours prior to testing. Following the informed consent process and completion of the questionnaires, ultrasound (US) assessments were performed to quantify the cross-sectional area (mCSA) and MQ of the right rectus femoris (RF) muscle. Following the ultrasound assessment, each participant completed a short familiarization session consisting of all of the movements in the testing session. Following the familiarization session, each participant’s height and weight were measured prior to the testing protocol. During the testing protocol, participants then performed maximal isometric voluntary (MVIC) knee extensions followed by three maximal velocity sit-to-stand movements. The younger women enrolled in this study returned for a subsequent visit in order to calculate reliability for the ultrasound and sit-to-stand measurements. However, it was difficult for many of the older adults to return for a second visit, so reliability data was not obtained in the older women.
Panoramic ultrasonography
Ultrasound images of the RF muscle were obtained using a diagnostic US imaging device (GE Logiq S8, Milwaukee, WI, USA) with a linear array probe (Model ML6-15-D, 4-15 MHz, 50-mm field of view). The participants were positioned on an adjustable padded plinth while lying in the supine position with their legs completely relaxed, knees bent at approximately 10 on top of a pillow, and their feet braced in a custom made foot mold that prevented external rotation of the femur. Participants rested quietly in this position for 5 minutes prior to the collection of US images to allow for potential fluid shifts. Panoramic US images of the right RF were then taken at 50% of the distance from the anterior superior iliac spine (ASIS) and the superior border of the patella [33, 34]. During all scans, the investigator placed the probe perpendicular to the skin and advanced the probe laterally along the RF in a slow, consistent manner while taking great care to limit compression of the muscle. A generous amount of water-soluble transmission gel was applied to the skin to enhance acoustic coupling and limit near field artifacts [23].
The equipment settings for mCSA and MQ were optimized for image quality using the musculoskeletal mode prior to all testing using a gain of 46 dB and a frequency of 12 Hz. These equipment settings were held constant across all participants. However, the depth was set individually depending on the size of the participant’s thigh. Panoramic US images were captured until two uniform scans with acceptable image quality were collected [35].
Before each image was analyzed, the image was individually calibrated from pixels to cm using the straight line function to a known distance of 1 cm [34, 36]. The mCSA and MQ of the two images were analyzed by defining a region of interest that included as much muscle as possible, without including any bone or fascia, using the polygon function in the image analysis software (ImageJ, version 1.50i, National Institutes of Health, Bethesda MD, USA) [37]. The mCSA and MQ values obtained from the two images were then averaged and used for further analysis. All US scans and image analyses were performed by the same experienced investigator (M.A.M). MQ was determined using computer-aided gray scale analysis using the standard histogram function and was measured in arbitrary units (au) with values ranging from 0 (black) to 255 (white). In order to determine test-retest reliability of the US measurements, the younger women visited the laboratory on a second occasion 2–7 days after the first visit. The ICCs for RF mCSA and MQ for the younger women in this study were 0.98 and 0.92, respectively, and the SEM values were 1.81 cm and 0.32 au, respectively. Radaelli et al. [26] previously reported ICCs of 0.85–0.95 and 0.91 for muscle size and echo intensity, respectively, of the quadriceps femoris in older adult women.
Maximal voluntary isometric strength
For the MVIC assessments, participants were seated on a calibrated isokinetic dynamometer (Biodex 3, Biodex Medical Systems Inc., Shirley, NY, USA) with restraining straps placed across the chest, hips, and test thigh. The lateral femoral condyle of the right thigh was aligned with the axis of rotation of the dynamometer head. All MVICs were performed with the right leg at a knee joint angle of 120. Prior to maximal strength assessments, participants performed a 5 min warm-up on a cycle ergometer (Monark exercise 828E; Vansbro, Sweden) at a self-selected low-intensity workload, followed by 3 submaximal isokinetic knee extension and flexion muscle actions at 60sec at 75% of their perceived maximal effort. Participants then performed 2 or 3, 3–4 s MVICs of the knee extensors with 60 seconds of rest between attempts. During each MVIC, participants were verbally instructed to “push as hard and as fast as possible” in order to encourage maximal effort.
The torque (Nm) signals from the isokinetic dynamometer were sampled at 2 KHz with a Biopac data acquisition system (MP150WSW, Biopac Systems, Inc.; Santa Barbara, CA, USA), stored on a personal computer (Dell Optiplex 780, Dell, Round Rock, TX, USA), and processed offline using custom written software (Labview 15.0, National Instruments, Austin, TX, USA). The torque signal was filtered using a fourth-order, zero phase-shift, low-pass Butterworth filter with a 10-Hz cutoff frequency. MVIC strength was determined as the highest average 500 ms torque value achieved during the 3–4 s MVIC. MQ was calculated by dividing MVIC strength by mCSA (Nm/cm) [8, 10, 38, 39, 40]. Test-retest data from our lab for MVIC strength (unpublished data) have shown these measures to be reliable (ICCs 0.950–0.978; SEMs 10.15–18.8 Nm) in young and older women, which is similar to the ICCs and SEMs for MVIC strength reported previously [41, 42].
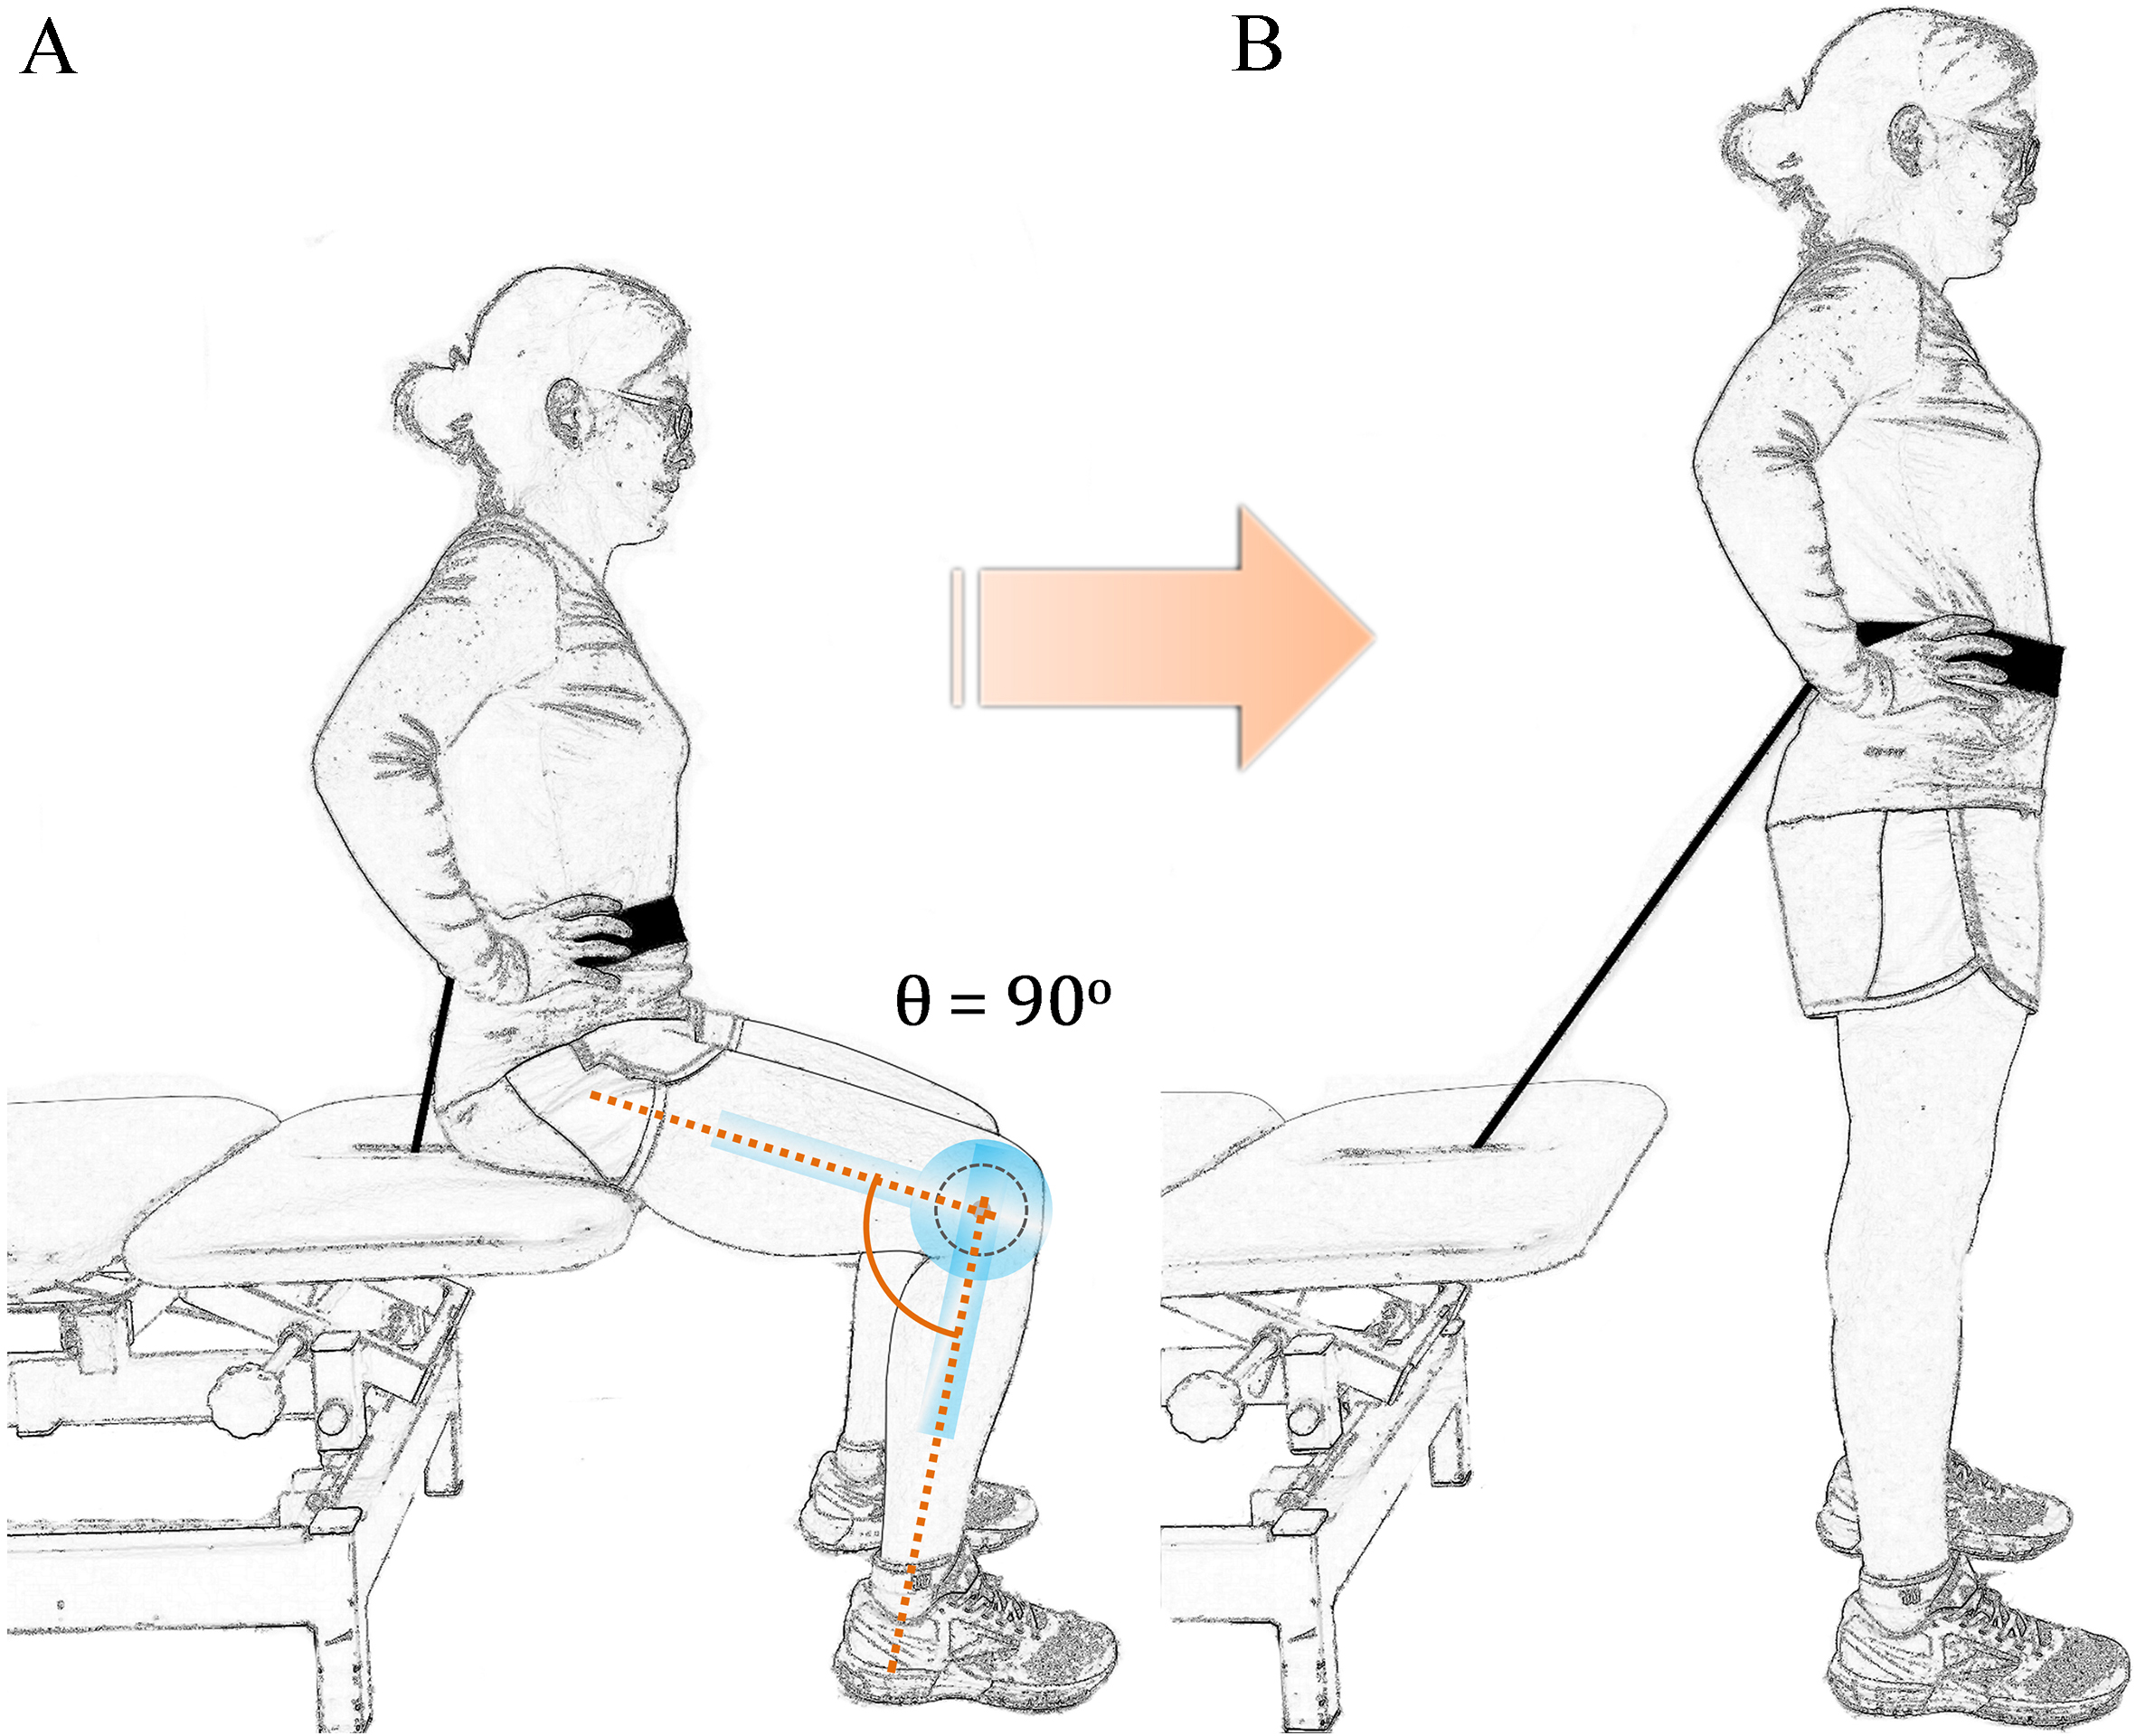
Beginning (A. seated) and ending (B. standing) position during the sit-to-stand movement. Seated knee angle was 90. Standing knee angle was 180. The black cable was part of a linear transducer that allowed power and velocity measures to be assessed during the sit-to-stand.
Sit-to-stand
The STS assessments required the participant to sit, with an upright posture, on an adjustable padded plinth with their feet flat on the floor and hands on their hips. The padded plinth was individually adjusted so that each participant’s knee joint was flexed to 90 while seated (see Fig. 1A). From this position, participants were asked to stand up as quickly as possible without using their hands or jumping off of the ground (Fig. 1B). Participants were asked to perform 3 maximal repetitions of the STS with 60 seconds of rest between repetitions. For each of the STS repetitions, a linear transducer (GymAware, Kinetic Performance Technology, Australia) was positioned directly behind and under the padded plinth. The cord of the linear transducer was fed through an opening in the padded plinth and attached to a belt secured around the participant’s waist. The linear transducer calculated sit-to-stand peak power (STS), mean power (STS), peak velocity (STS), and mean velocity (STS) values of each trial on a wireless tablet (iPad, Apple, CA, USA) using the software application (GymAware Lite, Kinetic Performance Technology, Australia) provided by the linear transducer manufacturer. Power (W) and velocity (m/s) measures were assessed from the vertical displacement and mass (i.e., body mass) moved during the STS movement. The linear position transducer has been shown to be a reliable measure of power during weighted or high intensity unloaded exercises [43, 44]. Due to a technical malfunction, STS data was not collected for three older women. Therefore, a sample size of 15 was utilized for all comparisons and relationships that included the STS measurements in the older women. The STS, STS, STS, STS, sit-to-stand measures were shown to be reliable (ICCs 0.75, 0.83, 0.97, and 0.79, respectively; SEMs 172.6 W, 70.5 W, 0.03 m/s, and 0.03 m/s, respectively) in the young women. Although we were unable to obtain reliability data in the older women, several previous studies [29, 30, 45] have reported that power and velocity measurements are highly reliable in older adults.
Descriptive data for the younger and older women
Younger women
Older women
n
Mean SD
n
Mean SD
p value
Age (yrs)
17
22.50
2.20
18
74.87
5.83
0.01
Height (cm)
17
167.12
4.30
18
155.80
17.42
0.02
Weight (kg)
17
68.64
10.00
18
77.54
25.77
0.37
Physical activity (hrweek)
17
6.65
4.10
18
5.20
3.41
0.29
Significant difference between the younger and older women. 0.0038.
Age related differences
Younger women
Older women
n
Mean SD
n
Mean SD
p value
MVIC (Nm)
17
166.08
36.93
18
102.45
27.32
0.001
mCSA (cm)
17
10.29
2.90
18
6.90
2.24
0.003
MQ (AU)
17
39.36
7.52
18
52.35
9.32
0.001
MQ (Nm/cm)
17
15.48
5.56
18
15.35
3.26
0.957
STS (m/s)
17
0.60
0.12
15
0.41
0.05
0.001
STS (m/s)
17
0.93
0.19
15
0.71
0.10
0.001
STS (W)
17
435.01
81.35
15
299.11
57.18
0.001
STS (W)
17
1070.02
265.36
15
596.58
126.87
0.001
MVIC maximal voluntary isometric contraction strength; mCSA muscle cross sectional area; MQ ultrasound echo intensity; MQ specific tension; STS Sit-to-stand mean velocity; STS Sit-to-stand peak velocity; STS Sit-to-stand mean power; STS Sit-to-stand peak power. Significant difference between the younger and older women. 0.0038. Three of the older women did not complete the sit-to-stand assessments, therefore n of 15 was used.
Correlations for younger women
MVIC
mCSA
MQ
MQ
Age
Height
Weight
STS
STS
STS
STS
MVIC
–
mCSA
0.321
–
MQ
0.171
0.420
–
MQ
0.076
0.473
0.111
–
Age
0.219
0.003
0.132
0.278
–
Height
0.267
0.287
0.280
0.289
0.311
–
Weight
0.413
0.608
0.180
0.278
0.346
0.487
–
STS
0.240
0.303
0.196
0.496
0.045
0.315
0.106
–
STS
0.095
0.283
0.375
0.121
0.204
0.344
0.087
0.278
–
STS
0.270
0.089
0.152
0.263
0.096
0.526
0.263
0.712
0.591
–
STS
0.202
0.028
0.472
0.387
0.260
0.168
0.341
0.388
0.623
0.286
–
Correlation is significant at the 0.05 level (2-tailed). Correlation is significant at the 0.01 level (2-tailed).
Correlations for the older women
MVIC
mCSA
MQ
MQ
Age
Height
Weight
STS
STS
STS
STS
MVIC
–
mCSA
0.766
–
MQ
0.342
0.578
–
MQ
0.168
0.489
0.500
–
Age
0.549
0.504
0.405
0.102
–
Height
0.315
0.517
0.280
0.313
0.362
–
Weight
0.366
0.554
0.375
0.268
0.304
0.761
–
STS
0.050
0.257
0.020
0.322
0.136
0.315
0.369
–
STS
0.008
0.121
0.483
0.199
0.052
0.013
0.346
0.235
–
STS
0.174
0.249
0.373
0.095
0.003
0.193
0.583
0.358
0.768
–
STS
0.280
0.273
0.378
0.186
0.433
0.148
0.188
0.360
0.312
0.028
–
Correlation is significant at the 0.05 level (2-tailed). Correlation is significant at the 0.01 level (2-tailed).
Statistical analysis
All statistical analysis were conducted using SPSS v. 21 (IBM, Chicago, IL, USA). Values were reported as means standard deviations. Thirteen separate independent samples t-tests were used to compare age-related differences in height, weight, physical activity levels, MVIC, CSA, EI, MQ, STS, STS, STS, and STS. Bonferroni corrections were used to maintain an experiment-wise type 1 error rate of 0.05. Therefore, the adjusted alpha value was 0.0038 (i.e., 0.05 13). In addition, Cohen’s effect sizes were calculated for each of the comparisons using the formula . The effect sizes were interpreted as follows: 0.2 small effect; 0.5 moderate effect; 0.8 large effect [46]. Pearson’s correlation coefficients were used to analyze the relationships among the dependent variables in the younger and older women. The type I error rate for the correlations was set a priori at 0.05.
Results
Age-related differences
Significant differences were observed in age and height, where age was greater in the older women ( 0.01; 11.89) and height was greater in the younger women ( 0.02; 0.89). However, there were no significant differences in weight ( 0.20; 0.45) or physical activity levels ( 0.29; 0.38) between the younger and older women (Table 1). MVIC strength ( 0.001; 1.74), mean velocity ( 0.001; 1.75), peak velocity ( 0.001; 1.58), mean power ( 0.001; 1.94), and peak power ( 0.001; 2.43) were greater and MQ ( 0.001; 1.45) was lower in the younger than older women. There was no difference in MQ ( 0.96; 0.02), but CSA ( 0.003; 1.15) was greater in the younger than older women (Table 2).
Relationships
Tables 3 and 4 contain the Pearson correlation coefficient matrices for the dependent variables in the younger and older women, respectively. MQ and MQ were not significantly related ( 0.67; 0.01) in the younger, but were significantly related in the older women ( 0.04; 0.25). MQ was not significantly related to mCSA in the younger ( 0.09; 0.18) but was inversely related in older women ( 0.03; 0.33). In addition, MVIC was significantly related to mCSA ( 0.001; 0.59) in the older women, and was not significantly related to MQ ( 0.51; 0.03 and 0.24; 0.10, respectively) or MQ ( 0.77; 0.01 and 0.65; 0.03, respectively) in either the younger or older women. MQ was significantly related to STS ( 0.04; 0.25) in younger, but not in the older women.
Discussion
The primary findings of the present study were that MVIC strength and mCSA were greater, and MQ was lower in the younger than older women. Moreover, MQ was positively related to MQ in the older women, but not in the younger women (Tables 3 and 4). However, MQ (i.e., strength per unit muscle mass) was not different in the younger and older women in this study. Physical activity levels were also similar in the younger and older women, which may be, at least in part, responsible for the similar muscle qualities observed in the younger and older women in this study. Finally, movement velocity and power during the STS were greater in the younger women, although no significant relationships between these variables and MVIC strength or mCSA were observed in either group.
Traditionally, muscle quality has been defined as muscle strength per unit of muscle mass [8, 9, 47, 48] and has been suggested to be of greater functional relevance than muscle mass alone [9, 10, 47]. Recently, several investigations have used MQ as a surrogate measure of muscle quality in younger and older adults [12, 23, 49]. These authors [12, 23, 49] have suggested that the mechanism for the higher observed MQ in older compared to younger adults is a greater infiltration of connective and/or fat tissue in skeletal muscle of older adults. However, Goodpaster et al. [57] demonstrated that a year of increased physical activity in older adults can attenuate the infiltration of fat into skeletal muscle, the loss of muscle strength, and muscle quality (i.e., specific tension), although it did not prevent the loss of skeletal muscle mass. Due to the physically active levels of the older adults examined in this study, it is tempting to speculate that these older women had lower intramuscular fat tissue than what would be expected in a non-physically active sample, however due to the limitation of the panoramic ultrasound assessment, the intermuscular fat content could not be quantified between groups. Regardless, we observed an age-related increase in MQ and cannot rule out the possibility that increased intramuscular fat content was the mechanism for this increase. However, MQ has also been shown to be sensitive to skeletal muscle glycogen content [18] and tissue hydration status [16] and intracellular water content has been shown to decrease with age [50, 51, 52]. In addition, it has been suggested that EI may be influenced by the local cellular environment [53]. Therefore, it is plausible that changes in the intracellular environment may be a mechanism for the age-related decreases in MQ observed in this and other studies [49].
If the mechanism for the decrease in MQ was an infiltration of non-contractile tissue, this would suggest a decrease in the amount of contractile tissue present per unit of skeletal muscle mass, which could lead to a decrease in muscle quality as quantified by specific tension. However, there was no difference in MQ between the younger and older women in the present study. Moreover, MQ was not significantly related to MQ in the younger women ( 0.11; 0.01), but a moderate relationship ( 0.50; 0.25) was observed between MQ and MQ in the older women of the present study (Table 4). In support of our findings, Scanlon et al. [34] reported a significant increase in quadriceps femoris muscle quality without a significant change in EI after 6 weeks of resistance training in older men and women. Our data, in combination with those of Scanlon, Fragala [34], suggest that differences and/or changes in muscle quality may be observed without a corresponding change in MQ, or vice-versa. We suggest that studies examining changes in skeletal muscle with aging utilize both traditionally calculated muscle quality (i.e., specific tension) and ultrasound EI. However, future studies are needed to further explore the physiological mechanisms that may influence skeletal muscle ultrasound EI in aging.
Muscle mass and strength has been shown to decrease throughout the life span [10, 31, 34, 54, 55, 56]. However, Goodpaster et al. [57] found that physical activity may attenuate age-related decreases in MQ. In addition, Tracy et al. [47] reported an increase in MQ following 9-weeks of strength training in older adults. Welle et al. [58] reported a greater increase in mCSA for younger than older adults, but similar or greater average increases in MQ for the older than younger adults in a 3-month training study. In the present study, the younger women had more muscle mass and were significantly stronger than the older women, but had similar MQ. Therefore, our results support previous studies [47, 57, 58] and may provide further evidence that, although maintenance of physical activity through the aging process may not fully attenuate age-related decreases in muscle mass and strength, it may help preserve the quality of skeletal muscle (i.e., strength per unit muscle mass).
The sit-to-stand assessment is widely accepted as a valid tool to measure functional ability in older adults [59]. Recently, maximal velocity sit-to-stand assessments have been used to examine power and velocity capabilities in older adults [28, 60]. In agreement with previous investigations [31, 32, 61], our data showed that younger women were able to produce more power and higher velocities than older women (Table 2). However, the power and velocity characteristics examined during the maximal effort sit-to-stand assessment were not related to muscle size or strength in the younger or older women, nor to muscle quality in the older women. STS, however, was related to MQ ( 0.50; 0.25) in the younger women. These results suggest that power and velocity produced during a dynamic functional movement, such as the sit-to-stand, may be independent of muscle mass or strength in healthy, active younger and older women. Therefore, these variables may provide unique information regarding muscle function in younger versus older adults. However, our study was limited and the results should be considered cautiously because only the RF muscle of the quadriceps was examined. Future research is needed to determine the utility of these measurements and their relationship to muscle mass, strength, and quality, and to other functional outcomes in larger, more diverse samples (i.e., physically inactive; younger and older men; etc).
In conclusion, our data suggest that quadriceps femoris muscle mass and strength, and sit-to-stand performance are greater in younger than older women. These differences existed despite the younger and older women reporting similar physical activity levels. However, muscle quality, defined as strength per unit muscle mass, was not different in the younger and older women. Therefore, physical activity may help to maintain the quality of skeletal muscle in aging. In addition, EI was lower in the younger than older women and was positively related to muscle quality in the older women, but not in the younger women. We suggest that studies examining changes in skeletal muscle with aging utilize both traditionally calculated muscle quality (i.e., specific tension) and ultrasound EI. Future studies are needed to further explore the physiological mechanisms that may influence skeletal muscle ultrasound EI in younger and older adults. Finally, movement velocity and power during the sit-to-stand were greater in the younger than older women, but non-significant relationships with maximal strength and size suggests that these variables may be influenced by other factors in healthy, active younger and older adults.
Footnotes
Acknowledgments
This study was supported by the 2015 Heart of the Community Wellness Grant (Stillwater Medical Center, Stillwater, OK, USA).
Conflict of interest
None of the authors has any conflict of interest to disclose.
References
1.
Cruz-JentoftAJBaeyensJPBauerJMBoirieYCederholmTLandiF, et al. Sarcopenia: European consensus on definition and diagnosis: Report of the European Working Group on Sarcopenia in Older People. Age and Ageing.2010; 39(4): 412-23.
2.
BaumgartnerRNKoehlerKMGallagherDRomeroLHeymsfieldSBRossRR, et al. Epidemiology of sarcopenia among the elderly in New Mexico. American Journal of Epidemiology.1998; 147(8): 755-63.
3.
MorleyJEAnkerSDvon HaehlingS. Prevalence, incidence, and clinical impact of sarcopenia: facts, numbers, and epidemiology-update 2014. J Cachexia Sarcopenia Muscle.2014; 5(4): 253-9.
4.
RussDWGregg-CornellKConawayMJClarkBC. Evolving concepts on the age-related changes in “muscle quality”. Journal of Cachexia, Sarcopenia and Muscle.2012; 3(2): 95-109.
5.
TanimotoYWatanabeMSunWSugiuraYHayashidaIKusabirakiT, et al. Sarcopenia and falls in community-dwelling elderly subjects in Japan: Defining sarcopenia according to criteria of the European Working Group on Sarcopenia in Older People. Archives of Gerontology and Geriatrics.2014; 59(2): 295-9.
6.
JanssenIHeymsfieldSBRossR. Low relative skeletal muscle mass (sarcopenia) in older persons is associated with functional impairment and physical disability. Journal of the American Geriatrics Society.2002; 50(5): 889-96.
7.
von HaehlingSMorleyJEAnkerSD. An overview of sarcopenia: facts and numbers on prevalence and clinical impact. J Cachexia Sarcopenia Muscle.2010; 1(2): 129-33.
8.
MetterEJLynchNConwitRLindleRTobinJHurleyB. Muscle quality and age: cross-sectional and longitudinal comparisons. The Journals of Gerontology Series A: Biological Sciences and Medical Sciences.1999; 54(5): B207-B18.
9.
FragalaMSKennyAMKuchelGA. Muscle quality in aging: a multi-dimensional approach to muscle functioning with applications for treatment. Sports Medicine.2015; 45(5): 641-58.
10.
LynchNMetterEJLindleRSFozardJLTobinJDRoyTAFlegJLHurleyBF. Muscle quality. I. Age-associated differences between arm and leg muscle groups. Journal of Applied Physiology.1999; 86(1): 188-94.
11.
YoungHJJenkinsNTZhaoQMcCullyKK. Measurement of intramuscular fat by muscle echo intensity. Muscle Nerve.2015; 52(6): 963-71.
12.
WatanabeYYamadaYFukumotoYIshiharaTYokoyamaKYoshidaT, et al. Echo intensity obtained from ultrasonography images reflecting muscle strength in elderly men. Clin Interv Aging.2013; 8(1): 993-8.
13.
RosenbergJGRyanEDSobolewskiEJScharvilleMJThompsonBJKingGE. Reliability of panoramic ultrasound imaging to simultaneously examine muscle size and quality of the medial gastrocnemius. Muscle & Nerve.2014; 49(5): 736-40.
14.
PillenSTakROZwartsMJLammensMMVerrijpKNArtsIM, et al. Skeletal muscle ultrasound: correlation between fibrous tissue and echo intensity. Ultrasound in Medicine & Biology.2009; 35(3): 443-6.
15.
ReimersKReimersCDWagnerSPaetzkeIPongratzDE. Skeletal muscle sonography: a correlative study of echogenicity and morphology. Journal of Ultrasound in Medicine: Official Journal of the American Institute of Ultrasound in Medicine.1993; 12(2): 73-7.
16.
SarvazyanATatarinovASarvazyanN. Ultrasonic assessment of tissue hydration status. Ultrasonics.2005; 43(8): 661-71.
17.
TopchyanATatarinovASarvazyanNSarvazyanA. Ultrasound velocity in human muscle in vivo: Perspective for edema studies. Ultrasonics.2006; 44(3): 259-64.
18.
NiemanDCShanelyRAZwetslootKAMeaneyMPFarrisGE. Ultrasonic assessment of exercise-induced change in skeletal muscle glycogen content. BMC Sports Science, Medicine and Rehabilitation.2015; 7(1): 1.
19.
GoodpasterBHCarlsonCLVisserMKelleyDEScherzingerAHarrisTB, et al. Attenuation of skeletal muscle and strength in the elderly: The Health ABC Study. Journal of Applied Physiology.2001; 90(6): 2157-65.
20.
AkimaHHiokiMYoshikoAKoikeTSakakibaraHTakahashiH, et al. Intramuscular adipose tissue determined by T1-weighted MRI at 3 T primarily reflects extramyocellular lipids. Magnetic Resonance Imaging.2016; 34(4): 397-403.
21.
OverendTCunninghamDPatersonDLefcoeM. Thigh composition in young and elderly men determined by computed tomography. Clinical Physiology.1992; 12(6): 629-40.
22.
FukumotoYIkezoeTYamadaYTsukagoshiRNakamuraMMoriN, et al. Skeletal muscle quality assessed from echo intensity is associated with muscle strength of middle-aged and elderly persons. European Journal of Applied Physiology.2012; 112(4): 1519-25.
23.
WilhelmENRechAMinozzoFRadaelliRBottonCEPintoRS. Relationship between quadriceps femoris echo intensity, muscle power, and functional capacity of older men. Age.2014; 36(3): 1113-22.
24.
StrasserEMDraskovitsTPraschakMQuittanMGrafA. Association between ultrasound measurements of muscle thickness, pennation angle, echogenicity and skeletal muscle strength in the elderly. Age.2013; 35(6): 2377-88.
25.
GoodpasterBHKelleyDEThaeteFLHeJRossR. Skeletal muscle attenuation determined by computed tomography is associated with skeletal muscle lipid content. Journal of Applied Physiology.2000; 89(1): 104-10.
26.
RadaelliRBottonCEWilhelmENBottaroMBrownLELacerdaF, et al. Time course of low- and high-volume strength training on neuromuscular adaptations and muscle quality in older women. Age (Dordr).2014; 36(2): 881-92.
27.
GuralnikJMSimonsickEMFerrucciLGlynnRJBerkmanLFBlazerDG, et al. A short physical performance battery assessing lower extremity function: association with self-reported disability and prediction of mortality and nursing home admission. Journal of Gerontology.1994; 49(2): M85-94.
28.
GlennJMGrayMBinnsA. Relationship of Sit-to-Stand Lower-Body Power With Functional Fitness Measures Among Older Adults With and Without Sarcopenia. Journal of Geriatric Physical Therapy. 2001; 2015.
29.
GrayMPaulsonS. Developing a measure of muscular power during a functional task for older adults. BMC Geriatrics.2014; 14(1): 145.
30.
LindemannUClausHStuberMAugatPMucheRNikolausT, et al. Measuring power during the sit-to-stand transfer. Eur J Appl Physiol.2003; 89(5): 466-70.
31.
JenkinsNDHoushTJPalmerTBCochraneKCBergstromHCJohnsonGO, et al. Relative differences in strength and power from slow to fast isokinetic velocities may reflect dynapenia. Muscle & Nerve.2015; 52(1): 120-30.
32.
ThompsonBJConcholaECPalmerTBStockMS. Effects of aging on maximal and rapid velocity capacities of the leg extensors. Experimental Gerontology.2014; 58: 128-31.
33.
KorhonenMMeroAAlENMSipilASHAKkinenKLiikavainioT, et al. Biomechanical and skeletal muscle determinants of maximum running speed with aging. Medicine+ Science in Sports+ Exercise.2009; 41(4): 844.
34.
ScanlonTCFragalaMSStoutJREmersonNSBeyerKSOliveiraLP, et al. Muscle architecture and strength: Adaptations to short-term resistance training in older adults. Muscle & Nerve.2014; 49(4): 584-92.
35.
JenkinsNDMillerJMBucknerSLCochraneKCBergstromHCHillEC, et al. Test-retest reliability of single transverse versus panoramic ultrasound imaging for muscle size and echo intensity of the biceps brachii. Ultrasound in Medicine & Biology.2015; 41(6): 1584-91.
36.
PalmerTBAkehiKThieleRMSmithDBThompsonBJ. Reliability of Panoramic Ultrasound Imaging in Simultaneously Examining Muscle Size and Quality of the Hamstring Muscles in Young, Healthy Males and Females. Ultrasound in Medicine & Biology.2015; 41(3): 675-84.
MooreAZCaturegliGMetterEJMakrogiannisSResnickSMHarrisTB, et al. Difference in muscle quality over the adult life span and biological correlates in the Baltimore Longitudinal Study of Aging. J Am Geriatr Soc.2014; 62(2): 230-6.
39.
NewmanABHaggertyCLGoodpasterBHarrisTKritchevskySNevittM, et al. Strength and Muscle Quality in a Well-Functioning Cohort of Older Adults: The Health, Aging and Body Composition Study. Journal of the American Geriatrics Society.2003; 51(3): 323-30.
40.
MisicMMRosengrenKSWoodsJAEvansEM. Muscle quality, aerobic fitness and fat mass predict lower-extremity physical function in community-dwelling older adults. Gerontology.2007; 53(5): 260-6.
41.
LarssonBKarlssonSErikssonMGerdleB. Test-retest reliability of EMG and peak torque during repetitive maximum concentric knee extensions. J Electromyogr Kinesiol.2003; 13(3): 281-7.
42.
HowatsonGGlaisterMBrounerJvan SomerenKA. The reliability of electromechanical delay and torque during isometric and concentric isokinetic contractions. J Electromyogr Kinesiol.2009; 19(5): 975-9.
43.
CroninJBHingRDMcNairPJ. Reliability and validity of a linear position transducer for measuring jump performance. Journal of Strength and Conditioning Research/National Strength & Conditioning Association.2004; 18(3): 590-3.
44.
DrinkwaterEJGalnaBMcKennaMJHuntPHPyneDB. Validation of an optical encoder during free weight resistance movements and analysis of bench press sticking point power during fatigue. The Journal of Strength & Conditioning Research.2007; 21(2): 510-7.
45.
LindemannUFarahmandPKlenkJBlatzonisKBeckerC. Validity of linear encoder measurement of sit-to-stand performance power in older people. Physiotherapy.2015; 101(3): 298-302.
46.
CohenJ. Statistical power analysis for the behavioral sciences Lawrence Earlbaum Associates. Hillsdale, NJ.1988: 20-6.
47.
TracyBIveyFHurlbutDMartelGLemmerJSiegelE, et al. Muscle quality. II. Effects of strength training in 65-to 75-yr-old men and women. Journal of Applied Physiology.1999; 86(1): 195-201.
48.
StoutJRSmith-RyanAEFukudaDHKendallKLMoonJRHoffmanJR, et al. Effect of calcium β-hydroxy-β-methylbutyrate (CaHMB) with and without resistance training in men and women 65+ yrs: a randomized, double-blind pilot trial. Experimental Gerontology.2013; 48(11): 1303-10.
49.
RadaelliRBottonCEWilhelmENBottaroMLacerdaFGayaA, et al. Low-and high-volume strength training induces similar neuromuscular improvements in muscle quality in elderly women. Experimental Gerontology.2013; 48(8): 710-6.
50.
BaumgartnerRNStauberPMMcHughDKoehlerKMGarryPJ. Cross-sectional age differences in body composition in persons 60+ years of age. The Journals of Gerontology Series A: Biological Sciences and Medical Sciences.1995; 50(6): M307-M16.
51.
RikkertMOHoefnagelsWDeurenbergP. Age-related changes in body fluid compartments and the assessment of dehydration in old age. Hydration and Aging.1998: 13-32.
52.
NagyIZLustyikGBertoni-FreddariC. Intracellular water and dry mass content as measured in bulk specimens by energy-dispersive X-ray microanalysis. Tissue and Cell.1982; 14(1): 47-60.
53.
AkimaHYoshikoATomitaAAndoRSaitoAOgawaM, et al. Relationship between quadriceps echo intensity and functional and morphological characteristics in older men and women. Archives of Gerontology and Geriatrics.2017.
54.
CandowDGChilibeckPD. Differences in size, strength, and power of upper and lower body muscle groups in young and older men. The Journals of Gerontology Series A: Biological Sciences and Medical Sciences.2005; 60(2): 148-56.
55.
ReimersCDHarderTSaxeH. Age-related muscle atrophy does not affect all muscles and can partly be compensated by physical activity: an ultrasound study. Journal of the Neurological Sciences.1998; 159(1): 60-6.
56.
MitchellWKWilliamsJAthertonPLarvinMLundJNariciM. Sarcopenia, dynapenia, and the impact of advancing age on human skeletal muscle size and strength; a quantitative review. Frontiers in Physiology.2012; 3: 260.
57.
GoodpasterBHChomentowskiPWardBKRossiAGlynnNWDelmonicoMJ, et al. Effects of physical activity on strength and skeletal muscle fat infiltration in older adults: a randomized controlled trial. Journal of Applied Physiology.2008; 105(5): 1498-503.
58.
WelleSTottermanSThorntonC. Effect of age on muscle hypertrophy induced by resistance training. The Journals of Gerontology Series A: Biological Sciences and Medical Sciences.1996; 51(6): M270-M5.
59.
LordSRMurraySMChapmanKMunroBTiedemannA. Sit-to-stand performance depends on sensation, speed, balance, and psychological status in addition to strength in older people. The Journals of Gerontology Series A, Biological Sciences and Medical Sciences.2002; 57(8): M539-43.
60.
GrayMPaulsonS. Developing a measure of muscular power during a functional task for older adults. BMC Geriatr.2014; 14: 145.
61.
TojiHKanekoM. Effects of aging on force, velocity, and power in the elbow flexors of males. Journal of Physiological Anthropology.2007; 26(6): 587-92.