
Abstract
As deep learning continues to advance, object detection technology holds potential and promising prospects in the recognition of cylindrical objects’ quantity, such as in industries like timber processing, construction, and pipeline engineering. The traditional manual counting methods have lower efficiency, a higher error rate, and demand a greater amount of manpower. The introduction of object detection technology can effectively address these issues, enhance work efficiency, and reduce labor costs. Therefore, this research paper introduces a novel variant of the YOLOv5s algorithm, called YOLOv5-COC, specifically designed to tackle the task of counting cylindrical objects. This paper makes the following significant contributions: Firstly, introducing the utilization of data augmentation techniques to augment the dataset, thereby enhancing the generalization ability of the model. Secondly, the K-means
Introduction
Fueled by the continuous progress of artificial intelligence technology, the gradual replacement of humans by object detection technology in performing various complex tasks has become increasingly evident. For instance, facial recognition technology has been applied in compulsory education [1], aiming to tackle concerns like enhancing campus security, automating attendance tracking, and monitoring student emotions. It has also found use in border control processes [2], reducing waiting times during crossings. Additionally, it has been employed in mask face recognition [3], effectively mitigating the spread of viruses during pandemic periods. However, object detection has seen relatively limited application in the realm of object quantity recognition. Following extensive research conducted by the team, it has been discerned that the application of object detection technology holds substantial potential and vast prospects in the identification of quantities of cylindrical objects. Conventional manual counting methods encounter numerous challenges in the recognition of cylindrical objects, including inefficiency, susceptibility to errors, and substantial human resource consumption. By incorporating object detection technology, these issues can be effectively addressed, leading to improved work efficiency and reduced labor costs. In everyday life and various industrial sectors, numerous application scenarios necessitate the identification of the quantity of cylindrical objects. For instance, in the timber processing industry, the utilization of object detection technology for the automatic recognition and counting of logs ensures the smooth progression of the production process. Similarly, in the construction and pipeline sectors, precise detection of the quantity of steel bars and water pipes ensures the structural integrity and seamless execution of operations. Hence, the recognition of the quantity of cylindrical objects in images holds significant research value and promising prospects for the future. To investigate target detection algorithms for recognizing the quantity of cylindrical objects in images, this paper improved upon the YOLOv5s-based algorithm and introduced the YOLOv5-COC model. This paper presents some valuable contributions as shown below:
Regarding the selection of the dataset, this paper chose suitable data augmentation methods to enhance the dataset, with the aim of simulating extreme scenarios and enhancing the model’s generalization abilities. Concerning the initialization of anchor boxes within the model, this paper employed the k-means The introduction of the coordinated attention mechanism has been implemented to establish effective correlations between different positions within the feature map. This enhancement facilitates the better capture of contextual information and semantic relationships pertaining to the targets. The fusion of the Bidirectional Weighted Feature Pyramid Network (BiFPN) and the network results from YOLOv5s has effectively integrated feature information from different scales, resulting in improved object detection performance. Replacing the original algorithm’s loss function with Smooth Intersection over Union (SIoU). In contrast to the original loss function in YOLOv5s, SIoU provides a smoother estimation of the overlap between bounding boxes, resulting in greater training stability, faster convergence, and improved performance. Replacing Non-Maximum Suppression (NMS) with DIoU-NMS.DIoU-NMS allows for a more precise selection of anchor boxes with the highest target confidence and optimal positioning, while also exhibiting improved adaptability to various target shapes. The specific contributions outlined in this paper are illustrated in Fig. 1.
As deep learning continues to make significant progress, the emergence of Convolutional Neural Networks (CNNs) [4] has gradually supplanted traditional object detection algorithms. Object detection algorithms primarily fall into two categories: one-stage object detection algorithms and two-stage object detection algorithms. One-stage object detection algorithms are exemplified by YOLO [5, 6, 7, 8], SSD [9], DSSD [10], RetinaNet [11], and EfficientDet [12]. The prominent two-stage object detection algorithms include R-CNN [13], SPPnet [14], Fast R-CNN [15], Faster R-CNN [16], Mask R-CNN [17], and FPN [18]. However, it must be emphasized that two-stage object detection algorithms can enhance detection precision, but at the expense of extended computational time when contrasted with one-stage detection algorithms.
Due to the prolonged computational time of current two-stage object detection algorithms, they are unable to meet the exigencies of real-time detection. In 2016, Redmon [5] first introduced the YOLO algorithm for object category recognition in images. In 2017, Redmon [6] introduced the YOLOv2 model, which was capable of detecting over 9000 different categories, leading to an improvement in detection accuracy. In 2018, Redmon [7] once again introduced the YOLOv3 model, which employed the DarkNet-53 network architecture. The model incorporated the ideas of ResNet by stacking more layers for feature extraction and also utilized Spatial Pyramid Pooling Networks to facilitate multi-scale inputs and same-size outputs. In 2020, Alexey [8] introduced the YOLOv4 model, which adopted the CSP DarkNet-53 network architecture, enabling the model to adapt to complex scenarios. In the same year, Ultralytics introduced the YOLOv5 model. While it didn’t exhibit significant improvements in detection speed and accuracy, it was notable for its lighter model weight. Subsequently, Chuyi Li [19], Alexey Bochkovskiy [20], and Ultralytics, building upon the foundation of YOLO, introduced various other versions. However, within the YOLO series of algorithms, YOLOv5 stands out for its smaller model size and faster speed compared to previous versions. This makes it particularly suitable for deployment on energy-efficient devices, including embedded and mobile systems.
One of the applications of object detection is counting, which aims to alleviate issues associated with manual counting, including low efficiency, low accuracy, and limited real-time capabilities. Arinaldi [21] employed the Faster R-CNN algorithm to establish a system for the analysis of traffic road videos. This system, in particular, can accomplish tasks such as vehicle flow statistics, classification of vehicle types, estimation of vehicle speeds, and monitoring of lane utilization. Tu [22] introduced an approach for passion fruit detection and counting using Faster R-CNN, which provided crucial information for yield prediction and machine harvesting. Ahmad [23] introduced a method for top-down view pedestrian detection and counting based on SSD, enabling the statistical analysis of pedestrian traffic. Xu [24] introduced a method for cattle counting using Mask R-CNN in images collected by drones, and applied it in various scenarios such as extensive ranches and feeding facilities.
YOLO, being a popular object detection framework, is extensively utilized for counting purposes as well. Zhao [25] introduced an modified wheat ear detection method based on YOLOv5 in drone images. This improvement expanded the YOLO algorithm’s usability in challenging field conditions, facilitating precise detection of wheat ears, particularly small-sized ones. In the realm of transportation, Li [26] presented an object detection approach utilizing YOLOv5s to count axles and recognize tire types. This method captures vehicle information and is used to determine whether trucks are overweight. Ling [27] introduced an enhanced YOLOv5s detection approach, integrating it with DeepSORT object tracking for the purpose of crowd monitoring and counting in tourist attractions and urban environments. In the field of logistics, Xie [28] introduced a lightweight recognition model called Tailored-YOLO, which enables parcel counting in warehouse processes. Hence, this paper introduces an improved YOLOv5s model for the localization and counting of densely arranged cylindrical objects, further enhancing work efficiency.
Improved YOLOv5s network model
This section provides a comprehensive explanation of the enhancement techniques proposed for the YOLOv5s modelencompassing enhancements in attention mechanisms, neck architecture, loss functions, post-processing methodologies, and anchor box initialization.
Coordinate attention
The concept of attention mechanism, initially introduced by Bahdanau [29] in 2014, draws its inspiration from human visual research. It autonomously acquires critical information from the input data, leading to an enhancement in the model’s performance. Distinct weights are allocated to various feature layers by the attention mechanism, enabling the prioritization of segments with higher weights, which are more critical. Previously, attention mechanisms in lightweight networks commonly utilized the Squeeze-and-Excitation Network (SE), primarily addressing inter-channel information and disregarding positional information. While subsequent approaches, such as the Convolution Block Attention Module (CBAM), have endeavored to derive positional attention information via convolution by reducing the channel count, convolution can exclusively capture local relationships and is deficient in extracting long-range relationships.
Coordinate attention (CA) [30], as an innovative and effective attention module, involves two principal phases: embedding of coordinate information and the generation of coordinate attention. In the section on embedding of coordinate information, coordinate attention transforms two-dimensional global pooling into feature encodings specific to individual dimensions, facilitating the capture of distant spatial interactions with exact positional details. For the input X, encoding is carried out independently for each channel. Along the horizontal axis, it uses a pooling kernel with a size of (h, 1), while along the vertical axis, it utilizes a kernel with a size of (1, w). As illustrated in Eq. (1) and Eq. (2), these operations merge features both horizontally and vertically, generating a set of feature maps that are sensitive to direction.
The Fig. 1 illustrates the coordinate attention module.
Coordinate attention model.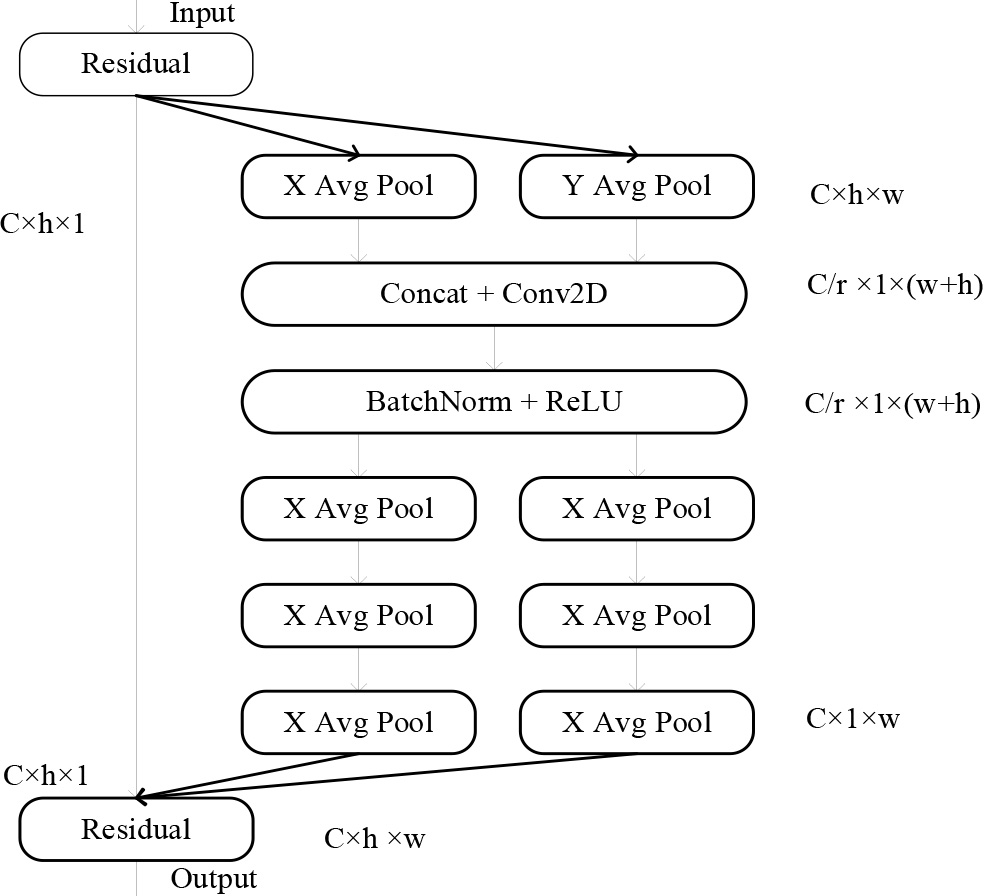
Where,
In coordinate attention generation section, as shown in Eq. (3), initially, the direction-aware feature maps in this set are stacked and their channel count is reduced through convolution, resulting in a feature channel count of
Subsequently,
Where,
Finally,
Where,
In general, the coordinate attention is ideally inserted at the intermediate layers of the network. This is because, within the network’s shallow layers, where the spatial feature maps extracted tend to be overly expansive, and the channel count is insufficient for the effective capture of specific features. On the other hand, in the later layers of the network, an excessive number of channels can lead to overfitting. Furthermore, it is imperative to note that as the coordination attention mechanism approaches the classification layer, it is more susceptible to perturbing the focus on classification outcomes, consequently impacting the stability of the classification results. Therefore, selecting the intermediate stages of the network as the insertion location for the coordinated attention mechanism can enhance the feature representation capabilities effectively.
To further assess the impact of the insertion point of the coordination attention mechanism on the algorithm, a ablation experiment regarding the coordination attention mechanism was conducted. The positions of adding the coordinated attention mechanism are illustrated in Fig. 2, denoted as (a), (b), and (c), representing three different insertion locations. Specifically, (a) and (b) correspond to insertion in the Backbone, while (c) corresponds to insertion in the Neck. The final results, as demonstrated in Experiment 1 of Fig. 7, conclusively establish that (c) is the optimal insertion location based on the experimental findings.
Insertion positions of cooperative attention.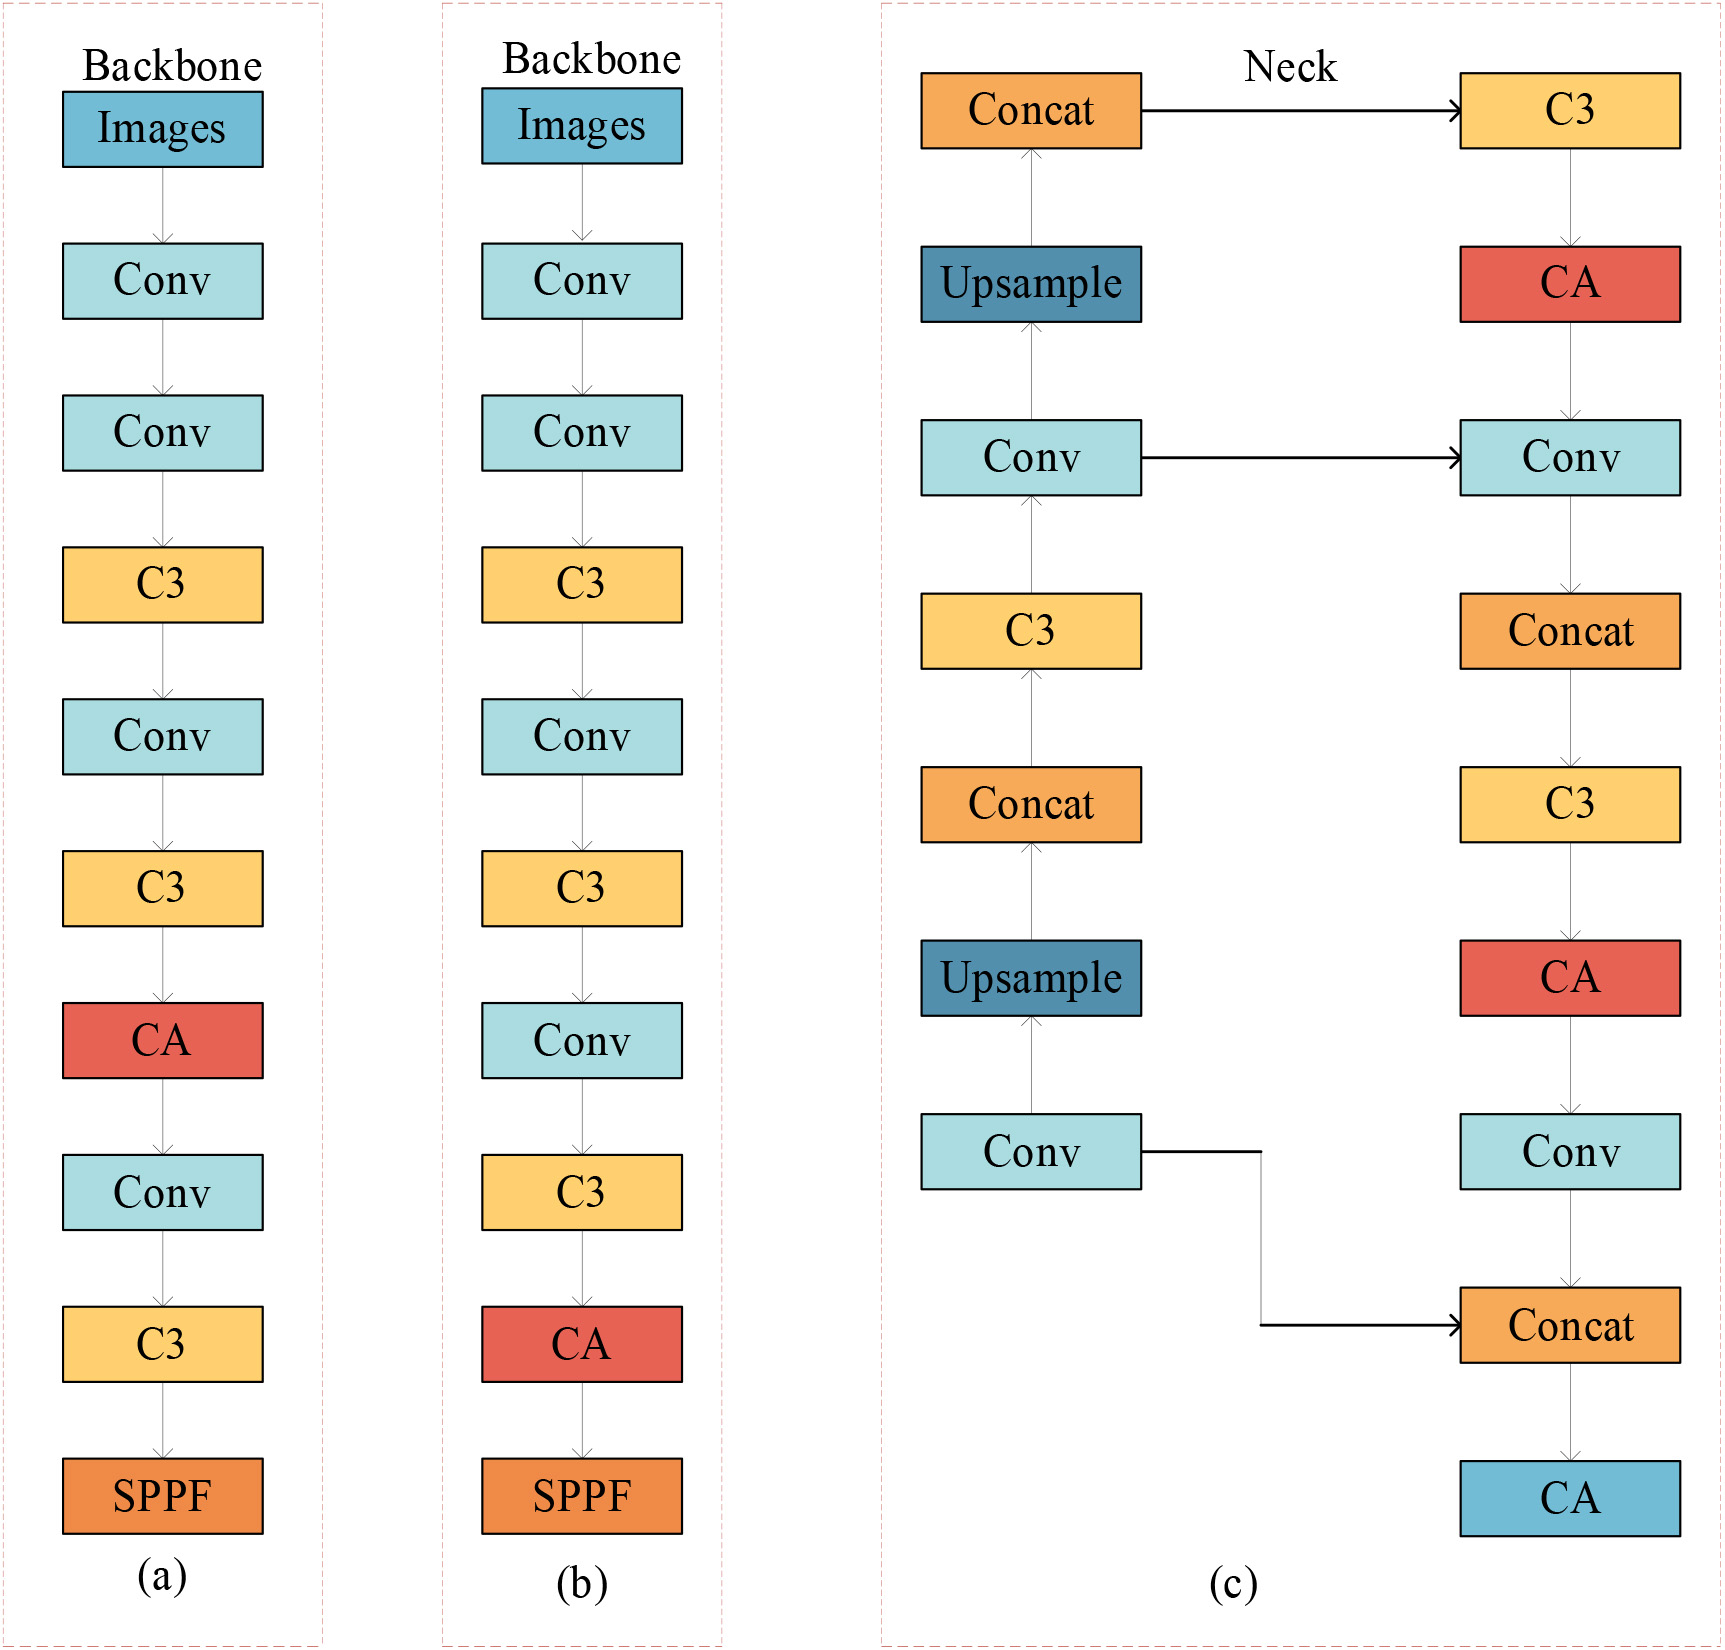
The Neck architecture in YOLOv5s is crucial for object detection, refining backbone network features, and enhancing feature fusion. It consists of two key components: the FPN and the PAN, which collaborate effectively, as demonstrated in the structural diagram presented in Fig. 3. The first two columns represent the FPN structure, while the rightmost column represents the bottom-up structure of the PAN architecture. The FPN structure establishes a pathway from top to bottom for feature fusion, but the unidirectional flow of information limits the capacity for feature integration. The PANet network builds upon FPN by introducing a bottom-up pathway for information enhancement, effectively preserving more shallow-level features. However, due to the excessive retention of shallow-level semantic information, it results in a significant loss of deep-level semantic information in the network. Hence, to strike a balance between retaining more shallow-level semantic information and avoiding excessive loss of relatively deep-level semantic information, the BiFPN structure is adopted as a replacement for the original FPN+PAN structure.
FPN + PAN structure.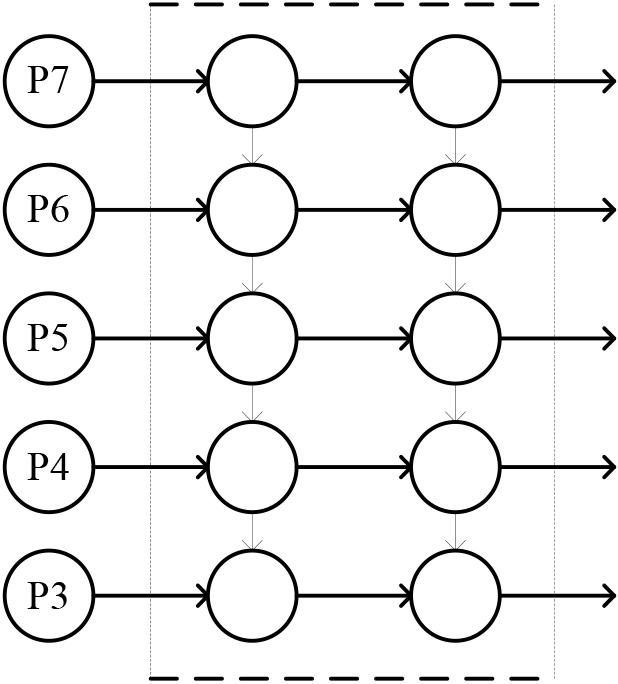
The BiFPN structure, introduced by Mingxing Tan [31] in 2020, is an improvement over PAN and represents a bidirectional feature pyramid network. The primary concepts behind BiFPN are twofold: These improvements encompass two aspects: the first is the implementation of efficient bidirectional cross-scale connections, and the second is the incorporation of weighted feature map fusion. By employing bidirectional fusion, it reconstructs bidirectional pathways, facilitating the fusion of feature information originating from distinct scales of the backbone network. By incorporating both upsampling and downsampling techniques, this unit not only unifies feature resolution scales but also establishes bidirectional connections between feature maps at the same scale. This clever integration of features not only avoids incurring additional costs but also partially resolves the problem of losing important feature information. Additionally, BiFPN is treated as a fundamental unit, where a pair of pathways within BiFPN is considered as a single feature layer. To achieve further high-level feature fusion, this unit is iterated several times, as depicted in the network structure shown in Fig. 4.
BiFPN structure.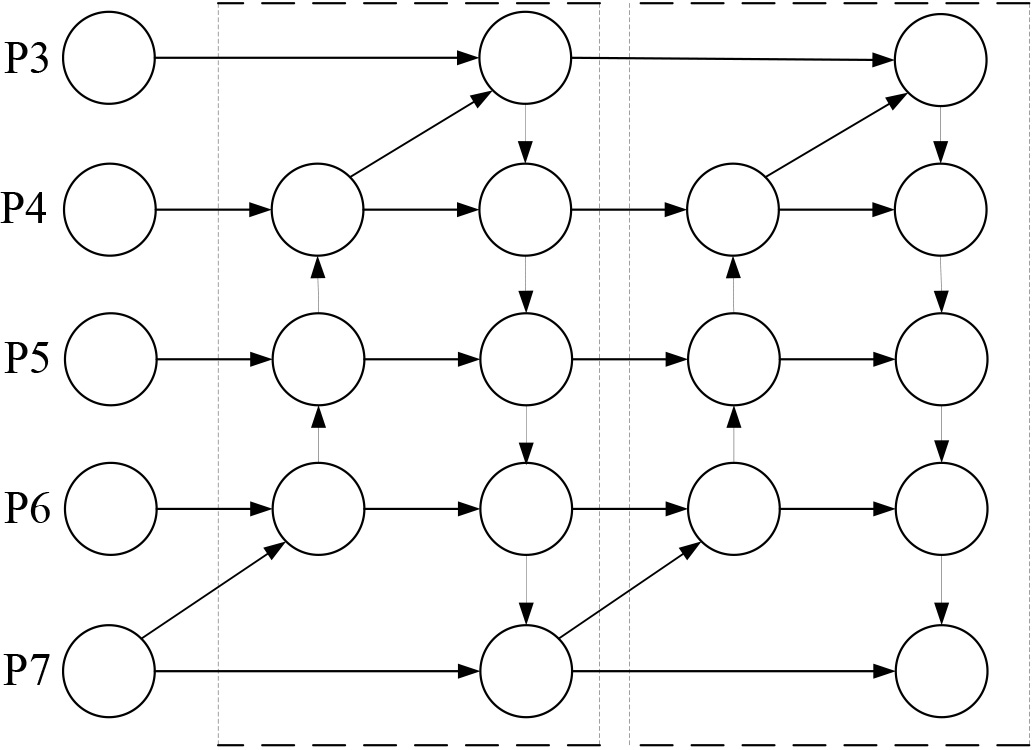
In contrast to conventional feature fusion, BiFPN incorporates a weighted fusion mechanism, enabling the acquisition of the significance of distinct input features and customizing the fusion process for each input feature. Hence, BiFPN introduces trainable weights, which are applied to each input with additional weights. BiFPN utilizes rapid normalized fusion for weight determination. This approach computes the fusion weights by directly dividing the sum of all values by the corresponding weights. Moreover, it further ensures the normalized fusion weights fall within the range of [0, 1]. Fast normalized fusion is 30% faster than Softmax-based fusion under similar optimization results. The calculation formula is defined as follows:
In Eq. (7), A represents the weights, and the activation function ReLU ensures that
CIoU [32] is a localization loss function used in YOLOv5s, and its formula is as follows:
where,
The CIoU takes into account the intersection area, center point distance, and aspect ratio when comparing predicted and target bounding boxes. However, the issue of misaligned angles between the true box and the predicted box is not considered. Hence, this study incorporates the SIoU loss function for bounding box regression.
Compared to the initial loss function, the SIoU loss function [33] incorporates the angle between the ground truth box and the predicted box as part of the loss function. Specifically, it comprises four constituent elements, with the precise formula detailed as follows:
Where,
Non-Maximum Suppression (NMS) plays a vital role as an essential algorithm in the post-processing phase of object detection tasks. The traditional NMS algorithm relies solely on the IoU metric to suppress redundant bounding boxes. However, this approach often fails in cases of overlapping or occluded objects, making it challenging to accurately identify very small objects, as they are typically overshadowed by larger ones. At the same time, when using the traditional NMS algorithm, all detection boxes need to be sorted, and pairwise IoU calculations must be performed. If there are a large number of detection boxes, this can lead to significant computational overhead. Therefore, Distance-IoU-NMS(DIoU-NMS) [34] is chosen as a replacement for traditional NMS.
DIoU-NMS takes into account not only the IoU value but also the distance between the predicted box and the ground truth box’s center point during the calculation process, in contrast to NMS. The formula is as follows:
Were, thresh represents the set IoU threshold;
The YOLOv5s model utilizes the k-means clustering algorithm to ascertain the anchor box sizes. Nevertheless, it’s worth mentioning that the k-means algorithm’s sensitivity to the initialization of cluster centers should not be overlooked. As k-means includes the random selection of initial cluster centers, running the algorithm multiple times may yield slightly varying results. If the initial selection of cluster centers during the running process is not appropriate, it can have a significant impact on the final clustering results. Hence, in this paper, the k-means
The k-means
Experiments and results
Dataset
Data augmentation techniques
Data augmentation techniques
The dataset in this study was acquired through the capture of images of bamboo sticks using a smartphone. The bamboo sticks were handheld during the capture, and the camera had a resolution of 48 million pixels. The capture environment was well-lit. This paper employed the labelImg software for image annotation, designating a single category as “bar”. The training, validation, and test sets are divided in a nearly 6:2:2 ratio, making up the dataset of 344 captured images.
To further increase the dataset’s size and enhance the model’s generalization, this paper employed data augmentation techniques to simulate extreme conditions in the captured images, thereby augmenting the diversity of training images. The selected data augmentation methods in this study include brightness variation, motion blur, Gaussian noise, and image sharpening. Each data augmentation method results in the expansion of 1 image in the dataset. Therefore, the final dataset has been augmented from 344 images to 1376 images, with 793 images in the training set, 306 images in the test set, and 277 images in the validation set. Table 1 describes the effects of the data augmentation methods, and Fig. 5 illustrates the different effects of each data augmentation technique. In Fig 5, (a) represents the original image, (b) represents the effect under strong lighting conditions, (c) shows the effect under weak lighting conditions, (d) demonstrates the effect of motion blur, (e) shows the effect of Gaussian noise, and (f) displays the effect of image sharpening.
All experiments were conducted using the PyTorch framework. The software and hardware configuration parameters are as shown in Table 2.
Software and hardware platform configuration parameters
Software and hardware platform configuration parameters
Confusion matrix
Illustrates the impact of data augmentation techniques.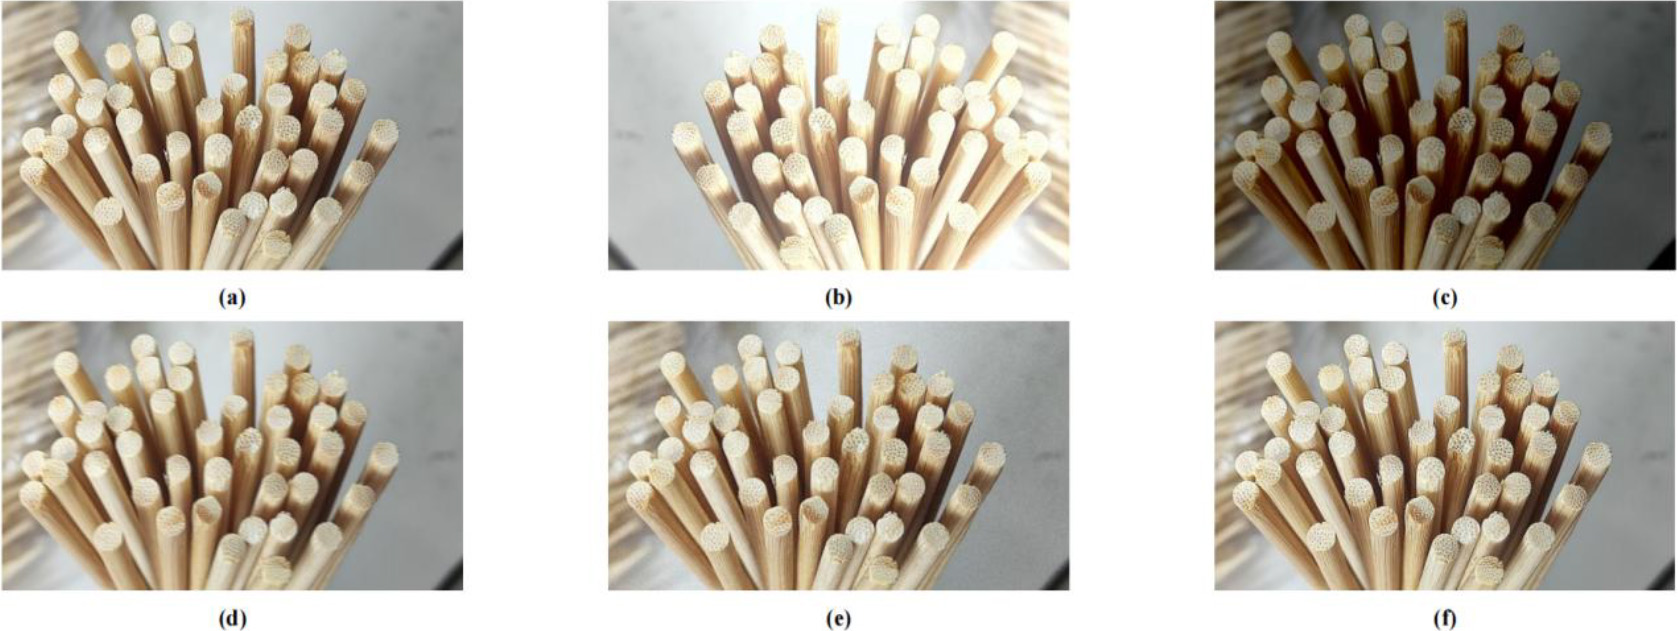
In this experiment, the network’s performance will be evaluated using the following metrics: precision, recall, mean average precision (mAP), and frames per second (FPS). Before introducing these metrics, let’s first discuss some concepts: TP represents true positive, indicating that the positive class from the ground truth bounding box is correctly detected as positive in the object detection results. TN represents true negative, indicating that the negative class from the ground truth bounding box is correctly detected as negative in the object detection results. FP represents false positive, indicating that the negative class from the ground truth bounding box is incorrectly detected as positive in the object detection results. FN represents false negative, indicating that the positive class from the ground truth bounding box is incorrectly detected as negative in the object detection results. The meanings of TP (True Positive), TN (True Negative), FP (False Positive), and FN (False Negative) are provided in Table 3.
Precision measures the model’s accuracy in predicting positive instances. The calculation formula for precision is as follows:
Recall, assesses the model’s capacity to detect real positive samples. It is calculated as follows:
The AP metric assesses the area under the Precision-Recall (P-R) curve . The calculation formula for Average Precision is as follows:
Were, AP stands for Average Precision, where
The mAP is utilized to compute the average precision across all classes within the dataset. The calculation formula for mAP is as follows:
Were, mAP signifies the Mean Average Precision,
The FPS metric represents the number of frames or images processed or displayed per second and is typically used to assess the speed and performance of devices such as computers or cameras. The formula for calculating FPS is as follows:
Were,
In this section, we shall introduce and analyze the ablation experiments of cooperative attention mechanism, performance comparison experiments with different algorithms, and the experimental results of various module ablations. Finally, the experimental results of YOLOv5s-COC model are analyzed. In the ablation experiments of the cooperative attention mechanism,we examined the influence of incorporating the attention mechanism at various network positions, comparing four distinct integration methods. Based on the experimental results, it was validated that adding the cooperative attention to the Neck network is more suitable. The specific addition method is illustrated in Fig. 2(c), and the detailed experimental results are presented in Table 4, as shown in the ablation experiments of the cooperative attention mechanism.
In the comparative experiments assessing the performance of various algorithms, we examined the effectiveness of YOLOv5-COC in comparison to Fast R-CNN, SSD, YOLOv3, YOLOv4, and the default settings of YOLOv5s. The YOLO series of algorithms demonstrate a significant improvement in precision, recall, average precision, and FPS values compared to Fast R-CNN and SSD. In comparison to YOLOv5s, YOLOv5-COC demonstrates an enhancement of 1% in precision, a 1% increase in recall, a 1.3% boost in mAP, and an impressive 27.7 FPS improvement. The improved YOLOv5-COC model exhibits faster inference speed. The specific experimental results, as shown in Table 4, depict the performance comparison of different algorithms. The impact of various improvement modules on the YOLOv5s algorithm was assessed in module ablation experiments. The specific experimental results are depicted in Table 4, showing the results of the module ablation experiments. After optimizing by adding the cooperative attention mechanism at the Neck layer, incorporating BiFPN in the network, replacing the original loss function with SIoU, and changing the bounding box selection algorithm to DIoU-NMS, the YOLOv5-COC model showed improvements in Precision, Recall, mAP@0.5, mAP@0.5:0.95, and FPS. The values increased from the initial YOLOv5s values of 97.3%, 98.1%, 97.4%, 68.9%, and 32.3, respectively, to 98.3%, 99.1%, 98.7%, 72.4%, and 60.
The final model exhibits a modest improvement in performance compared to the initial model: a 1% increase in accuracy, a 1% increase in recall, a 1.3% increase in mAP, and a notable 3.5% increase in mAP@0.5:0.95. While the performance gain of the final model may not appear significant in traditional metrics, it is crucial to consider the nature of the task at hand.The task of detecting cylindrical objects is relatively straightforward, and typical object detection models can accurately identify the majority of cylindrical objects in the dataset. Even the initial, unimproved object detection model performs reasonably well. However, when dealing with densely distributed cylindrical objects, some challenges arise. These challenges primarily include the problems of multiple detections and missed detections.The multiple detections issue occurs when the model incorrectly combines multiple recognized cylindrical objects into a single object, resulting in over-detection. This affects precision since a single actual object is mistakenly labeled as multiple objects. On the other hand, the missed detection issue arises when closely spaced cylindrical objects or adverse environmental conditions cause the model to miss some objects, leading to a decrease in recall.Given that these issues are relatively rare within the dataset, they may not significantly impact traditional performance evaluation metrics. Therefore, the relatively small improvement in the final model’s performance is a result of the specific nature of the task and the relatively low occurrence rat.
The final model of this study demonstrates a notable improvement in FPS compared to the initial model, with a remarkable increase of 27.7. The reasons behind this improvement can be attributed to several key factors:
Incorporation of Cooperative Attention Mechanism: The study introduced a cooperative attention mechanism to the existing YOLOv5s structure. This enhancement introduces an additional computational burden, requiring extra computational resources for tasks such as coordinate information processing and attention generation. As a result, it initially led to a reduction in the algorithm’s FPS metric. Integration of BiFPN Network: YOLOv5s was fused with the BiFPN network, introducing bidirectional channels from high to low resolution for improved feature fusion. Compared to the original structure, BiFPN offers a lightweight advantage, contributing to the increase in the FPS metric. Replacement of CIoU Loss Function with SIoU: The study replaced the CIoU loss function in YOLOv5s with SIoU loss. SIoU employs smoothing operations to approximate IoU, avoiding complex mathematical computations while maintaining smoother gradients. For this dataset, SIoU demonstrated faster convergence and computation speed, resulting in an increased FPS metric. Implementation of DIoU-NMS: In place of traditional NMS algorithms, DIoU-NMS was used. Traditional NMS typically employs IoU for measuring bounding box overlap, which can become computationally intensive when dealing with a large number of objects to be detected. In this dataset, the prevalence of objects for detection accentuated the drawbacks of traditional NMS. DIoU-NMS incorporates distance information alongside traditional IoU, which is typically faster to compute than IoU. Moreover, DIoU-NMS typically requires only one iteration to determine the retained bounding boxes, reducing computation time and contributing to the improved FPS metric.
In summary, the FPS metric of YOLO-COC was significantly enhanced due to improvements in various aspects, with the exception of a minor reduction caused by the added cooperative attention mechanism. These enhancements have laid a strong foundation for real-time detection in the future.
The experimental results indicate that the proposed YOLOv5-COC model in this study is effective and superior in recognizing cylindrical objects. To validate the robustness of the research algorithm, experiments were conducted under conditions of weak lighting, strong lighting, and images with blur. The detection performance remained good, demonstrating the algorithm’s strong robustness. The detection results are shown in Fig. 6. In Fig. 6(a), we have the original image containing 60 objects to be detected. In Fig. 6(b), the detection results under low light conditions are shown, with 60 objects detected. Figure 6(c) displays the detection results under low light conditions, still detecting all 60 objects. Finally, Fig. 6(d) demonstrates the detection results under motion blur, again successfully detecting all 60 objects.
Experimental results
Inference results under low light, strong light, and motion blur conditions.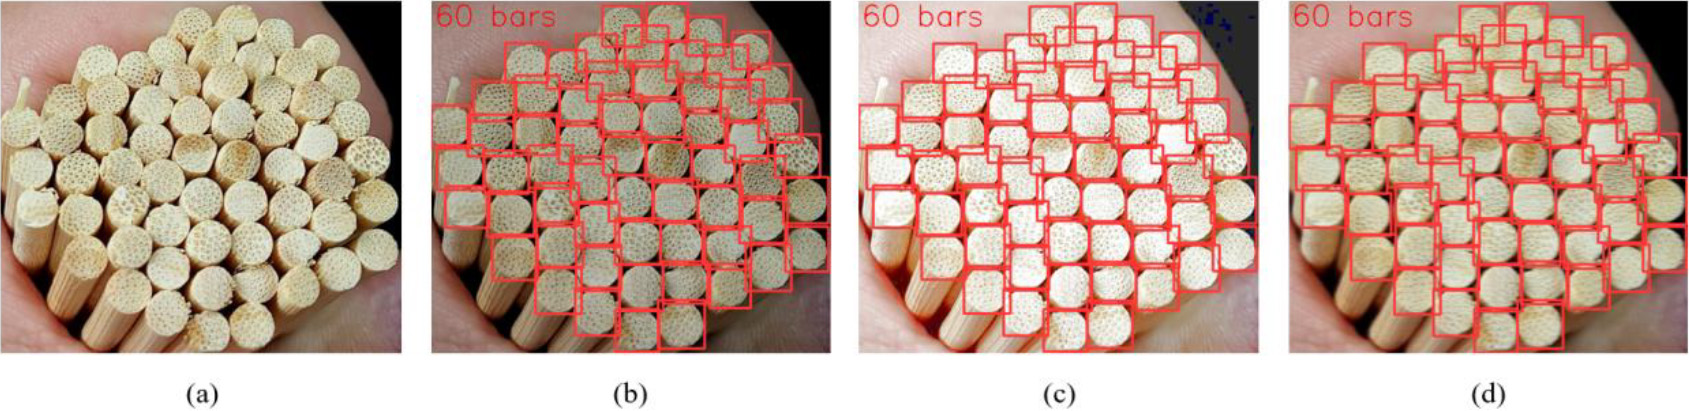
Experimental parameter configuration
The parameters for each model are consistent. The experiment lasts for 150 iterations, using a batch size of 8 and a learning rate of 0.01. After each iteration, we save the model weights, resulting in the final desired model weights. Warmup is employed during model training to gradually increase the learning rate, thereby reducing overfitting in the early stages of training with small batch data, dampening oscillations, and ensuring model stability.
Training results
After completing 200 epochs of model training, we can evaluate the training results. The performance metrics for both the training and validation sets during training are shown in Fig. 7.
Experimental results on the training and validation sets.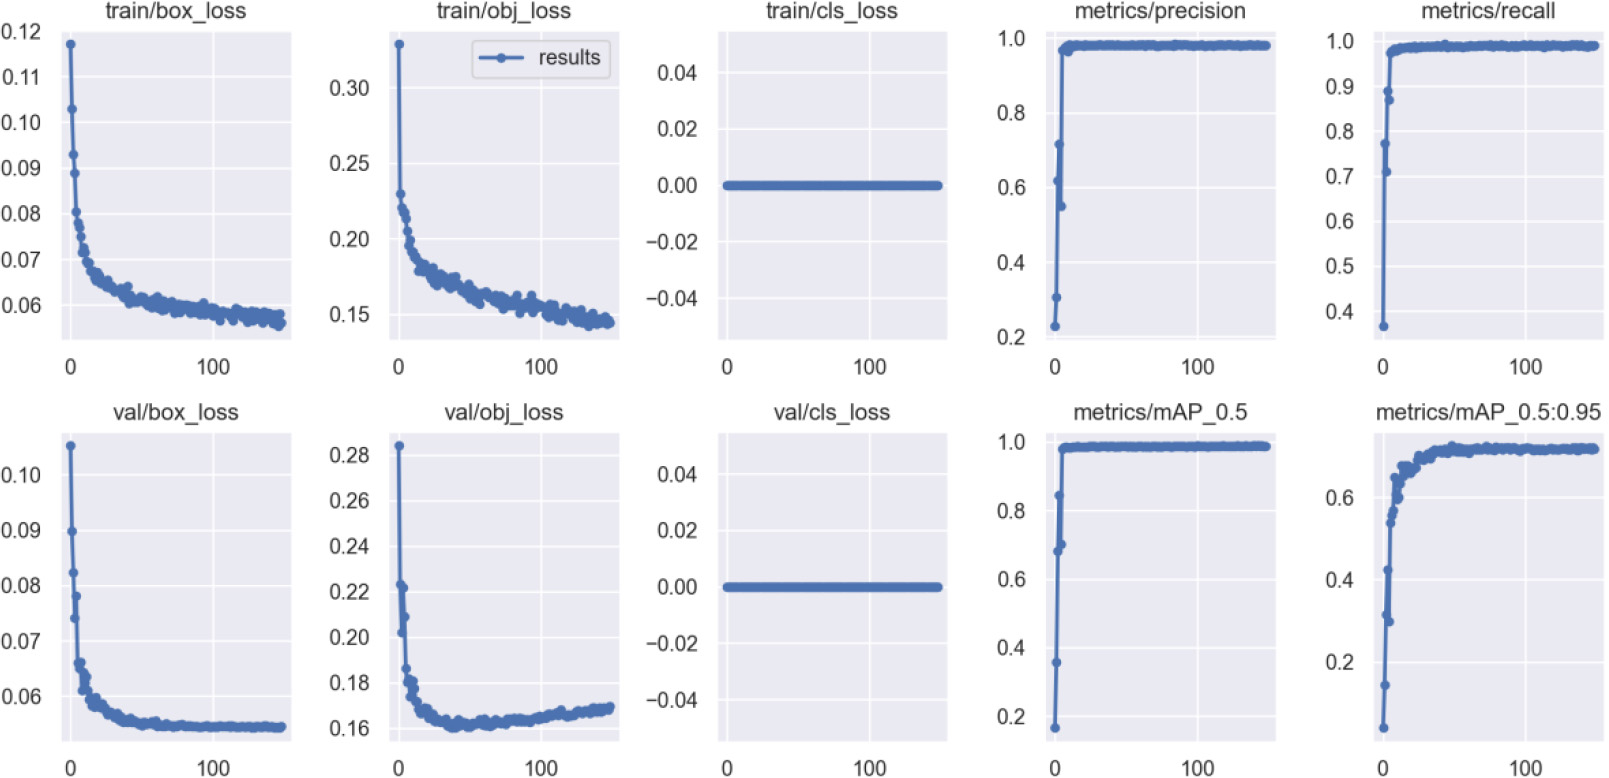
Around 40 iterations, it can be observed from the validation set’s target loss graph that the validation set’s target loss reaches its lowest value. Afterward, as the number of iterations grows, the validation set’s target loss gradually starts to rise, indicating the occurrence of overfitting. Moreover, by examining the plots of other evaluation metrics , it can be observed that their values reach a plateau, and any further increase is not significant. However, in the training set’s bounding box loss and target loss graphs, there is still a decreasing trend in the loss values, and at the 148th iteration, the model stops training due to minimal training variation. To ensure obtaining the optimal model, this paper selects the best weights after 150 iterations as the weights for cylindrical object detection.
This paper introduces an object detection algorithm that is designed to identify cylindrical objects, leveraging the YOLOv5s network. Before starting the model training, data augmentation is implemented on the dataset, incorporating methods like Brightness Adjustment, Noise Addition, and Motion Blur. The k-means
Discussion
While the object detection algorithm proposed in this study has shown promising performance in recognizing cylindrical objects, there are still several directions for future research and improvements. Here are some prospects:
Exploring the Detection of Various Categorizations of Cylindrical Objects: By expanding the dataset to include images of bundled logs, steel pipes, and other cylindrical objects of various shapes and sizes, the algorithm can be trained to detect a wider range of cylindrical objects, enhancing its generalization capabilities. Addressing Detection in Complex Scenes: The current algorithm has been primarily tested and evaluated in simple scenes. There is a need to extend its applicability to more complex and cluttered scenes for robust object detection. For instance, in situations where cylindrical objects are densely packed, occlusions can become more prevalent, potentially leading to missed detections or the merging of multiple cylindrical objects into a single entity. Moreover, variations in the orientation of cylindrical objects can also impact the detection performance. Addressing these challenges will require the development of more robust algorithms capable of handling various complexities in real-world scenes. Application in real-world scenarios: Our algorithm holds the potential for various practical applications, such as industrial automation and smart forestry. We aim to further optimize the algorithm, explore transfer learning techniques, and conduct testing and deployment in real-world settings to validate its effectiveness and reliability in practical applications.
Footnotes
Funding
This work was supported in part by the Research Projects for Provincial University (grant no.KY2022 059).