
Abstract
Logistics distribution is an indispensable part of the modern economy and is crucial for ensuring the efficient operation of the supply chain. With the continuous progress of technology, the application of intelligent scheduling systems in the field of logistics distribution is becoming increasingly widespread. Reinforcement learning, as one of the hot technologies in the field of artificial intelligence, is gradually receiving attention in its application in intelligent scheduling. Reinforcement learning can continuously learn and predict the same thing to enhance memory, while intelligent scheduling requires continuous prediction and optimization of logistics distribution paths. In response to the current problems of slow logistics distribution efficiency and low customer satisfaction, this article analyzed the application of intelligent scheduling in logistics distribution from the aspects of basic data maintenance, basic data review, intelligent scheduling, scheduling result review, distribution information management, and vehicle tracking. By using reinforcement learning, the traffic network weight in logistics distribution was studied to improve logistics distribution efficiency and customer satisfaction. This article analyzed the efficiency of logistics distribution, vehicle tracking accuracy, vehicle scheduling ability, and logistics distribution costs under different logistics distributions. The results showed that the logistics distribution under the integration of reinforcement learning and intelligent scheduling reduced 12.047 km compared to traditional distribution paths, and its distribution cost decreased by 129.718 yuan compared to traditional logistics distribution costs. The efficiency of logistics distribution that integrates reinforcement learning and intelligent scheduling has significantly improved, with optimized distribution costs and paths. It also has a positive effect on improving the utilization rate of logistics distribution vehicles.
Keywords
Introduction
In modern economy, logistics distribution is an important link connecting the supply chain, and its efficient operation is crucial for ensuring timely distribution of goods to the destination. It is related to the smooth delivery of goods from the production location to the destination. However, logistics distribution involves many complex factors, such as vehicle scheduling, path planning, traffic congestion, and cargo loading, and traditional intelligent scheduling methods are often difficult to efficiently cope with. In order to solve these problems, intelligent scheduling systems, as an innovative solution, have gradually become an inevitable choice for improving logistics distribution efficiency and optimizing costs. In logistics distribution, vehicle group managers aim to meet certain service needs and minimize their service costs. By reducing the total vehicle service cost, the distribution cost is reduced, and on the basis of improving vehicle distribution efficiency, the distribution benefits are maximized. Due to non-compliance with the specified time window within a certain time window, punishment can be imposed. The planning of distribution routes has become a relatively complex issue. Therefore, optimizing the allocation routes in the logistics system is a meaningful issue.
Logistics distribution is a complex process that requires analysis of optimization of distribution path selection and vehicle scheduling. Many scholars have analyzed logistics distribution. Guido Perboli found that in the past few decades, urban logistics distribution has attracted great interest from operations research and the logistics community. However, most examples are based on the generalization of classic examples and are typically not created for urban applications. To overcome these issues, he proposed a simulation optimization framework for constructing instances and evaluating operational settings [1]. Yangke Ding summarized the research and application of intelligent logistics based on the Internet of Things (IoT) in smart freight, warehousing, distribution, and other fields in recent years. He revealed the main technologies and impacts of intelligent logistics based on the Internet of Things and its industrial and geographical distribution research and application, showcased the challenges faced by intelligent logistics in the Internet of Things, and provided research needs for the development of intelligent logistics [2]. Riccardo Mangiaracina analyzed and classified relevant literature on innovative and efficiency oriented logistics solutions, providing direction for future research work. In terms of management, he proposed an overall framework of the main factors affecting logistics delivery costs, as well as feasible innovative solutions that can be implemented to improve distribution efficiency [3]. Ruomeng Cui explored the degree to which customers value high-quality delivery experiences when shopping online He found that removing the high-quality delivery option from the Alibaba retail platform resulted in a decrease in sales during the conflict period and an increase in the contribution of distribution to total sales, but did not affect the variety and logistics rating of the products sold [4]. Weihua Liu observed five major impacts of the epidemic on logistics distribution, namely a sharp decline in logistics demand, shortage of transportation capacity, disruption of logistics network, changes in service models, and an increase in operating costs and the number of loss-making enterprises. He also participated in a series of studies on the development trends, plans, and policies of China’s logistics industry [5]. There are still certain deficiencies in current research on logistics. Logistics distribution scheduling usually relies on manual decision-making, which is easily affected by subjective consciousness, experience limitations, and incomplete information.
Reinforcement learning and intelligent scheduling can improve the optimization of distribution paths by continuously predicting and calculating path conditions. Many scholars have analyzed the application of reinforcement learning and intelligent scheduling in logistics distribution. Chang Liu proposed an innovative logistics distribution scheduling model based on reinforcement learning, which utilized big data analysis, intelligent logistics management, and machine learning technologies [6]. Bing Chen found that many optimization problems in real life, including production and logistics issues, are uncertain and pose significant challenges to practitioners. He developed a new framework that leverages the short-term accuracy of mathematical models and high-quality future predictions from machine learning modules, discussing the advantages of the proposed method and the factors that need to be carefully considered in practical applications [7]. Arthur Cruz de Araujo introduced logistics distribution solutions under the IoT paradigm and discussed their feasibility as a smart city application based on reinforcement learning architecture, focusing on the large-scale package dataset provided by Canada Post [8]. Chun-Cheng Lin discovered that manufacturing involves complex workshop logistics and distribution issues. He proposed an intelligent manufacturing factory framework based on edge computing, and further studied the server web page under this framework [9]. Nilay Noyan discussed and addressed the main computational challenges in current logistics distribution, and outlined various settings that lead to reinforcement learning being able to handle formulas. He relied on the latest modeling techniques from machine scheduling and humanitarian logistics to achieve potential practical applications, and proposed numerical research for a new type of risk avoidance scheduling problem with controllable processing time [10]. The above studies have all elaborated on the application of reinforcement learning and intelligent scheduling in logistics distribution, but have not analyzed the optimization of logistics distribution paths.
Logistics distribution mainly involves moving from one warehouse to another, and it is necessary to provide customers with accurate distribution times to meet their various requirements. To study the specific effects of integrating reinforcement learning and intelligent scheduling in logistics distribution, this article analyzed the predicted values and cost functions of logistics distribution through reinforcement learning to obtain traffic network weights, and judged the specific effects of logistics distribution under the fusion method based on their weight values. In the experimental section, this article analyzed the on-time distribution times and delayed distribution times of logistics distribution to calculate the logistics distribution effect under the new logistics distribution. It was found that logistics distribution integrating reinforcement learning and intelligent scheduling could improve the distribution efficiency of logistics and achieve reasonable and efficient logistics distribution. Therefore, utilizing fusion reinforcement learning and intelligent scheduling to optimize logistics distribution has important research significance.
Application of intelligent scheduling in logistics distribution
Intelligent scheduling mainly involves intelligently scheduling orders based on relevant information such as commodity vehicles and barge trucks [11]. This article mainly studies it from the following aspects. Firstly, the maintenance of basic data is analyzed, and then the basic data is reviewed. According to the order, vehicles are planned, or vehicles that match the corresponding order are selected for transportation. Finally, the implementation of the plan is reviewed, and the management of logistics information and tracking of logistics vehicles are carried out. The application analysis of intelligent scheduling in logistics distribution is shown in Fig. 1.
Application analysis of intelligent scheduling in logistics distribution.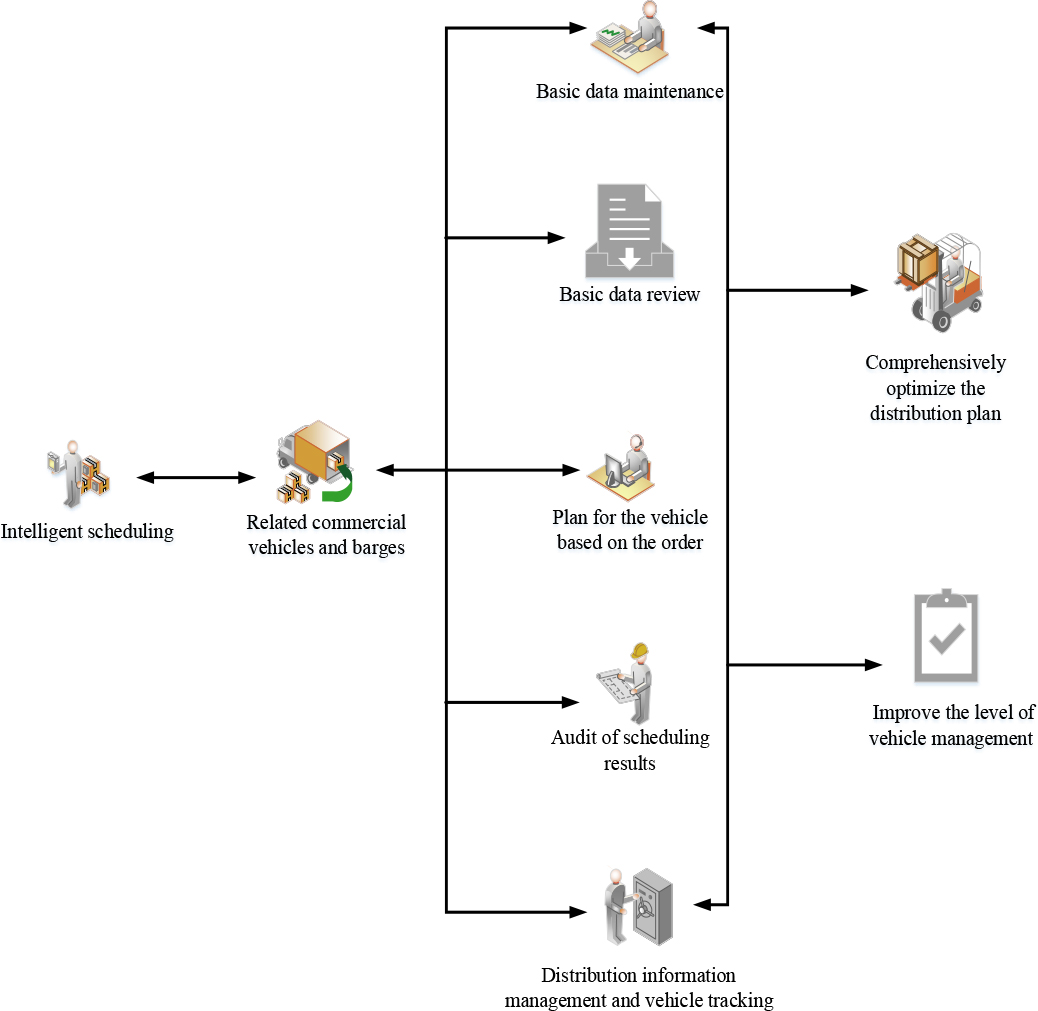
The first is basic data maintenance. The basic data maintenance in this article mainly focuses on four aspects: transportation capacity data, loading structure of barge trucks, monthly planned allocation, and special area maintenance. The maintenance of basic data for distribution in this article has the ability to input and output, as well as the corresponding format. The maintenance of transportation capacity data mainly involves maintaining the daily submitted transportation capacity information, including the vehicle number, model, intended direction, transportation company, and so on. The maintenance of the loading structure of lighterage trucks involves the maintenance of the structure of lighterage trucks carrying goods, including the types of lighterage trucks, the assembly methods of goods vehicles, and other related contents [12]. Maintenance is calculated on a company by company basis, arranging the monthly allocation of transportation capacity by transportation enterprises. Maintenance information includes the province and city where it is located, the enterprise responsible for transportation, and the ratio. Special area maintenance is used to maintain special logistics areas, while vacancy subsidy maintenance is used to provide subsidy information for vacant seats on lighterage vehicles.
The second is the review of basic data. After maintaining the basic data, the application review is submitted. The basic data review is manually processed and submitted after the review is completed. Only after the data has changed, it becomes valid data. Order information query mainly involves querying the order number, issuance date, order type, and order status. The scheduling information query mainly queries the scheduling table information in the scheduling table, which can be queried based on order number, order status, transportation vehicle information, distribution vehicle information, shipment time, departure time, arrival time, and other information.
The third is intelligent scheduling. Intelligent scheduling is used to schedule designated commodity vehicles. According to the transportation requirements of transportation vehicles, transportation vehicles and their types are selected, and transportation vehicles that meet the requirements are automatically selected to achieve intelligent transportation of transportation vehicles. The optimal intelligent transportation results obtained are displayed on the screen, and the transportation vehicles are assigned to the designated barges. The specific operation process of intelligent scheduling in this article is: querying the information of available transportation vehicles in the departure warehouse
The fourth is the review of scheduling results. The audit of scheduling results mainly involves reviewing the scheduling results and issuing scheduling commands [13]. The operation process verifies the scheduling within this time range at the planned start time and planned end time. The result review mainly checks whether the latest scheduled time of the order is later than the scheduled time. The ratio between the number of containers loaded in this batch and the number of containers loaded in this batch is calculated. Whether the departure destination and departure destination of the batch of scheduled vehicles are consistent with the departure destination and departure destination listed on the dispatch sheet is confirmed. Vehicle waiting time is calculated. Based on the results of the plan, the corresponding benefits are calculated.
The fifth is distribution information management and vehicle tracking. In the intelligent planning of new distribution management, comprehensive database management, centralized customer resource management, transportation information, human resource information, order information, and basic data management are all necessary functions. Electronic map maintenance and road information management functions are provided. The status of vehicles and goods is queried in real-time, and schedules are comprehensively created and managed to achieve automated system planning, automatic generation of plans for loading vehicles, optimization of delivery routes, and automatic generation of distribution routes. Under intelligent scheduling, optimization is carried out by combining road routes or real-time traffic conditions. The monitoring center guides the actual route of vehicles, and vehicle information is sent to the monitoring center in real time to optimize distribution routes [14].
Application of reinforcement learning in logistics distribution
In logistics distribution, it is necessary to consider traffic conditions and the choice of routes. The transportation situation is also affected by factors such as weather, road construction, holidays, and rush hours, all of which affect the efficiency of logistics distribution. Therefore, this article uses reinforcement learning to analyze the impact value of weather, dividing it into four warning levels according to the level, to remind logistics distribution personnel that the specific weather impact value on normal working days is:
Among them,
Design based on attention mechanism is a policy network model composed of multiple agent networks. Train using reinforcement learning algorithms to obtain models that can be quickly solved [15]. Next, reinforcement learning is utilized to mediate the weight parameters in the logistics distribution impact model, and the specific solution process is as follows:
Among them,
This type of label represents the proxy value of 6 road segments output in the logistics distribution model, and Formula (5) is the estimated probability of the model. According to the class label and estimated probability, the prediction function for logistics distribution can be obtained as follows:
Among them,
The final weight of the transportation network for logistics distribution is:
Among them, d is the length of the logistics distribution section, and
This article combines reinforcement learning to analyze logistics distribution under intelligent scheduling, and investigates the logistics distribution predicted values and traffic network weights of 20 logistics distribution vehicles under different road conditions. Among them, the peak value of the predicted value is 1, with 0–0.6 indicating poor prediction, 0.61–0.80 indicating average prediction, and 0.81–1 indicating excellent prediction. The peak weight of the transportation network is 2. The larger the weight, the greater the impact of the transportation network. The specific survey results are shown in Table 1.
Predicted values of logistics distribution and analysis of traffic network weights
According to Table 1, the predicted logistics distribution values during normal working days range from 0.6 to 0.87, with an average of 0.74, indicating that the predicted values are average. During holidays, the predicted logistics distribution values range from 0.61 to 0.86, with an average of 0.72, a decrease of 0.02 compared to normal working days. The main reason is that during holidays, there is a large flow of people and vehicles, which makes it difficult to accurately judge the specific conditions of roads, resulting in certain deficiencies in the prediction and selection of logistics distribution routes. The average weight of the transportation network during normal working days is 1.75, and the average weight of the transportation network during holidays is 1.77, an increase of 0.02 compared to normal work. This indicates that unforeseeable factors during holidays can easily paralyze transportation due to increased passenger flow, affecting the efficiency of logistics distribution.
Optimization of logistics distribution paths
During the delivery process, a path optimization model is adopted to optimize the path [16]. Based on transit vehicle information and mid-term distribution information, intelligent vehicle planning is carried out to support the company’s supply management decisions to improve delivery efficiency and customer satisfaction, reduce distribution costs, and enhance the company’s overall competitiveness. Intelligent scheduling mainly integrates a series of activities such as delivery and planning into the distribution center, and has many additional decision-making functions such as basic information management, routing optimization, network request transmission, and task management. The optimization of logistics distribution paths is shown in Fig. 2.
Optimization of logistics distribution path.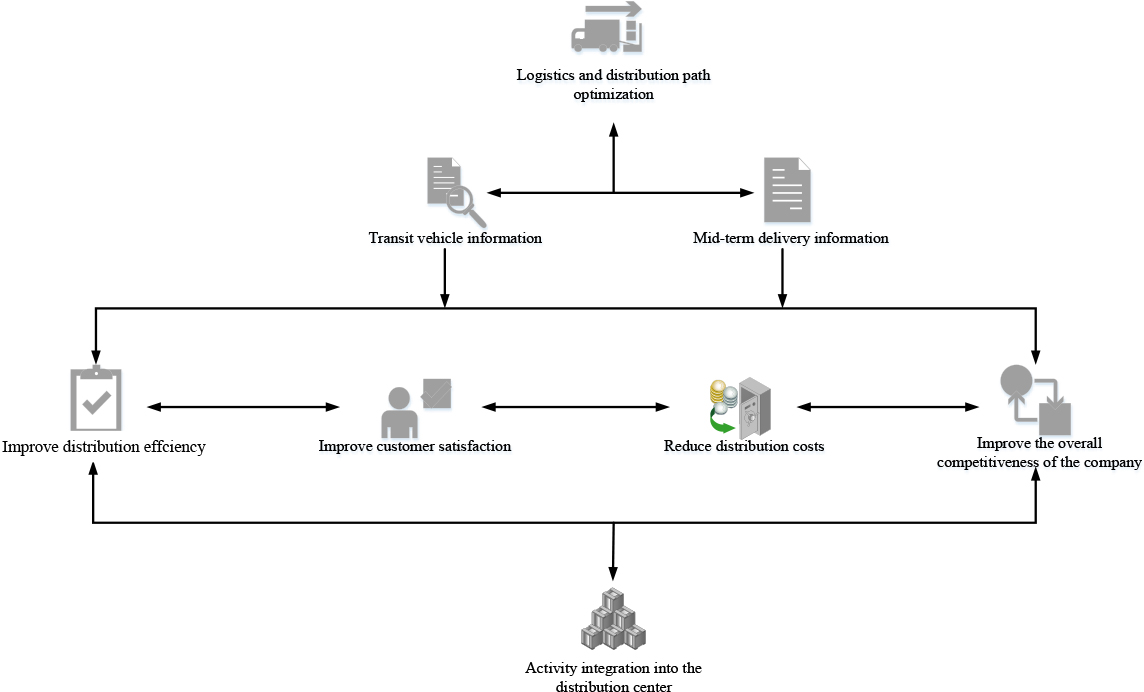
Path optimization algorithms and analytical database management methods are utilized to achieve path optimization. Based on real-time positioning and other technologies, the system database can construct vehicle logistics and distribution planning models and vehicle path optimization models in the model library. From the comprehensive database and advanced learning and intelligent program model library, basic information is collected and stored, and processed and analyzed. Users can view the vehicles or allocation data of the distribution center through the human-machine interface, add or remove feedback data from charts or reports to help make decisions. Not only can they plan vehicles to optimize routes, but they can also find and track delivery vehicles in real-time.
The scheduling of distribution includes departure planning and in transit scheduling before the task begins. For different distribution tasks, distribution vehicles are reasonably dispatched and the distribution path process is planned. Real time location technology is utilized in distribution to achieve bidirectional information transmission. When there are system errors, temporary cancellations of orders by users, or returns by users, the dispatch center makes corresponding adjustments to the in transit distribution vehicles to avoid duplicate shipments. At the same time, if vehicles on the way are damaged or encounter traffic congestion, maintenance support can also be requested from the dispatch center. On this basis, the system’s human-computer interaction interface is utilized to achieve precise positioning of vehicles and display them on a map [17].
Historical data tracking is based on process data such as order data, distribution order data, scheduling table data, and route order data in the system database, and predicts the possible completion time of tasks. By combining positioning and other technologies, real-time positioning, tracking, communication and other monitoring of vehicles can be carried out, thereby improving the remote management level of vehicles. At the same time, users can also timely understand the transportation and in transit status of goods through the information network. By establishing a distribution model, a reliable decision-making basis is provided for the formulation of distribution plans. A vehicle routing model and a reinforcement learning algorithm are utilized to optimize distribution routes, thereby improving the distribution management capabilities of enterprises, reducing distribution costs, and improving distribution efficiency while meeting user requirements [18].
Logistics vehicle distribution experiment integrating reinforcement learning and intelligent scheduling
The logistics distribution after integrating reinforcement learning and intelligent scheduling can be analyzed based on indicators such as vehicle distribution efficiency, on-time distribution rate, and route optimization rate to determine the specific effectiveness of logistics distribution [19, 20].
On-time distribution times and delayed distribution times for logistics vehicle distribution
This article investigated the on-time and delayed distribution times of 20 logistics vehicles within two days. Each vehicle received 50 distribution tasks per day, with the same distribution distance. The specific survey results are shown in Table 2.
Analysis of distribution times for logistics vehicle distribution
Analysis of distribution times for logistics vehicle distribution
According to Table 2, in the first day of logistics distribution, the on-time distribution frequency of 20 vehicles ranged from 45 to 50, and the delayed distribution frequency ranged from 0 to 5. Among them, vehicle 16 had the highest number of on-time distributions, with all tasks completed on time, and vehicles 2, 10, 11, 14, and 15 had the lowest number of on-time distributions. On the second day of logistics distribution, the on-time distribution frequency of 20 vehicles ranged from 46 to 50, and the delayed distribution frequency ranged from 0 to 4. Through comparison, it can be seen that there are more on-time distributions on the second day, indicating that the distribution effect on the second day is good and the goods can be successfully delivered within the specified time.
The above survey investigated the on-time and late distribution times of 20 logistics vehicles over a two-day period. For the sake of breadth and rationality of the experiment, the investigation of on-time and delayed distribution times of 20 logistics vehicles on the 10th and 30th days was continued. The specific findings are shown in Table 3.
Analysis of distribution times for logistics vehicle distribution
According to Table 3, on the 10th day of logistics delivery, the frequency of on-time deliveries for the 20 vehicles ranged from 47 to 50, and the frequency of delayed deliveries ranged from 0 to 3. The frequency of on-time deliveries for vehicle 16 was the highest, and the frequency of delayed deliveries was the lowest. In the 30th day of logistics distribution, the frequency of on-time delivery of 20 vehicles is between 49 and 50 times, and the frequency of delayed delivery is between 0 and 1 time. It can be seen from the comparison that the number of on-time delivery on the 30th day is higher, which means that the distribution on the 30th day is the most effective, and the goods can be delivered smoothly within the stipulated time.
Next, based on the number of on-time and delayed distributions in these two days, the on-time distribution rate and distribution delay rate were calculated, and the specific effects of logistics distribution under the combination of reinforcement learning and intelligent scheduling were analyzed based on the changes in these two rates. The specific investigation is shown in Fig. 3.
Analysis of on-time and delay rates of vehicle distribution within two days. A: Analysis of on-time distribution rate of vehicle distribution within two days; B: Analysis of distribution delay rate for vehicle distribution within two days. 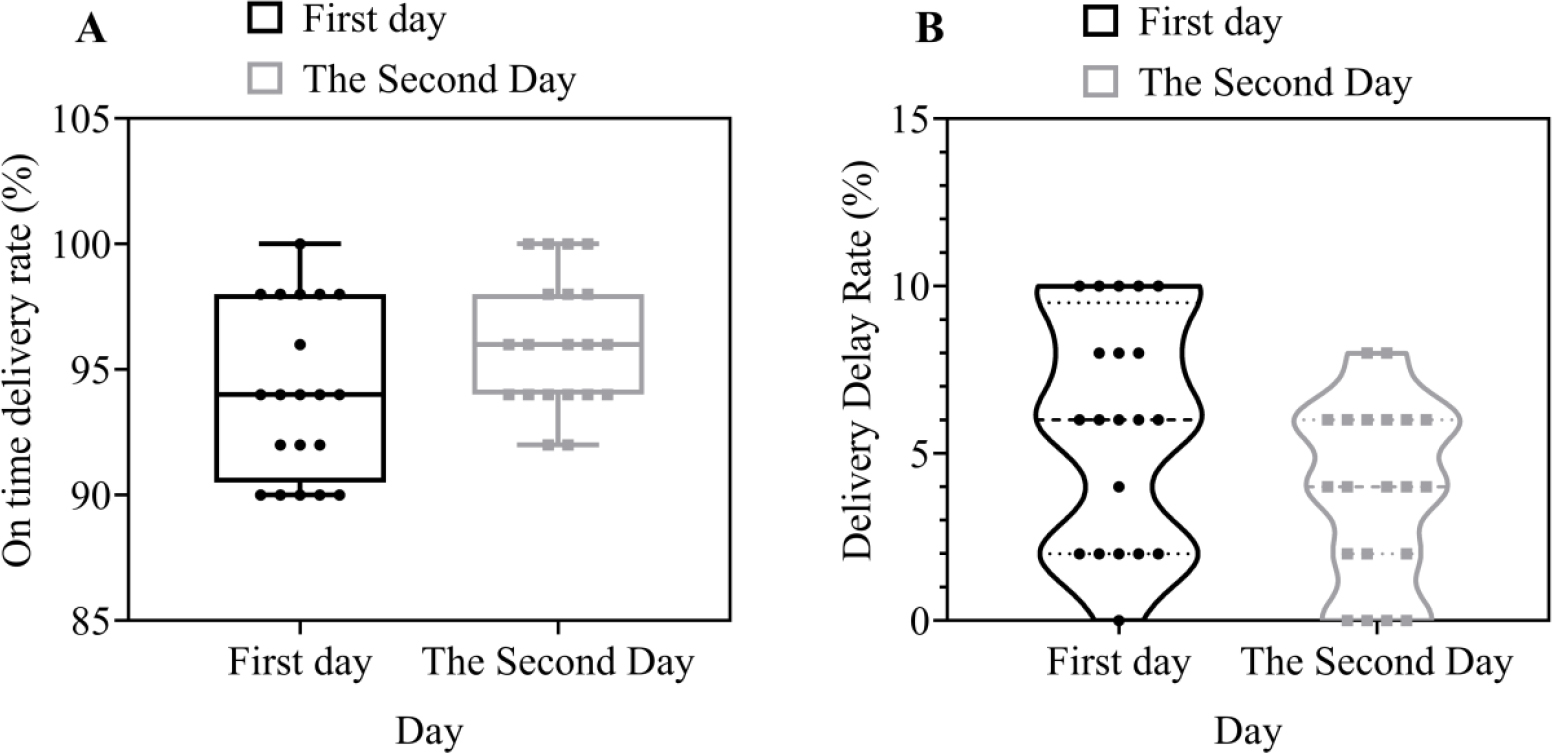
Figure 3A shows the on time distribution rate analysis of vehicle distribution within two days. Among them, the x-axis represents the number of days, and the y-axis represents the on-time distribution rate. Figure 3B shows the analysis of distribution delay rate for vehicle distribution within two days, where the x-axis represents the number of days and the y-axis represents the distribution delay rate. In the analysis of distribution on time rate, it can be seen that the on-time distribution rate of 20 vehicles on the first day was between 90.0% and 100%, and the on-time distribution rate on the second day was between 92.0% and 100%. The average on-time distribution rate on the second day was 96.1%, an increase of 2% compared to the first day. The main reasons for this situation are relatively congested road traffic, poor weather, and the low on-time distribution rate caused by the overlap of logistics vehicle distribution time with the rush hour. In the analysis of distribution delay rate, it can be seen that the average logistics distribution delay rate on the first day was 5.9%, and the average logistics distribution delay rate on the second day was 3.9%, with a difference of 2%.
The on-time delivery rate and delivery delay rate were also calculated based on the number of on-time deliveries and delayed deliveries on the 10th and 30th day of the survey as shown in Fig. 4.
Analysis of on-time and delay rates of vehicle distribution on day 10 and day 30. A: Analysis of on-time distribution rate of vehicle distribution on day 10 and day 30; B: Analysis of distribution delay rate for vehicle distribution on day 10 and day 30. 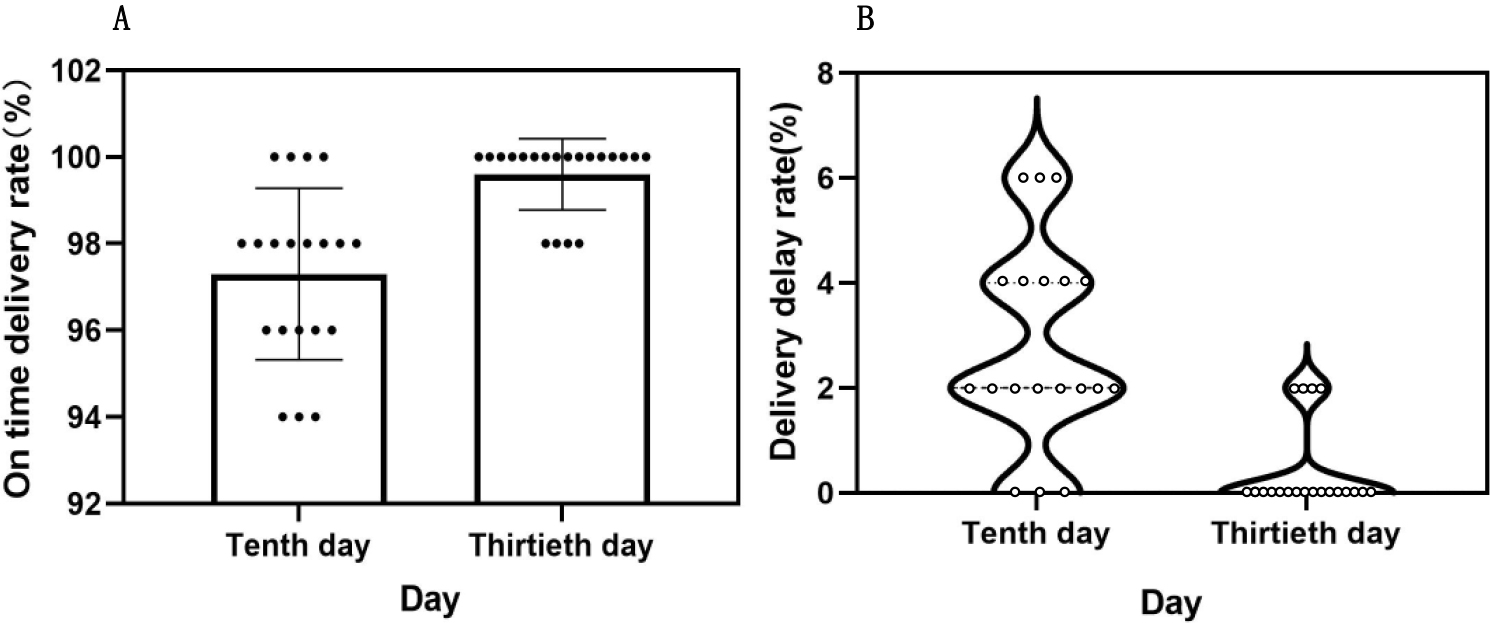
As can be seen in Fig. 4A, the on-time delivery of the 20 vehicles on day 10 ranged from 94% to 100% and on-time delivery on day 30 ranged from 98% to 100%. The average on-time rate for day 30 was 99.6%, which is 2.3% higher than day 10. The analysis of the distribution delay rate shows that the average logistics and distribution delay rate on day 10 was 2.7% and the average logistics and distribution delay rate on day 30 was 0.4%, a difference of 2.3%.
After integrating reinforcement learning and intelligent scheduling, logistics distribution can deliver goods within the specified time. For goods with high timeliness requirements, this method can improve distribution efficiency and meet customer needs [21].
In logistics distribution, the distribution efficiency and distribution time of vehicles are also particularly important. Therefore, this paper investigates the distribution time of vehicles under 10 distribution tasks by dividing the 20 vehicles listed in Table 2 into three categories according to the volume of the vehicle: small, medium, and large, and the distribution distance of each category is 5 kilometers. The time spent by each type of vehicle under different distribution tasks was calculated separately. The specific findings are shown in Fig. 5.
Distribution time analysis of vehicles under different distribution tasks. A: Completion time for different distribution tasks of three types of vehicles; B: Mean and standard deviation analysis of the completion time of distribution tasks for the three types of vehicles. 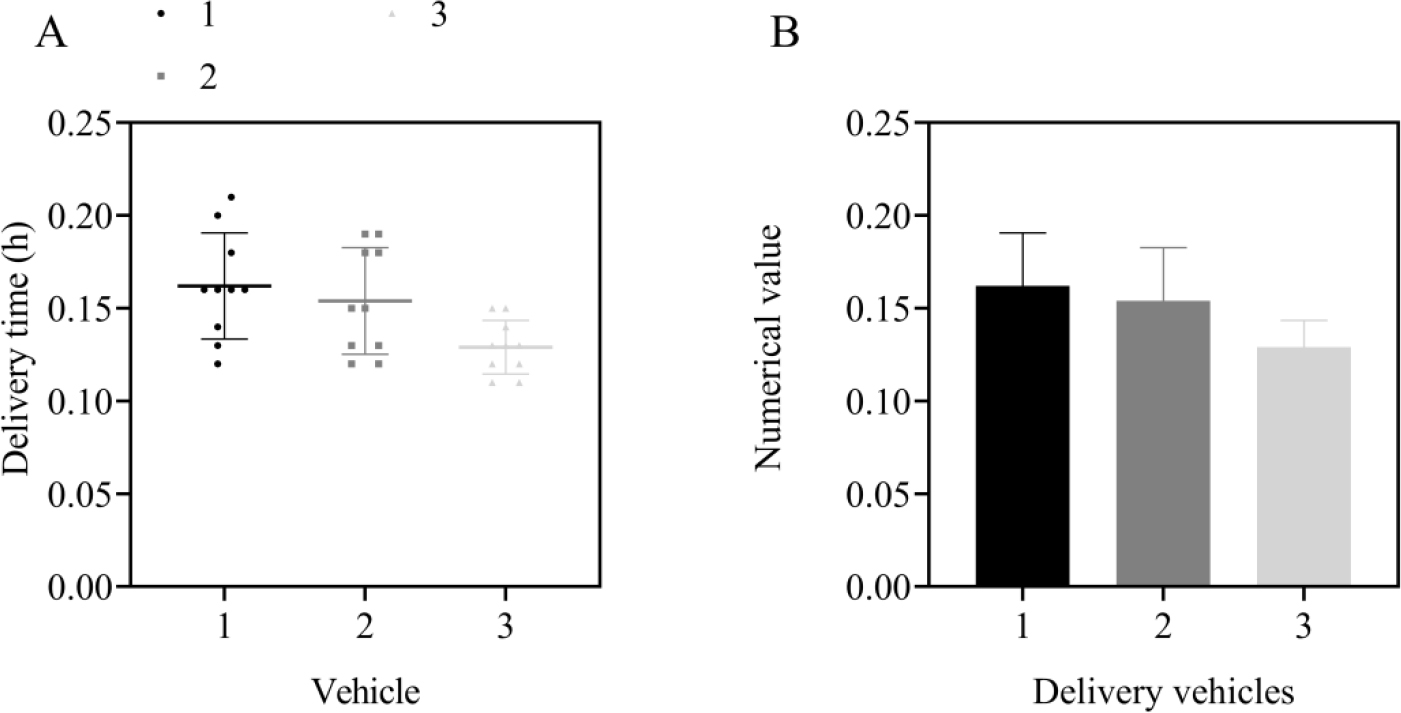
Figure 5A shows the completion time of different delivery tasks for the three types of vehicles, X-axis represents the delivery vehicle and Y-axis represents the delivery time. Figure 5B shows the mean and standard deviation analysis of the completion time of different delivery tasks for the three types of vehicles, where the X-axis represents the delivery vehicles and the Y-axis represents the values. In the analysis of vehicle delivery completion time under different types of vehicle delivery tasks, it can be seen that the delivery time of Vehicle 1 is in the range of 0.12 h to 0.21 h; the distribution time of vehicle 2 was between 0.12 h and 0.19 h; the distribution time of vehicle 3 was between 0.11 h and 0.15 h. Among them, the distribution time of vehicle 3 was relatively concentrated and short, indicating that vehicle 3 had good distribution efficiency.
In the analysis of the mean and standard deviation of vehicle task completion time under different distribution tasks, it can be seen that the average distribution time of vehicle 1 was 0.162 hours, with a standard deviation of 0.027; the average distribution time of vehicle 2 was 0.154 hours, with a standard deviation of 0.027; the average distribution time of vehicle 3 was 0.129 hours, with a standard deviation of 0.014. From this, it can be seen that under the integration of reinforcement learning and intelligent scheduling, the average distribution time and standard deviation of vehicle 3 were minimized, with high stability, which can improve the efficiency of logistics distribution and shorten logistics distribution time.
The efficiency of vehicle distribution in logistics distribution can measure the speed and quantity of task completion of vehicles, and the vehicle utilization process also measures the efficiency of vehicle utilization in distribution tasks [22]. For this purpose, this article investigated ten logistics distribution companies, investigating their distribution efficiency and vehicle utilization when distributed 100 distribution tasks, and comparing them with traditional logistics distribution. The specific investigation results are shown in Fig. 6.
Analysis of logistics vehicle distribution efficiency and vehicle utilization under different methods. A: Analysis of distribution efficiency and vehicle utilization of traditional logistics distribution. B: Analysis of logistics distribution efficiency and vehicle utilization by integrating reinforcement learning and intelligent scheduling.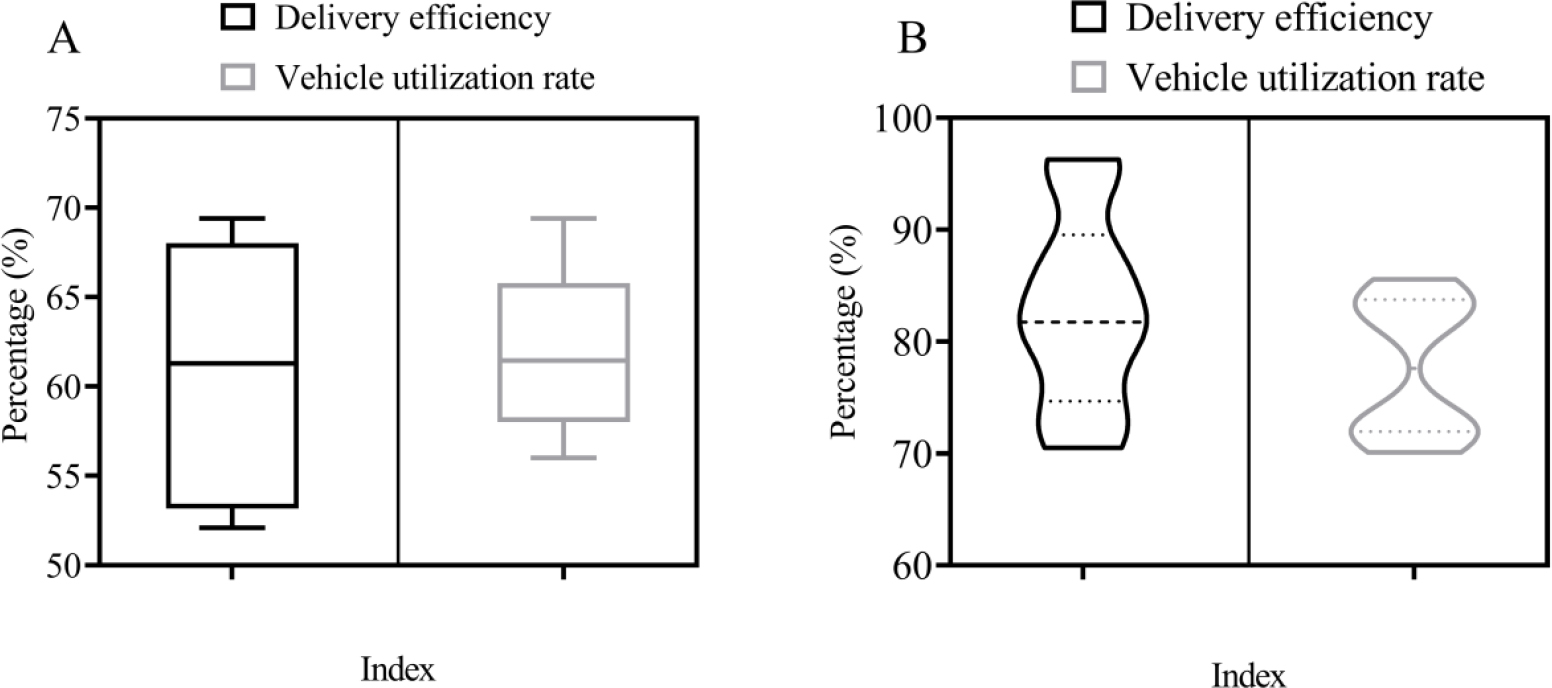
Figure 6A shows the distribution efficiency and vehicle utilization analysis of traditional logistics distribution. Figure 6B shows the analysis of logistics distribution efficiency and vehicle utilization using reinforcement learning and intelligent scheduling, where the x-axis represents the distribution enterprise and the y-axis represents the percentage.
In the analysis of traditional logistics distribution efficiency and vehicle utilization, the distribution company 10 had the highest distribution efficiency, with a value of 69.40%; the distribution company 2 had the highest vehicle utilization rate, with a value of 69.40%. Overall, the average efficiency of traditional logistics distribution was 60.94%, and the average vehicle utilization rate was 62.09%. In the analysis of the distribution efficiency and vehicle utilization rate by integrating reinforcement learning and intelligent scheduling, the distribution efficiency ranged from 70.50% to 96.30%, and the vehicle utilization rate ranged from 70.10% to 85.60%. Through comparison, it can be seen that the vehicle distribution efficiency under the integration of reinforcement learning and intelligent scheduling increased by 21.76% compared to traditional distribution efficiency, and the vehicle utilization rate increased by 15.60% compared to traditional vehicle utilization rate. It can be seen that reinforcement learning and intelligent scheduling can improve the coordination and scheduling ability between distribution vehicles, ensure that vehicles can be fully utilized in distribution, and improve the distribution efficiency of logistics vehicles.
The optimization of path selection and distribution cost is crucial in logistics distribution. Therefore, this paper analyzes the logistics distribution path and distribution cost under different methods, and the experiment takes Area M as the distribution range, and the starting point and end point of distribution are kept the same. In order to avoid the influence of external environmental factors, we randomly choose the same day to study the distribution paths of the two vehicles under these 10 tasks and the distribution costs required for traveling under this distribution path, and take the average value as the research data of this paper.The specific investigation results are shown in Figs 7 and 8.
Analysis of distribution paths under different logistics distributions. A: The distribution path of traditional logistics distribution. B: The distribution path integrating reinforcement learning and intelligent scheduling. 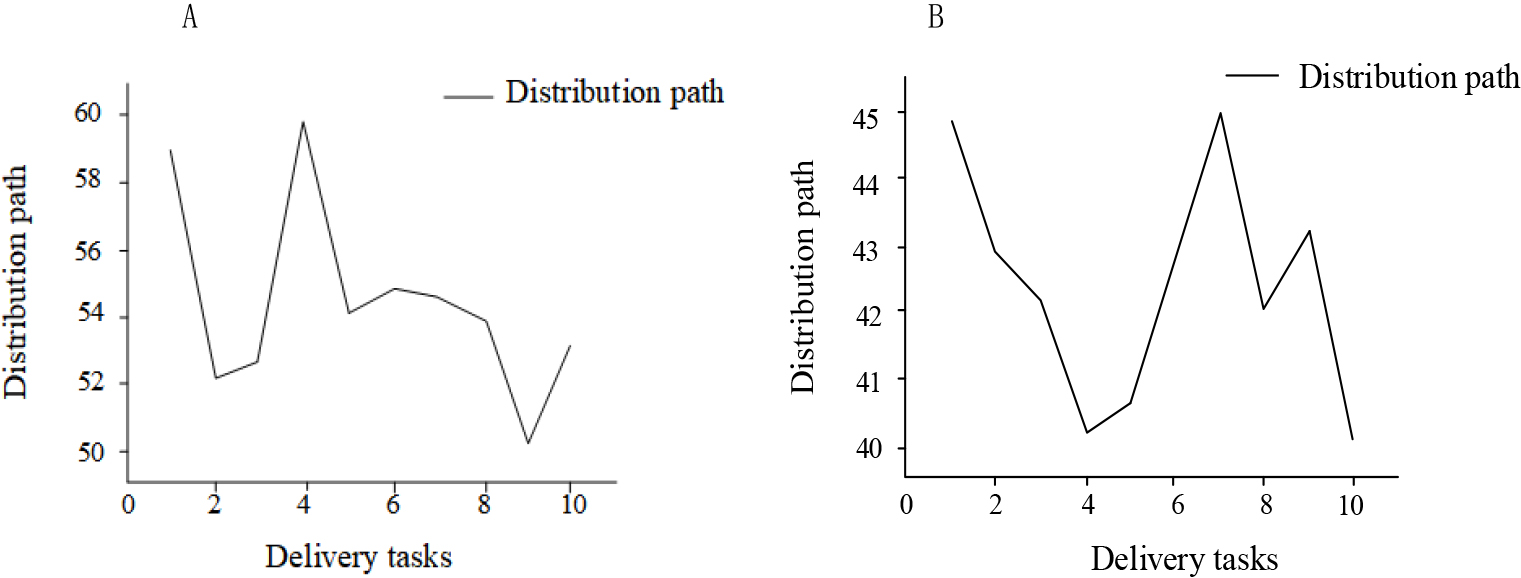
Analysis of distribution costs under different logistics distributions. a: The distribution cost of traditional logistics distribution. b: The distribution costs integrating reinforcement learning and intelligent scheduling. 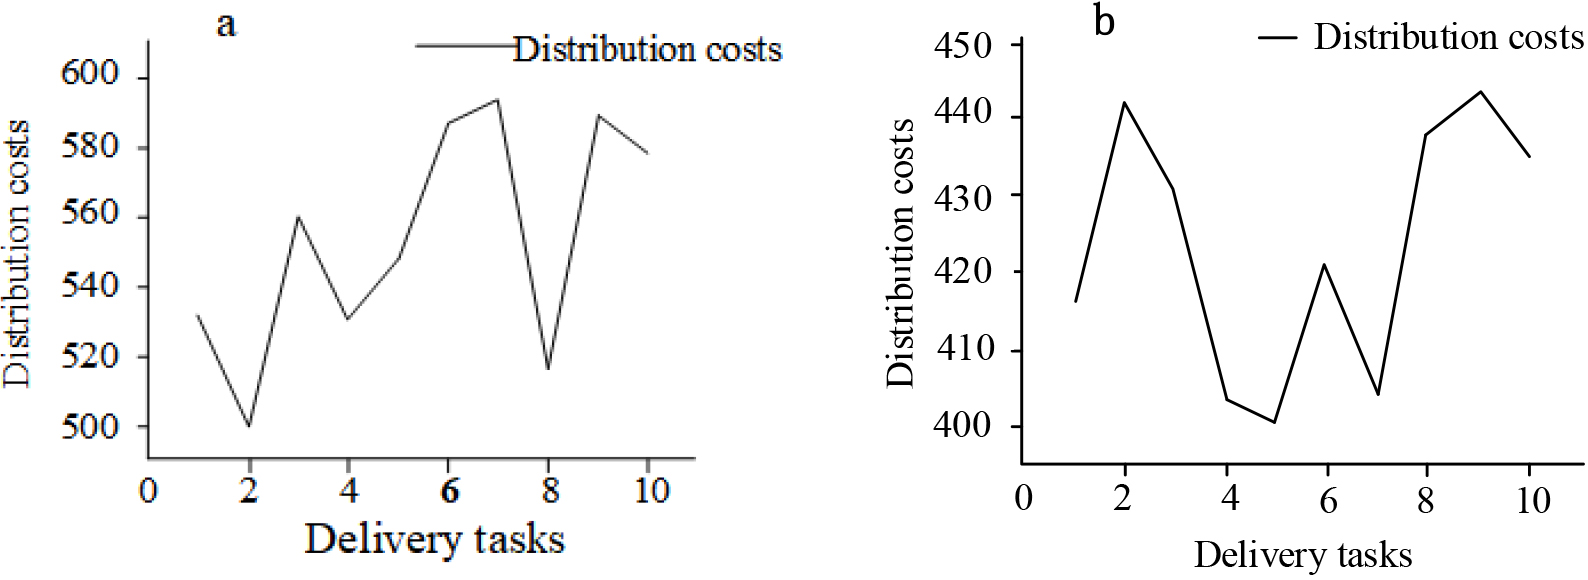
Figure 7A shows the distribution path of traditional logistics distribution, where the x-axis represents the distribution task and the y-axis represents the distribution path. Figure 7B shows a distribution path that integrates reinforcement learning and intelligent scheduling, where the x-axis represents the distribution task and the y-axis represents the distribution path. Figure 8a shows the distribution cost of traditional logistics distribution, where the x-axis represents the distribution task and the y-axis represents the distribution cost. Figure 8b shows the distribution cost of integrating reinforcement learning and intelligent scheduling, where the x-axis represents the distribution task and the y-axis represents the distribution cost.
In traditional logistics distribution, the distribution path ranged from 50.29 to 59.9 km, with an average of 54.451 km. The distribution cost ranged from 500.93 to 593.09 yuan, with an average of 553.199 yuan. In the integrated reinforcement learning and intelligent scheduling of logistics distribution, the average distribution path was 42.404 km, which was 12.047 km lower than traditional distribution paths. The average distribution cost was 423.481 yuan, which was 129.718 yuan lower than traditional logistics distribution costs. From this, it can be seen that under the integration of reinforcement learning and intelligent scheduling, logistics distribution vehicles can choose shorter distribution plans through intelligent calculation and scheduling, in order to save logistics distribution costs and improve logistics distribution efficiency. Moreover, in this model, logistics vehicles can also predict potential congested distribution routes in advance according to the instructions of the intelligent dispatch center, in order to change the distribution routes in a timely manner and improve the transportation efficiency of logistics vehicles.
This article also analyzed the vehicle tracking accuracy and scheduling ability of traditional logistics distribution and logistics distribution that integrates reinforcement learning and intelligent scheduling. A total of 10 distribution tasks were tested for the data of the scheduling center on vehicle tracking accuracy and scheduling ability. Among them, the peaks of both were 1. 0.6–0.8 is qualified, and 0.81–1 is excellent. The specific investigation results are shown in Fig. 9.
Analysis of vehicle tracking accuracy and vehicle scheduling ability of different logistics distribution vehicles. A: Analysis of tracking accuracy of different logistics distribution vehicles. B: Analysis of scheduling ability of different logistics distribution vehicles. 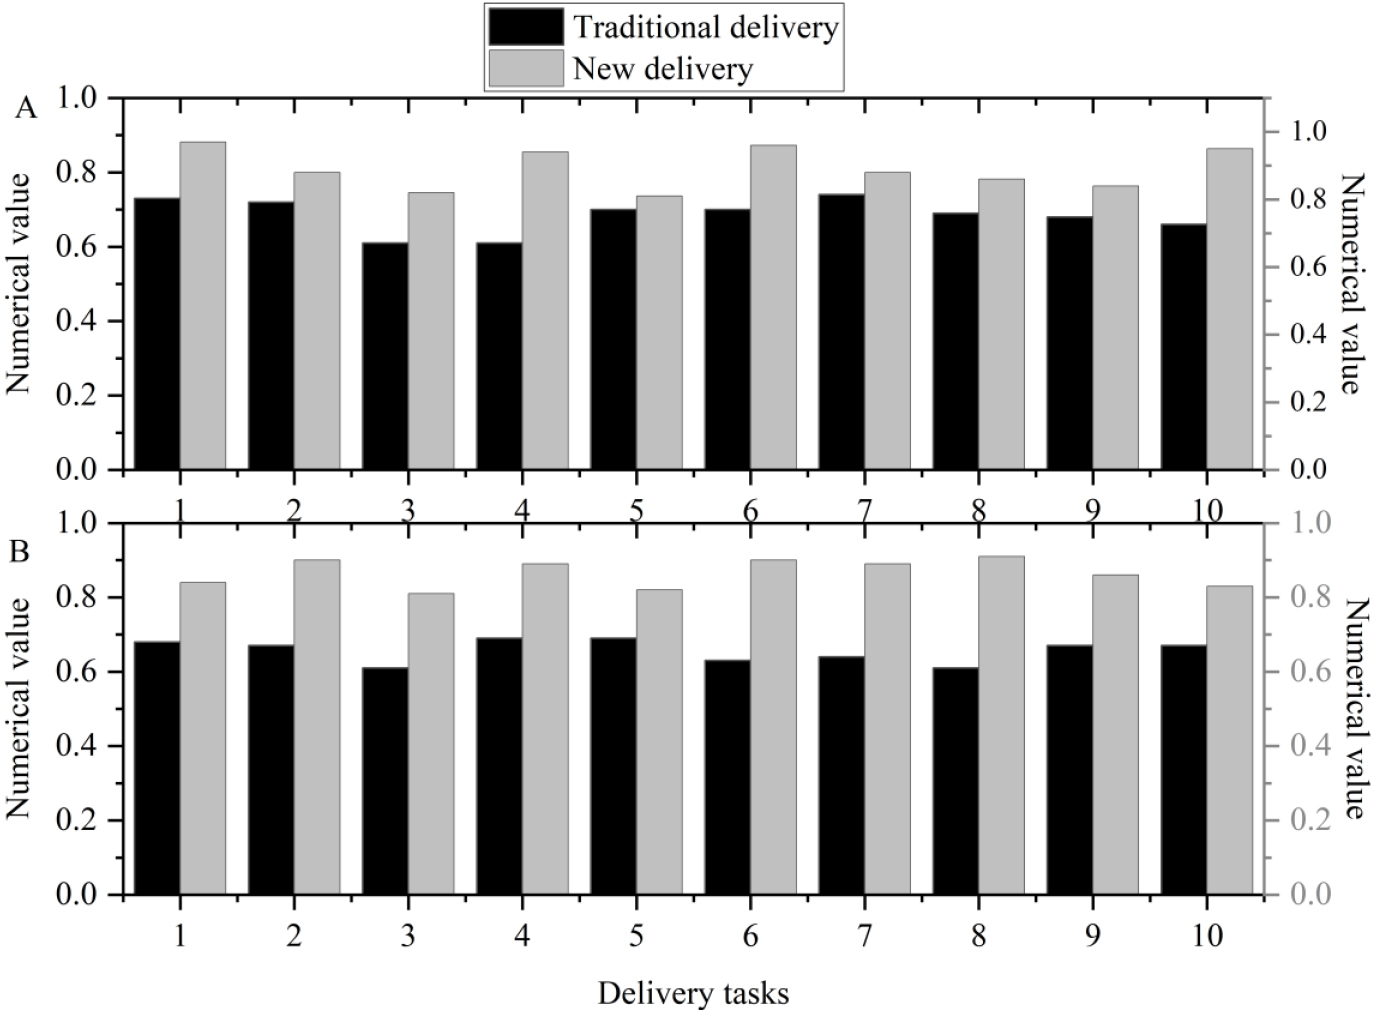
Figure 9A shows the tracking accuracy analysis of different logistics distribution vehicles, and Fig. 9B shows the scheduling ability analysis of different logistics distribution vehicles. Among them, the x-axis represents the distribution task, and the left y-axis and right y-axis represent numerical values.
In the analysis of tracking accuracy of different logistics distribution vehicles, the tracking accuracy of traditional logistics distribution vehicles was lower than that of new logistics distribution vehicles. Among them, the average tracking accuracy of traditional logistics distribution vehicles was 0.684, and the average tracking accuracy of new logistics distribution vehicles was 0.891, which was 0.207 higher than traditional logistics distribution. From this, it can be seen that logistics distribution, which integrates reinforcement learning and intelligent scheduling, can track and locate logistics vehicles through real-time positioning and tracking technology, making it easy for users to view the status of logistics distribution in real time and improve the transaction rate of goods. Moreover, real-time positioning can also help users choose appropriate distribution paths based on the current distribution road conditions, thereby improving distribution efficiency.
In the analysis of vehicle scheduling ability under different logistics distribution modes, the vehicle scheduling ability of logistics distribution that integrates reinforcement learning and intelligent scheduling increased by 0.209 compared to traditional logistics distribution. The main reason is that reinforcement learning algorithms can select suitable distribution routes based on weather and real-time traffic conditions. Based on the operational status of vehicles, timely scheduling of distribution routes that may be delayed can be carried out to assist logistics vehicles in distribution and improve the on-time distribution rate. Additionally, real-time positioning monitoring can be used to automatically distribute distribution tasks to vehicles closer to each other, thereby improving overall distribution efficiency.
This article ultimately conducted a relevant analysis on the stability of vehicle distribution and the rationality of route planning in logistics distribution, and tested a total of 15 logistics distribution tasks. Among them, the evaluation of distribution stability and route planning reliability adopted the form of vehicle driver scoring. A total of 3 vehicle drivers were surveyed, with a peak of 5 for both indicators. The average score of three vehicle drivers was taken as the experimental data for this experiment, and their score of 4 or above was considered excellent. The specific investigation results are shown in Table 4.
Reliability analysis of logistics distribution stability and route planning
Reliability analysis of logistics distribution stability and route planning
According to Table 4, in the evaluation of distribution stability, the average score of vehicle driver 1 was 4.49; the average score of vehicle driver 2 was 4.42; the average score of vehicle driver 3 was 4.46. The overall average score for distribution stability was 4.46, which was considered excellent. It can be seen that the integration of reinforcement learning and intelligent scheduling has made logistics distribution more stable, without causing delays in logistics distribution due to individual factors. In the analysis of route planning reliability, the average overall score of the three vehicle drivers was 4.64, which was considered excellent. Therefore, reinforcement learning and intelligent scheduling have a positive role in improving the rationality of logistics distribution route planning, which to some extent promotes the improvement of logistics distribution efficiency.
This article verified the specific effectiveness of intelligent scheduling and reinforcement learning in logistics distribution by investigating and analyzing the historical trajectory query effect of logistics distribution vehicles and analyzing order data. This article analyzed the historical trajectory query effect and order data collection ability of logistics distribution vehicles under two different modes. Among them, a total of 15 logistics distribution vehicles were tested, and the peak values of both indicators were 1. The specific investigation results are shown in Fig. 10.
Historical trajectory query effect and order data collection analysis under different distribution methods. A: Historical trajectory query effects under different distribution methods. B: Order data collection analysis under different distribution methods.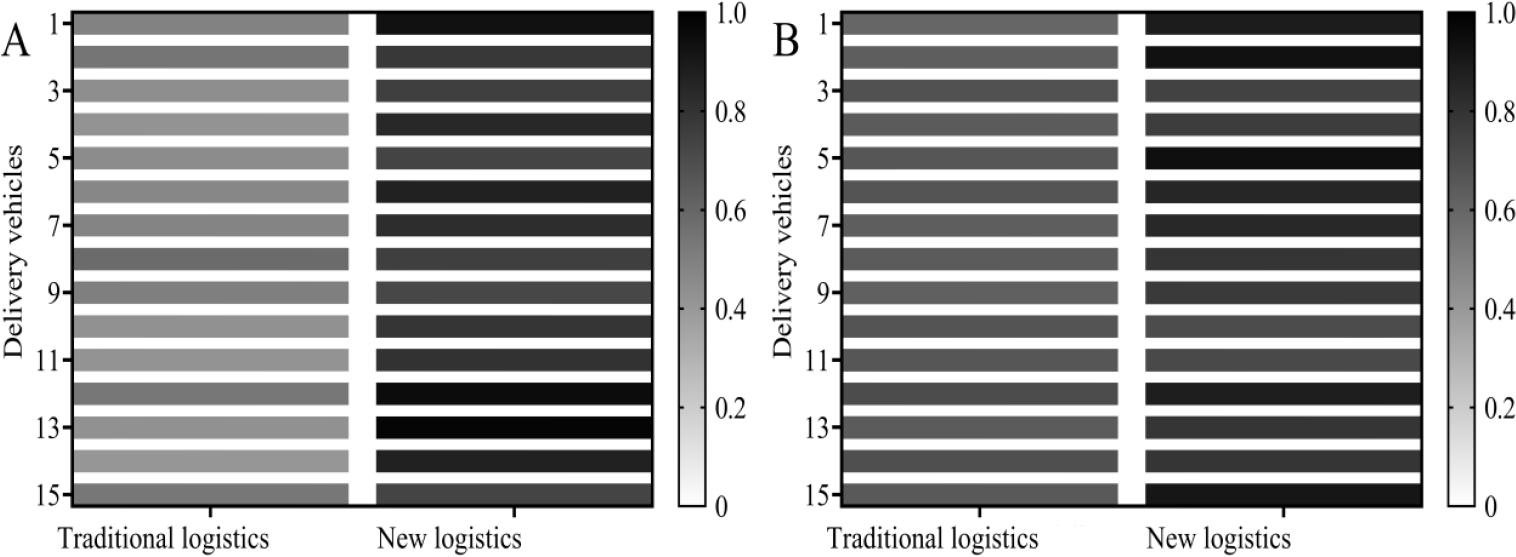
Figure 10A shows the historical trajectory query results under different distribution methods, while Fig. 10B shows the order data collection analysis under different distribution methods. Among them, the horizontal axis represents the distribution method, and the vertical axis represents logistics vehicles. In the analysis of the historical trajectory query effect, the historical trajectory query effect of traditional logistics distribution was between 0.41 and 0.58, and the historical trajectory query effect of integrating reinforcement learning and intelligent scheduling was between 0.72 and 0.98. By comparing their mean values, it was found that the historical trajectory query performance of the integrated of reinforcement learning and intelligent scheduling improved by 0.35 compared to traditional distribution. In the order data collection analysis, the integrated of reinforcement learning and intelligent scheduling for logistics distribution improved the order data collection analysis by 0.17 compared to traditional logistics distribution. From this, it can be seen that the logistics distribution system that integrates reinforcement learning and intelligent scheduling can collect the historical trajectory of vehicles for querying, facilitating dispatchers to timely schedule and optimize the distribution path based on indicators such as the road conditions and distribution time of the vehicle’s historical path, and helping dispatchers predict the location risk of the vehicle’s driving path in advance. In addition, collecting distribution order data can help distribution personnel timely understand the specific needs and estimated distribution time of customers, in order to improve customer satisfaction.
The main purpose of logistics distribution under intelligent scheduling and reinforcement learning was to improve user experience and meet user needs. Therefore, this article also tested 15 customers’ satisfaction and experience of logistics distribution needs under this method for evaluation and analysis, and compared traditional logistics distribution. The satisfaction and experience scores were both 5 points, with 0–2 being average, 2.1–4 being good, and 4.1–5 being excellent. The specific investigation results are shown in Table 5.
User experience evaluation under different logistics distribution conditions
User experience evaluation under different logistics distribution conditions
According to Table 5, it can be seen that the user satisfaction and experience of logistics distribution under the integration of reinforcement learning and intelligent scheduling were higher than traditional logistics distribution methods. In the analysis of user demand satisfaction, the user demand satisfaction of traditional logistics distribution ranged from 0.1 to 2.7, with 10 users having average demand satisfaction and 5 users having good demand satisfaction. 33.3% of logistics distribution users had good satisfaction with user needs through the integration of reinforcement learning and intelligent scheduling, while 66.7% were excellent. This indicates that under the integration of reinforcement learning and intelligent scheduling, logistics distribution can meet the needs of users, improve the efficiency of product distribution, and avoid users complaining about product delays. In the analysis of user experience, traditional logistics distribution had a general user experience of 9, accounting for 60.0%, and a good user experience of 6, accounting for 40.0%. The user experience under the integration of reinforcement learning and intelligent scheduling was excellent. The above data confirms the effectiveness of integrating reinforcement learning and intelligent scheduling in logistics distribution. The goal of a good logistics distribution must be to reduce logistics distribution costs, improve logistics distribution efficiency, and thus meet user experience and needs.
The application of integrated reinforcement learning and intelligent scheduling in logistics distribution has enormous potential. The optimization of intelligent scheduling systems can improve the efficiency of logistics distribution, reduce costs, and bring positive impacts to socio-economic development and supply chain management. However, to overcome the corresponding challenges, continuous exploration and innovation are needed in algorithms, model construction, security, and other aspects. Only through continuous efforts and innovation can the application of integrated reinforcement learning and intelligent scheduling become more mature and widespread. By analyzing past traffic flow data, accurate predictions can be made on the traffic conditions of the main roads, and driving routes can be reasonably selected based on the conditions of the road sections, thus providing convenience for logistics distribution. With the progress of hardware technology and continuous optimization of algorithms, the application prospects of integrating reinforcement learning and intelligent scheduling in logistics distribution are very broad. In the future, more efficient training methods and more intelligent scheduling systems may emerge, further improving the efficiency and flexibility of logistics distribution. At the same time, cross disciplinary cooperation also helps to combine reinforcement learning with other excellent technologies, promoting the wider application of intelligent scheduling in logistics distribution.