
Abstract
With the continuous expansion of the power grid, the forms of faults are becoming increasingly complex, with a wide range of impacts and long maintenance cycles, posing increasingly severe challenges for power grid operators. In the current power system (PS), due to system limitations, there is a large amount of data, and the current computing system is limited by hardware and computing power, making it difficult to satisfy the requirements of real-time computing, comprehensive analysis, and expansion. This paper analyzed the technical basis of the knowledge graph (KG) of power grid operation and maintenance (O&M), and clarified the key role of model driving in the current large-scale smart grid (SG), which can effectively improve the efficiency and reliability of data processing in the SG. This paper also analyzed the model-driven PG O&M KG platform, and analyzed the role of particle swarm optimization (PSO) algorithm in PG operation and fault maintenance. After applying the PSO algorithm in this article, in the experimental results section, the fault rate of Transformer 5 was 2.1% lower than that of Transformer 4. The knowledge mapping model of grid O&M and the particle swarm algorithm in this paper can significantly reduce the failure rate of the grid, which has wide extension value.
Keywords
Introduction
As the scale of smart grid increases, the amount and types of security data increase rapidly, resulting in more and more complex and difficult security analysis process. It is urgent to use intelligent technology to effectively integrate, analyze and classify the complex situation information, and help managers proactively, quickly and comprehensively control the key information of situation processing when the power grid security situation is unclear, so as to provide corresponding auxiliary decisions for situation processing. Power network security situation system is a typical information and knowledge-intensive decision-making control center. The construction of the power grid situation processing domain knowledge graph can transform invisible and seemingly unrelated alarm information into intuitive and easy to understand internal and external threat intelligence, and facilitate security situation managers to accurately analyze massive alarm events, so as to quickly and effectively perceive the power grid situation and identify network anomalies and attacks. It is an important new technical means for the security protection of the whole scene of smart grid.
With the development of the PS, the level of intelligence in the PS is becoming increasingly high, and the management and utilization of PS operation information are becoming increasingly difficult. At present, in the operation and management of the PS, the training methods for PS operation and management work are relatively simple, and the training time is also relatively long. This leads to a lack of relevant professional management knowledge in the operation and management work of the PS, and there may be some incorrect understanding in the work, which cannot effectively handle PS faults. Starting from the issues faced in the O&M management of PG, this paper studied the model-driven KG and platform of PG O&M, and tested its feasibility and effectiveness through examples.
Literature review
With the development of PG technology, many scholars have analyzed the KG of PG O&M. Wang Jian [1] studied the semantic interconnection of grid data in the context of big data for electricity. The new technology represented by KG can describe the complex relationship between things, and it has aroused great interest by its effective knowledge inference of things. Especially in the context of large-scale test devices and large-scale power data scale growing exponentially, the KG of PG O&M would become a new opportunity to alleviate the increasingly rich power information and intelligent application development. Li Zhuotong [2] used software to define the KG of PG O&M. Because there were many kinds of alarm signals in the large PG, and the interconnection of each alarm signal was very complex, it was difficult to accurately locate each alarm signal. Therefore, he proposed a new idea of early warning information processing based on the KG. Meng Fanqi [3] analyzed the KG of PG O&M, which provided strong support for automatic diagnosis and intelligent question answering of electrical equipment. On this basis, he analyzed a new method for power equipment ontology based on Chinese scientific and technological documents. The PG O&M KG has brought convenience to the operation and detection of the PG, but the above literature lacks the application of model driving in the PG O&M KG.
Some scholars also analyzed the application of model driving in the KG of PG O&M. Marot Antoine [4] analyzed that under the model driving, the electrification of the PS The digitalization of the system and the improvement of decarbonization rate have made the current KG of PG O&M present a new development trend. Today, the KG of PG O&M was widely used, and model driving has become an important application in distribution systems. To solve this problem, Yan Dapeng [5] used model-driven intelligent learning in the KG of PG O&M to improve its application ability in the PS. Li Jian [6] analyzed the model-driven KG of PG O&M. As the failure effect of the PG increased, its anti-interference performance decreased, leading to more complex failure modes. On this basis, he studied a new intelligent PS load shedding control method. Based on the operational characteristics of the PS, he also constructed evaluation indicators suitable for the PS, and designed a gradient algorithm based on continuous behavior and depth determination. The above research analyzed the combination of model driving and PG O&M KG, which provided technical support for the detection accuracy of PG operation.
As the number and scale of PG stations continue to increase, the requirements behind them increasingly rely on data. The construction goal of the new generation of PG dispatch is to prioritize PG O&M. In the construction of the KG of the actual PG O&M, in order to meet the query requirements of the real data of various systems, a set of additional coupling functions or specific modules would be derived, which results in a lot of repetitive work. This paper provided a set of fast, convenient, accurate, intelligent and comprehensive models for the grid O&M KG platform. In the process of SG construction, for the demand of massive, heterogeneous and multi-source data, this paper selects the KG and platform of PG O&M as the research object. In this process, it is studied and the model-driven process involved in its implementation is discussed, so it has a relatively large application value.
Design of KG model for PG O&M
Knowledge acquisition
At present, the related technologies based on KG mainly include two directions: one is the learning of knowledge representation, and the other is the embedding of knowledge map. The intelligence of the power network is manifested as a comprehensive and timely grasp of the power network, integrating and analyzing the data generated by various information systems, in order to achieve the optimal configuration of the power network. In the SG, a large amount of data appears in various forms such as text, numbers, and graphics, and its source and distribution range are wide. At the same time, there is a higher demand for its reliability and real-time performance.
The progress in PG equipment has also enabled researchers to achieve accuracy that was previously impossible to achieve. In order to achieve the goal of a new generation of KG, the collaboration between the two would become the focus of independent innovation in chemical research [7]. KG is a new technology for expression, retrieval and integration of multi-source heterogeneous information. In just a few short years, KG and its auxiliary technology have become an important component of modern search engines, intelligent personal assistants, business intelligence, etc [8]. KG embedding is to use the low rank vector representation of nodes and edges in the map for data processing, which can effectively retain the internal structure of the map itself [9]. In recent years, with the development of KG technology and the continuous emergence of massive map data, people have established a set of mature map analysis methods, greatly expanding the scope of use of KG, and providing effective solutions for many practical problems [10]. The KG provides new ideas and methods for the security of power network [11]. The main characteristics of knowledge graph are as follows:
The more times and scope users search, the more information and content search engines can obtain. Give new meaning to strings, not just strings. Integrate of all disciplines to facilitate the continuity of user search. Find out more accurate information for users, make more comprehensive summaries and provide more in-depth and relevant information. Systematically display the knowledge system related to keywords to users. Draw useful information from the entire Internet so that users can access more relevant public resources.
Currently, both PG planning agencies and PG dispatch agencies adopt conventional static mathematical models based on characteristic parameters or dynamic mathematical models based on motors. However, some new load models and modeling methods have not been widely applied. The reason for this situation is not only the difficulty of load modeling, but also the lack of actual measurement data, which makes it impossible to conduct comprehensive verification and evaluation of the correctness and practicality of these models.
For a long time, the engineering community generally adopted a load model establishment method based on failure simulation. The equivalent resistance of the distribution network is parallel to the stator resistance, while ignoring the impact of reactive power compensation and static load on it.
In considering the comprehensive load of the distribution network, both static and dynamic loads have included the impedance factor in the distribution network, and the reactive power compensation effect in the distribution network has been simulated. This makes it easy to include small units in the distribution network, effectively solving the problem of converting static loads into reactive power sources.
When modeling load elements, a series of models and parameters are usually used that can represent load characteristics, such as load power factor, and the characteristics of load active and reactive power as a function of voltage and frequency. In the substation, the PS used corresponds to the PS used in the electrical substation. According to whether it reflects the dynamic nature of the load, load modeling can be divided into two categories: static modeling and dynamic modeling. The static model of the load describes the active and reactive characteristics of the load at a specific voltage and frequency. The static functions are as follows:
Among them,
The node load (active and reactive) changes with changes in voltage, frequency, and other factors, and its dynamic characteristics can be described by differentiation or difference. The general expressions for identifying the dynamic model of the system are:
Among them,
PSO algorithm is a random and parallel optimization algorithm. Its advantage is that it does not require the function to be optimized to be differentiable, derivable, continuous and so on, and its convergence speed is fast, the algorithm is simple and easy to program. However, the disadvantages of PSO algorithm are: (1) For functions with multiple local extreme points, it is easy to fall into the local extreme points and get no correct result. There are two reasons for this phenomenon, one is due to the nature of the function to be optimized; the second reason is that the diversity of particles in PSO quickly disappears, resulting in premature convergence. These two factors are often inextricably intertwined. (2) Due to the lack of precision search methods, PSO algorithm often can not get accurate results. The reason for this problem is that PSO algorithm does not make full use of the information obtained in the calculation process, and only makes use of the group optimal and individual optimal information in each iteration. (3) Although the PSO algorithm provides the possibility of global search, it cannot guarantee convergence to the global optimum.
The load model is a complex nonlinear system. In terms of mechanism, the PSO algorithm can optimize the whole solution space as a whole, and its demand for initial values is basically non-existent, which is expected to obtain better identification results. PSO algorithm can realize the optimal dispatching of PG. Its application in the KG model of PG O&M is as follows [12]:
PSO is a method that utilizes information exchange between populations and the accumulation of their own experience to make decision adjustments to individuals within the population. During each cycle, each particle would track two “extreme values” to correct its region. The first type is the best outcome, which is called personal limit. Another limit is the best solution found by all groups currently, which is the overall limit.
Currently, there are various types of information systems in power enterprises, and the data has also shown a diversified development trend [13]. With the passage of time, the number of these data is also constantly increasing [14]. Therefore, in this case, if these data can be managed efficiently and uncovered, this would greatly enhance the operation and management capability of the power enterprise.
In this article, the statistics of keywords are an important basis for statistical analysis of relevant literature materials. Therefore, using the analysis of the article and the visualization analysis of high-frequency keywords, this article can extract the most concerned research hotspots in the current academic community and predict them. Combining the time pulse of keywords and the real time period in 2011–2020, a large number of research-related literature emerged, and the top 10 high-frequency words with the highest word frequency were all concentrated in that time period, with the main keywords including power protection, automation, grid operation, voltage, current, frequency, capacitance, substation, power plant, and economic efficiency. Among them, the frequency of power protection was in the first place (The data is calculated based on the data released by the State Grid of China (
In Table 1, it can be clearly seen the number of citations and content of keywords per year, as well as the centrality and citation frequency of each keyword in different years.
Model-driven KG platform design for PG O&M
System architecture and functional settings
Considering the complex characteristics of the PS, the failure of any link would bring huge economic losses. Therefore, how to quickly repair the PS after a disaster has become a new topic [15]. In the future electricity market, it is necessary to adopt an autonomous energy management system represented by the Internet of Things to meet the needs of users in the electricity market [16]. The construction of the power network has brought tremendous changes to life. In order to improve the reliability of the PS, multi-level PGs are developing from centralized to decentralized, and have been increasingly applied in the management, billing, metering, and other aspects of the PS [17]. The smart PS uses modern Internet and information technology to achieve the interconnection of all parts of the PS. With the continuous development of smart PS, PG provides a huge amount of information for the development of PS. With the development of socio-economic development, the development of SG technology makes the SG a means of metering, which also has additional functions such as intelligent device control and two-way communication between users and the grid. In intelligent PS, smart meters are an essential part [18]. Intelligent networks ensure sustainable power supply during peak electricity usage and various meteorological conditions, and can continuously charge and discharge in different environments to achieve the goal of reducing network power consumption [19]. Energy forecasting can provide better planning, operation, and management of PS [20]. The intelligence of the PS is the foundation for achieving digitalization in the PS. As the distribution network with the closest relationship with customers, its reliability in power supply would be valued by them. Due to limitations in technology, management, and other aspects, its practical application presents complex and ever-changing characteristics [21].
The distribution network operation control platform supported by intelligence and big data can effectively control the status and operation of the distribution network from the existing distribution network, and can scientifically control the operation control and emergency handling of the distribution network. The grid O&M KG platform is shown in Fig. 1.
Keyword centrality statistics from 2011 to 2020
Keyword centrality statistics from 2011 to 2020
Architecture diagram of PG O&M platform.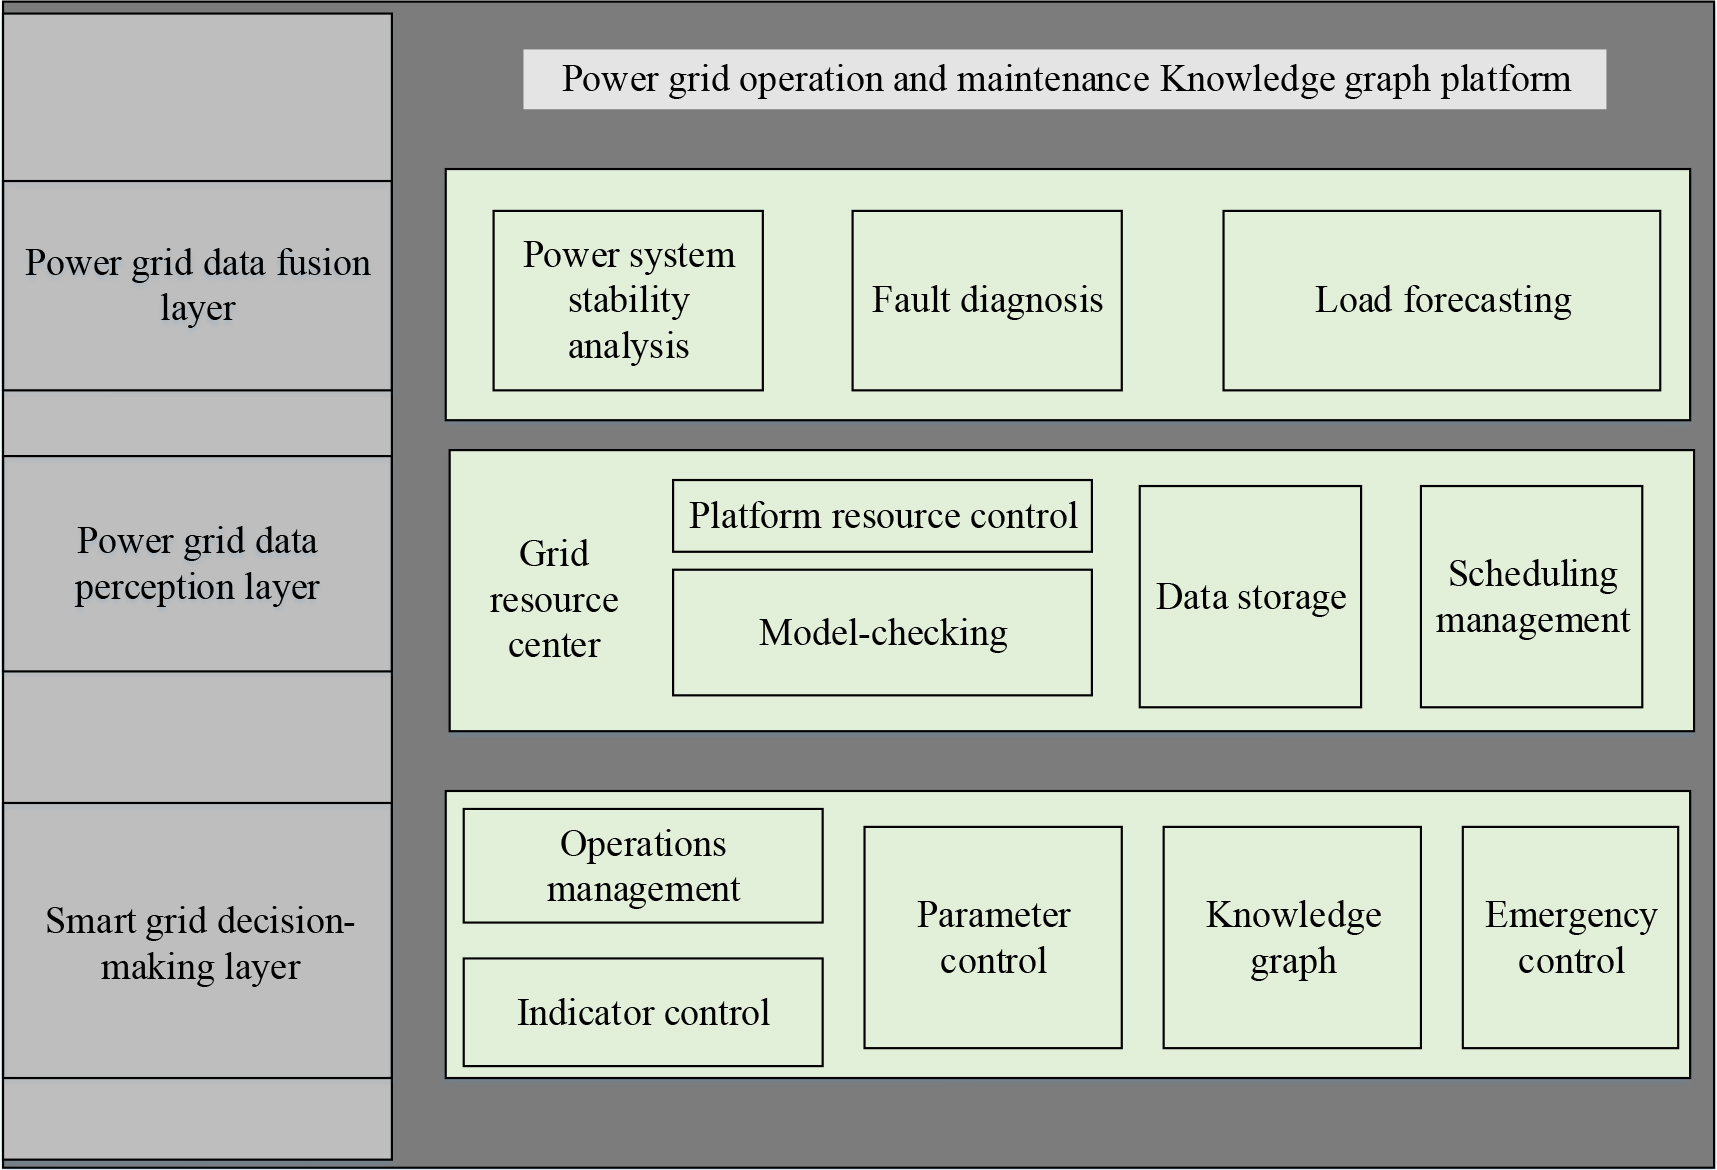
The primary task of the smart sensing layer is to access the unified data of the entire service network, complete the collection of each service network, and ensure the normal operation of each service network. Power grid data fusion layer: after these data are introduced into the unified data center for the entire business, the data fusion layer also needs to conduct deeper cleaning and organization of these data to ultimately form and improve the unified information model for power distribution and consumption, and provide data calculation services and analysis service support for business applications in a service-oriented manner. Power grid data peception layer: the data perception layer contains numerous sensor terminals, although each type of sensor terminal connects to different types and quantities, it has a high degree of structural consistency. Smart grid decision-making layer: the smart decision-making layer conducts deeper calculations on data, providing various data support for the intelligent operation and control platform of the distribution network. The system architecture of the PG operation platform should be based on the level of distribution information. The system architecture should be established from the local specific conditions, with the processing process as the main line.
Dispatch processing refers to assigning corresponding maintenance personnel to the location where problems occur in the PG, and displaying the maintenance information of these maintenance personnel, including the maintenance time, maintenance results and others. Comprehensive deployment plan is used to display the development specifications and work plans of the PS, including expansion of the PS, deployment of new lines, notification of power outage plans, and tracking of project implementation status.
The fault diagnosis information of the PG usually includes account opening information, fault location, operational behavior, etc. After obtaining this data, it would be processed to determine the location of these problems and the reasons for their occurrence. After discovering the location and cause of the PG fault, maintenance personnel need to be dispatched to the site to display it, and mobile phones can also be used to notify relevant maintenance personnel to view information about important nodes.
The PG system is based on daily monitoring data of the PG. After establishing a PG operation platform, customer service personnel can immediately inform maintenance personnel of the location and occurrence of problems, and quickly solve on-site problems. In addition, real-time monitoring of the PS can be used to identify its own shortcomings, provide a basis for updating and improving the PS, and thereby improve the reliability of the PS.
Data exchange
In the process of building a distribution network operation platform, the first thing to do is to collect data. The correctness and accuracy of Information extraction directly influence the efficiency of fault diagnosis and operation of the system. In terms of big data, the overall storage mode is usually the storage mode of distributed database. In terms of structural data, relational database is usually used. A database can not only store a large amount of data, but also quickly search and query data. The use of distributed databases in unstructured data enhances the credibility and compatibility of the database, making it suitable for storing data such as sound and images. For unstructured data, a decentralized file is used, which can effectively store data, such as textual data.
Grid O&M experiments and evaluations
Due to the frequent occurrence of equipment failures, short line faults, and disconnection faults in the operation of the PG, it is necessary to analyze them. Studying the parameter values and voltage drop ratio of fault problems helps to correctly and effectively diagnose, locate, and handle distribution line faults, shorten power outage time, and restore power supply in a timely manner. This article recorded the parameter values of three different faults by setting the parameters of the faults. The parameter values for the three types of fault problems are shown in Table 2.
The basic steps of short-circuit calculation: 1) Develop an equivalent network for power system faults; 2) Network simplification; 3) Perform practical calculations on short-circuit transient processes.
Then, the method in this article is used to extract data features, identify different circuit faults, and analyze the emotional development of the experimental subjects by comparing the characteristics of each PG data. The method in this article is also used to predict the changes in the emotional development of the experimental subjects during the initial and final stages of collection. Finally, this article uses SPSS (Statistical Product and Service Solutions) 16.0 software to conduct statistical analysis on the final results.
Parameter values for three types of faults
Parameter values for three types of faults
From the data in Table 2, it can be seen that the overall value of short line faults was relatively high. This was due to the frequent occurrence of short line faults in various circuits during PG operation. In the PS, various types of short circuits were the most common and harmful, mainly manifested as single-phase to ground short circuits, and a few were manifested as three-phase to ground short circuits. In situations such as rotors and transformers, there may also be inter turn short circuits in the coils. In addition, in the ultra-high voltage network of ultra-high voltage, there may also be disconnection and incomplete phase. Alternatively, in a single accident, multiple types of faults may occurred simultaneously.
In the PG, a significant decrease in voltage in local areas can affect the normal operation of a large number of customers. When the voltage drops, the electromagnetic torque would significantly decrease. When the working voltage of electrical equipment is lower than the rated voltage, the motor would stop rotating, leading to serious consequences such as product scrapping and equipment damage. Passing through a very large short-circuit current on a short circuit would cause significant mechanical stress between wires. If the wire and its supporting structure are not firm, it would lead to wire breakage. During this process, there is also a risk of electric arc at the short-circuit point causing damage to the electrical equipment. In the PS, whether defective or not, it generates extremely strong electrical energy and extremely high temperature under extremely high short-circuit currents. During long-term short-circuit processes, it would cause serious damage and reduce its working life. When multiple power plants in the PG are connected to the grid, the balance point during the grid connection process would be broken, causing vibration between the units, and ultimately leading to the collapse of the PG, which is its greatest harm. When a malfunction occurs, it would have a significant impact on the surrounding communication and self closing signals on the track. Therefore, when monitoring the PS, it is necessary to pay special attention to it.
When there is a fault in the PG, the voltage would sharply decrease, so it is necessary to compare and analyze the voltage drop proportions of the three types of faults. The voltage drop proportions of the three types of faults are shown in Table 3.
Voltage drop ratio for three types of faults
From Table 3, it can be seen that the proportion of decrease in short-circuit fault voltage was greater, and the greater the proportion of decrease in voltage, the greater the damage to the circuit. Therefore, it is important to pay attention to short-circuit faults during the operation of the PG.
Voltage sag refers to a sudden drop in voltage that quickly returns to its original level. The difference with under-voltage is that the voltage drops very quickly. Sometimes, the voltage after the transient drop is only about 10% of the original. Due to the occurrence of excessive current on one line, the voltage of the network decreases. Due to the presence of some resistors in the PS, there would be a voltage drop when passing through the resistors. As the current increases, the voltage drop also increases.
During a period of time, the voltage drops and the current in the PG is much higher than the normal value, resulting in a much lower voltage in the PG. The main factor causing transient high currents is the occurrence of short circuits in transmission lines. In the PS, due to short circuits in certain parts of the PS, the current suddenly increases and the voltage suddenly decreases. However, there is a protection device in this line that immediately activates and cuts off this position, bringing the voltage at this position back to its original position, thus creating a temporary drop. In addition, in the PS, the addition of a large number of loads may cause voltage drops in the system. The factors that cause voltage drop in the PS include weather conditions, equipment failures in the PS, various short circuit faults, large motor startup, lightning strikes, etc.
When the unit is in a lower operating state, in order to maintain a certain output power, the current would increase. When the active power of the system is maintained, the reactive power of the system would significantly decrease as the system voltage decreases. When the voltage in the system decreases, the output power of the capacitor used for reactive power compensation would significantly decrease, and the grid voltage would further decrease. As the voltage decreases, the line loss increases, reducing the torque of the induction motor. When there is a significant voltage drop in the system, undervoltage protection would be activated, causing the motor to stop running. The low voltage of the PG makes the alternating current (AC) motor of the power supply station and the customer’s power consumption increase its stator current during the long-term overload operation, which leads to the unit burning up. The sharp drop in voltage in the PG can cause voltage collapse, thereby affecting the stability of the system.
In the PG inspection work, one of the steps is to detect the transformer. Next, the power frequency of the transformer was analyzed. Three transformers were selected, labeled as Transformer 1, Transformer 2, and Transformer 3, and the power frequency of the three transformers was recorded and analyzed. The power frequency of the transformer is shown in Fig. 2 (Note: the data is calculated based on the data released by the State Grid of China).
Power on frequency of transformer.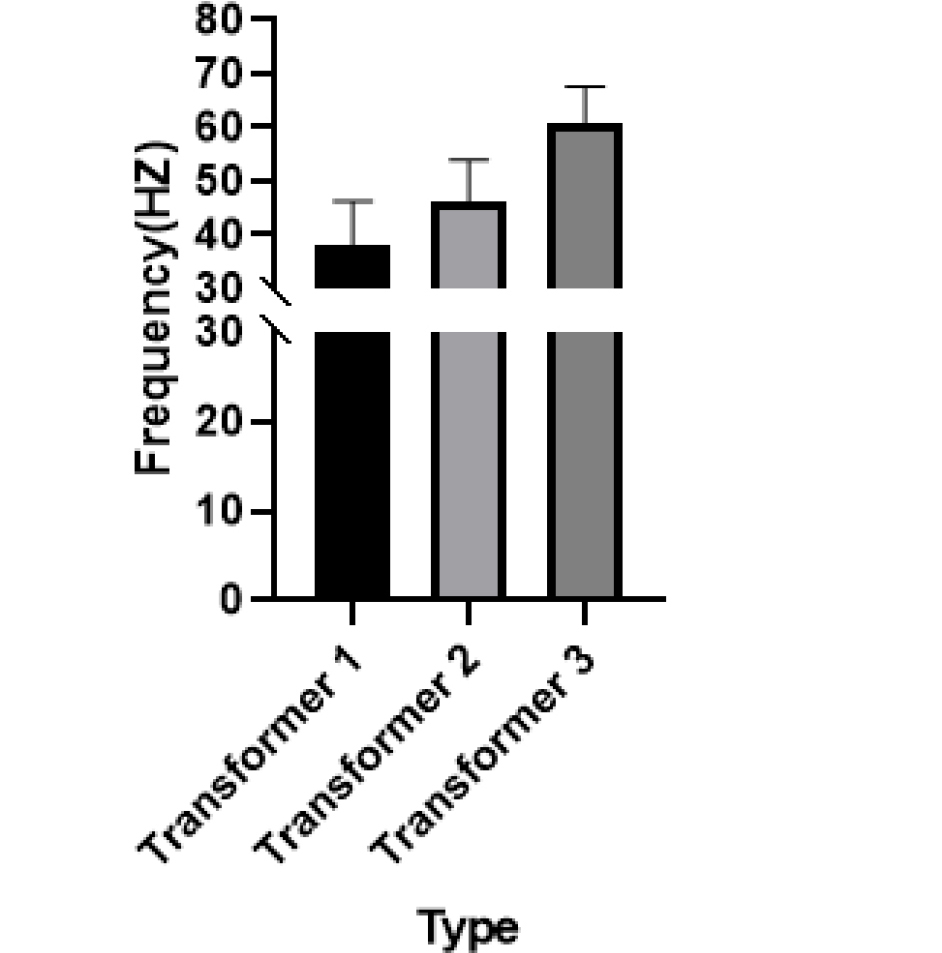
As can be seen from Fig. 2, the energized frequencies of the three transformers were in different data. Through observation and analysis, the frequency data value of Transformer 3 was relatively high. The average frequency data value of Transformer 3 was 60.6 HZ. It was known that within a certain range, the higher the frequency value of the transformer, the better the effect. Therefore, it can be concluded that Transformer 3 had a better power on effect.
In practice, due to the existence of iron and copper losses, its efficiency cannot reach 100%. The consumption of iron is closely related to the magnetic flux and hysteresis loss in the magnetic core. Correspondingly, as the frequency increases, the magnetic field strength of the iron core decreases, and the loss of the iron core decreases, thereby improving efficiency. The frequency cannot be increased uncontrollably. Because the frequency is too high, and the magnetic field density is too small, the core is in the weak magnetic zone, which would make the input current of the transformer occur larger distortion. As the frequency increases, the equivalent direct current (DC) resistance of the winding increases, and the copper loss of the transformer increases. Although the iron loss decreases, the overall efficiency is not high. At a specific voltage, there is rarely a larger current. Therefore, without more energy, there would be no higher efficiency.
On the basis of Fig. 2, two more transformers were added, labeled as Transformer 4 and Transformer 5, and the situation of the five transformers was observed and recorded. Because the starting time of transformers is also one of the factors influencing the operation of the PG, it is necessary to conduct research and analysis on them. The starting time of the transformer is shown in Fig. 3.
Starting time of transformer.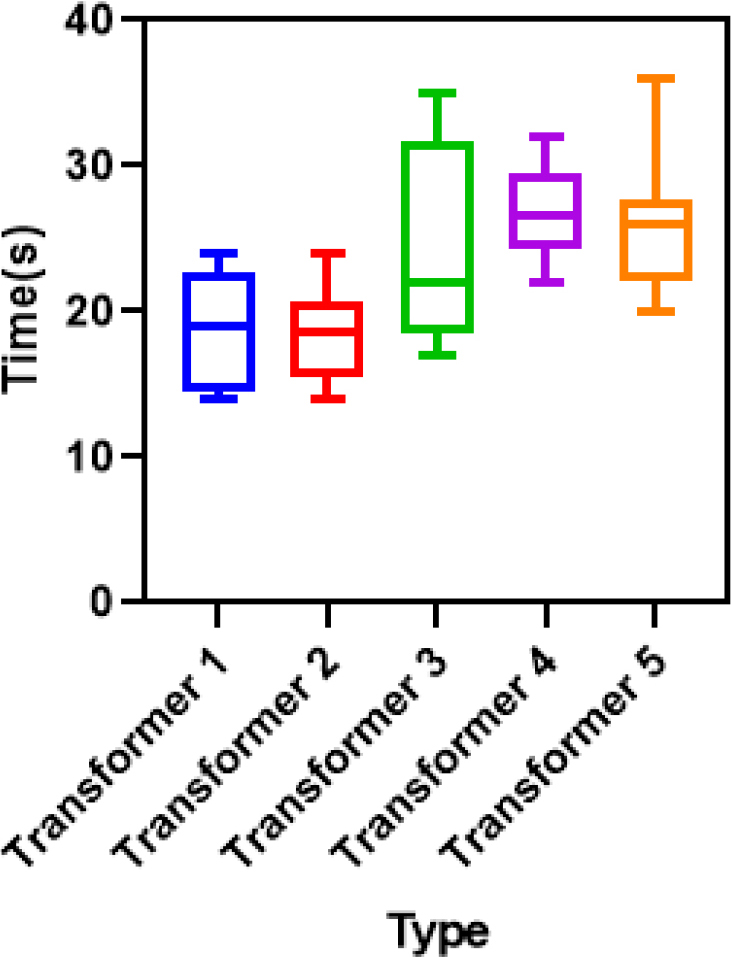
Failure rates of different transformers.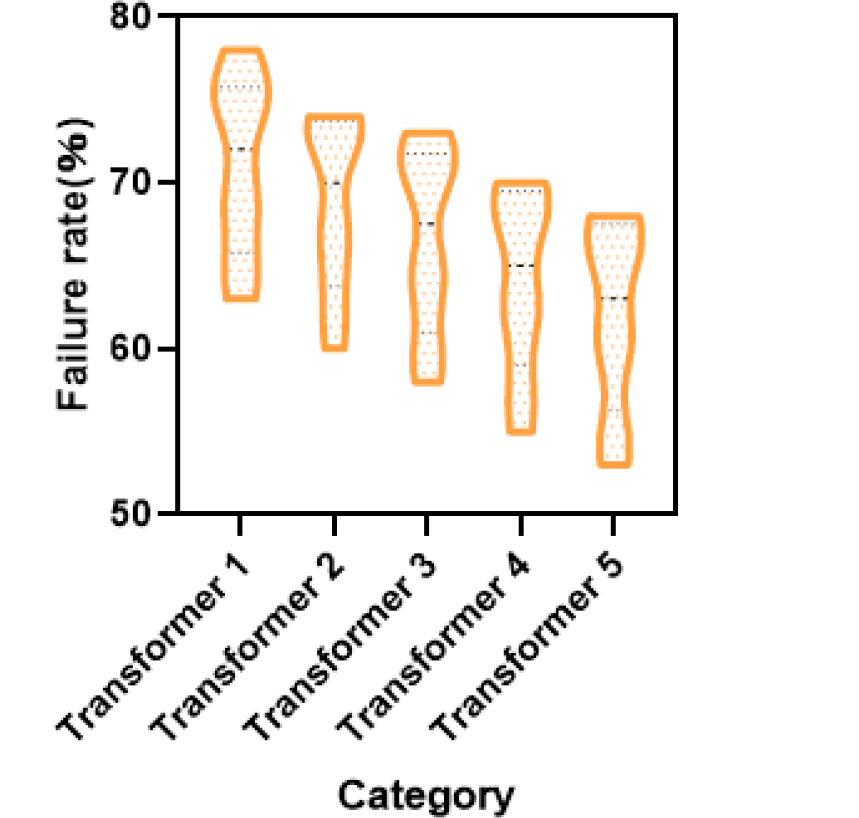
From Fig. 3, it can be seen that among the five transformers, the numerical range of Transformer 3 varied greatly, and the starting time range of Transformer 3 was between 17 s and 35 s. Therefore, its operation is unstable. Since the shorter the starting time of the transformer is, the better the effect. Therefore, people should choose a transformer with a short start-up time in grid maintenance, so as to ensure the normal operation of the grid, but also to promote the improvement of grid energization efficiency. However, during transformer startup, it is necessary to control the influence of other parameter variables.
When the transformer is started, the reason for abnormal noise, current fluctuations, and easy burnout of the fuse in another transformer may be due to the instantaneous current surge generated during the transformer startup. Specifically, it may be due to the large inductance and capacity of the transformer, which initially absorbs more current, and the duration of this current surge is relatively short, which can easily generate peak voltage and current, leading to abnormal noise and current fluctuations in other transformers, and even burning out the fuse.
To address this issue, a capacitive filter can be installed at the output of the main transformer to minimize the pulse current generated during startup, thereby reducing interference to the main transformer. Application of soft start technology: By using soft start devices, the current and voltage during transformer startup can be controlled to gradually increase and reduce the current impact during startup, in order to avoid affecting other transformers. Optimizing circuit design: When conducting circuit design, it is necessary to thoroughly analyze the electrical characteristics and matching of each transformer, select them reasonably, and adopt appropriate wiring methods to reduce mismatch problems in the circuit. Additional protection: In order to prevent damage to the transformer, overcurrent, overvoltage, and other protections can be added to the line.
In this paper, the traditional data comparison and logic analysis methods were combined, supplemented by PSO algorithm, and the original data of each signal system was used as material to analyze the fault, so as to achieve the purpose of intelligent early warning of equipment fault. This article studied five transformers. Among them, Transformer 1 did not perform any processing; Transformer 2 used PSO for one cycle operation; Transformer 3 used PSO for two cycles operation; Transformer 4 used PSO for three cycles operation; Transformer 5 used PSO for four cycles operation. The failures of five transformers were recorded and the magnitude of the failure rate after applying the particle swarm algorithm for multiple cycles was compared. The failure rates of different transformers are shown in Fig. 4.
From Fig. 4, it can be seen that after continuous iteration of the PSO algorithm, the fault rate of Transformer 5 was the lowest. From the data in Fig. 4, it can be seen that the fault rate of Transformer 4 was slightly higher than that of Transformer 5. It can be seen that after using PSO algorithm, the fault rate of Transformer 5 was 2.1% lower than that of Transformer 4. During the operation of the PG, it is necessary to monitor and diagnose the operation of the PG.
The monitoring scope of PG operation monitoring covers the condition of all PG signal equipment, which can comprehensively display the true situation, thereby reducing the workload of daily inspections and reducing the labor intensity of staff. To ensure the integrity and correctness of monitoring data, it is necessary to integrate the safety management system of the railway PS with the basic data information platform. This platform monitors the business activities of enterprises in real-time based on the basic information obtained and combined with the business information of the enterprise.
The intelligent diagnosis function of PG faults can help relevant personnel within PG quickly determine the cause of faults and locate faulty equipment or components. Automatically provide maintenance suggestions based on the fault status, which can shorten the time from occurrence to repair, thereby reducing the fault stop time. Based on data analysis and guided by auxiliary maintenance, a comprehensive fault diagnosis method has been developed. The intelligent diagnosis of the system has been carried out. In the traditional judgment process, the main content includes the following aspects: analyzing the generation of signals, checking whether the signal transmission between devices is correct, and determining whether the device has malfunctioned; based on the deep working mechanism of the device, analyze its faults, conduct online simulation of faulty components, and locate faulty components.
The PG is one of the infrastructure of the national economy, and its O&M management involve various links and details. With the improvement of intelligence level, how to effectively manage and utilize PG O&M knowledge has become an important issue. In the SG, the amount of data is huge, and the existing computing system is limited by hardware and computing resources, so it is difficult to achieve real-time computing, comprehensive analysis and scalability of data. This article analyzed the technical basis for its implementation and explained the important role of model driving in today’s powerful SG construction, which can effectively improve the efficiency and reliability of data processing in SG construction. This paper was based on model-driven knowledge mapping of PG O&M with the goal of intelligent O&M, which was analyzed through experiments. The platform can effectively improve the efficiency of PS fault repair and reduce the cost of PS fault repair.
Traditional relational databases and IT architectures are no longer able to meet the processing, modeling, analysis, and visualization needs of massive data. Therefore, State Grid of China has established a special project to develop a new generation of power grid analysis software based on the organic integration of graph databases, graph machine learning, knowledge graph technology, and core business of the power grid. In the power grid dispatch business, text data such as dispatch fault handling management regulations, fault handling plans, dispatch regulations, and abnormal monitoring manuals, as well as structured data exported from the D5000 system, can be used. Based on the business experience and rules of frontline dispatchers, a basic ontology architecture can be built from top to bottom. Then, concept extraction tools and relationship extraction models can be used for automated recognition. The recognition results are abstractly verified by business experts to form a bottom-up category system, which is integrated with the basic ontology architecture to construct the final power dispatch knowledge ontology architecture. Of course, this article also has limitations. Knowledge extraction and graph construction under mixed data are the future research directions of this article. The knowledge obtained from the power system usually has the characteristics of information universality, multi-source heterogeneity, and sometimes accompanied by ambiguity, noise, and redundancy. For knowledge graphs, ambiguity manifests as a lack of accuracy and consistency in the attribute descriptions of entities and concepts, or the misplacement and distortion of relationships between entities, resulting in chaotic graph structures and conflicting semantic descriptions, which may lead to disordered inference mechanisms and distorted inference results. Noise, as a significant feature of internet-based data, to some extent dilutes the content and value density of data information. Therefore, in the future, this article will conduct in-depth analysis on knowledge extraction and graph construction under mixed data.
Funding
No funding were used to support this article.
Data availability statement
All data generated or analyzed during this study are included in this published article.
Footnotes
Conflict of interest
The authors declare that there is no conflict of interest with any financial organizations regarding the material reported in this article.