
Abstract
Bibliometric analysis, an approach introduced by the library and information sciences, attempts to unravel the relationships between a large number of scientific literature by using quantitative methods. Economics of Education Review was founded in 1981 to meet the needs of a growing number of research in the economics of education. The journal has evolved to become a top field journal that focuses on high quality research in an interdisciplinary field that combines educational studies and economics. It specializes in human capital production and the returns to human capital as well as in education policy and finance. We examine collaboration patterns using an approach introduced by the library and information sciences. The current research shows hidden patterns among scientific actors to offer a comprehensive understanding of the knowledge structure of this top field journal by employing network analysis such as bibliographic coupling, co-authorship and co-citation analysis. It also presents a thematic overview by analyzing author keyword co-occurrence and by classifying articles into six thematic clusters to highlight past themes and current trends in the field of economics of education. Our results suggest a shift in the focus of research, with more topics on measuring the impact of preschool programs, quality education, higher education attainment, gender, race and peer effects playing an important role in this area of scientific research.
Introduction
Bibliometric analysis is an approach introduced by library and information sciences that applies quantitative technics (e.g. citation analysis) to bibliographic data (Broadus, 1987; Pritchard, 1969). The rise of quantitative studies in the broader area of Infometrics, such as Bibliometrics, has evolved into a value-added information service to library and information professionals by combining large bibliographic data retrieval and IT-based presentation techniques to extract useful information and analyze previously unknown relationships (Wormell, 2000). Bibliometric analysis attempts to unravel the relationships between a large number of scientific literature by using quantitative methods to describe, evaluate and monitor published research. It has been argued that bibliographic analysis offers more benefits than traditional systematic reviews since it can analyze a large amount of papers, avoiding subjective evaluations and sample selection bias and combining quantitative statistical analysis with qualitative evaluation (Appio et al., 2014; Zupic & Čater, 2015; Donthu et al., 2020b; Donthu et al., 2021a).
While it has been widely used in business studies (Zupic & Čater, 2015; Gaviria-Marin et al., 2018; Martínez-López et al., 2018; Donthu et al., 2020a; Donthu et al., 2020b; Donthu et al., 2021a; Eulerich et al., 2022) and finance research in recent years (Xu et al., 2018; Galletta et al., 2022; Khan et al., 2022; Patel et al., 2022), bibliometric analysis is relatively new in education (Ozyurt & Ayaz, 2022) and economic research (Horvatinović & Matošec, 2022). It has been used to analyze journals’ academic publications overtime, such as Forty-five years of Journal of Business Research: a bibliometric analysis (Donthu et al., 2020b), Twenty-five years of education and information technologies: Insights from a topic modeling based bibliometric analysis (Ozyurt & Ayaz, 2022), Twenty years of the Journal of Knowledge Management: A bibliometric analysis (Gaviria-Marin et al., 2018), Forty years of the International Journal of Information Management: A bibliometric analysis (Donthu et al., 2021b) and A decade for the books: Bibliometric analysis of Economics Letters (Horvatinović & Matošec, 2022) or monitor specific fields with extended scientific literature, such as blockchain study (Firdaus et al., 2019; Tandon et al., 2021; Patel et al., 2022) or interdisciplinary research topics (Shu & Mongeon, 2016; Mongeon et al., 2021).
The current study will present a network and thematic overview by analyzing author keywords and by classifying results into six bibliographic clusters to highlight past themes and current trends of a top field journal in the Economics of Education. Economics of Education Review (EER) is a leading international journal in the economics of education. The journal was founded by Professor Elchanan Cohn (University of South Carolina) in 1981 as “a response to a steady evolution of the field, measured by the growing number of research manuscripts and scholars specializing in this area” (Cohn, 1981). Between 1981 and 2022, EER published more than 2000 articles using “innovative, cutting-edge research on the economics of education that is of interest to academics, policymakers and the public” (journal’s copyright page). The journal combines educational studies and economics by focusing on research topics concerning human capital production and acquisition, the returns to human capital and education policy and finance. It is among the most influential journals with an
Q1 journals represent the top 25% of journals of a subject area based on their citation impact factor.
This article is organized as follows. Section 2 presents a brief overview of bibliometric methodology and previous bibliometric studies. Section 3 offers the network and thematic analysis of the journal’s publications. Section 4 provides the conclusions and presents the study’s limitations.
Researchers identify two main dimensions in bibliometric analysis: performance analysis and scientific mapping (Cobo et al., 2011; Donthu et al., 2021a). Performance analysis aims at measuring the impact of scientific output of different actors (e.g., authors, journals, institutions and countries) in a research field (van Raan, 2005; Cobo et al., 2011). In performance analysis, citation and publication related metrics (e.g. number of cited publications,
Scientific mapping on the other hand, focuses on dynamic aspects of scientific research by analyzing the relationships between scientific actors (Cobo et al., 2011; Donthu et al., 2021a). Most commonly used techniques are citation analysis of each scientific actor, co-citation analysis (Small, 1973), bibliographic coupling (Kessler, 1963; Martyn, 1964), co-word analysis and co-authorship analysis (Peters & Van Raan, 1991; Martínez-López et al., 2018; Baker et al., 2020; Donthu et al., 2020b; Donthu et al., 2021a). Citation analysis uncover the most influential publications in a research field (Pieters & Baumgartner, 2002), whereas co-citation analysis determines the relationships among cited publications that co-occur frequently in reference lists and contribute to the development of a research field (Small, 1973; Appio et al., 2014). While co-citation analysis reveals the foundations of a research field, bibliographic coupling determines the relationships among citing publications that form shared references and uncover a field’s latest developments (Kessler, 1963; Zupic & Čater, 2015). Unlike the previous three techniques that focus mainly on documents, the next two analyze the content of the publications, the “words” (co-word analysis) or the relationships among authors (co-authorship analysis) and their affiliations that deeply influenced the development of a research field (Donthu et al., 2021a).
Although citation-based metrics are among the most popular bibliometric indications to measure scientific impact and influence (Hirsch, 2005; Donthu et al., 2021a), they have received criticism for reinforcing the Matthew Effect, a success-breeds-success phenomenon where famous scientists tend to gather a disproportionately greater number of citations (Merton, 1968), and the cumulative advantage of highly cited papers (de Solla Price, 1976; Katz, 2000). Wang’s (2014) study supports the use of citation-based metrics for research evaluations by decomposing the Matthew effect and providing evidence that previous studies overestimated the prestige effect by focusing only on paper quality. Appropriateness of the paper reduces considerably the prestige effect of famous authors or publications in citations by creating the foundations for other scientists to further contribute to and by revealing new lines of research (Wang, 2014). Furthermore, unlike performance analysis which focuses on measuring productivity and impact, network analysis uses techniques to show hidden patterns and offer a comprehensive understanding of the knowledge structure of a research field or reveal new research trends (Donthu et al., 2021a).
The current study offers a network analysis to present an overview of trends of a top field journal in the Economics of Education. We use one of the largest multi-disciplinary databases, Scopus, to obtain all publications between 1981 and 2022. Note that according to the webpage of the journal, in 1983 no articles were published. Scopus is a well-known research tool for bibliographic research for citation analysis with extensive coverage in social science research (Archambault et al., 2009; Abramo & D’Angelo, 2014; Mongeon & Paul-Hus, 2016).
A network analysis was conducted using the VOS viewer software and Bibliometrix R-package which combine mapping and clustering techniques (Van Eck & Waltman, 2010; Moral-Muñoz et al., 2020; Donthu et al., 2021a). They use standardized weights to create a nodal network of bibliographic data in terms of bibliographic coupling (Kessler, 1963; Martyn, 1964), co-citations (Small, 1973) and co-occurances (Van Eck & Waltman, 2022). Science mapping software has been used extensively in bibliometric reviews of literature in business research (Zupic & Čater, 2015; Gaviria-Marin, et al., 2018; Martínez-López et al., 2018; Donthu et al., 2020a; Donthu et al., 2020b; Eulerich et al., 2022) and finance (Xu et al., 2018; Galletta et al, 2022; Khan et al., 2022; Patel et al., 2022).
We used the term “Economics of Education Review” in the “source title” option in Scopus and retrieved 2220 documents. The documents were further limited to articles, reviews and conference papers and the query yielded a sample of 2211. All of them were retrieved by Scopus in November 2022.
Network analysis
Our study carries out an analysis of the relationships between scientific actors (authors, journals, institutions and countries) by constructing scientific maps of relationships to visualize large scale bibliographic data and discover new areas of interest (Small, 1997). We used VOS viewer software and Bibliometrix R-package to visualize scientific data through bibliographic coupling (Kessler, 1963), co-citations (Small, 1973) and co-occurrences (Van Eck & Waltman, 2022).
Scientific mapping with VOS viewer software
Bibliographic coupling occurs when two publications cite a third common publication (Martyn, 1964) and it allows us to analyze the evolution of a research field (Zupic & Čater, 2015). On the other hand, co-citation occurs when two publications from different journals are cited by a third common publication and it can help us discover the foundations of a research field (Donthu et al., 2021a).
Figure 1 presents the bibliographic coupling of the authors that published in EER between 1981 and 2022. We set a threshold at a minimum of five documents cited at least 100 times and a minimum link strength at 3 (number of cited references two publications have in common). Nodes represent authors and larger nodes indicate most productive authors. The analysis revealed five clusters of 53 authors in the field of economics of education. The distance between the authors indicates their intellectual proximity and the lines illustrate the coupling strength. Dan Goldhaber and Cory Koedel, Ronald Ehrenberg and Dominic Brewer, Eric Hanushek and Dan Goldhaber, Henry Levin and Mun Tsang, Bruce Chapman and Kiatanantha Lounkaew exhibit great coupling strength. These couplings gather over 100 cited references in common indicating great intellectual affinity.
Bibliographic coupling of EER authors between 1981 and 2022. Notes: Nodes illustrate authors and the size of the nodes indicates productivity. The link joining the nodes indicates coupling strength.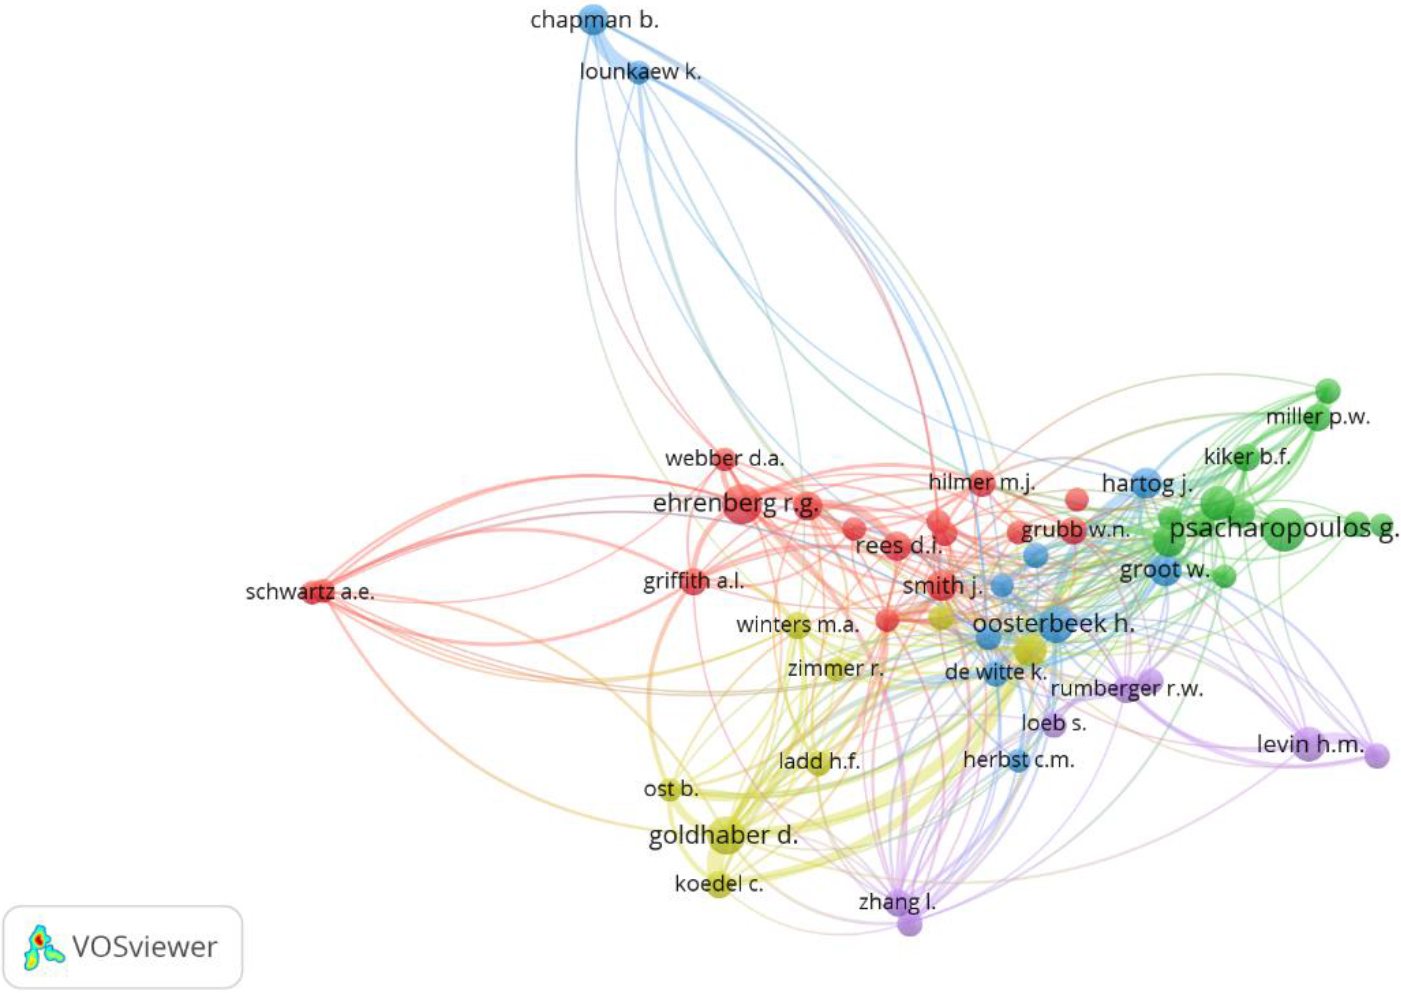
Co-authorship network of authors’ affiliated countries that publish in EER between 1981 and 2022. Notes: Nodes illustrate countries and the size of the nodes indicates productivity. The link joining the nodes indicates degree of collaboration.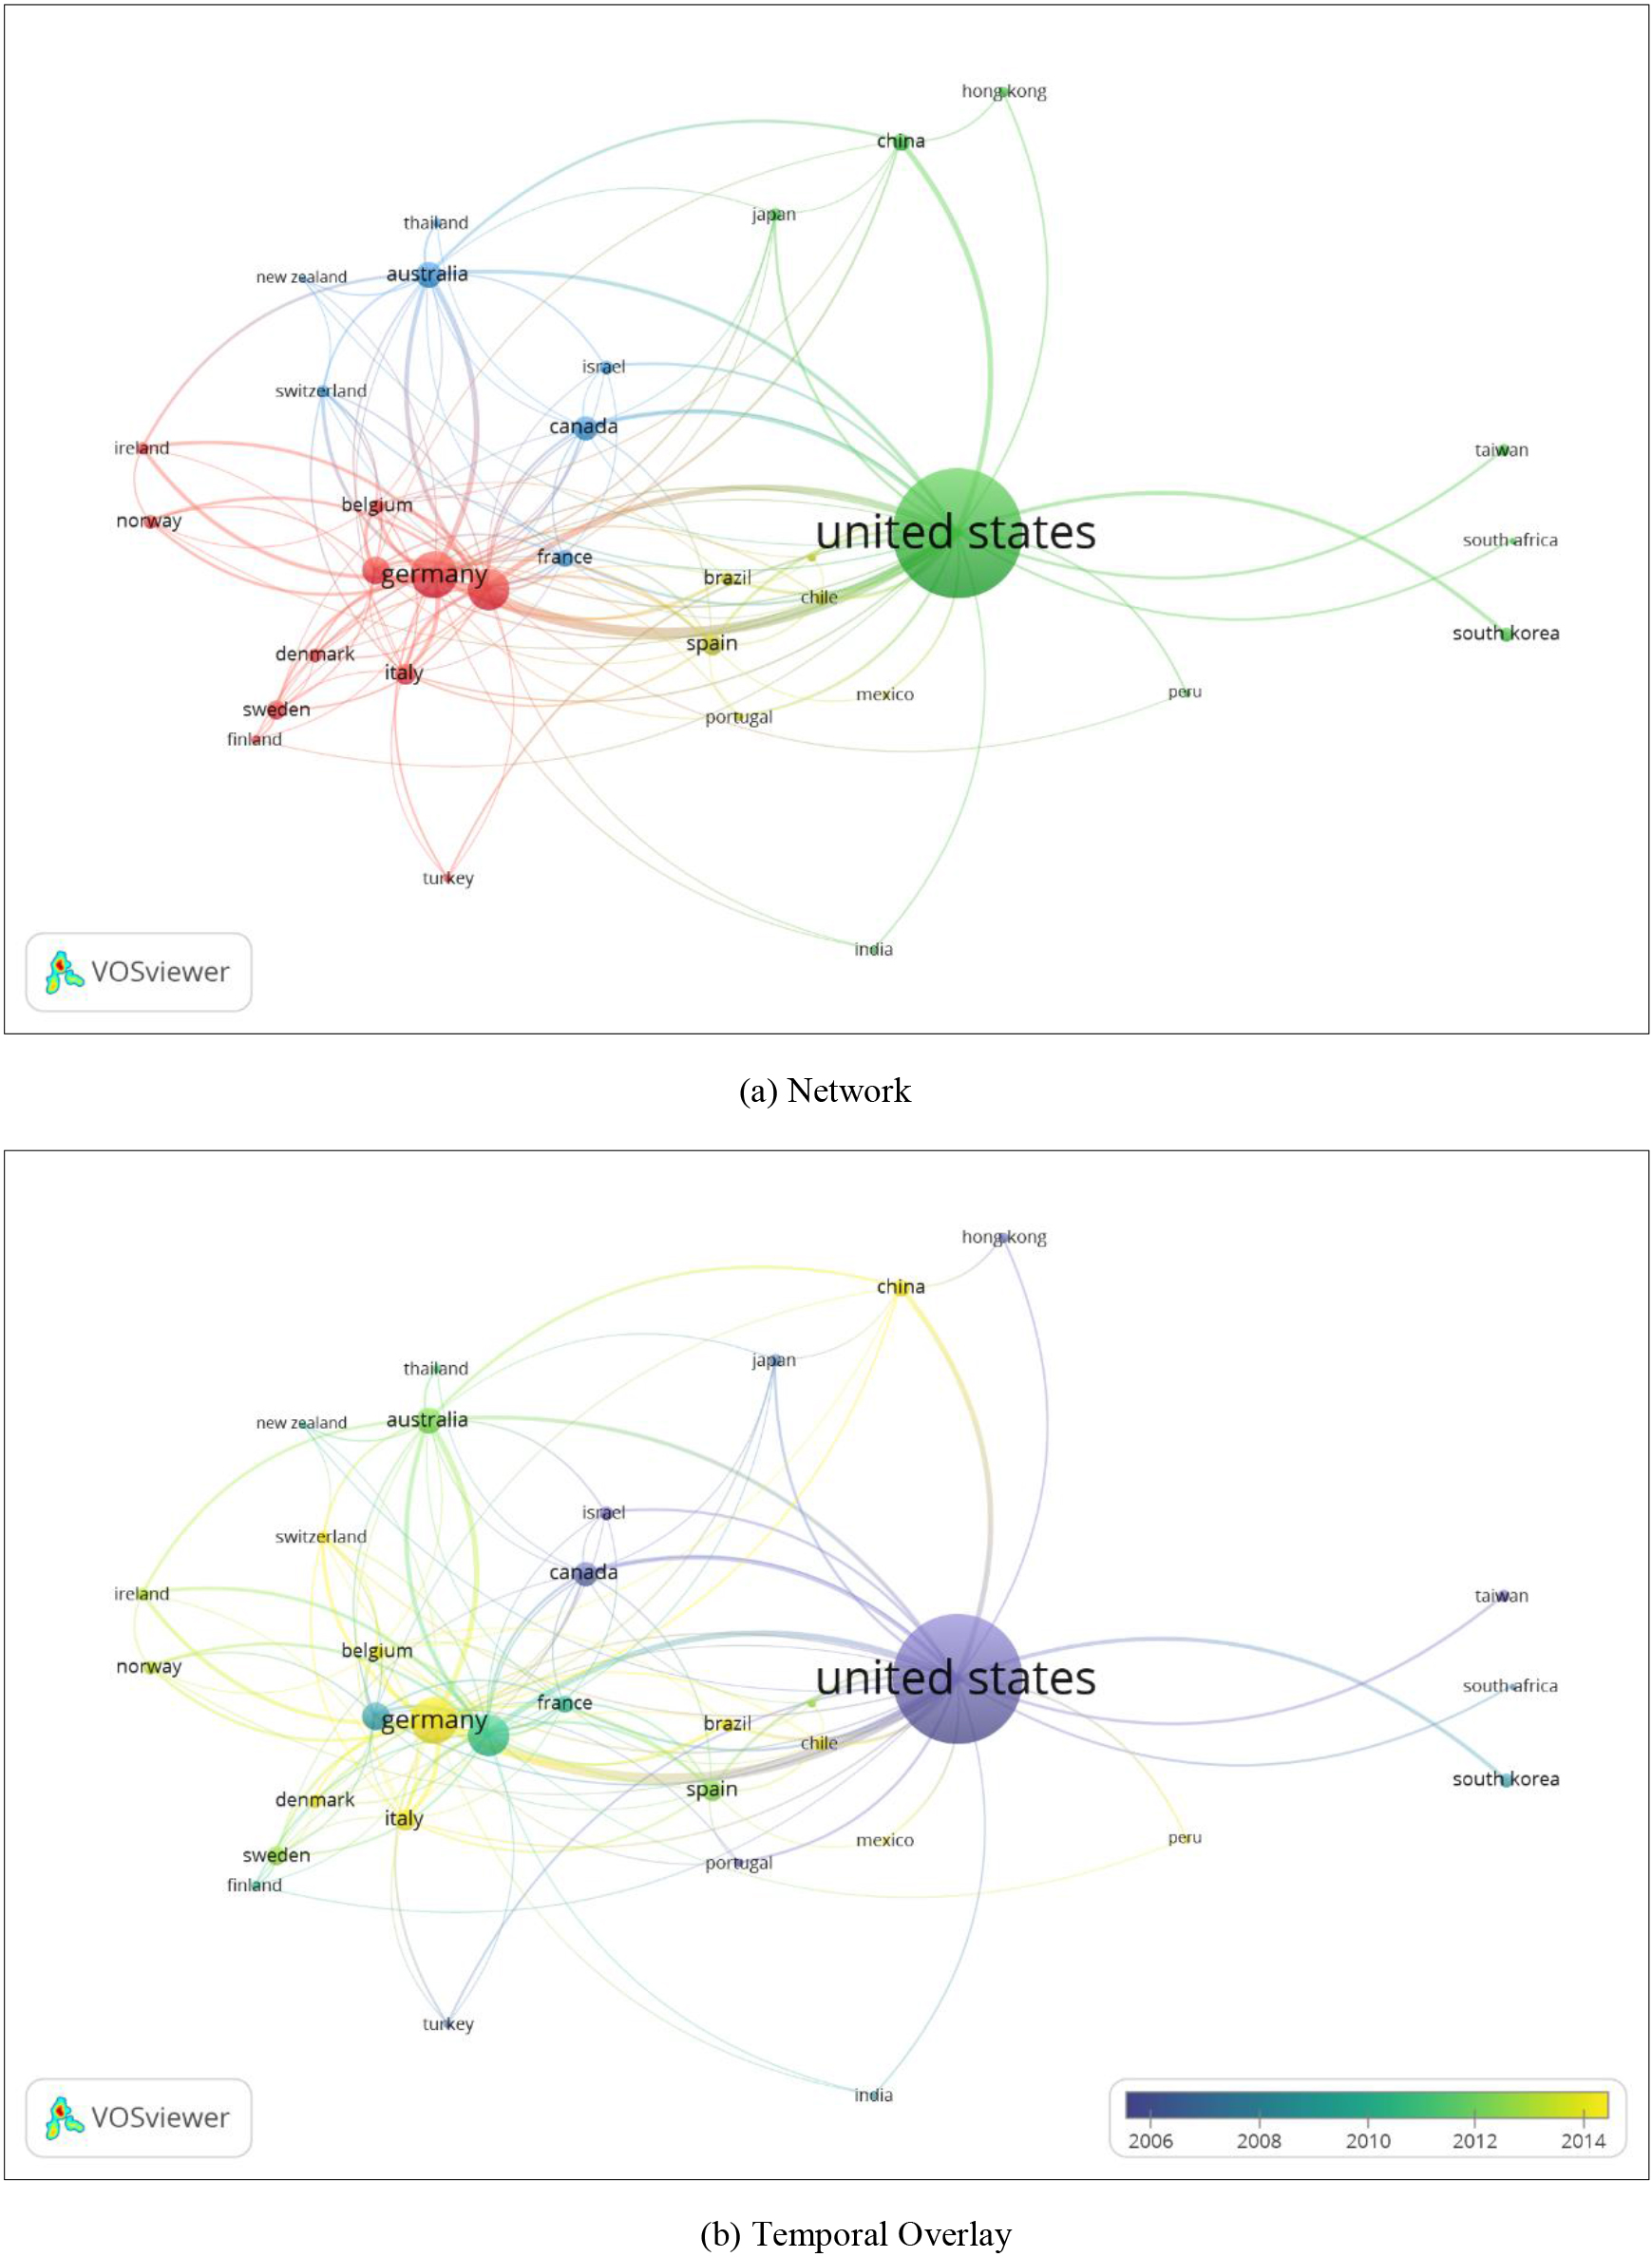
Co-authorship analysis unravels social interactions among authors and their affiliations that form collaborative networks (Donthu et al., 2021a). Figure 2 shows the co-authorship network of authors’ affiliated countries that publish in EER between 1981 and 2022. Nodes represent the affiliated countries, larger nodes indicate higher productivity and higher number of lines indicate a higher degree of collaboration (Van Eck & Waltman, 2022). United States, Asian and African authors form the largest co-authorship network and European authors form the second largest co-authorship network (Fig. 2a). Temporal overlay visualization further allows us to trace the evolution of the collaboration network developed among European and South American authors mainly between 2010 and 2022. United States and Germany, Germany and United Kingdom form the strongest co-authorship connections over time (Fig. 2b).
Figure 3 presents the bibliographic coupling of EER’s author-affiliated countries between 1981 and 2022 in small sub-samples with a minimum link strength at 10 cited references two publications have in common. In the first years (1981–1989), the United States formed a great node with limited connections. The greatest the distance among the countries, the less intellectual proximity among them (Fig. 3a). Between 1990 and 1999, although the United States remained the most productive affiliated country, new nodes have appeared. A rising number of connections depicts that the collaboration network began to grow (Fig. 3b). Between 2000 and 2009, as the distance among affiliated countries diminishes over time, new collaborations formed stronger couples illustrating greater intellectual convergence among authors from different continents (Fig. 3c). Over the last years (2010–2022) European authors formed greater research hubs and developed new collaboration couples with United States and Australian authors (Fig 3d). Overall research collaboration has intensified and more authors from underrepresented continents entered the network of researchers contributing to the field’s latest developments and shared common referencing patterns in EER’s publications.
Bibliographic coupling of countries that publish in EER between 1981 and 2022. Notes: Nodes illustrate countries and the size of the nodes indicates productivity. The link joining the nodes indicates degree of collaboration.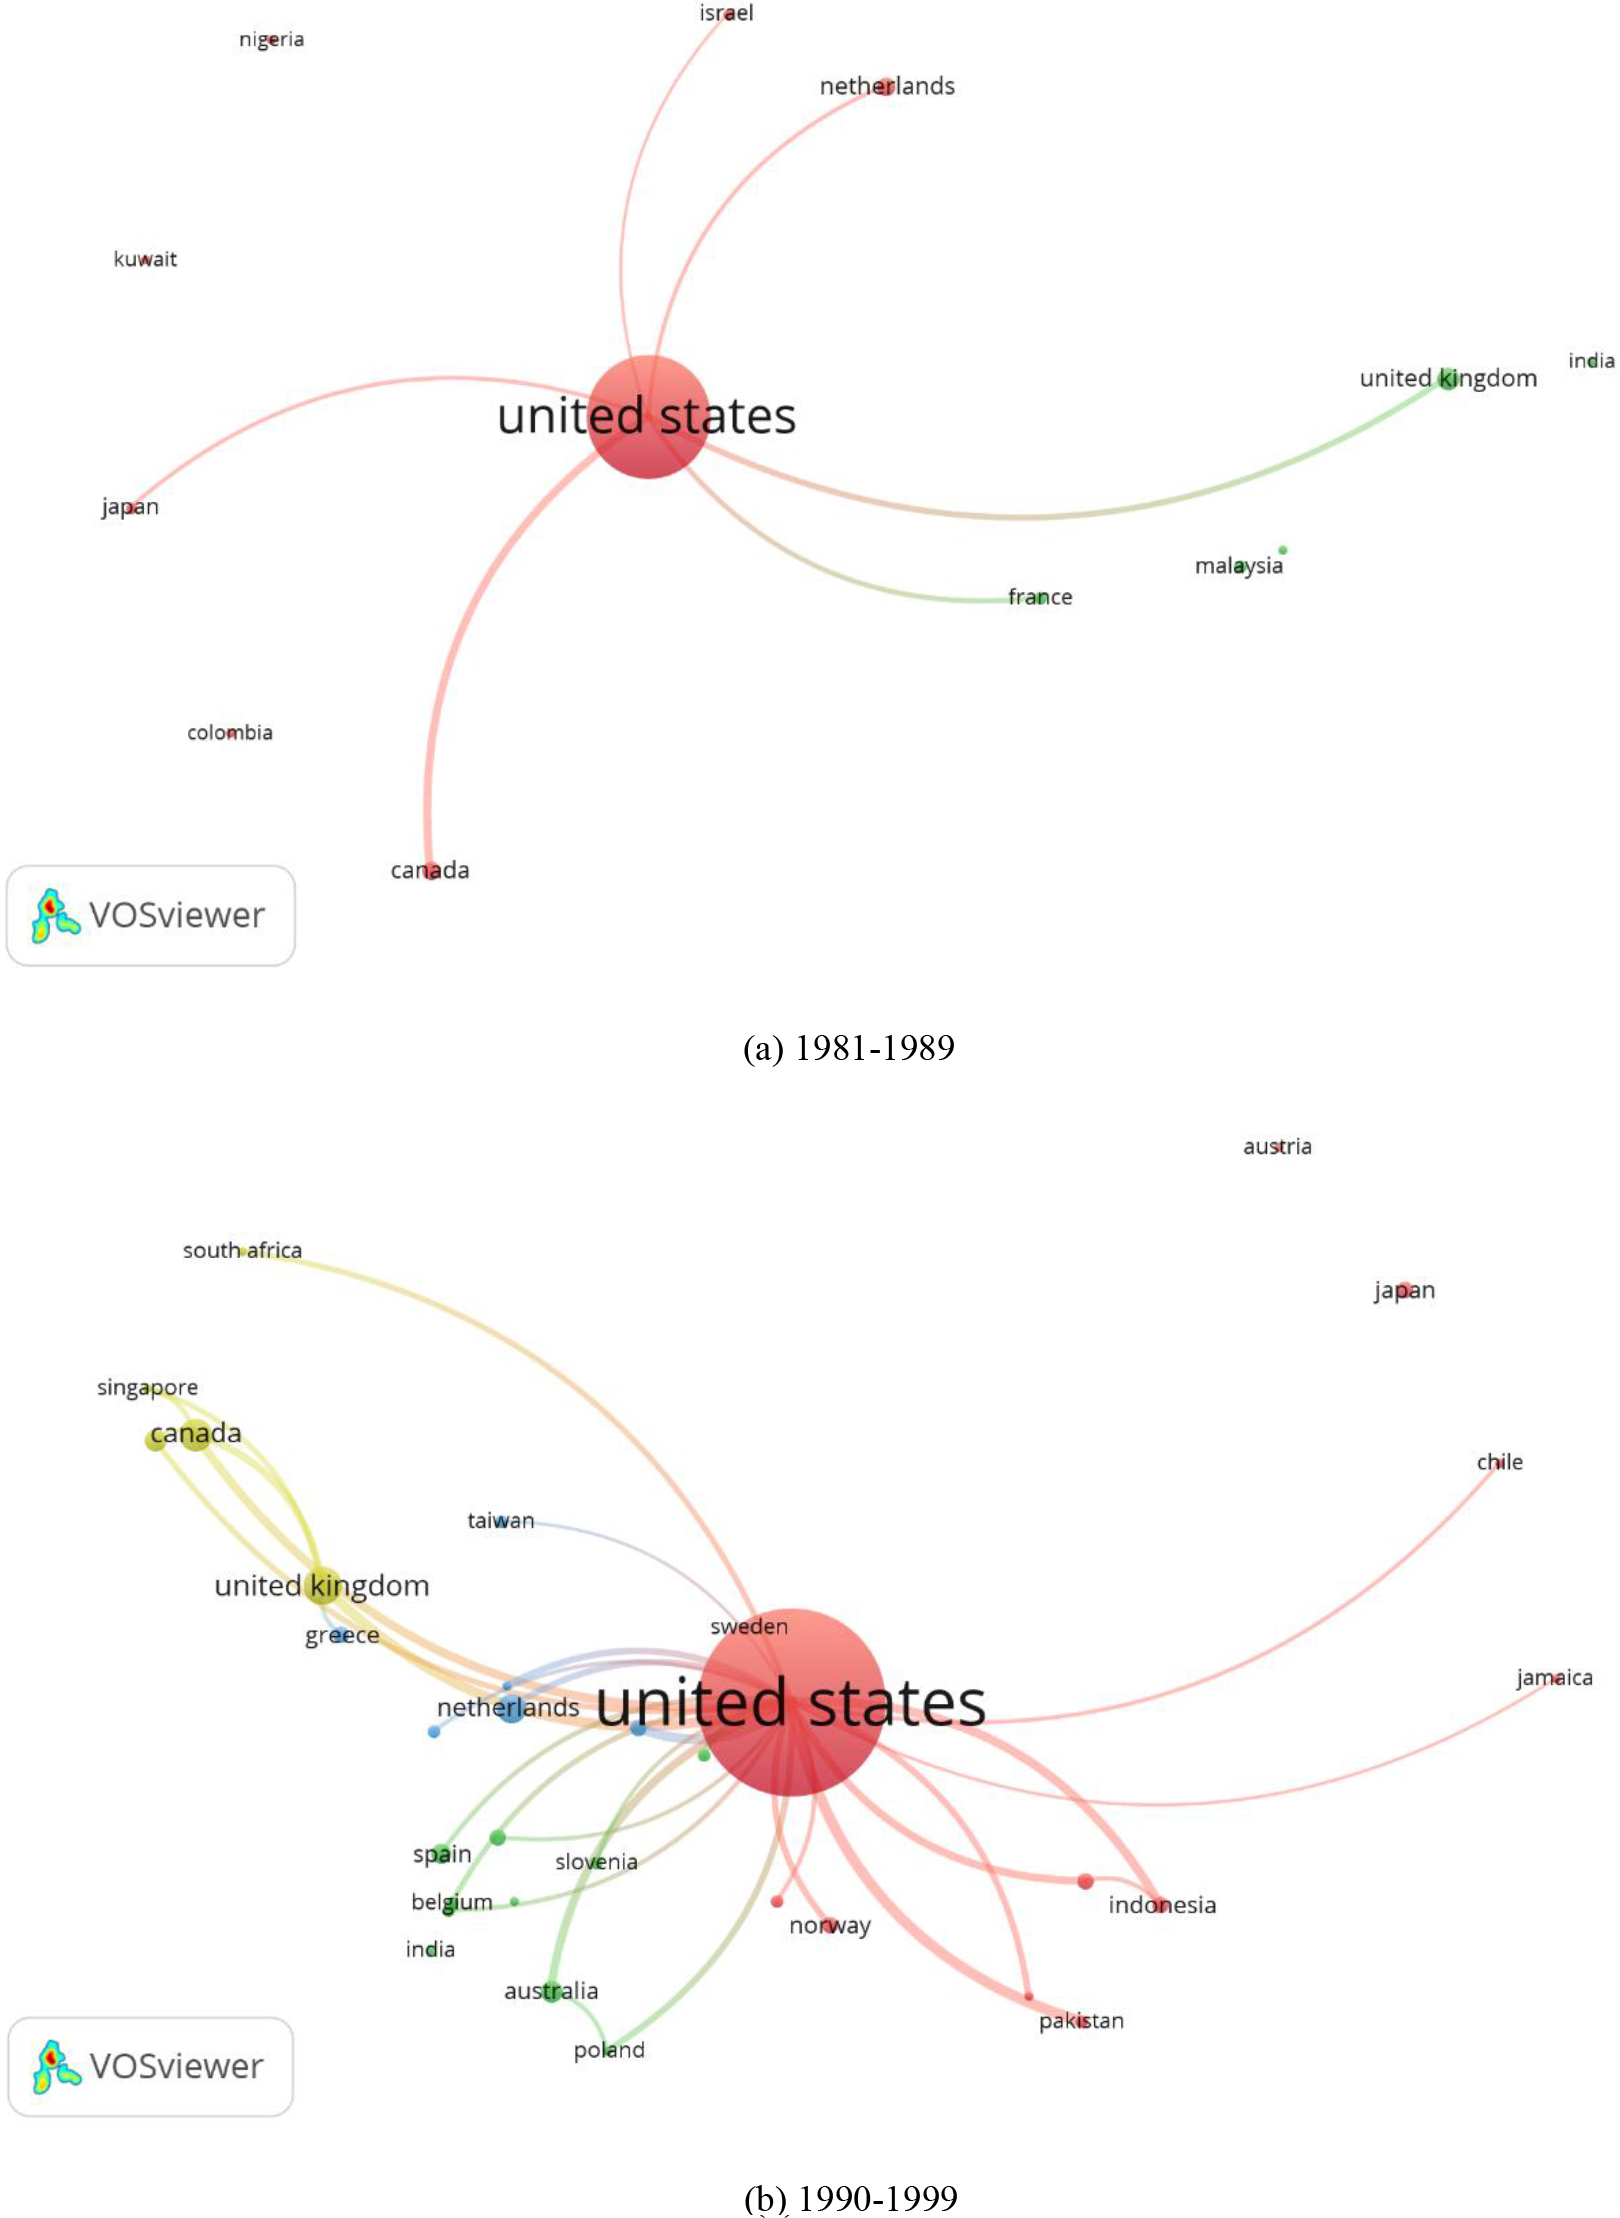
Continued.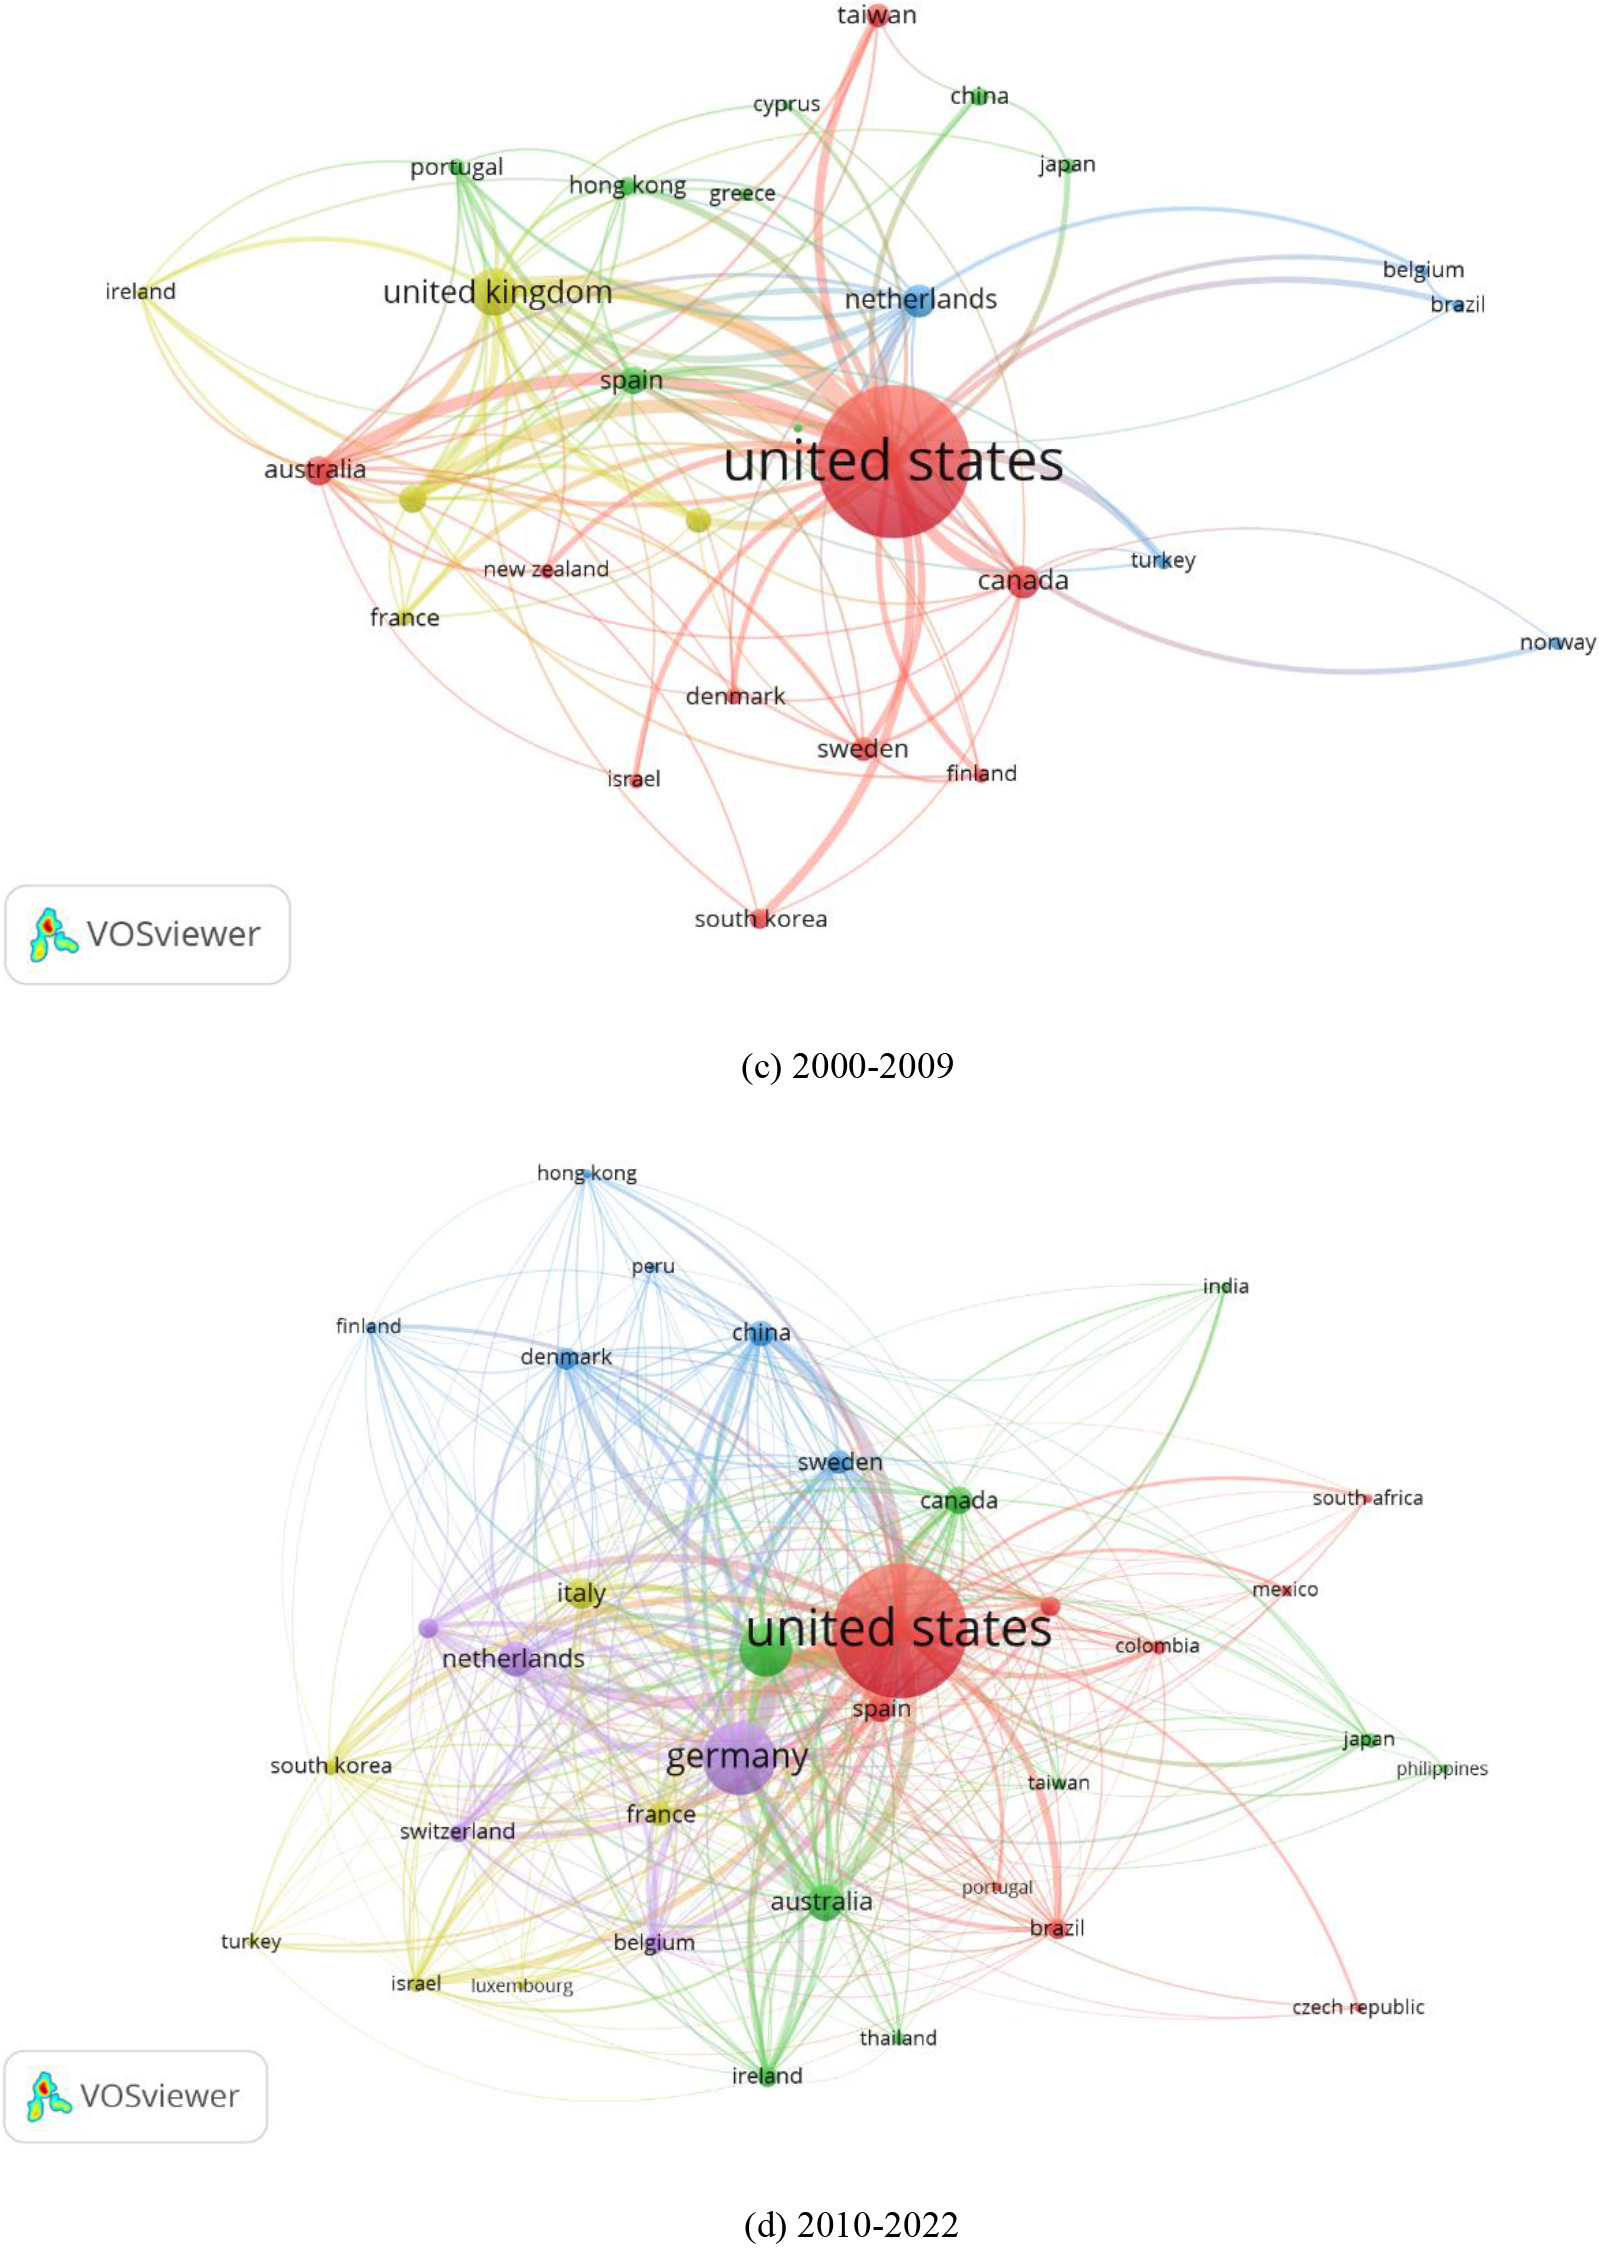
Table 1 presents the share of most influential authors’ affiliated countries in EER’s publications between 1981 and 2022. North America and the United States in particular, are the leading affiliated countries that dominate author’s common references between 1981 and 2022. In the first ten years, the majority of authors influencing research in the economics of education were affiliated with institutions in the United States (86.03%). Authors affiliated with institutions in Australia and Oceania, Africa, Asia and South America were underrepresented. Although, the number of authors from underrepresented continents has grown between 1990 and 2022, it still remains relatively low. On the other hand, the share of European authors has increased from 7.86% between 1981 and 1989 to 40.62% between 2010 and 2022. This ascending number of European authors entering the research hubs formed in research area of economics and education indicates that collaboration between countries gradually intensified and more authors from different continents exhibit intellectual proximity over time (Fig. 4).
Share of influential authors’ affiliated countries between 1981 and 2022
Share of influential authors’ affiliated countries between 1981 and 2022.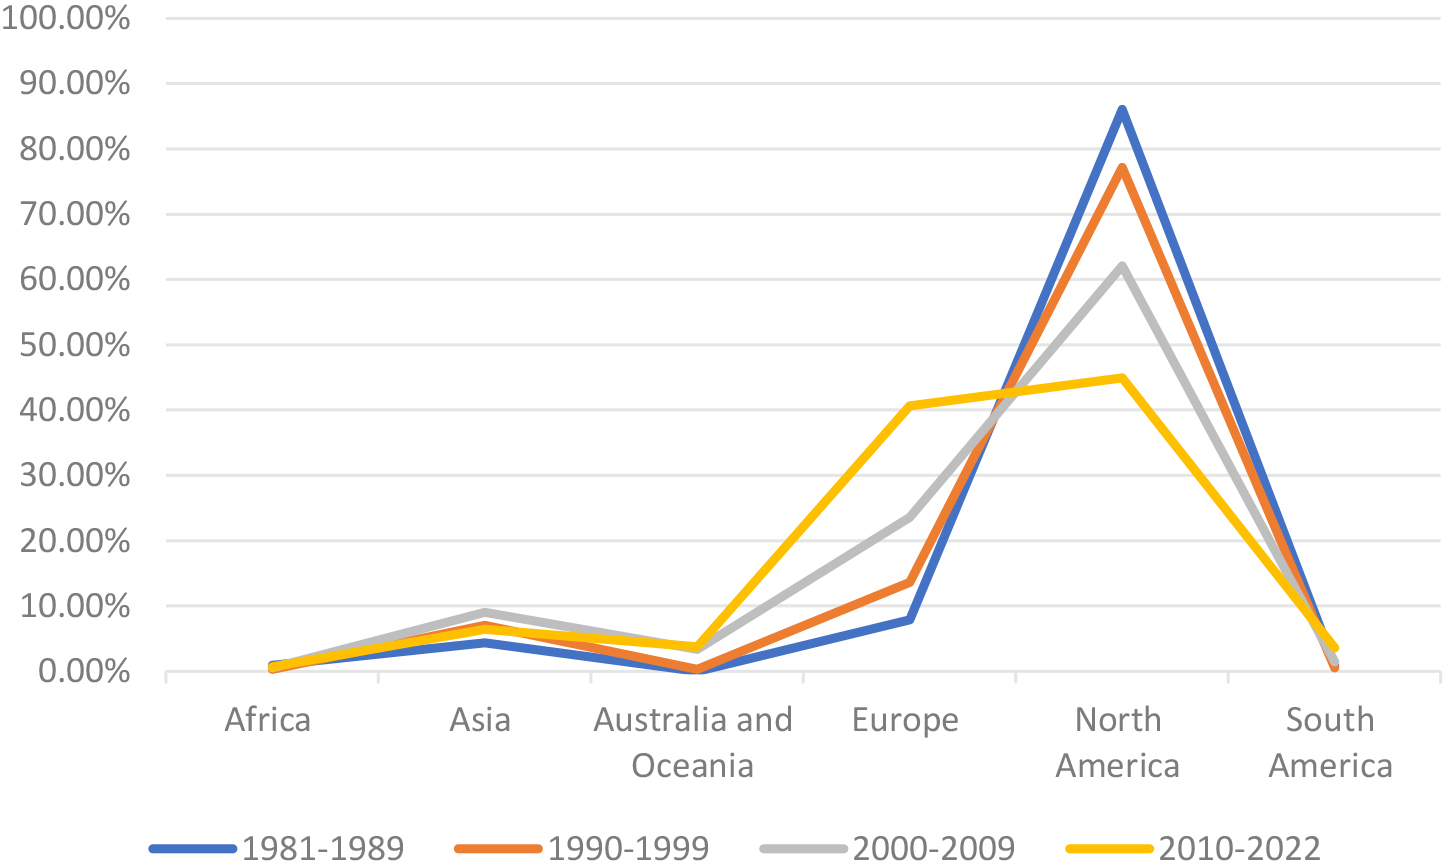
Co-citation analysis of journals cited by EER authors between 1981 and 2022. Notes: Nodes illustrate cited journals and the size of the nodes indicates influence. The link joining the nodes indicates degree of interaction.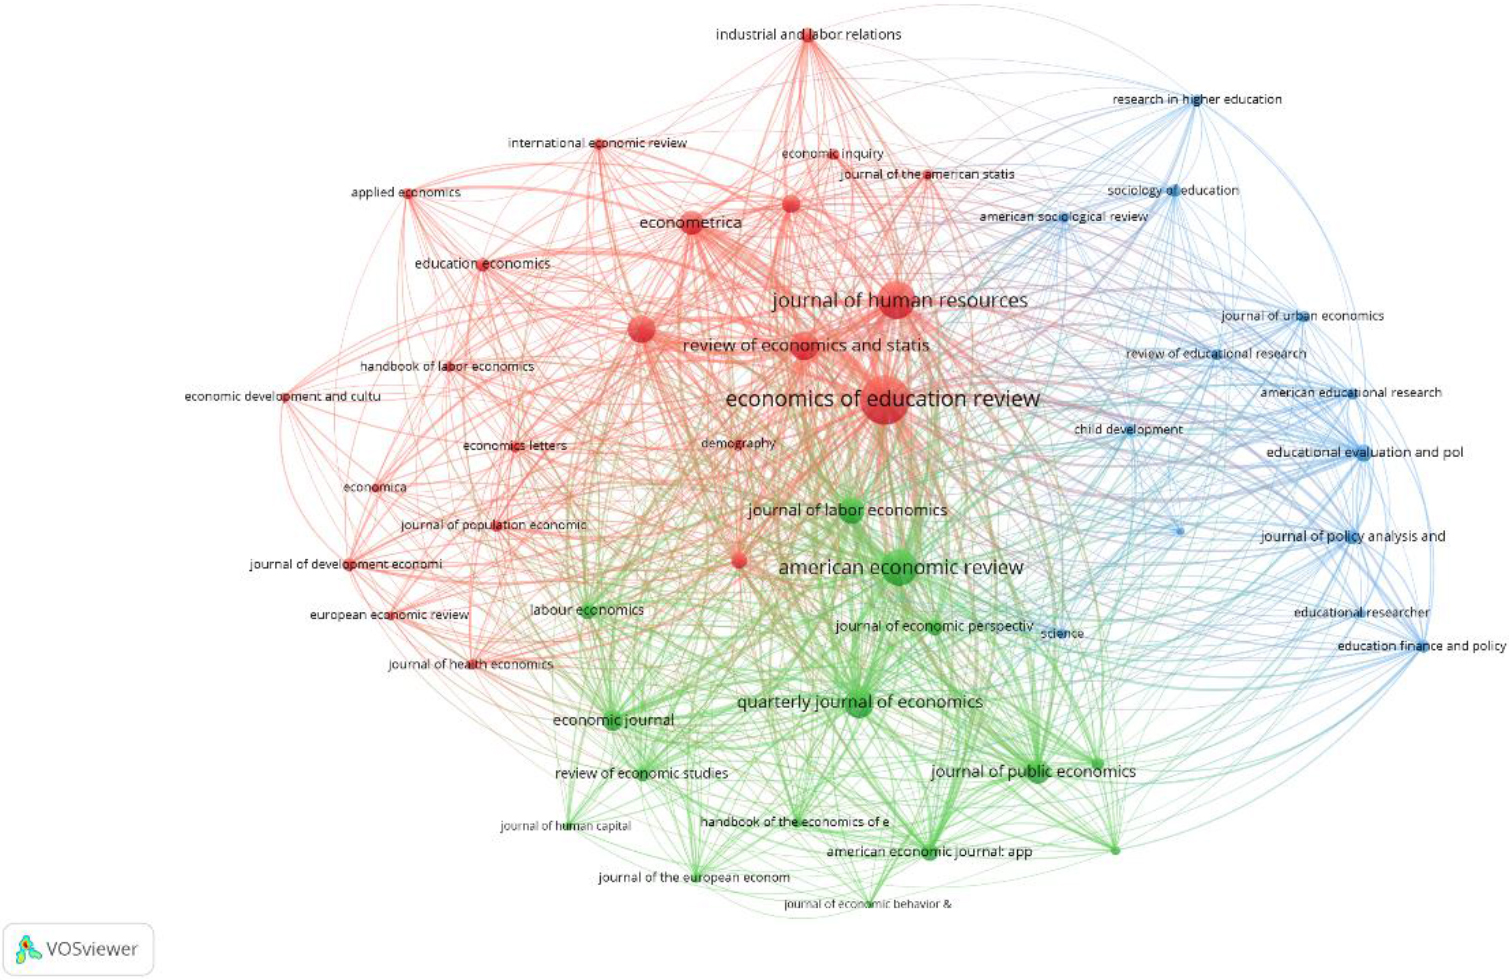
We performed a co-citation analysis to further understand the journal’s knowledge structure and map the networks of most cited journals by EER’s authors. Figure 5 presents the co-citation analysis of journals cited by EER authors between 1981 and 2022 with a threshold of 50 citations and the 50 most representative connections. Three clusters were formed corresponding to the journals’ research field that consist of journals in the broader area of economics, education and social sciences. The first and second cluster include journals in the area of economics such as American economic review, Quarterly Journal of Economics, Journal of Labor Economics, Econometrica, Journal of Human Resources. The third cluster consists of journals in the area of education, such as Research in Higher Education and American Educational Research Journal, and interdisciplinary journals in the broader area of social sciences, such as Science and Child Development.
Author keyword co-occurrence map bases on documents published in EER between 1998 and 2022. Notes: Nodes illustrate author keywords and the size of the nodes indicates occurrences. The link joining the nodes indicates the frequency of co-occurance.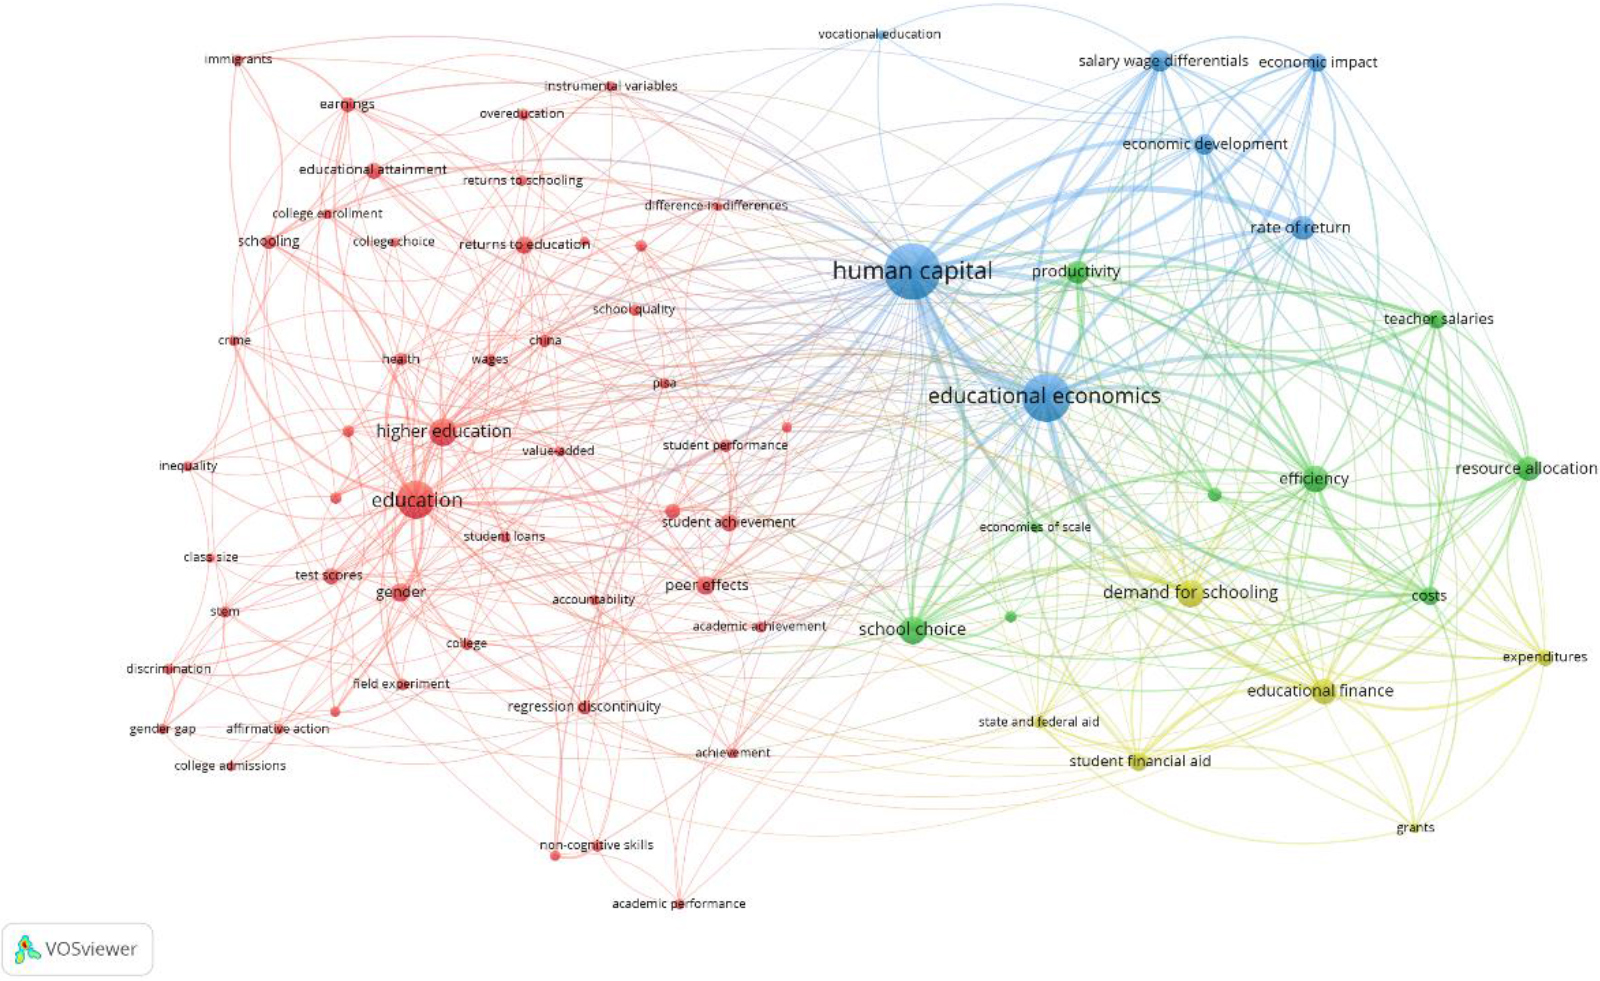
Co-word analysis employs text that co-occur in the actual content of the publications from “titles”, “author keywords”, “abstracts” to “full texts” to identify trend topics that compose a research field and to predict future trajectories (Hallinger & Kovačević, 2019; Donthu et al., 2020c; Baker et al., 2021; Donthu et al., 2021a). Keywords assigned by authors allows us to observe the emerging topics of EER’s publications. EER introduced author keywords in 1998. Figure 6 analyses the co-occurrence of author keywords for documents published in EER between 1998 and 2022 with a threshold of at least 10 occurrences. “Human Capital” (310) and “Educational Economics” (228), the most frequently co-occurring keywords, are located in the center of the map and at the core of EER’s thematic development. These results represent the amplitude of trend topics published in EER and are in line with its scientific domain. “Human capital” and “Educational Economics” also exhibit the strongest link, followed by “Human capital” and “Rate of Return”.
Figure 7 present 20 most frequent topics that have been published in EER between 1998 and 2022. Apart from “Human capital” and “Educational Economics”, “Higher Education”, “Education”, “Educational Finance”, “Efficiency”, “Rate of Return”, “Demand for Schooling”, “School Choice” and “Resource allocation” are among the most frequent research issues authors that publish in EER promoted over the years. Moreover, the results show emerging keyword trends such as “regression discontinuity”, “test score”, “educational achievement” and “peer effects”.
Trend topics in EER between 1998 and 2022.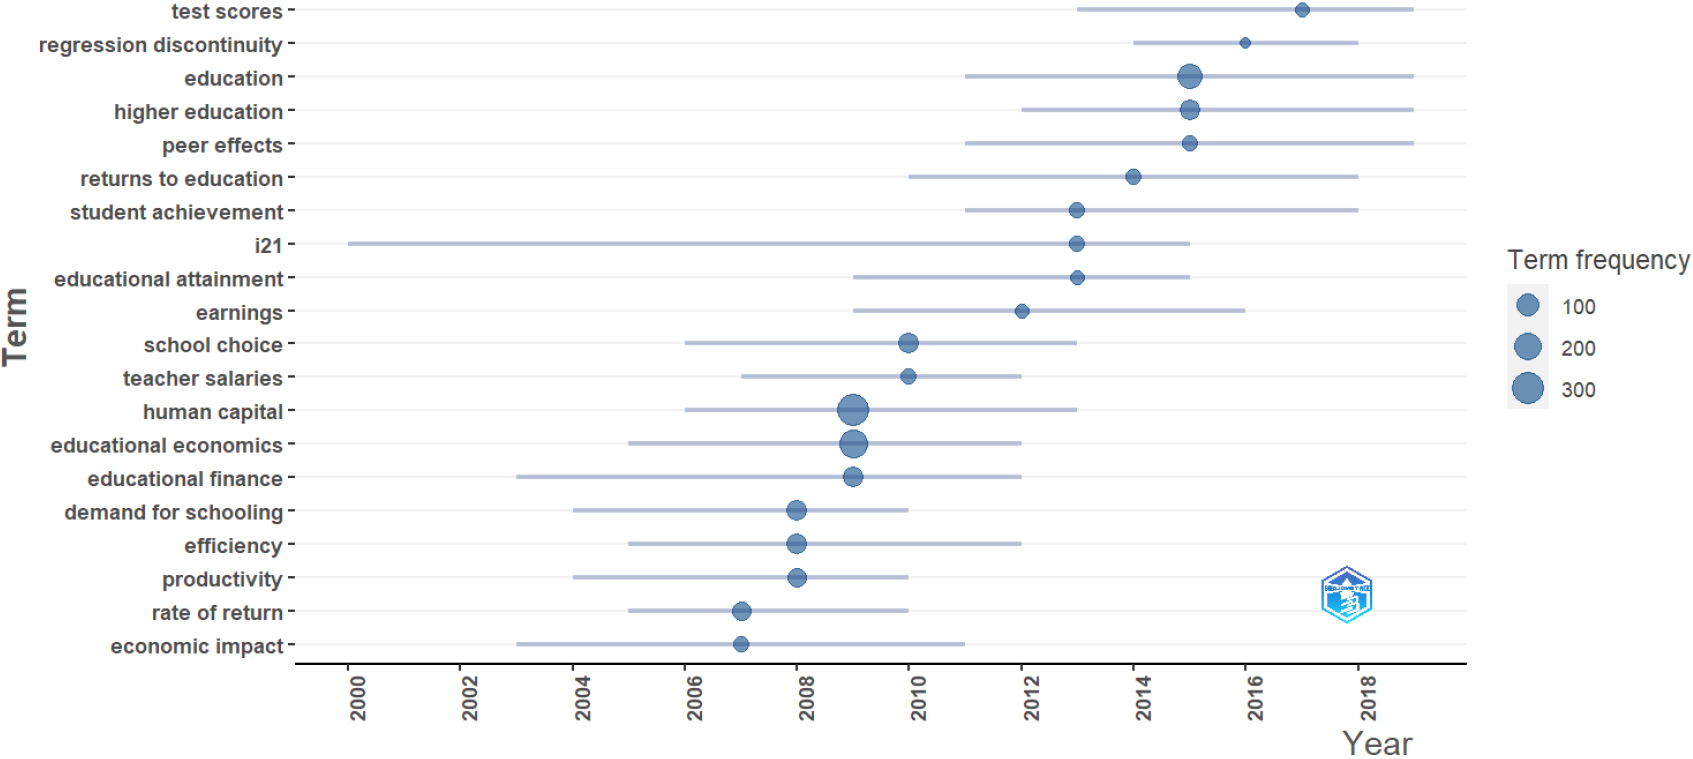
Trend topics in EER between 1998 and 2022.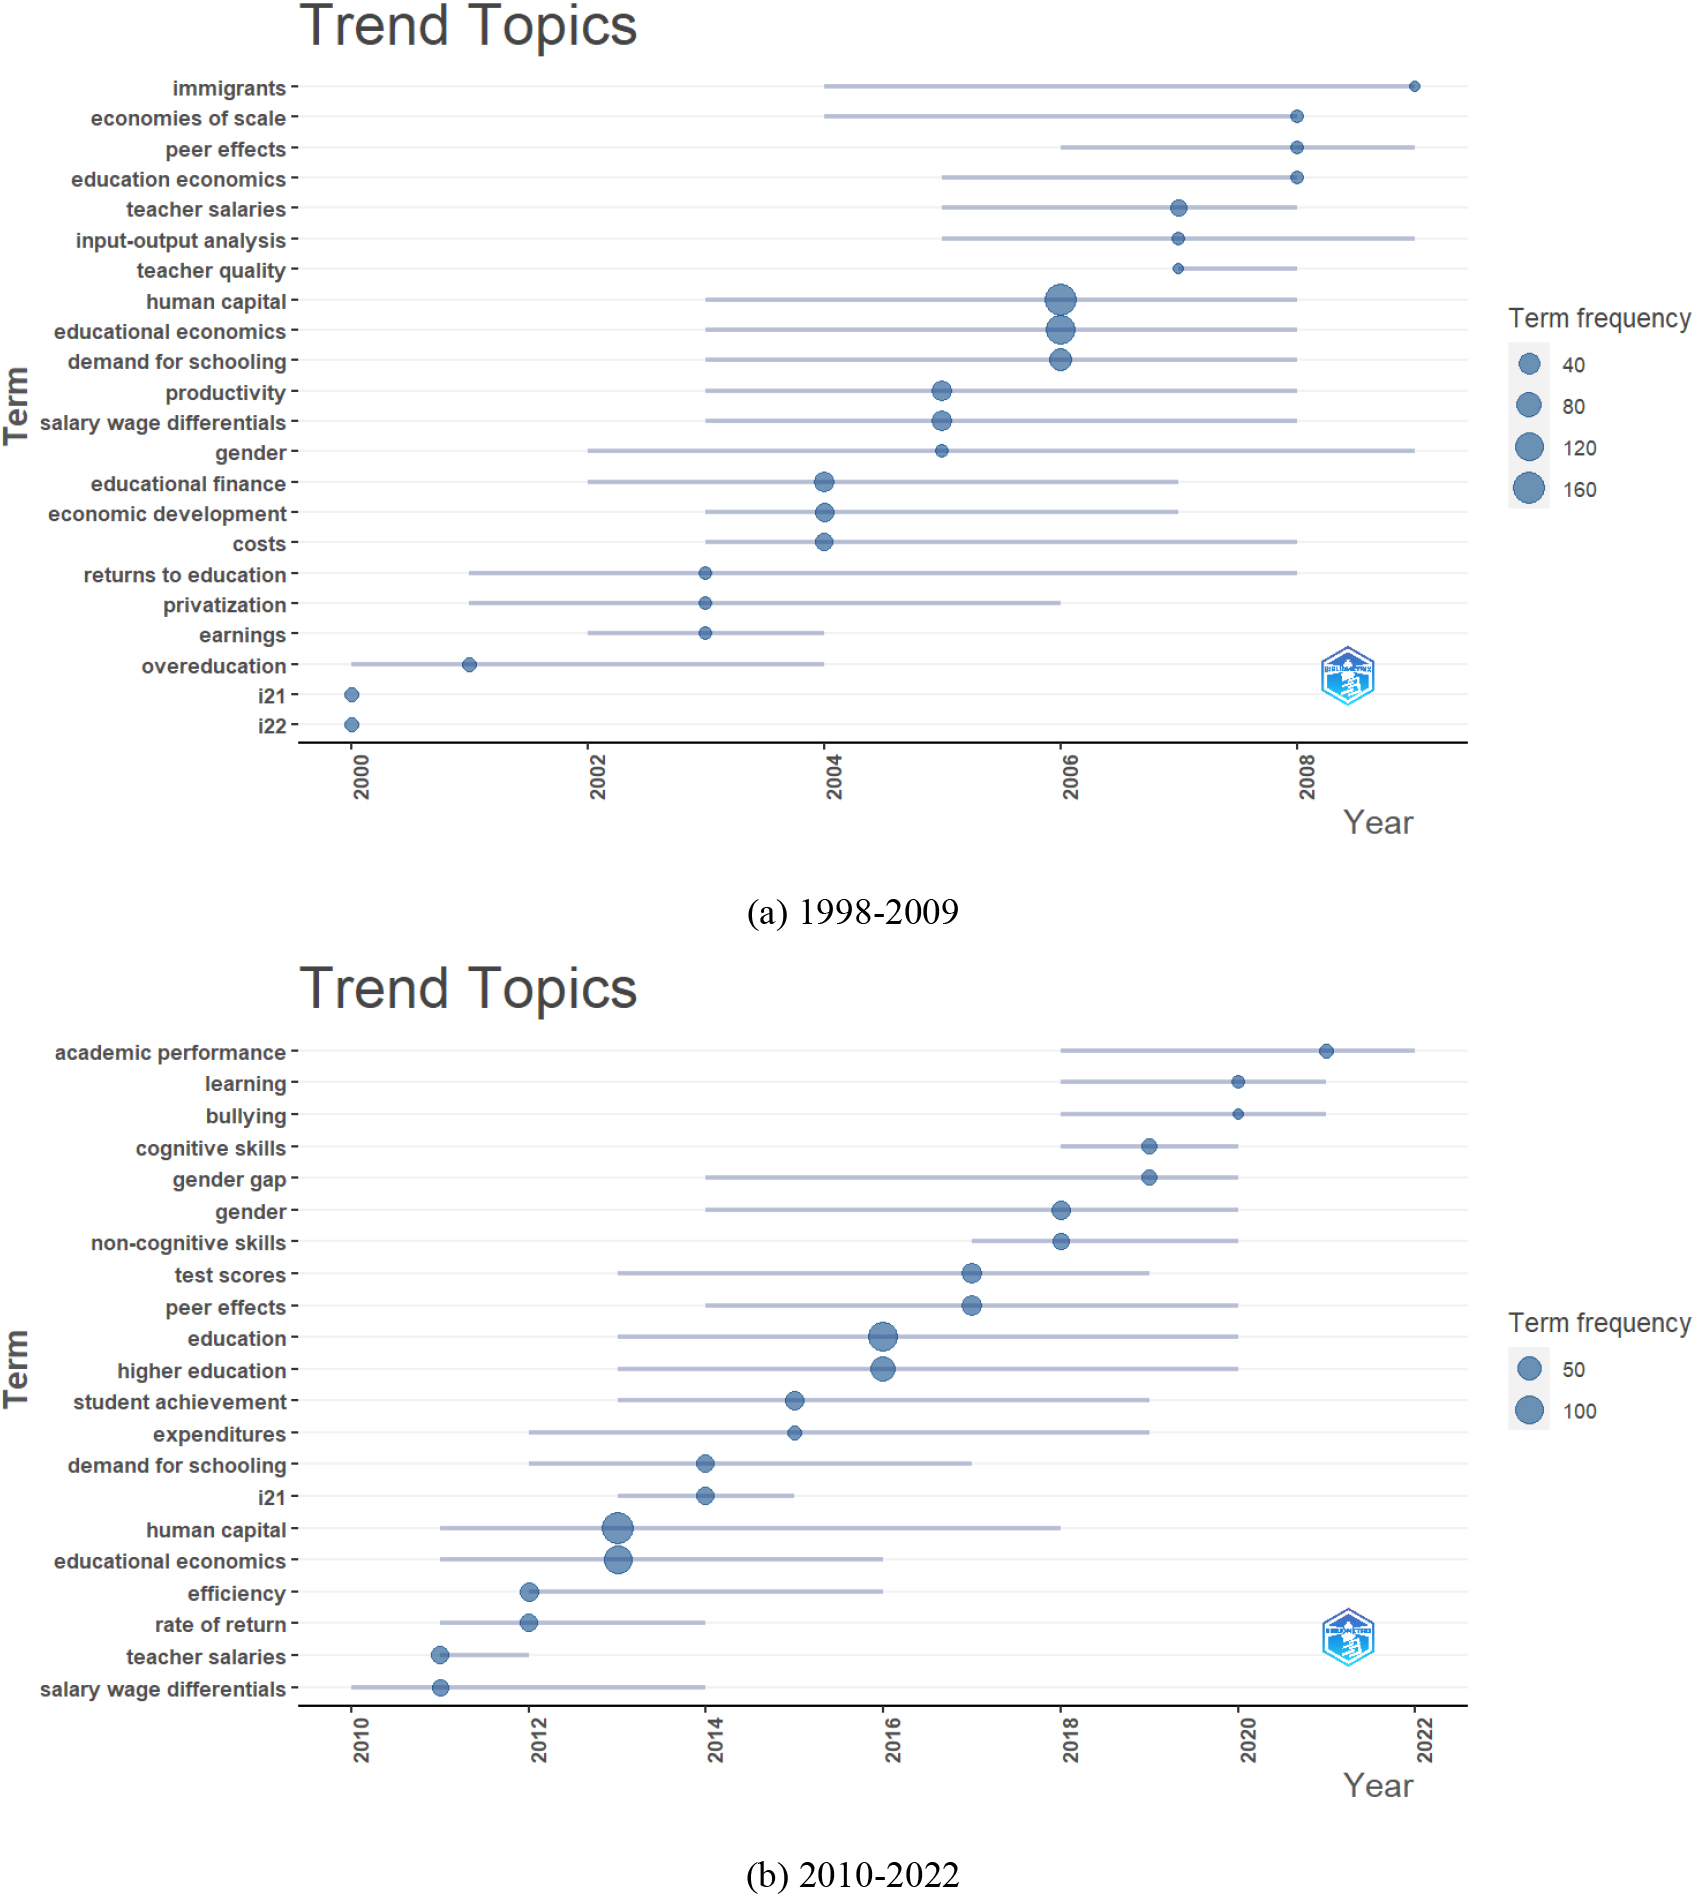
Figure 8 graphically depicts the most frequently published author keywords in EER between 1998 and 2022. Between 1998 and 2009, “human capital”, “education” and “educational economics” dominated in EER publications. Among other maturing topics at that time were “demand for schooling”, “salary wage differentials”, “gender”, “productivity”, “educational finance”, “economic development” and “costs” (Fig. 8a). Regarding more recent years, “human capital”, “education” and “educational economics” remained among the trending topics. Other topics attracting research attention are “higher education”, “gender”, “gender gap”, “cognitive skills”, “bullying”, “learning”, “student achievement” and “academic performance” (Fig. 8b).
Our analysis revealed six clusters from 1722 documents based on bibliographic coupling analysis of the EER articles published between 1996 and 2022 (Fig. 9). Table 2 summarizes an overview of the six clusters including the five most influential publications in each cluster and total citation number. Larger nodes in Fig. 9 represent most influential publications of each cluster further analyzed in Table 2. By using the bibliographic coupling of documents, where two articles cite a third common article (Martyn, 1964), we will present the evolution of EER’s publications to reveal new lines of research in the area of economics of education. Connections among nodes form a research hub expressing academic proximity of the cluster of documents and show present development of themes in a research field (Donthu et al., 2021a). In our research, each cluster was named based on the major topics explored indicating the central focus of each cluster which is a process similar to naming factors at factor analysis (Baker et al., 2021).
3.1.3.1. Cluster 1 – Human capital and returns to education
Cluster 1 is the most influential cluster with 12573 citations. It consists of 287 EER publications between 1996 and 2022. The most frequently appearing author keywords presented in this cluster human capital, returns to education, educational attainment, labor market, rate of return, employment, wage determination, economic
Clustering of EER publications based on bibliographic coupling of documents
Clustering of EER publications based on bibliographic coupling of documents
Bibliographic coupling of documents published in EER between 1981 and 2022. Notes: Nodes illustrate documents and the size of the nodes indicates influence. The link joining the nodes indicates degree of collaboration.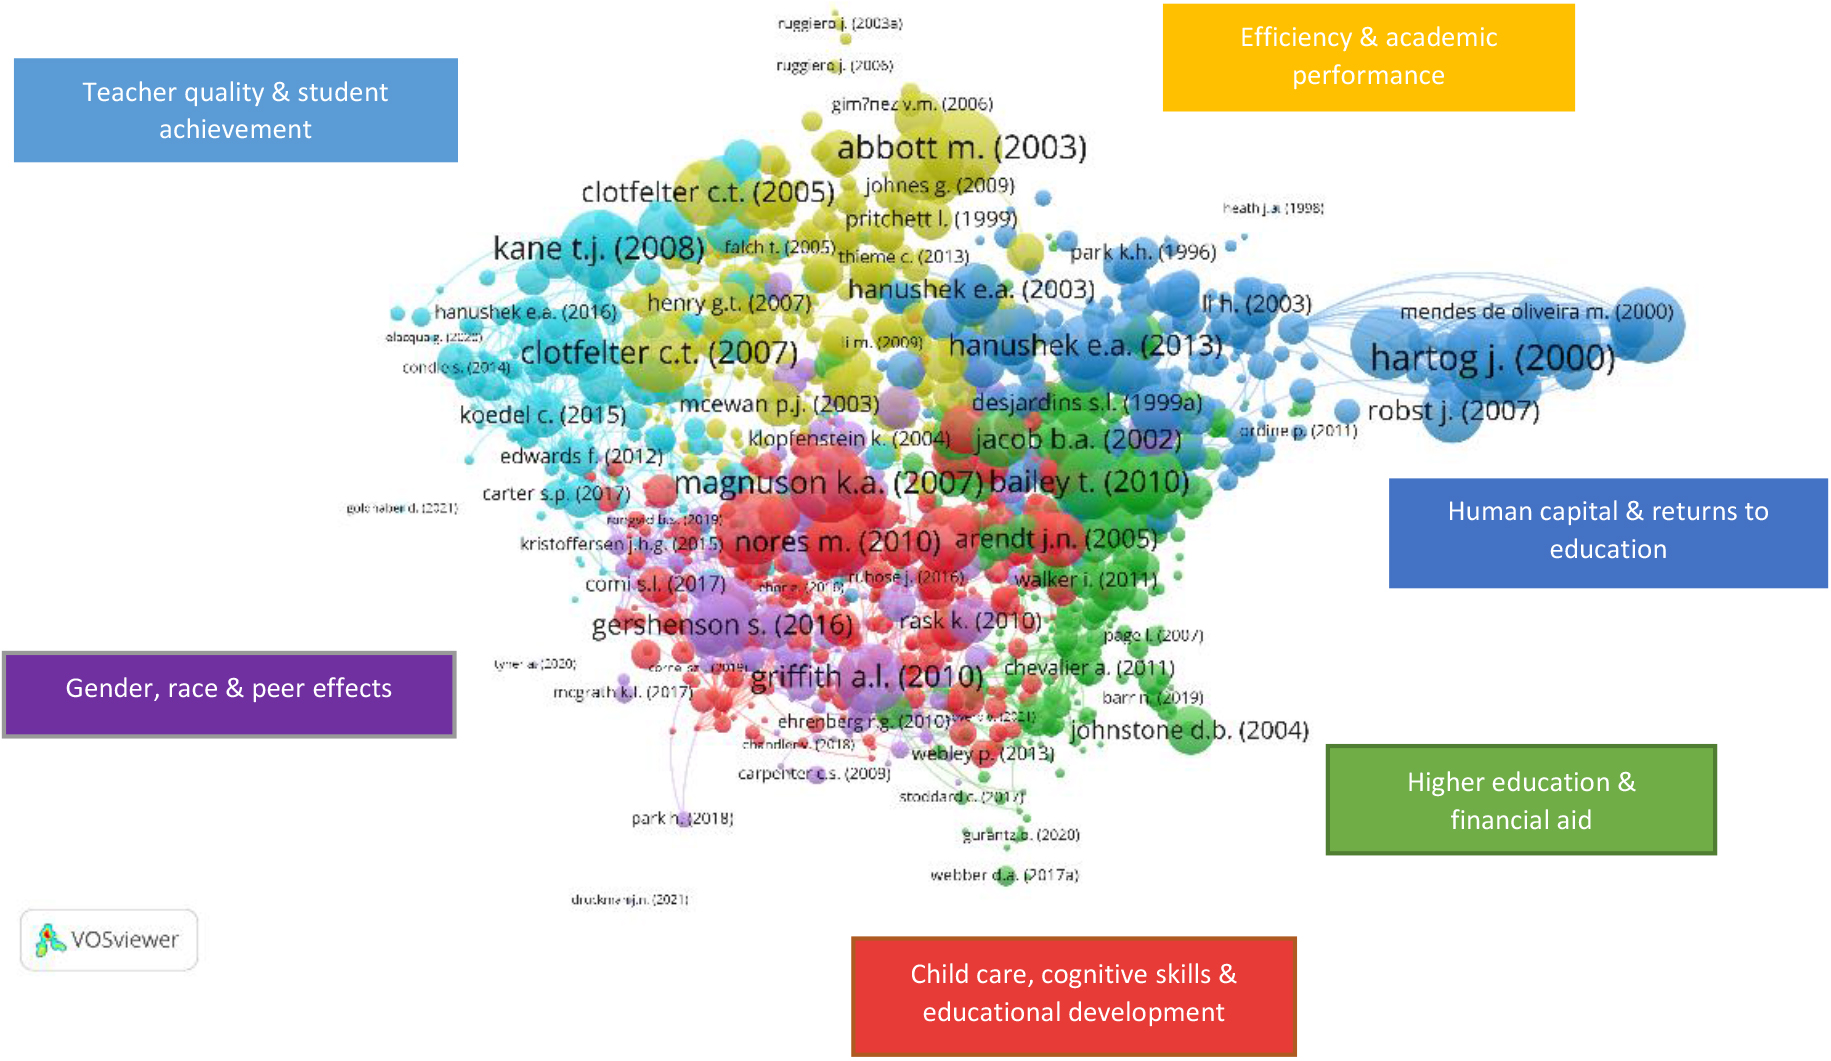
development, training, economic impact. Hartog (2000) is the most cited article with 546 citations. The study discusses the incidence of over- and undereducation by using empirical results from five countries and investigates their relationship to the earnings function. The second most cited article in this cluster is Groot et al. (2000) with 361 citations. Groot et al. (2000) conducted a meta-analysis of research on over- and undereducation in the labor market published between 1981 and 2000 and conclude that labor force growth rate positively effects overeducation whereas unemployment rate negatively effects the rate of return to education. Dolton and Vignoles (2000) is the third most influential publication in this cluster with 320 citations. The authors exploited data on graduate overeducation in the U.K. to uncover that return on surplus education is less than return on required education and to further support that earnings of the overeducated are determined by job requirements.
3.1.3.2. Cluster 2 – Higher education and financial aid
Cluster 2 consists of 389 EER publications between 1996 and 2022 with 9762 citations. The most dominant keywords presented in this cluster include higher education, university sector, financial aid, income, educational finance, demand for schooling, salary wage differentials. The most cited article in this cluster is Bailey et al. (2010) with 331 citations. The authors analyze student progression through developmental education in community colleges and note low completion rates due to the confusion created by the developmental system. Jacob (2002) is the second most influential article with 240 citations. The author reports higher returns to college and greater non-cognitive skills among women. Hamermesh and Parker (2005) ranks third with 222 citations. The authors report a positive effect of professors’ beauty on instructional ratings and on educational productivity generating earnings differences.
3.1.3.3. Cluster 3 – Child care, cognitive skills and educational development
Cluster 3 consists of 422 EER publications between 1996 and 2022 receiving 9337 citations. The most frequently appearing author keywords presented in this cluster include child care, cognitive skills, educational development, primary education, learning, education policy, secondary education, education reform, health, regression analysis, regression discontinuity. Magnuson et al. (2007) most influential study receiving 395 citations reveal fading positive effects of prekindergarten on math and reading performance at school entry and persisting negative effects on behavior. The second most influential document is Loeb et al. (2007) with 356 citations. Loeb et al. (2007) report cognitive benefits of attending center care in pre-reading and math skills with greater gains at starting age two or three, but negative effects on social behavior. Authors also notice that results on center intensity vary by race and income level. Nores and Barnett (2010) is the next most cited document with 283 citations. They report substantial cognitive, behavior, health and schooling benefits from early childhood interventions by analyzing data from 56 studies in 23 countries in Europe, Asia, Africa, Central and North America.
3.1.3.4. Cluster 4 – Efficiency and academic performance
Cluster 4 consists of 261 EER publications between 1996 and 2022 receiving 8613 citations. Articles included in this cluster tend to focus on efficiency, academic performance, school choice, university sector, secondary education, resource allocation, efficiency measurement. Abbott and Doucouliagos (2003) is the most cited article with 414 citations. The authors estimated the technical and scale efficiency of Australian government universities using non-parametric techniques. Clotfelter et al. (2007) ranks second with 387 citations. The study suggests that a variety of teacher credentials such as teacher’s experience, test scores and regular licensure effect student achievement with larger effects on math achievement. The third most cited article is Johnes (2006) with 316 citations. The article provides an overview of methods measuring efficiency in the higher education context and suggests that data envelopment analysis (DEA) has the advantage.
3.1.3.5. Cluster 5 – Teacher quality and student achievement
Cluster 5 consists of 193 EER publications between 1996 and 2022 receiving 5706 citations. Articles included in this cluster tend to focus on teacher quality, teacher training, teacher salaries, productivity, student achievement, wage determination. The most cited article in this cluster is Kane et al. (2008) with 377 citations. The authors discuss that classroom performance is a more reliable predictor of student achievement than teacher certification and teacher experience. The second most influential document is Hanushek (2011) with 289 citations. The author provides an overview on the relationship between teacher quality and student achievement and put outcome gains for students in economic perspective by suggesting differential pay based on teacher effectiveness. Scafidi et al. (2007) rank third with 205 citations. The article provides evidence that teacher turnover/mobility in the beginning of their careers is affected by the large proportions of minority students.
Evolution of the six EER clusters.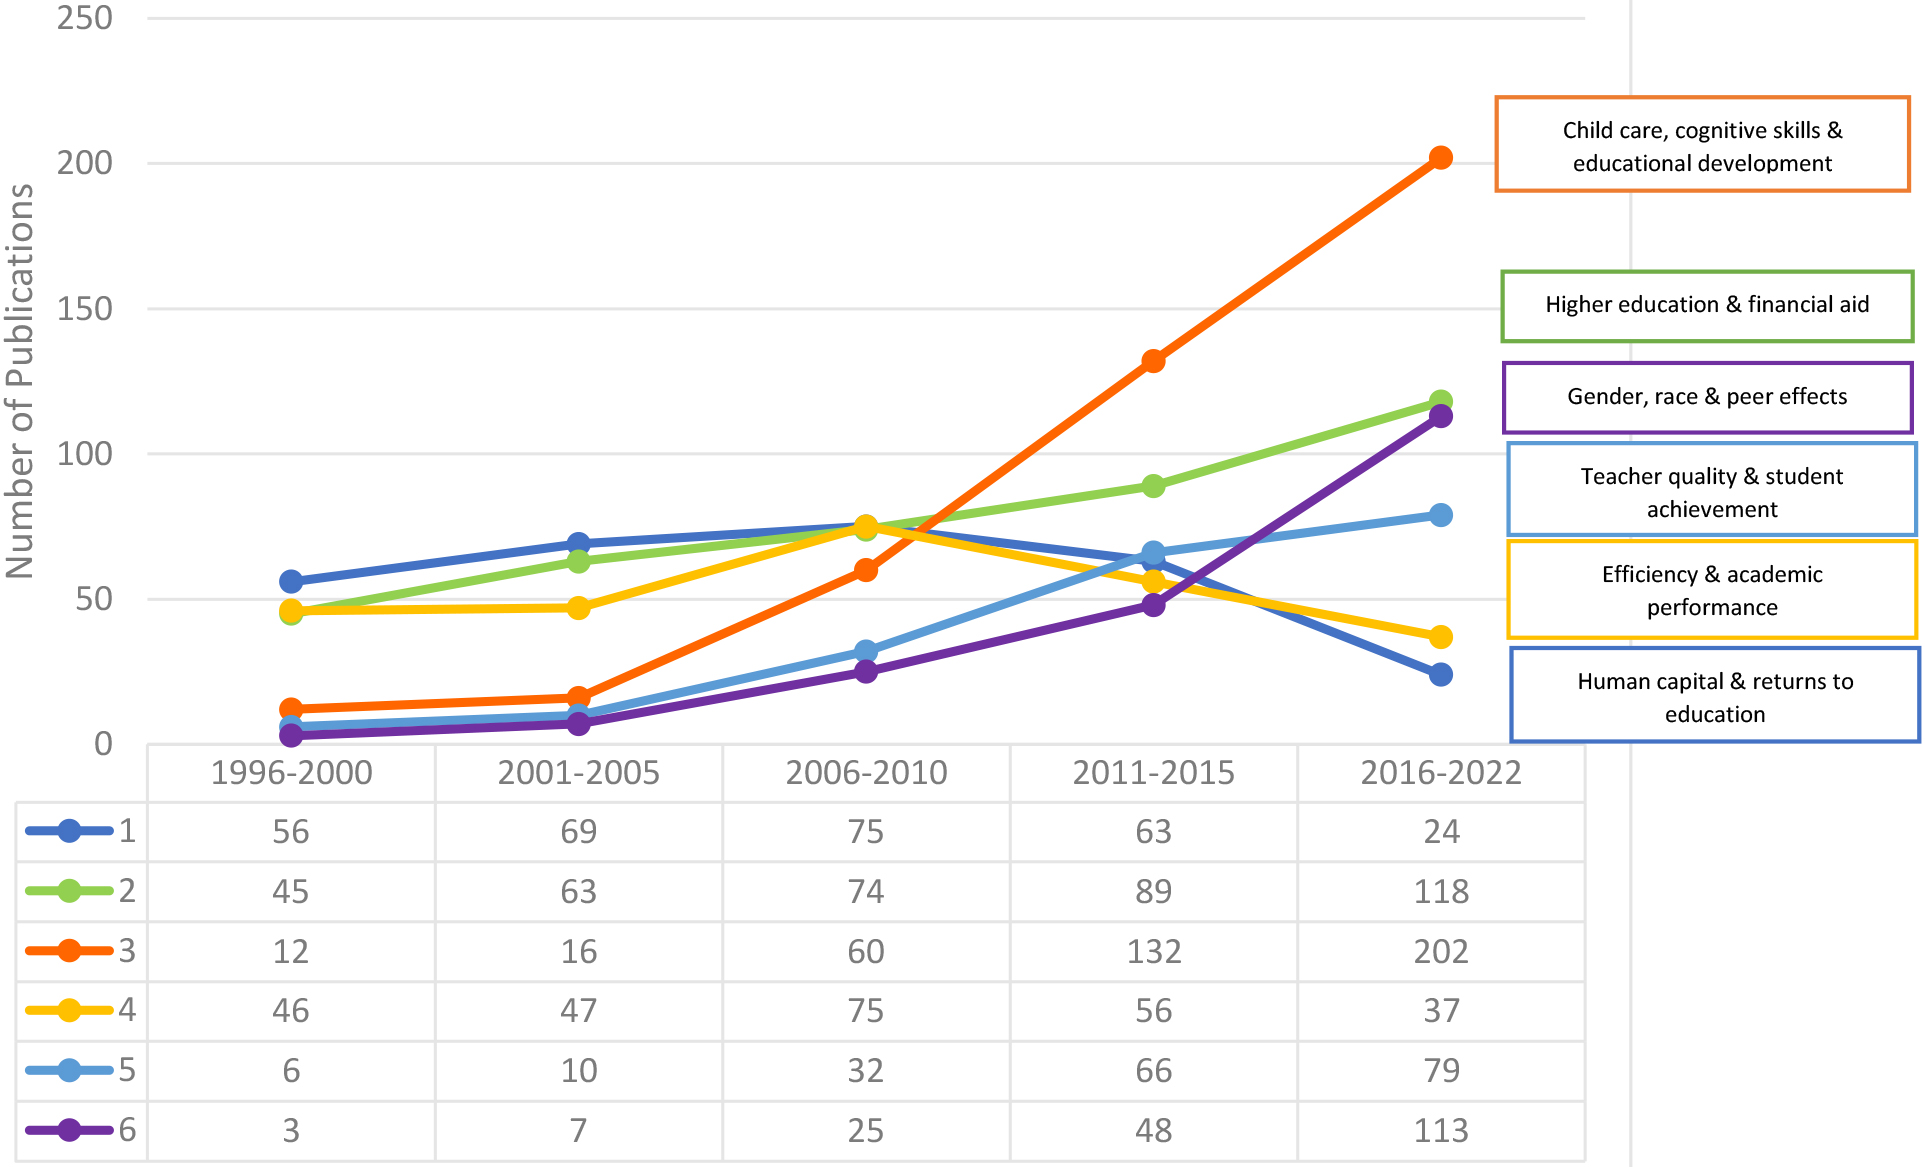
3.1.3.6. Cluster 6 – Gender, race and peer effects
Cluster 6 consists of 196 EER publications between 1996 and 2022 with 4976 citations. Most dominant keywords presented in this cluster include gender, peer effects, stem, gender disparity, stem, mathematics, achievement gap, immigrant. The most influential article in this cluster is Griffith (2010) with 314 citations. The author discusses gender and race variations in persistence rates in a STEM field major and report a positive impact of female and minority STEM field graduate students. Gershenson et al. (2016) rank second with 274 citations. This study underlines the effect of students – teacher demographic mismatch on teacher expectations and argues that other-race and other-gender teachers have significantly lower educational expectations for black students. Egalite et al. (2015) is the third most cited article with 225 citations. The authors report positive reading achievement impacts for black and white students and significant math achievement impacts for black, white, and Asian/Pacific Island students assigned to race congruent teachers.
3.1.3.7. Evolution of the six EER clusters
Figure 10 graphically depicts the evolution of the six EER clusters between 1996 and 2022. Cluster 1 on Human capital and returns to education was the most influential cluster between 1996 and 2010, but as the rest of the clusters began to evolve, the number of publications on Cluster 1 declined. Cluster 2 on Higher education and financial aid remains in the second place between 1996 and 2022. Cluster 3 on Child care, cognitive skills and educational development surged between 2006 and 2010 and dominates between 2016 and 2022. Cluster 6 on Gender, race and peer effects also seem to be evolving intensively between 2016 and 2022. Cluster 5 on Teacher quality and student achievement also surged between 2011 and 2015 and remained a trend topic between 2016 and 2022. On the other hand, Cluster 4 on Efficiency and academic performance declined substantially between 2011 and 2022.
This research provides an analysis of the relationships developed among authors, publications and affiliated countries to uncover current trends of a highly cited journal in the area of education and economics between 1981 and 2022. To achieve this goal, we applied a quantitative approach introduced by the library and information sciences, a bibliometric analysis. The network analysis revealed five clusters of authors that exhibit great intellectual affinity in the field of economics of education. A further analysis on the evolution of the intellectual proximity between affiliated countries revealed that authors affiliated with the United States prevailed during the first two decades in EER’s publications. Gradually, due to the strong co-authorship connections European authors developed with United States authors over time, new authors affiliated with European institutions entered the research hubs in the field of economics and education increasing their impact significantly between 2010 and 2022. On the other hand, only a small number of publications affiliated with institutions in Australia and Oceania, Africa, Asia and South America seem to have influenced the journal’s latest developments.
A co-citation analysis affirmed that EER’ s knowledge structure consists of leading journals in the area of economics and education corresponding to the journals’ research field. Moreover, author keywords of EER’s publications are in line with its scope placing “human capital’ and “educational economics” at the core of the journal’s thematic development. To further investigate the evolution of the most influential research hubs in this area, we performed a bibliographic coupling of the top journal publications. Six clusters of documents revealed the latest trends in the field of economics of education. Papers that attract EER author’s attention focuses on four clusters that surged between 2016 and 2022: “Higher education and financial aid” (Cluster 2), “Child care, cognitive skills and educational development” (Cluster 3), “Teacher quality and student achievement” (Cluster 5) and “Gender, race and peer effects” (Cluster 6).
The results of the study offer new insights on current trend topics in the field of economics of education by identifying the emergence of new research hubs. Over the course of the last 7 years, topics on measuring the impact of pre-school programs, quality education, higher education attainment, gender, race and peer effects started to play an important role in this area of scientific research. Traditional topics with greater focus on the field of economics, such as overeducation, returns to education, economic impact, efficiency and academic performance, seem to have lost their appeal. Emerging topics with respect to education, such as teacher quality, cognitive development, child care, race and gender, shifted research attention to new factors that affect educational attainment and student achievement.
Limitations
The current study has some limitations that should be addressed. Our study aimed to explore the relationships among different actors to reveal the knowledge structure and to spot the trend topics of a specific top field journal in the Economics of Education, the EER. Therefore, the results must be interpreted with caution. Moreover, the Matthew effect is an important caveat we should take under consideration when using a citation perspective to evaluate bibliographic data. However, although top field journals tend to cite publications in well-known journals and reinforce the Matthew effect, it can be reduced when selecting publications based on appropriateness, and not quality, to create the foundations for other scientists to further contribute to (Wang, 2014). Our study focused on revealing current trend topics by measuring intellectual proximity through science mapping and avoided the extended use of citation-based metrics. Last but not least, we should note that the bibliometric data used for the network analysis was derived from the Scopus database. Including data from other databases such as Web of Science may offer a different window of analysis with additional data.