
Abstract
An increasing number of solutions aim to support the steady increase of the number of requirements and requests for Linked Data at scale. This plethora of solutions leads to a growing need for objective means that facilitate the selection of adequate solutions for particular use cases. We hence present
Keywords
Introduction
While the adoption of Linked Data (LD) is increasing steadily, the selection of the right frameworks for a given application driven by this paradigm remains elusive. This is partly due to the lack of (1) large-scale benchmarks for most steps of the LD life cycle [2] and (2) scalable benchmarking platforms able to generate uniform comparable evaluation results for the technologies which deal with this type of data [35]. The usefulness of benchmarks for characterising the performance of families of solutions has been clearly demonstrated by the varied benchmarks made available over recent decades [20,35,43,44]. For example, the TPC family of benchmarks is widely regarded as having provided the foundation for the development of efficient relational databases [20]. Modern examples of benchmarks that have achieved similar effects include the QALD [44] and BioASQ [43] benchmarks, which have successfully contributed to enhancing the performance of question answering systems over LD and in the bio-medical domain respectively. Modern benchmarking platforms have also contributed to the comparability of measurements used to evaluate the performance of systems. For example, benchmarking platforms such as BAT [11], GERBIL [35] and IGUANA [10] provide implementations and corresponding theoretical frameworks to benchmark different aspects of the LD life cycle in a consistent manner. Still, none of these benchmarking platforms can scale up to the requirements of modern applications.
The main contribution of this paper is the
Code and dataset generators available at
The rest of this paper is structured as follows: We begin by giving an overview of the state of the art in benchmarking LD in Section 2. In Section 3, we present requirements for the benchmarking platform that were gathered from experts. We used these requirements to derive the architecture for the platform presented in Section 4. We demonstrate the use of the platform in Section 5 by showing how it can be applied to benchmark a knowledge extraction framework along the axes of accuracy and scalability – a dimension that was not considered in previous benchmarking efforts. We present the different applications of the benchmarking platform in Section 6. Finally, we discuss limitations and derive future work in Section 7 before concluding the paper with Section 8.
The work presented herein is mostly related to benchmarking platforms for Linked Data/RDF-based systems. Several benchmarks have been developed in the area of linking RDF datasets [32]. A recent detailed comparison of instance matching benchmarks can be found in [13]. The authors show that there are several benchmarks using either real or synthetically generated datasets. SEALS 3
For a large proportion of existing benchmarks and benchmark generators (e.g., LUBM [23], BSBM [4], DBSBM [28] and FEASIBLE [37]), the focus has commonly been on creating frameworks able to generate data and query loads [4,23,28,37] able to stress triple stores. IGUANA [10] is the first benchmarking framework for the unified execution of these data and query loads. However, like the platforms aforementioned, IGUANA does not scale up to distributed processing and can thus not be used to benchmark distributed solutions at scale.
Knowledge Extraction – especially Named Entity Recognition and Linking – has also seen the rise of a large number of benchmarks [35]. Several conferences and workshops aiming at the comparison of information extraction systems (including the Message Understanding Conference [42] and the Conference on Computational Natural Language Learning [38]) have created benchmarks for this task. In 2014, Carmel et al. [6] introduced one of the first Web-based evaluation systems for Named Entity Recognition and Linking. The BAT benchmarking framework [11] was also designed to facilitate benchmarking based on these datasets by combining seven Wikipedia-based systems and five datasets. The GERBIL framework [35] extended this idea by being knowledge-base-agnostic and addressing the NIL error problem in the formal model behind the BAT framework.While these systems all allow for benchmarking knowledge extraction solutions, they do not scale up to the requirements of distributed systems.
In the area of Question Answering using LD, challenges such as BioASQ [43], and the Question Answering over Linked Data (QALD) [45] have aimed to provide benchmarks for retrieving answers to human-generated questions. The GERBIL-QA platform [46] is the first open benchmarking platform for question answering which abides by the FAIR principles. However, like its knowledge extraction companion, it is not designed to scale up to large data and task loads.
Frameworks aiming at benchmarking in a generic fashion are very rare. The Peel framework4
The complete list can be found at
Also relevant according to the literature are novel Big Data benchmarks for benchmarking relational databases (e.g., BigBench [19] and OLTP [14]). However, although they come with scalable data and task generators, these benchmarks are solely focused on the benchmarking of relational databases and are not benchmarking frameworks.
A similar data generation-based approach is used by Plug and Play Bench [9]. However, in contrast to the other benchmarks, Plug and Play Bench aims at benchmarking different hardware settings on which the benchmark is executed instead of comparing different software solutions.
Comparison of LD benchmarking frameworks, their applicability for all eight steps of the LD life cycle and their support of features necessary for benchmarking Big LD solutions
Table 1 compares the existing benchmarking frameworks used to benchmark LD systems regarding their applicability for all eight steps of the LD life cycle as well as their support of features necessary for benchmarking Big LD solutions. The step “Manual Revision” is mentioned only for the completeness of the life cycle steps.
It can be seen that the
We are not aware of the existence of an automatic benchmark for the quality analysis step. However, the platform itself would support such a benchmark.
See
We adopted a user-driven approach to develop our platform. Additionally to the goals of the HOBBIT project, the requirements were mainly derived from an online survey as well as a workshop – both described in [16].8
Please note that [16] is also available via the Community Research and Development Information Service (CORDIS) of the European Commission using the grand agreement ID of the HOBBIT project: 688227. See
The survey had 61 expert participants representing their organisations. These experts were contacted via mail using several mailing lists of the Semantic Web community. During the survey, the participants were asked to add themselves to one ore more of three stake holder groups. 48 participants classified themselves as solution providers, i.e., they represent an organisation which implements a LD system. 46 participants added themselves to the group of technology users, i.e., people which are using LD systems developed by a 3rd party. The third group – the scientific community which aims at identifying problems in existing solutions and developing new algorithms – comprised 47 participants. Asked for the target of the LD systems they are developing or using, 50 participants stated to work in the area of storage and querying, 39 in the area of Interlinking, 39 in Classification and Enrichment, 35 in Link Discovery, 31 in Extraction and 22 in Reasoning. The survey further asked which benchmarks the participants use. This was further detailed with the size and type of datasets (synthetic, real-world or a combination of both) they use as well as the KPIs they are interested in.
In 2016, a workshop was arranged within the programme of the Extended Semantic Web Conference. 21 conference participants took part in the workshop and discussed the goals of the HOBBIT project as well as requirements. The participants were separated into 4 groups – Generation & Acquisition, Analysis & Processing, Storage & Curation as well as Visualisation & Services – covering the complete LD life cycle. Each group discussed requirements which the benchmarks of this area as well as the benchmarking platform used to execute these benchmarks should fulfil.
To distinguish them from the FAIR principles, we will abbreviate these user requirements with
The main functionality of the platform is the execution of benchmarks.
Benchmark results should be presented in human- and machine-readable form.
It should be possible to add new benchmarks and new systems.
The platform should offer repeatable experiments and analysis of results.
The key performance indicators (KPIs) should include the effectiveness, e.g., the accuracy, and the efficiency, e.g., runtime of systems.
The platform should be able to measure the scalability of solutions. This leads to the need of a scalable generation of both – data the evaluation is based on as well as tasks a system has to execute.
The platform should support the benchmarking of distributed systems.
It should support the execution of benchmarking challenges. This includes (1) the creation of challenges within the platform, (2) the registration of users with their system for the challenge, (3) the execution of the challenge experiments at a predefined point in time and (4) the summary of the experiment results for this challenge.
These functional requirements predefined the corner stones for the platforms architecture. In Section 4, it will be shown how the platform fulfils each of them.
Qualitative requirements
The benchmarks should be easy to use and interfaces provided should be as simple as possible.
The platform should support different programming languages.
The results should be archived safely for later reference.
The platform needs to be robust regarding faulty benchmarks or systems.
Several requirements – especially
3.6% of the survey participants used datasets with less than 10k triples while 35.7% used datasets with more than 100M triples.
We derived the degree of modularity and the error handling of the platform from these requirements (
From the beginning on, the platform was built to support the FAIR principles [47].10
(Meta)data are assigned a globally unique and persistent identifier.
Data are described with rich metadata (defined by R1 below).
Metadata clearly and explicitly include the identifier of the data they describe.
(Meta)data are registered or indexed in a searchable resource.
(Meta)data are retrievable by their identifier using a standardised communications protocol.
The protocol is open, free, and universally implementable.
The protocol allows for an authentication and authorisation procedure, where necessary.
Metadata are accessible, even when the data are no longer available.
(Meta)data use a formal, accessible, shared, and broadly applicable language for knowledge representation.
(Meta)data use vocabularies that follow FAIR principles.
(Meta)data include qualified references to other (meta)data.
Meta(data) are richly described with a plurality of accurate and relevant attributes.
(Meta)data are released with a clear and accessible data usage license.
(Meta)data are associated with detailed provenance.
(Meta)data meet domain-relevant community standards.
The following section shows the design of the
Overview
Figure 1 gives an overview of the architecture of the

Architecture of the
The platform has several components (see blue elements in Fig. 1). They offer the main functionality of the platform.
Platform controller
The platform controller is the central component of the
The platform controller uses features of Docker Swarm to observe the status of the cluster that is used to execute the experiments.E.g., if one of the nodes drops out of the cluster, the comparability between single experiments might not be given (
Storage
The storage component contains the experiment results and configured challenges. It comprises two containers – a triple store that uses the
Our endpoint can be found at
The experiment results, the metadata of experiments and challenges as well as the results of the analysis component are stored as RDF triples [26] (
The formal specification of the ontology can be found at
The ontology offers classes and properties to define the metadata for the single benchmarks and benchmarked systems. For each benchmark or system a user would like to use within the platform, a metadata file has to be provided containing some general information. This includes the definition of a URI for each benchmark and system (
Additionally, a benchmark’s metadata include parameters and KPIs. The parameter can be defined to be configurable through the user interface when starting an experiment and whether the parameter should be used as feature in the analysis component.
A system’s metadata offers the definition of several system instances with different parameterisations. The analysis method can make use of the different parameter values of the instances to measure the impact of the parameters on the KPIs.
Experiments are described with triples regarding (1) provenance, (2) the experiment results, (3) the benchmark configuration and (4) benchmark as well as (5) system metadata (
Challenges which are carried out on the platform are modelled by separating them into single tasks. Each task has a benchmark with a certain parameterisation and users can register their systems for the single tasks to take part in the challenge. A challenge and its tasks have a generated URI (
Essentially, the ontology offers classes and properties to store the configuration and the results of an experiment. URIs are assigned to benchmarks, benchmarked software systems, and KPIs. Moreover, benchmark configurations as well as benchmark and system features, e.g., a certain parameterization, can be described. In addition to experiments, the ontology allows for the description of challenges, tasks in challenges and benchmarks associated with these tasks.
This component is triggered after an experiment has been carried out successfully. Its task is to enhance the benchmark results by combining them with the features of the benchmarked system(s) and the data or task generators. This combination can lead to additional insights, e.g., strengths and weaknesses of a certain system (
Graphical user interface
The graphical user interface component handles the interaction with the user via HTTP/HTTPS (
The example is part of the experiment
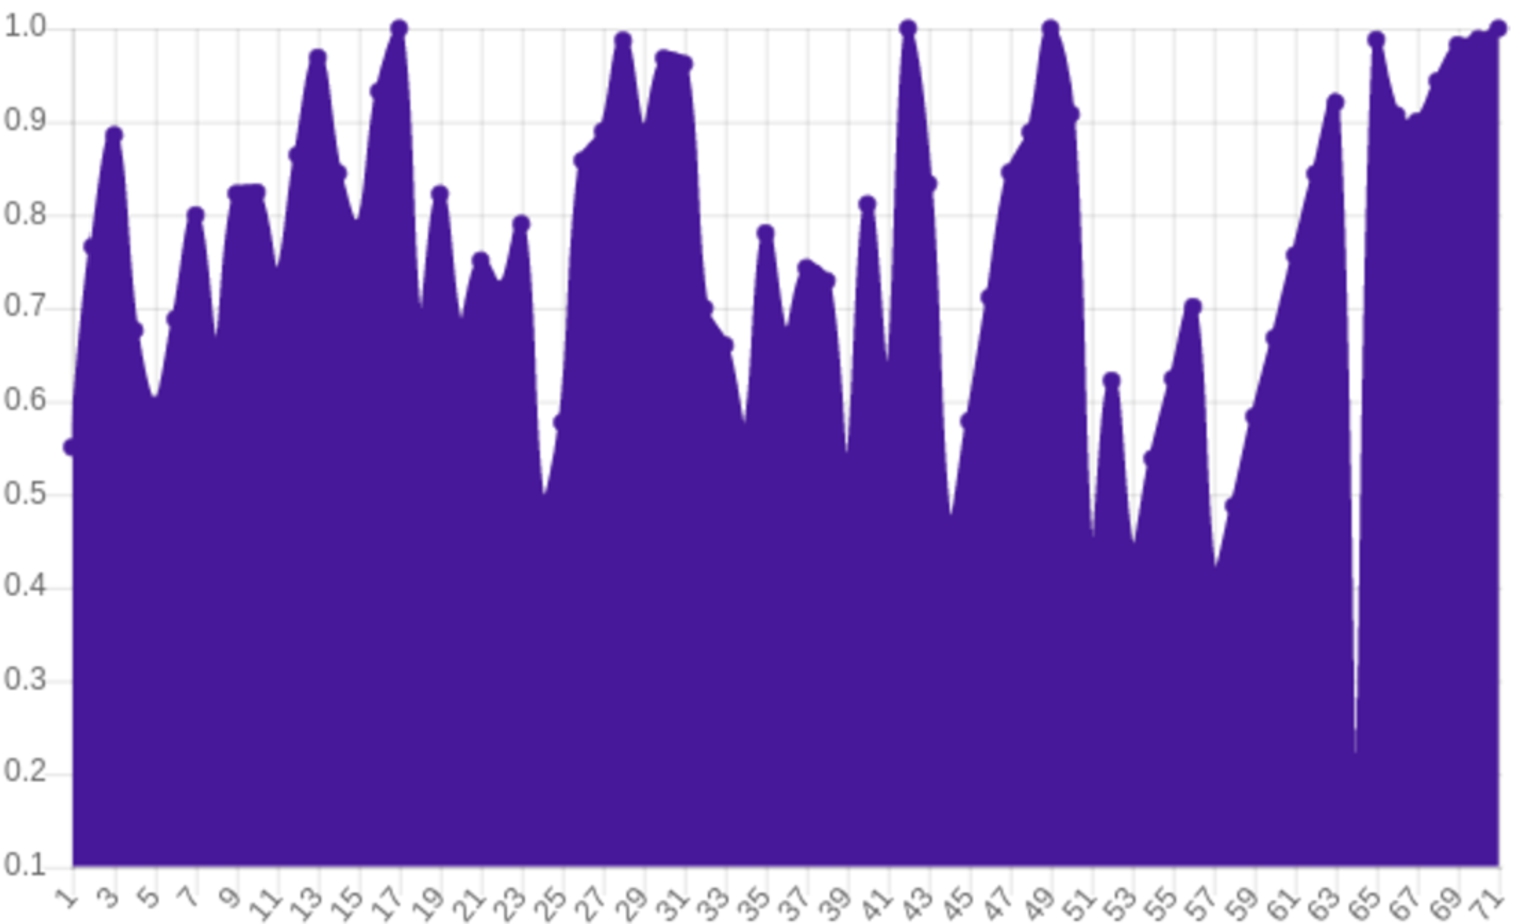
An example of a plot generated for a KPI. It shows the F1-measure the Jena Fuseki triple store achieved for 71 consecutive select queries during a run of the Odin benchmark [17].

An example of a diagram showing the Pearson correlations between the different parameters of the Odin benchmark [17] and the micro F1-measure achieved by the two triple stores Virtuoso and Jena Fuseki.
Authenticated users have additional rights ranging from starting experiments to organising challenges, i.e., define experiments with a certain date at which they will be executed (
Additionally, experiments and challenges have dereferencable URIs assigned, i.e., a user can copy the URI of an experiment or a challenge into the browser’s URL bar and the server shows the details of this resource (
See
For each benchmark, a report can be generated. This comprises (1) a brief overview over the results of the last experiments carried out with the benchmark, (2) scatter plots that compare values of features and KPIs as well as (3) plots showing the correlation between benchmark features and the performance achieved by the single systems. Such a plot is shown in Fig. 3.
If the license of the data has been configured in the triple store, the information is shown in the user interface (
License:
This component contains the message bus system. Three different communication patterns are used. Firstly, labelled data queues simply forward data, e.g., the data generated by the mimicking algorithm is transferred from several data generators to several task generators. The second pattern works like remote procedure calls. The queue has one single receiving consumer that executes a command, e.g., a SPARQL query, and sends a response containing the result. Thirdly, a central broadcasting queue is used (
User management
The user management relies on Keycloak.17
The repository contains all available benchmarks and systems. For our online instance, the repository is a Gitlab18
The resource monitoring component uses Prometheus19
The logging comprises three components – Logstash,20
These components are part of given benchmarks and have been colored orange in Fig. 1. Hence, they are instantiated for a particular experiment and are destroyed when the experiment ends. A benchmark execution has three phases – an initialisation phase, a benchmarking phase and an evaluation phase. The phases are described in more detail in Section 4.5. It should be noted that the components described in this section represent our suggestion for the structure of a benchmark. However, the
Benchmark controller
The benchmark controller is the central component of a benchmark. It communicates with the platform controller and it creates and controls the data generators, task generators, evaluation-storage and evaluation-module.
Data generator
Data generators are responsible for supplying the other components with the data necessary for the experiment. Depending on the benchmark implementation, there are two ways types of generators. Either, a given dataset, e.g., a real-world dataset, is loaded from a file or the component encapsulates an algorithm able to generate the necessary data. Importantly, data generators can be run in a distributed fashion to ensure that the platform can create the necessary data volumes or data velocity. Typically, data generators are created by the benchmark controller and configured using benchmark-specific parameters. They generate data based on the given parameters and send said data to the task generators as well as to the system adapter and terminate when the required data has been created.
Task generator
Task generators get data from data generators, generate tasks that can be identified with an ID and send these IDs to the system adapter. Each task represents a single problem that has to be solved by the benchmarked system (e.g., a SPARQL query). The expected response for the generated task is sent to the evaluation storage. Like data generators, task generators can be scaled to run in a distributed fashion.
Evaluation storage
This component stores the gold standard results as well as the responses of the benchmarked system during the benchmarking phase. During the evaluation phase it sends this data to the evaluation module. Internally, the output of a benchmark is stored as a set of key-value pairs. Task IDs are used as key. Each value comprises (1) the expected result, (2) the result calculated by the benchmarked system as well as (3) the timestamp at which the task was sent to the system by a task generator and (4) the timestamp at which the response was received by the evaluation storage.
Evaluation module
The evaluation module is created by the benchmark controller at the beginning of the evaluation phase and requests results from the evaluation storage. It evaluates them by computing the KPIs associated with the benchmark. It should be noted that the decision which KPIs will be used is mainly up to the benchmark developer. Both, the effectiveness as well as the efficiency of systems can be measured (
Benchmarked system components
Each system to be benchmarked using the

Simplified overview of the general benchmarking workflow. The system as well as the user interface are left out and the benchmark controller creates other containers directly, without sending requests to the platform controller.
Since the platform was designed for executing benchmarks (
Initialisation phase
At the beginning of the benchmarking process, the platform controller makes sure that a benchmark can be started. This includes a check to make sure that all hardware nodes of the cluster are available. The platform controller then instantiates the system adapter. The said adapter first initializes, then starts the system to be benchmarked and makes sure that it is working properly. Finally, the adapter sends a message to the platform controller to indicate that it is ready. Once the system adapter has been started, the platform controller generates the benchmark controller. The task of the benchmark controller is to ensure that the data and tasks for a given benchmark are generated and dispatched according to a given specification. To achieve this goal, the controller instantiates the data and task generators as well as the evaluation storage. It then sends a message to the platform controller to indicate that it is ready.
Benchmarking phase
The platform controller waits until both the system adapter and the benchmark controller are ready before starting the benchmarking phase by sending a start signal to the benchmark controller which starts the data generators. The data generators start the data generation algorithms to create the data that will underlie the benchmark. The data is sent to the system adapter and to the task generators. The task generators generate the tasks and send them to the system adapter, which triggers the required processing of the data in the system. The system response is forwarded to the evaluation storage by the system adapter. The task generators store the corresponding expected result in the evaluation storage. After the data and task generators finish their work, the benchmarking phase ends and both the generators and the system adapter terminate.
Evaluation phase
During the evaluation phase, the benchmark controller creates the evaluation module. The evaluation module loads the results from the evaluation storage. This is done by requesting the results pairs, i.e., the expected result and the result received from the system for a single task, from the storage. The evaluation module uses these pairs to evaluate the system’s performance and to calculate the KPIs. The results of this evaluation are returned to the benchmark controller before the evaluation module and storage terminate. The benchmark controller adds information for repeating the experiment, e.g., its parameters, to the evaluation results, sends them to the platform controller and terminates. Note that this makes sure that all the data is still available, although the benchmark or the benchmarked system are deleted from the servers (
Importantly, the platform allows for other orchestration schemes. For example, it is possible to generate all the data in a first step before the task generators start to generate their tasks based on the complete data. In another variation, the task generators can also be enabled to generate a task, wait for the response of the system and then send the subsequent task.
Evaluation
The
Platform benchmark results on a single machine (1–3) and a cluster (4, 5)
Platform benchmark results on a single machine (1–3) and a cluster (4, 5)
To configure our simulation, we derived message characteristics from real data using the Linked SPARQL Queries Dataset [36]–a collection of SPARQL query logs. This collection of real query logs suggests that (1) the average length of a SPARQL query is 545.45 characters and (2) the average result set comprises 122.45 bindings. We assumed that the average size of a single result is 100 characters leading to a result set size of approximately 12,200 characters which is created for every request by our triple store simulation.
The platform was deployed on a small machine23
Dual Intel Core i5, 2.5 GHz, 2 GB RAM.
1 master server (1xE5-2630v4 10-cores, 2.2 GHz, 128 GB RAM) hosting platform components (including RabbitMQ message broker), 1 data server (1xE5-2630v3 8-cores, 2.4 GHz, 64 GB RAM) hosting storages, 6 nodes (2xE5-2630v3 8-cores, 2.4 GHz, 256 GB RAM) divided into two groups hosting either components of the benchmark or the benchmarked system.
For our second evaluation, we used Task 1B of the Open Knowledge Extraction challenge 2017 [41] as use case. This task comprises the problem of spotting named entities from a given text and linking them to a given knowledge base. All experiments were run on our cluster. We benchmarked the following named entity recognition tools: (1) FOX [39], (2) the Ottawa Baseline Information Extraction (Balie) [30], (3) the Illinois Named Entity Tagger (Illinois) [33], (4) the Apache OpenNLP Name Finder (OpenNLP) [3], (5) the Stanford Named Entity Recognizer (Stanford) [15], and (6) DBpedia Spotlight (Spotlight) [27]. The entities that were found in the text by any of the tools are linked to a given knowledge base using AGDISTIS [29]. In our experiment, we used DBpedia 201525
The aim of the benchmark was to measure the scalability and the accuracy of these systems under increasing load, an experiment which was not possible with existing benchmarking solutions. We used a gold standard made up of 10,000 documents generated using the BENGAL generator26
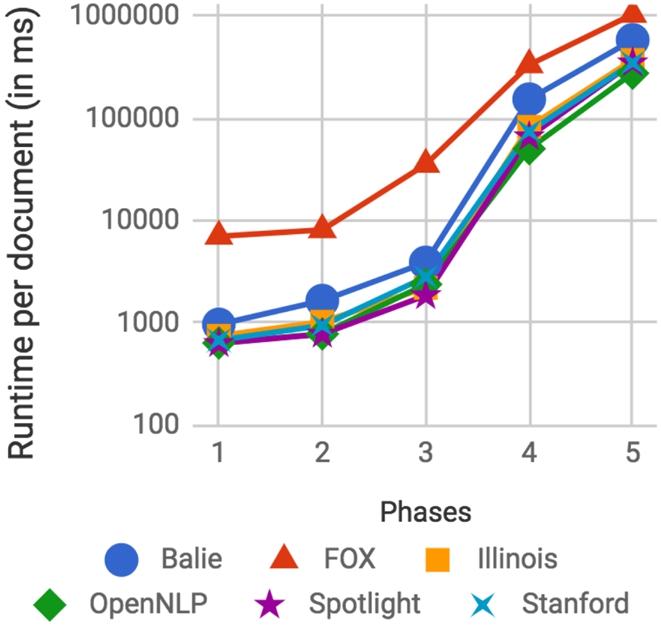
Average runtime per document achieved by systems during the different phases.
The results presented in Figure 5 show that all approaches scale well when provided with enough hardware. As expected, FOX is the slowest solution as it relies on calling 5 underlying fully-fledged entity recognition tools and merging their results. Our results also indicate that a better load balancing could lead to even better runtimes. In particular, the runtime per document starts to increase as soon as the tool cannot handle the incoming amount of documents in time and the documents start to be queued (see Phase 2 to 4). Additionally, the results show that Balie is slower than the other fully-fledged entity recognition tools. Given that Balie also has the lowest F1-score (see Table 3) it can be argued that removing Balie from FOX could be an option to increase its efficiency.
The effectiveness of the systems (micro measures)
The
See
The Open Knowledge Extraction Challenges 2017 and 2018 used the platform for benchmarking Named Entity Recognition, Entity Linking and Relation Extraction approaches [40,41]. For one of the challenge tasks a setup similar to our evaluation in Section 5.2 was used. This evaluation revealed that the scalability of some systems decreases drastically under realistic loads. While some of the benchmarked solutions were able to answer single requests efficiently, they became slower than competing systems when challenged with a large amount of requests [41].
The Mighty Storage Challenges 2017 and 2018 focused on benchmarking triple stores [17,18]. Their RDF data ingestion tasks showed that most triple stores are unable to consume and retrieve triples (e.g., sensor or event data) efficiently. This insight suggests that current triple stores need to significantly improve in their scalability before they can be used for Big Data applications out of the box. The derivation of this insight was made possible by
The
The FAIR principles are focusing on data management. Thus, not all of them can be solely realised by the implementation of the platform. There are principles which are at least partly in the responsibility of the organisation hosting the platform. The license for the experiment results has to be defined by the hosting organisation (
Another limitation can be seen in the fulfilment of
The design of the platform comes with two bottlenecks which we addressed by using horizontal scaling. Firstly, the message bus which is used for the communication might not be able to handle all the data in a reasonable amount of time. We handled this issue by using RabbitMQ as message broker.28
An important limitation of the platform is the necessary knowledge about several technologies and the platform APIs which is demanded. While viewing and searching for experiment results is straight forward, the deployment of a new benchmark or a new system can cause some effort for users which have not worked with the platform before. Especially for complex benchmarks the workflow described in Section 4.5 may have to be adapted. We created base implementations for different benchmark and system components, developed example benchmarks and systems as open source projects, created video tutorials and enhanced the documentation of the platform over time incorporating user questions and feedback we received. However, the further lowering of this entry barrier remains an important future task.
Additionally, we received feature requests from the community. These requests are mainly targeting the user interface. However, one feature request focuses on the sharing of data. At the moment, it is not possible for containers executed inside the platform to share a common directory. Instead, data which has to be shared needs to be sent using the message queues. In the future, we want to make use of a feature of Docker containers which allows them to share a common data container without exposing the local hard drives of the servers to the 3rd party programs that are executed inside the containers of the benchmarks and the systems.
This paper presents the architecture of the
See
Footnotes
Acknowledgements
This work was supported by the European Union’s H2020 research and innovation action HOBBIT (GA no. 688227), by the H2020 Marie Skłodowska-Curie project KnowGraphs (GA no. 860801) and by the German Federal Ministry for Economic Affairs and Energy (BMWi) within the project RAKI (no. 01MD19012D) of the program ‘Smarte Datenwirtschaft’.