
Abstract
The size of body compartments is a determinant of several factors of blood viscosity. Red cell aggregation is proportional to fat mass while hematocrit is proportional to both fat-free mass and abdominal adiposity, but which parts of these body components are involved in this relationship is not known. Segmental bioelectrical impedance analysis (sBIA) provides a possibility to delineate the relationships more precisely between various subdivisions of the body and blood viscosity factors, going farther than preceding studies using non segmental BIA.
In this study we investigated in 38 subjects undergoing a standardized breakfast test with mathematical modelling of glucose homeostasis and a segmental bioelectrical impedance analysis (sBIA) the relationships between the various compartments of the body and viscosity factors. Blood and plasma viscosity were measured with the Anton Paar rheometer and analyzed with Quemada’s model. The parameters better correlated to hematocrit are fat free mass (r = 0.562) and its two components muscle mass (r = 0.516) and non-muscular fat-free mass (r = 0.452), and also trunk fat mass (r = 0.383) and waist-to hip ratio (r = 0.394). Red cell aggregation measurements were correlated with both truncal and appendicular fat mass (r ranging between 0.603 and 0.728). Weaker correlations of M and M1 are found with waist circumference and hip circumference. This study shows that the correlation between lean mass and hematocrit involves both muscle and non-muscle moieties of lean mass, and that both central and appendicular fat are determinants of red cell aggregation.
Introduction
Blood rheology is known to be pathologically elevated in e.g. patients with atherosclerotic disease [7, 8] - dependent on plasma proteins [1] - and additionally modulated by metabolism and hormones [4] which in turn are influenced by body composition [9, 26].
Not surprisingly, therefore, correlations between hemorheological parameters and both anthropometric measurements and body composition parameters have been repeatedly reported. Red cell aggregation is correlated to body fat stores even within a physiological range [24]. Hematocrit is correlated to lean mass and to visceral fat stores [5].
However, the explanation of the relationships between body fat mass or fat-free mass and viscosity factors remains poorly understood. Even more, which part fat mass or fat-free mass are involved in this relationship is not yet known. Segmental bioelectrical impedance analysis (sBIA) provides now a possibility to evaluate the size of muscle mass more precisely [6] and thus to separately study muscle and non-muscle fat-free mass. It also provides a possibility to measure the various subdivisions of fat mass (appendicular vs visceral) [14].
Therefore, we planned in this study to delineate the relationships between various subdivisions of the body and blood viscosity factors, going farther than preceding studies using non segmental BIA. This paper presents the first results of a study which is still in progress.
Materials and methods
Subjects
In this study we investigated in 38 subjects who underwent a nutritional and metabolic check-up with segmental bioelectrical impedance analysis (sBIA), the relationships between the various compartments of the body and viscosity factors. Characteristics of study subjects are shown on Table 1.
Clinical characteristics of the 38 subjects of the study. Values are expressed as mean±SEM. BMI = Body Mass index
Clinical characteristics of the 38 subjects of the study. Values are expressed as mean±SEM. BMI = Body Mass index
The technique employed in this study for assessing body composition was as in our previous papers a segmental bioimpedance analysis using a six-terminal impedance plethismograph BIACORPUS RX 4000 (MEDI CAL HealthCare GmbH, An der Raumfabrik 31A, 76227 Karlsruhe, Germany) with data analysis with the software BodyComp 8.4. This device measures total resistance of the body to an alternative electric current of 50 kHz [2, 12]. Body fat mass and fat-free mass were calculated in each segment of the body according to manufacturer’s database-derived disclosed equations, and total water with published equations using the classical cylindric model and Hanai’s mixture theory [15].
Hemorheological ex vivo measurements
Venous blood samples for hemorheological measurements (7 ml) were drawn in the cubital fossa with a large needle, with potassium EDTA as the anticoagulant in a vacuum tube (Vacutainer). Hematocrit (packed cell volume) was measured by microcentrifugation. Viscometric measurements were then performed over the range of shear rates 1 to 6000 s-1 with the RHEOMETRE Anton Paar CP 50-1 (Anton Paar Germany GmbH, Hemuth-Hirth-Strasse 6, D-73760 Ostfildern / Germany) [18–20].
We measured with this device apparent viscosity of whole blood at native hematocrit, plasma viscosity, and blood viscosity at corrected hematocrit (45%) according to the equation of Quemada [22].
Quemada’s model provides a smoothing of k(γ) and thus from the crude values provided by the viscometer we can calculate k (0) which is the extrapolation at a shear rate of 0 s-1 and k (infinite) which is the asymptotic value of k(γ) at infinite shear rate. The parameter k (0) is a classical index of RBC aggregation and the parameter k (infinite) is an index of erythrocyte rigidity [17].
RBC aggregation was measured using a transparent cone-plate shearing instrument (Model MA-1 Aggregometer, Myrenne GmbH, Roetgen, FRG) which employs the light transmission method of Schmid-Schönbein et al. [23]. This technique is based upon the increase of light transmission through a red cell suspension which occurs when individual red blood cells (RBCs) aggregate into rouleaux or rouleaux-rouleaux complexes. Increased light transmission (through plasma gaps between the aggregates) is proportional to RBC aggregation. The sample is placed between a transparent cone and a transparent plate and sheared, at 600 s-1, to disperse all pre-existing cell aggregates. The shearing is then instantly stopped, and the light transmission increases at a rate proportional to the rate of RBC aggregate formation during stasis (M index). Another measurement is also performed after similar shearing at 600 s-1 during 10 s: shearing is reduced to 3 s-1 and light transmission (low shear conditions) is measured in this situation which stimulates aggregation (M1 index).
Statistics
Data are reported as means±SEM, and statistical analysis was with the Sigmastat package (Jandel Scientific, Erkrath, Germany). Correlations were assessed with Pearson’s procedure (least square fitting) on Microsoft EXCEL. Normality of samples was checked with the Kolmogorov-Smirnov test. A value of p < 0.05 was considered as significant.
Results
As shown on Fig. 1, hematocrit was correlated with total fat free mass (r = 0.562 p = 0.0002) and its two components muscle mass (r = 0.516 p = 0.0009) and non-muscular fat-free mass (FFM) (r = 0.452 p = 0.004). As shown on Table 2, a stepwise regression analysis selects fat free mass as best determinant of hematocrit and between muscle and non muscle FFM it selects muscle (p = 0.0031).
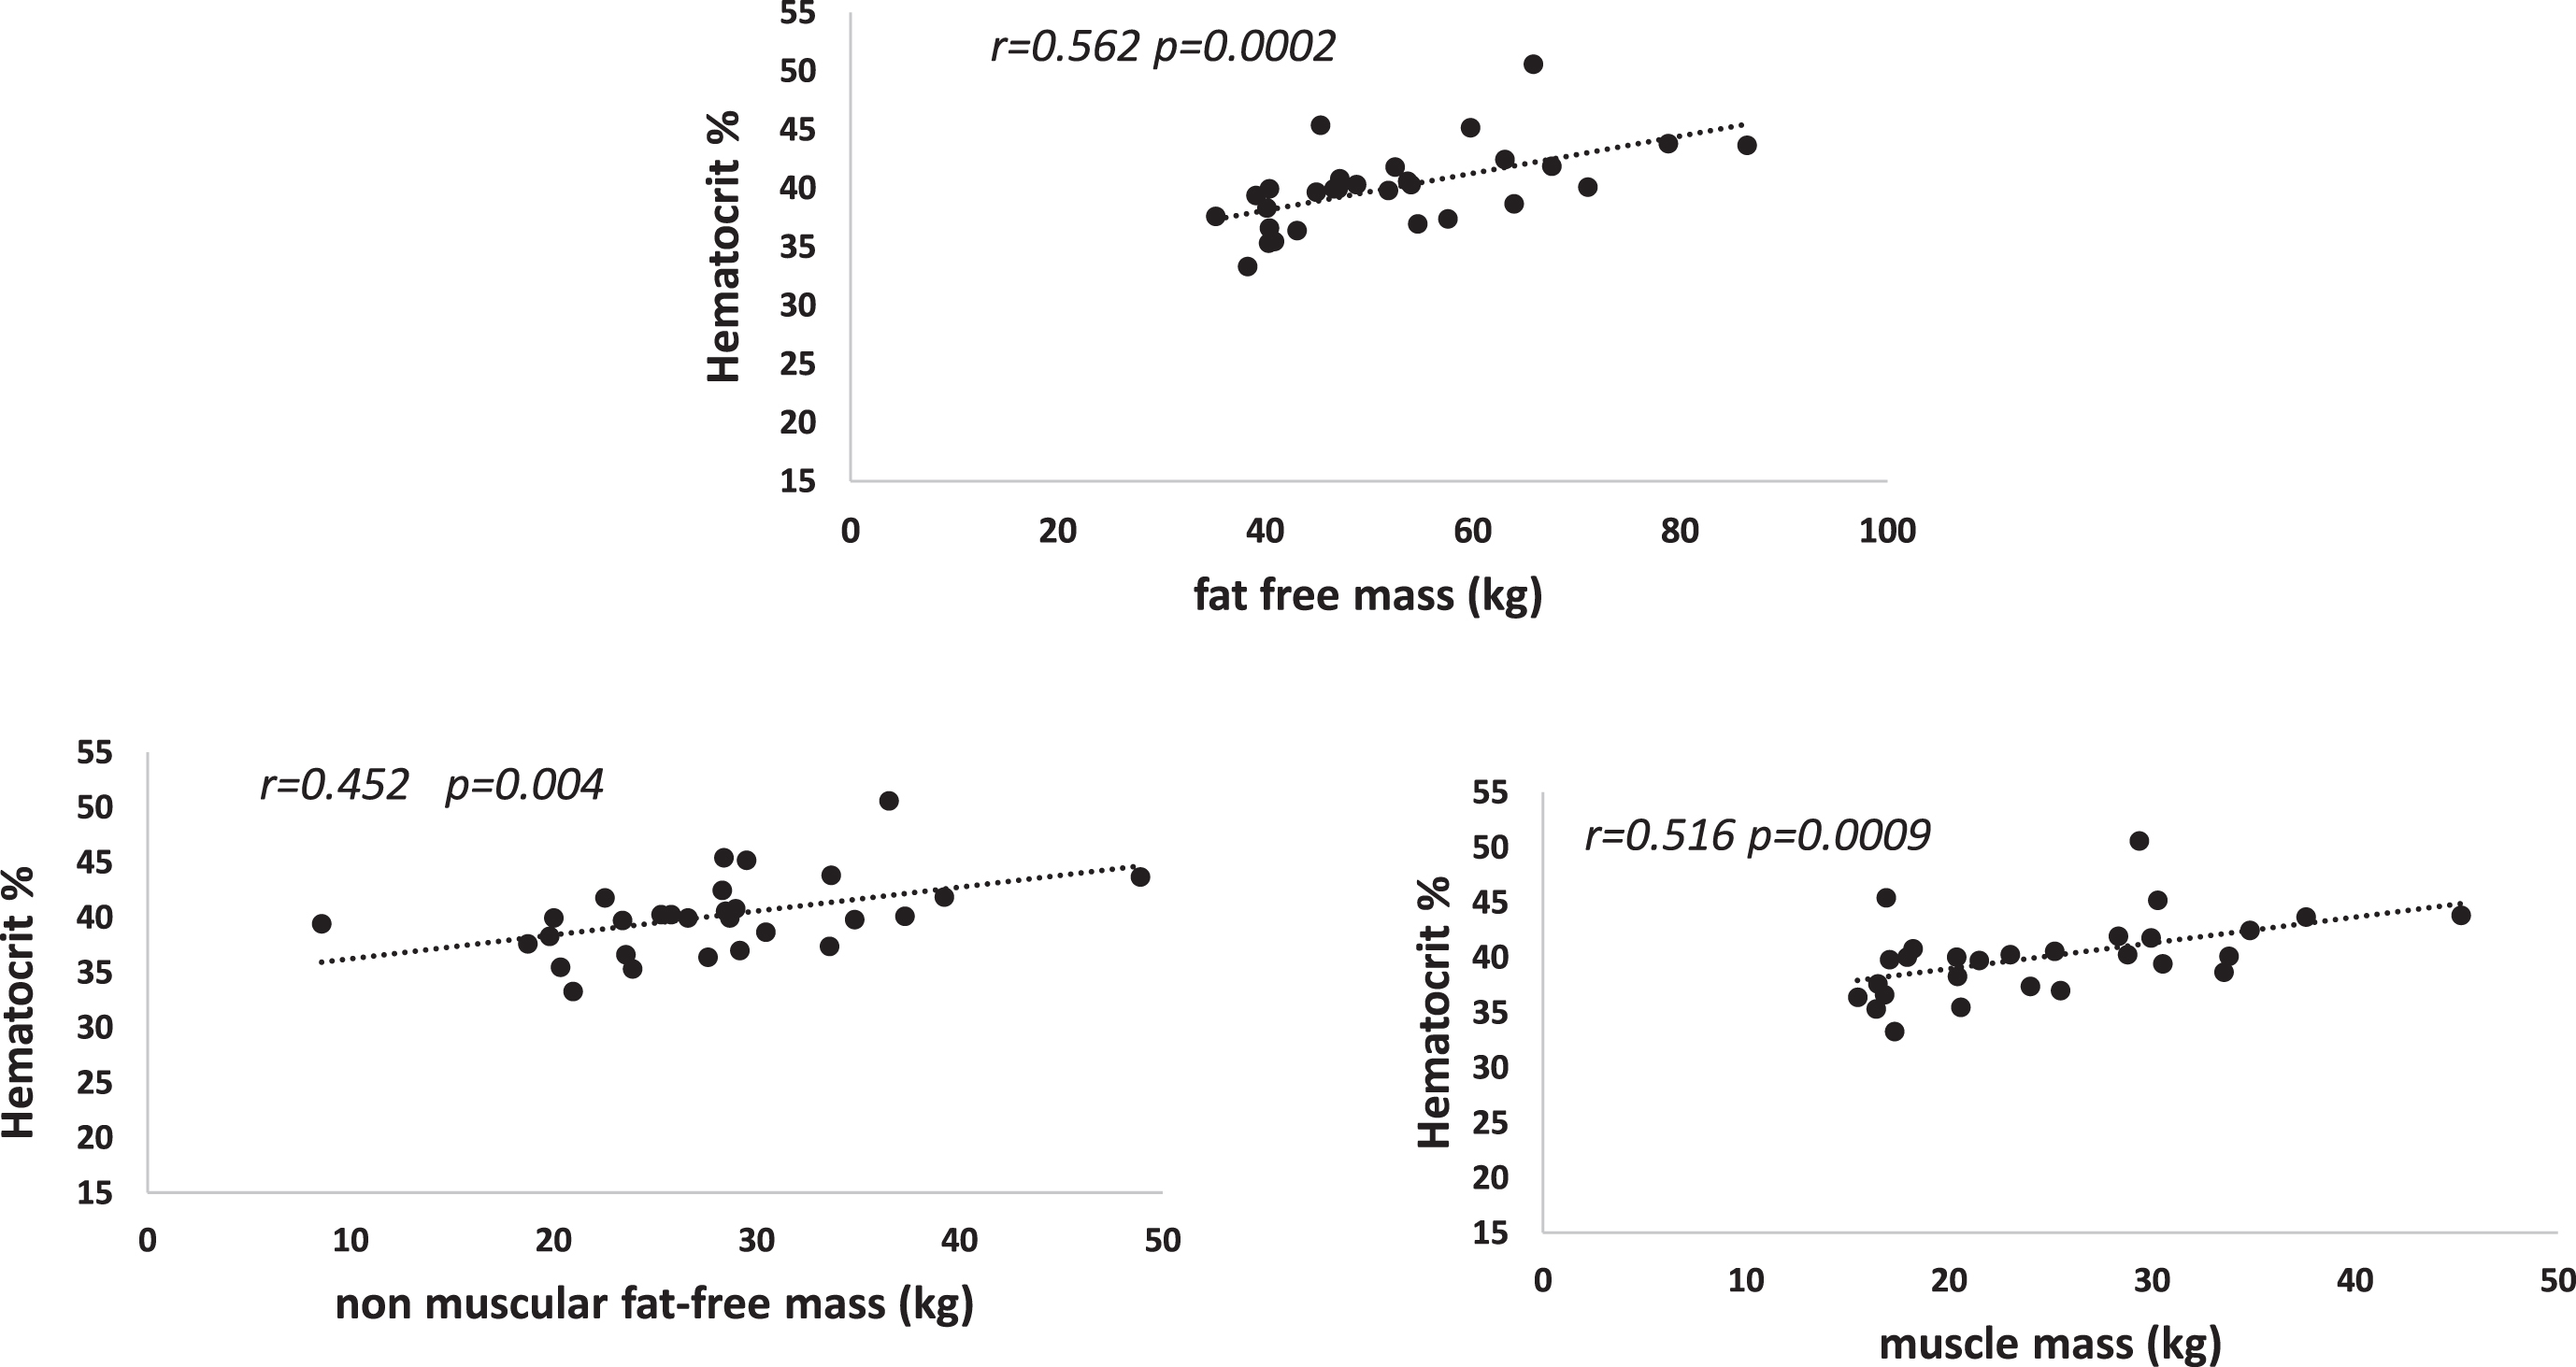
Correlations between venous hematocrit and total fat free mass (upper panel) and its two components (muscle and non-muscle) (lower panels).
Stepwise regression analysis for delineating among muscle and non muscular FFM which of them is the main statistical predictor of hematocrit
There were also correlations between hematocrit and some adiposity parameters as shown on Fig. 2. Although total fat mass was not a statistical determinant of hematocrit, this parameter exhibited a correlation with trunk fat mass (r = 0.383) and waist-to hip ratio (r = 0.394).
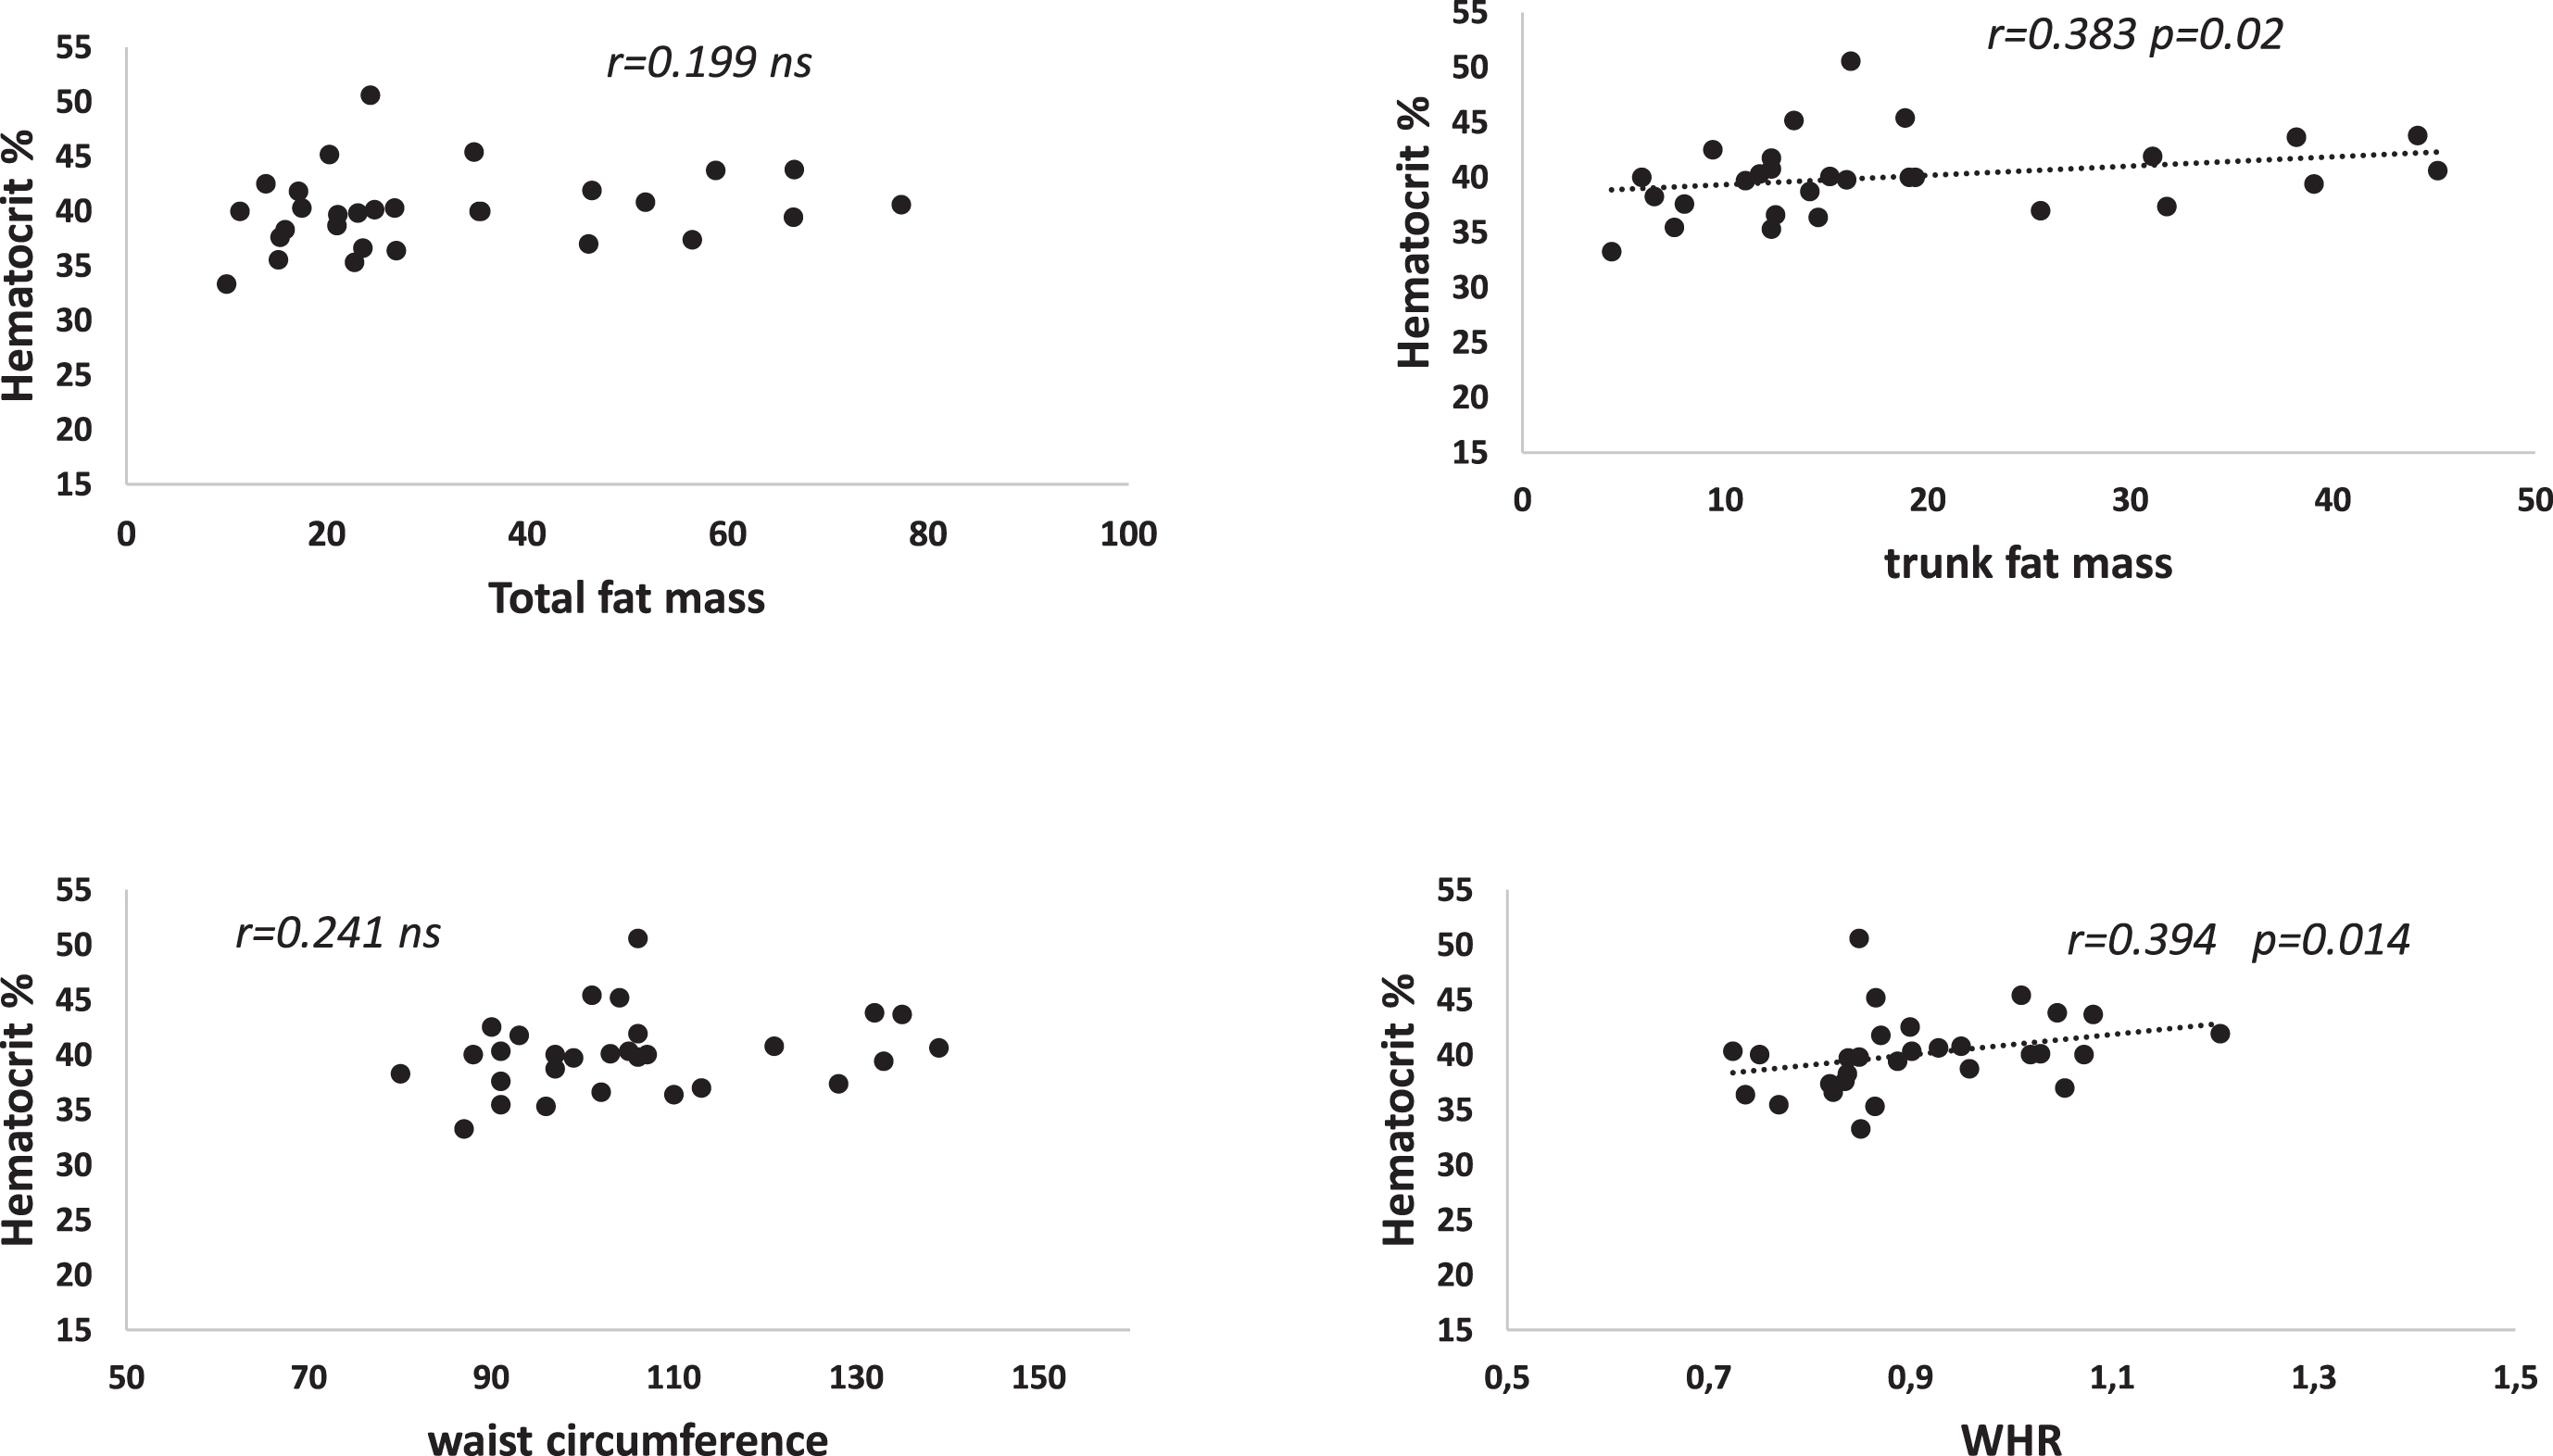
Correlations between venous hematocrit and some but not all BIA parameters of adiposity.
Table 3 shows the coefficients of correlations of various RBC aggregation parameters measured in this study with body composition. Red cell aggregation measurements were correlated with both truncal and appendicular fat mass (r ranging between 0.603 and 0.728). Figs. 34 show those correlations. Weaker correlations of M and M1 are found with waist circumference and hip circumference. Multivariate analysis selects whole fat mass but clearly both truncal and appendicular fat mass which have different physiological properties are fairly correlated to aggregation (see Fig. 4).
Body composition parameters correlated with red cell aggregation
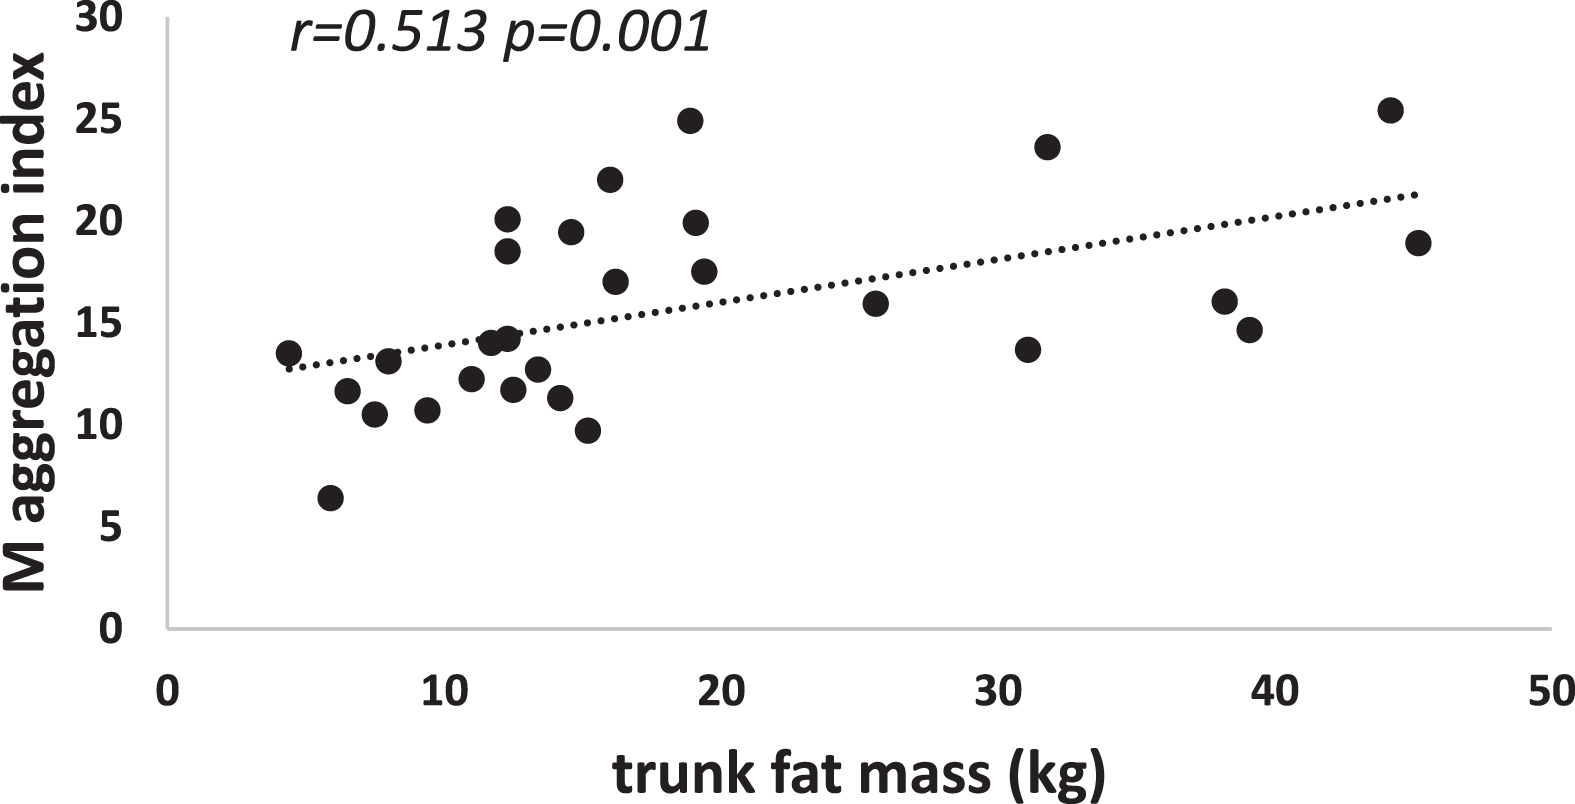
Red cell aggregation M and trunk fat mass.
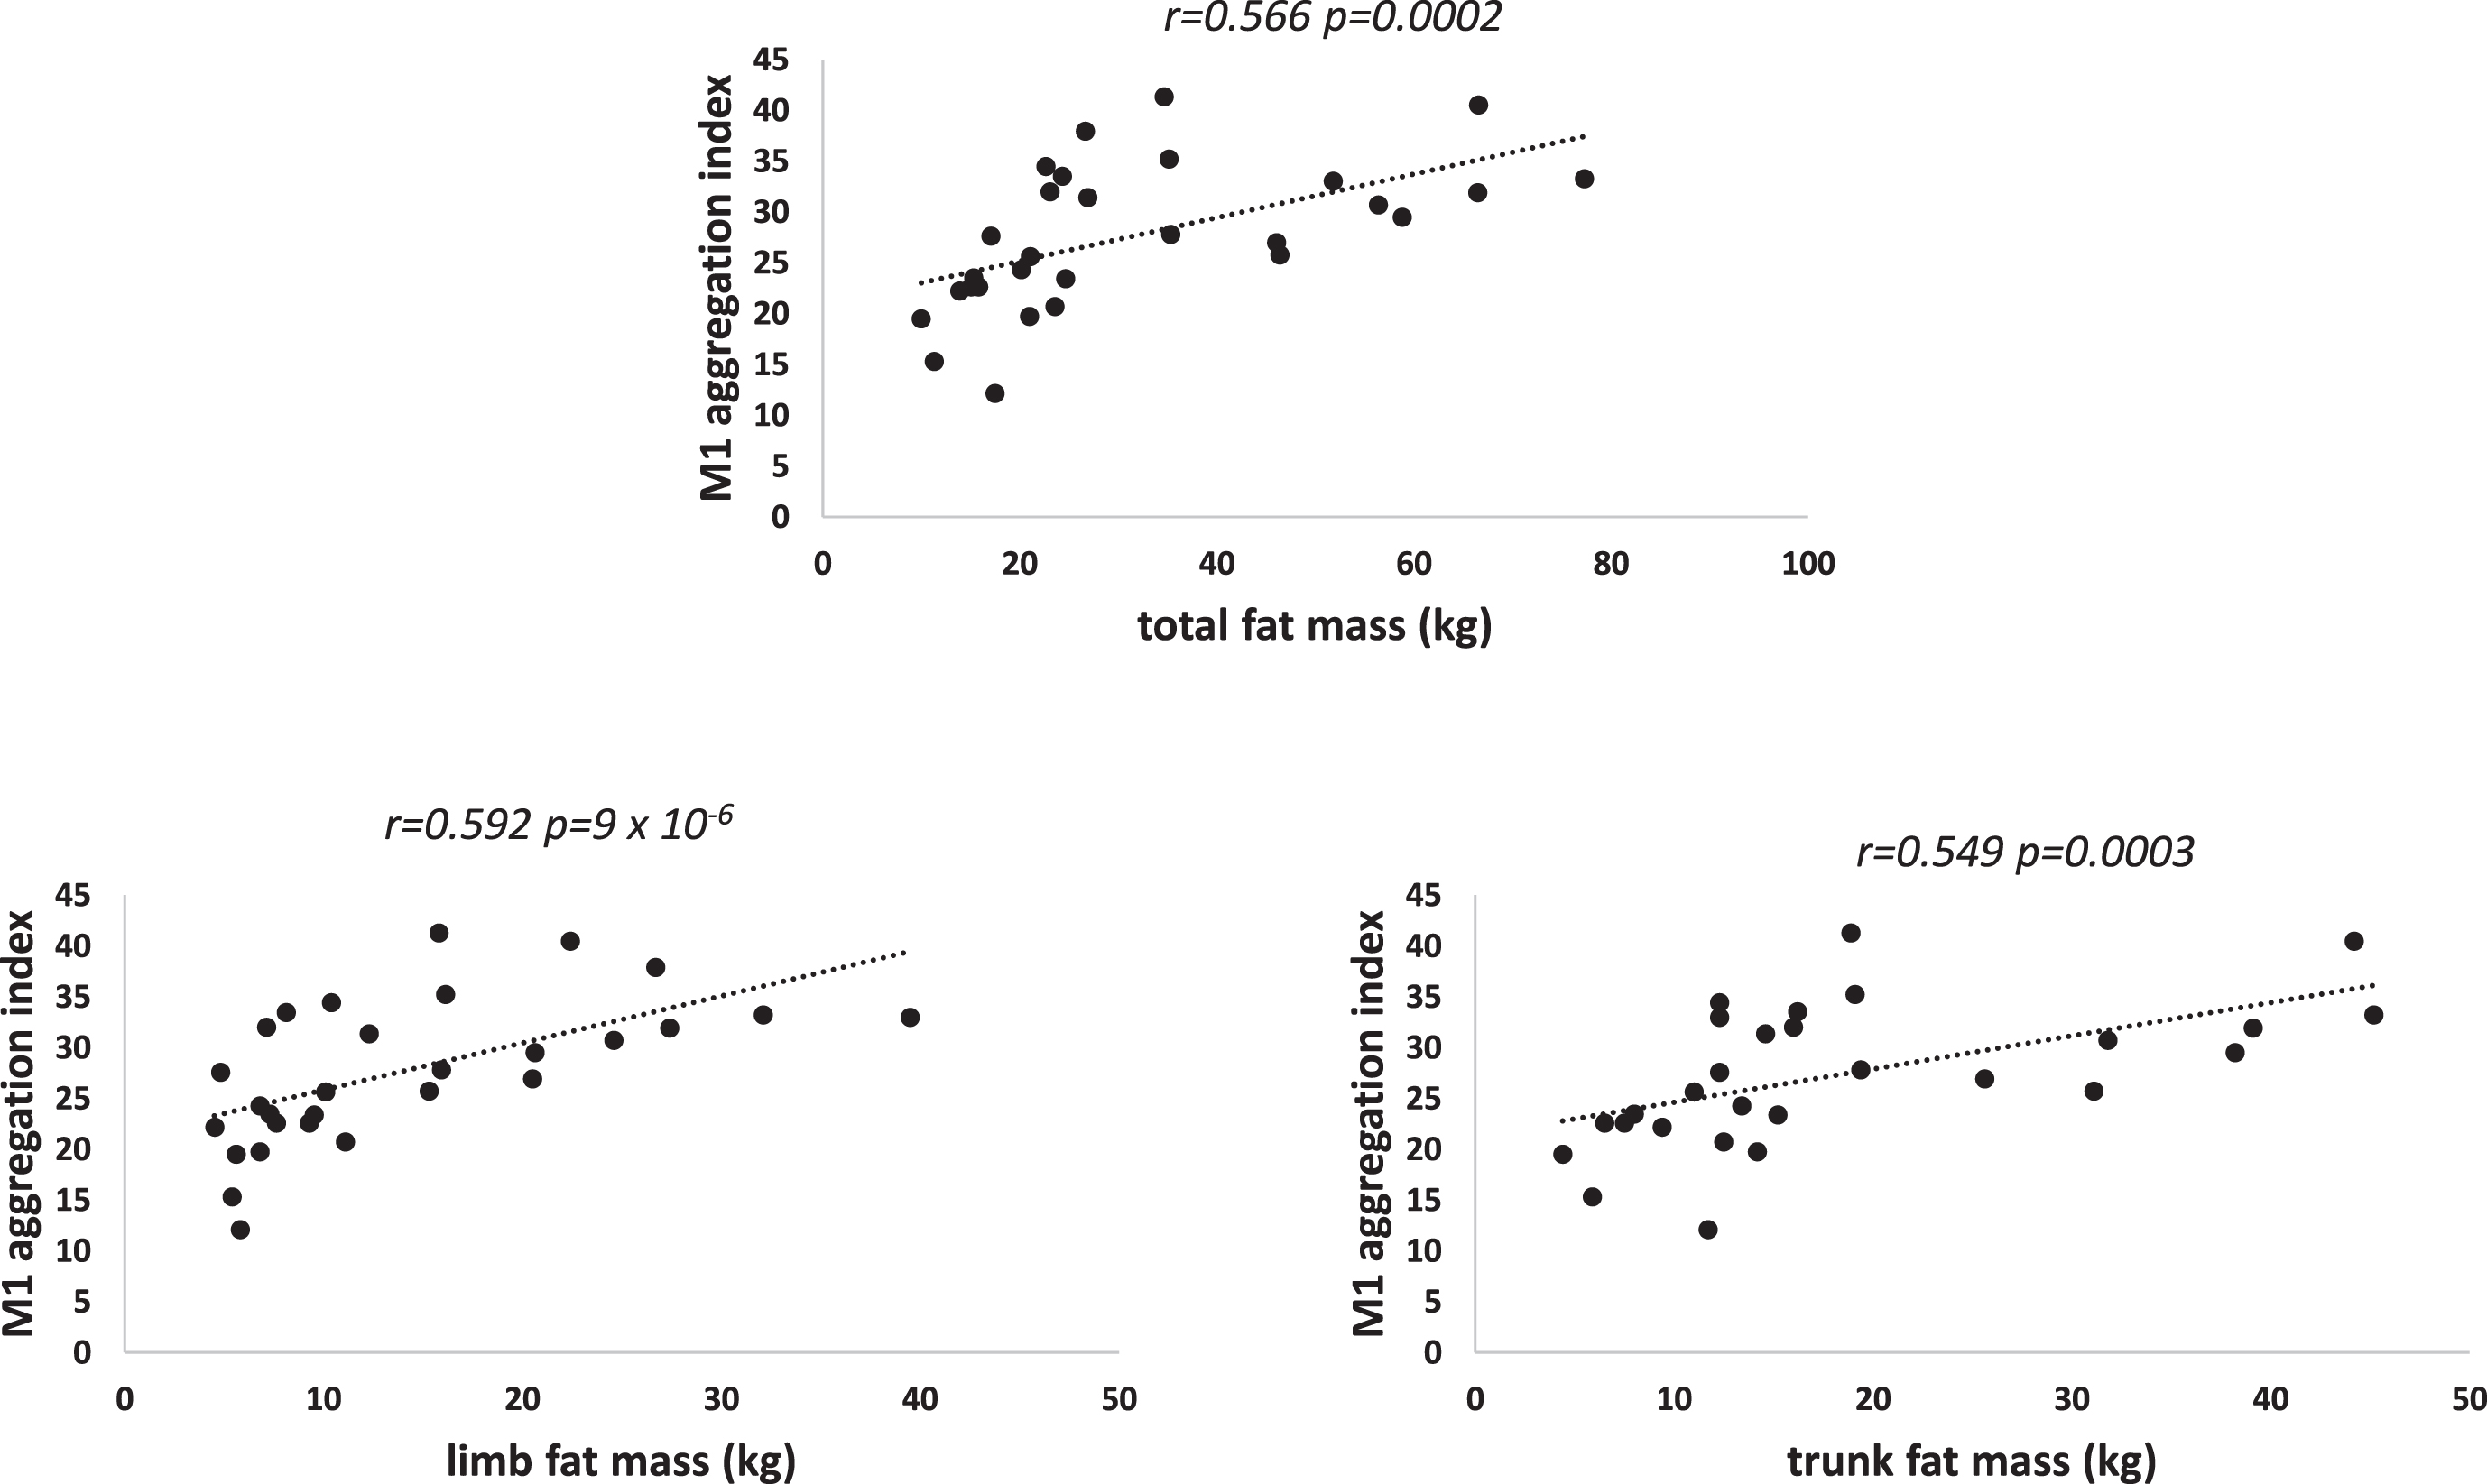
Red cell aggregation M1 and fat mass.
Some hemorheological parameters but not all exhibit correlations with body composition. Hematocrit appears in this study to be correlated with FFM and its two components muscle mass and non-muscular fat-free mass. Muscle seems to be the part of FFM which is more closely related to hematocrit. We also find a correlation between hematocrit and two measurements representative of abdominal fat. Besides, red cell aggregation is related to both central and appendicular fat.
A correlation between lean mass and hematocrit has been previously reported [5] but the fact that this correlation involves both muscle and non-muscle moieties of lean mass is a new finding provided by this study. Similarly, it is very classical to report a correlation between fat mass (FM) and red cell aggregation [24], but the fact that this correlation involves both central and appendicular fat is again a new finding.
The fact that those correlations (lean mass with hematocrit and fat with aggregation) are regularly found in separate samples leads to think that there are not spurious findings but reflect a biological reality. However, the exact explanation for this remains speculative.
Over the last years some new findings have provided likely explanations for the correlation between hematocrit and both fat-free mass and abdominal fat. Skeletal Muscle has been reported to be a target tissue responsive to the hematocrit-regulating hormone erythropoietin (EPO). EPO stimulates myoblast proliferation and survival [27]. In addition, skeletal muscle myoblasts have been shown to produce EPO raising the possibility of an autocrine EPO response in skeletal muscle [16]. In humans, a single injection of EPO increased myogenic regulatory factor MYF6 mRNA [21] and EPO treatment increased PAX7 and MYOD1 content in human satellite cells [13], suggesting a role for EPO and its receptor in muscle development or remodeling [25]. Therefore, EPO may represent the link we observe between muscle mass and red cell mass as reflected by hematocrit.
We also observe a correlation between hematocrit and some parameters of abdominal fat mass. Interestingly, is rather related to shape (even within a normal range of body size) than the extent of abdominal fatness and is not related to whole body adiposity. The explanation of this relationship which has been reported several times remains unclear. Abdominal adiposity is known to be associated to a decrease in insulin sensitivity which results into alterations of lipid profile, blood pressure and glucose homeostasis [10]. To what extent these alterations can explain this correlation will require to analyze the relationships between hematocrit, insulin sensitivity and abdominal fat will require a study on a larger sample, which is currently in progress.
There are also putative explanations for the repeatedly observed correlation between fat mass and red cell aggregation. Adipose tissue is known to release many active circulating factors known as ‘adipokines’. Among them leptin exhibits receptors on erythrocytes and is also strongly correlated with red cell aggregation. Other adipokines may be also involved. This may represent a physiological axis allowing body’s energy stores to modulate microcirculatory exchanges of energetic substances [3].
On the whole, this report on a limited sample confirms that two hemorheological factors: hematocrit and erythrocyte aggregation, are related to body composition. This study is currently in progress and it is expected to include a much larger number of subjects in order to more precisely describe these interrelationships. Besides, a better understanding of the physiological and pathological links between both fat mass and muscle mass and hemorheology will require further investigations.
Footnotes
Acknowledgments
This paper was presented at the 2nd Joint Meeting of three societies: the European Society for Clinical Hemorheology and Microcirculation (ESCHM), the International Society for Clinical Hemorheology (ISCH) and the International Society of Biorheology (ISB) held on 4th to 7th, July 2021 at Fukuoka, Japan.
Conflict of interest
The authors report no disclosure of interest.
List of symbols
RBC: red blood cell, SEM: standard error on the mean, FFM: fat free mass; FM: fat mass; EPO: erythropoietin.