
Abstract
AIM:
First assessment of flow changes in the jugular veins using high resolution ultrasound vector flow.
MATERIAL UND METHODS:
15 patients (8 males, 7 females) with an age range of 35 to 82 years (mean age 58.53±12.26 years) were examined by an experienced examiner using high power ultrasound equipment (Resona R9, Mindray) with probe technology (Mindray L9-3U Linear Array transducer, 2.5 to 9.0 MHz). This group was compared with five healthy subjects (mean age 35.4±13.79 years) as a reference. To assess flow changes, the color-coded duplex sonography and the novel vector flow technique were used. The evaluation was performed of vector morphology changes, turbulence, and wall resistance measurements.
RESULTS:
There were changes after acute and chronic thrombosis in 9 cases, and venous compression in 7 cases. Turbulence was measurable from 0.01 % to 64.44 %, the average turbulence was 19.73±22.06 %. Wall resistance measurement showed values from 0.01 Pa to 3.14 Pa, depending on the age of the thrombosis or compression. The reference veins showed turbulence of 0.94±1.5 % and a mean wall resistance of 0.05±0.05 Pa. There are statistically significant differences between normal and thrombotic or compressed veins in terms of maximum wall stress (p = 0.006) and mean degree of turbulence (p = 0.012), while the difference in mean wall stress is not statistically significant (p = 0.058).
CONCLUSION:
Despite still existing technical limitations, the combination of V-flow and wall stress measurements in jugular vein changes suggests a high diagnostic potential.
Introduction
A normal, healthy vein is soft and changes its diameter in response to breathing. There are several factors that can alter the vascular wall of a vein, such as thrombosis. The development of thrombosis is favored by changes in flow, blood composition, or endothelial composition [1]. The so-called Virchow triad is favored by various risk factors [2]. One of the main causes of thrombosis is the rupture of an atherosclerotic plaque [1], immobilization, obesity, active malignancies, and many others. Regarding thrombosis formation in COVID-19 infection, another study group investigated the influence of coagulation biomarkers. It was described that D-dimer had the best predictive value for venous thromboembolism [3]. Another risk factor is also a central venous catheter (CVC) or port system [4], which can alter the flow conditions in the vessel and cause scar tissue. Tumors, lymph nodes, or scar tissue compressing the vein from outside can also affect blood flow and wall tension. All these factors can affect elasticity and cause turbulence in the blood flow. In veins, intravascular pressure is largely dependent on nervous, hormonal, physical, and general regulatory mechanisms [5]. In the post-thrombotic syndrome, inflammatory changes in the venous valves and subsequent connective tissue remodeling make the vessel wall more rigid [6]. Thus, the residual blood flow around the thrombosis can no longer build up pressure on the vascular wall of the vein.
The diagnostic standard for detecting thrombosis is to perform color-coded duplex sonography (CCDS) [7]. This procedure allows the assessment of arteries and veins and their morphology and flow conditions. It provides the clinician with a reliable method of diagnosing thrombosis by demonstrating an echogenic lesion within the vessel, through which the affected vessel can no longer be compressed. The dynamic feature of color duplex shows the residual flow in the vessel as well as the direction of flow in either blue or red, depending on whether the blood is moving away or toward the transducer. This evidence, together with Wells score and D-dimer evaluation where applicable, is considered to be evidence of thrombosis [8]. However, CCDS has limitations such as different hemodynamic evaluation of low venous flow.
Therefore, vector-flow imaging (V-flow) is also used to better assess hemodynamic flow changes [9–12]. The vectors indicate direction, velocity, and any turbulence. The wall stress acting on the vessel is also recorded. The measurement of wall stress can provide an indication of vessel status. This principle is used to visualize residual blood flow in acute and previous thrombosis and helps to assess turbulence and flow direction. In the event of thrombosis, the B-scan and special measurements are used to determine the wall stress in Pascal (Pa), which allows conclusions to be drawn about the duration of the thrombosis. Furthermore, the possible formation of collateral vessel formations is recorded.
The aim of this study was, firstly, to visualize the different flow phenomena in thromboses of different ages in the jugular veins using V-flow, and, secondly, to analyze the wall stress.
Material and method
Between June and July 2023, a total of 15 patients (male n = 8, female n = 7) were enrolled in the study and compared to five healthy individuals (male n = 3, female n = 2). This was approved by the local ethics committee (20-2122-104). The patients had received or were receiving a CVC (n = 4) or a port system (n = 4) during surgery or systemic therapy. Patients without foreign material in one of the jugular veins (n = 13) and those with compression of the vessel by tumors, lymph nodes or scar tissue (n = 7) were also included.
The diagnosis of thrombosis was made sonographically using high resolution ultrasound device (Resona R9, Mindray). All patients were examined by an experienced examiner with the latest probe technology (L9-3U Linear Array transducer, 2.5 to 9.0 MHz, Mindray). Measurements of blood flow, wall stress, and turbulence were made in each case at the site prior to thrombosis. The technology of sonography is based on reflected sound waves, which are detected by the device and converted into electrical pulses [13]. The calculated image is displayed in different grey levels as a so-called B-scan. The function of the CCDS is based on the color-coded display of flow direction and velocity of the blood. Stationary pixels, such as the vessel wall or surrounding connective tissue, are still displayed in grey scale. The principle of V-flow is based on the visual representation of erythrocyte flow as vectors. V-flow is a dynamically displayed ultrasound method with high frame rate (FR: 374∼1240 Hz). The velocity is displayed visually as vectors. This is based on the multidirectional ultrasound waves recorded from different angles [11]. The Doppler transmission in combination with the focused waves produces a grey scale B-mode image with high spatial resolution simultaneously with the vector flow. The vector velocity is reconstructed based on the estimated velocity components. This indicates the movement of erythrocytes, which are coded with different numbers, lengths, and colors. An antegrade erythrocyte flow of is represented by green vectors, a non-directional flow by yellow vectors and a non-directional turbulent flow by red vectors [9–12]. Wall stress measurement was also performed. This can provide an indication of the vascular status. Values below 0.4 Pa are considered favorable for plaque development [10].
The vessels were first identified in B-scan mode and visualized in longitudinal and transverse sections. Flow was visualized using CCDS, which allowed inference of flow direction. Advanced imaging was performed using V-flow. All patients were followed up with CCDS over a period of six weeks to three months.
Statistical analysis
The statistical analyses were conducted using SPSS 27.0 (SPSS Inc., Chicago, IL, USA). The Kruskal–Wallis test was utilized to compare the measured values between healthy vessel walls and those altered by thrombosis or compression and determine statistical significance. Probabilities less than 0.05 were considered to be statistically significant. The ROC-curve and the Youden’s J statistic were employed to calculate cut-off values with a high sensitivity and specificity for maximum wall stress.
Results
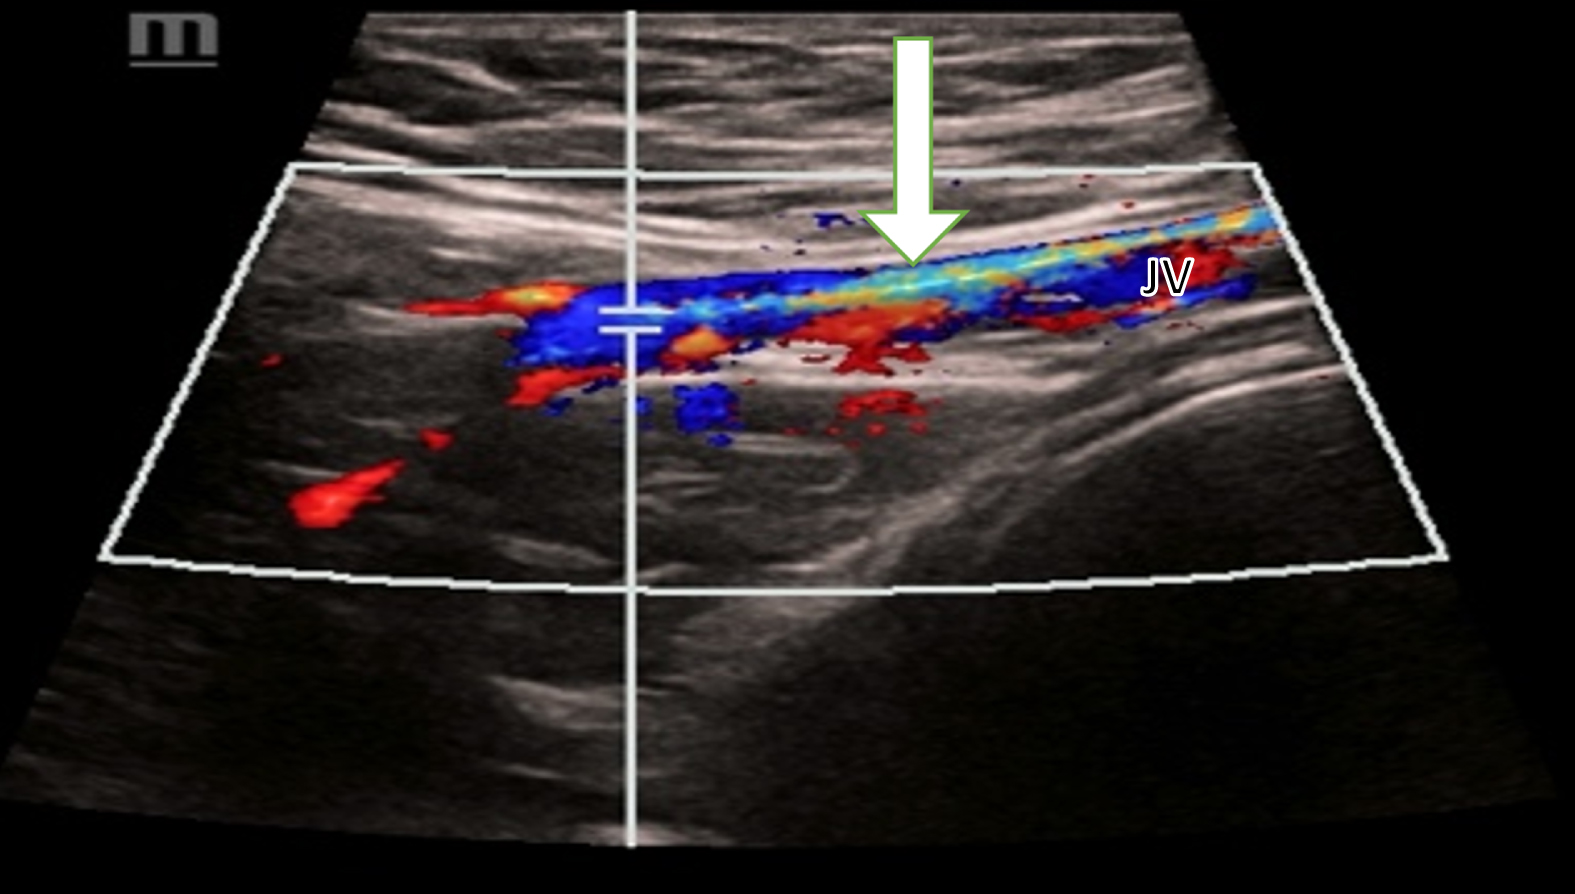
First, the case of a 57-year-old male patient is reviewed. He presents with a diagnosis of moderately to low-grade differentiated intrahepatic cholangiocellular adenocarcinoma with concomitant hemangiosis carcinomatosa (TNM classification: pT2, L0, V0, G3) with initial diagnosis in 05/2021. As part of palliative systemic therapy, a port system was inserted into the left subclavian vein in 01/2022. In 07/2022, the resulting thrombosis of the axillary, subclavian and internal jugular veins on the left manifested itself with swelling of the entire left arm. In the same month, explantation was performed on the left and a port system was implanted in the right subclavian vein. In 04/2023, ten months later, the diagnosis of thrombosis of the right subclavian and internal jugular veins followed. The right internal jugular vein with the acute thrombosis shows minimal residual flow in CCDS (Fig. 1).
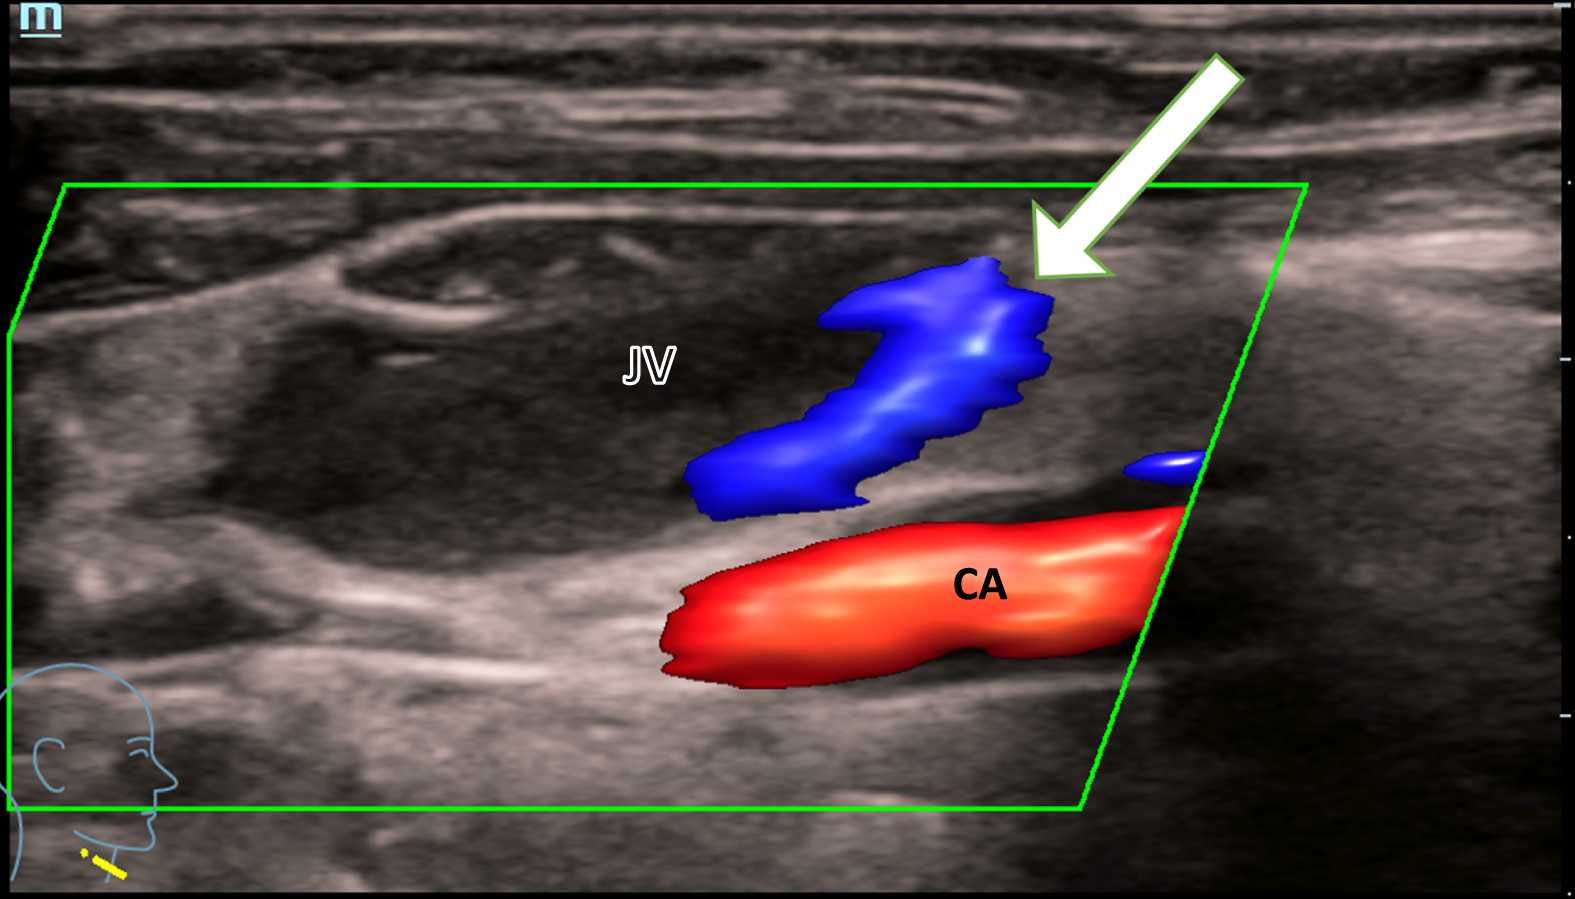
Minimal marginal blood flow (white arrow) of the jugular vein (JV) in a patient with an acute thrombosis, shown with CCDS. Caudal, the carotid artery (CA) with continuous blood flow is shown in red color.
The vein is in a state after CVC and scarring changes, which are shown with vectors (Fig. 2).
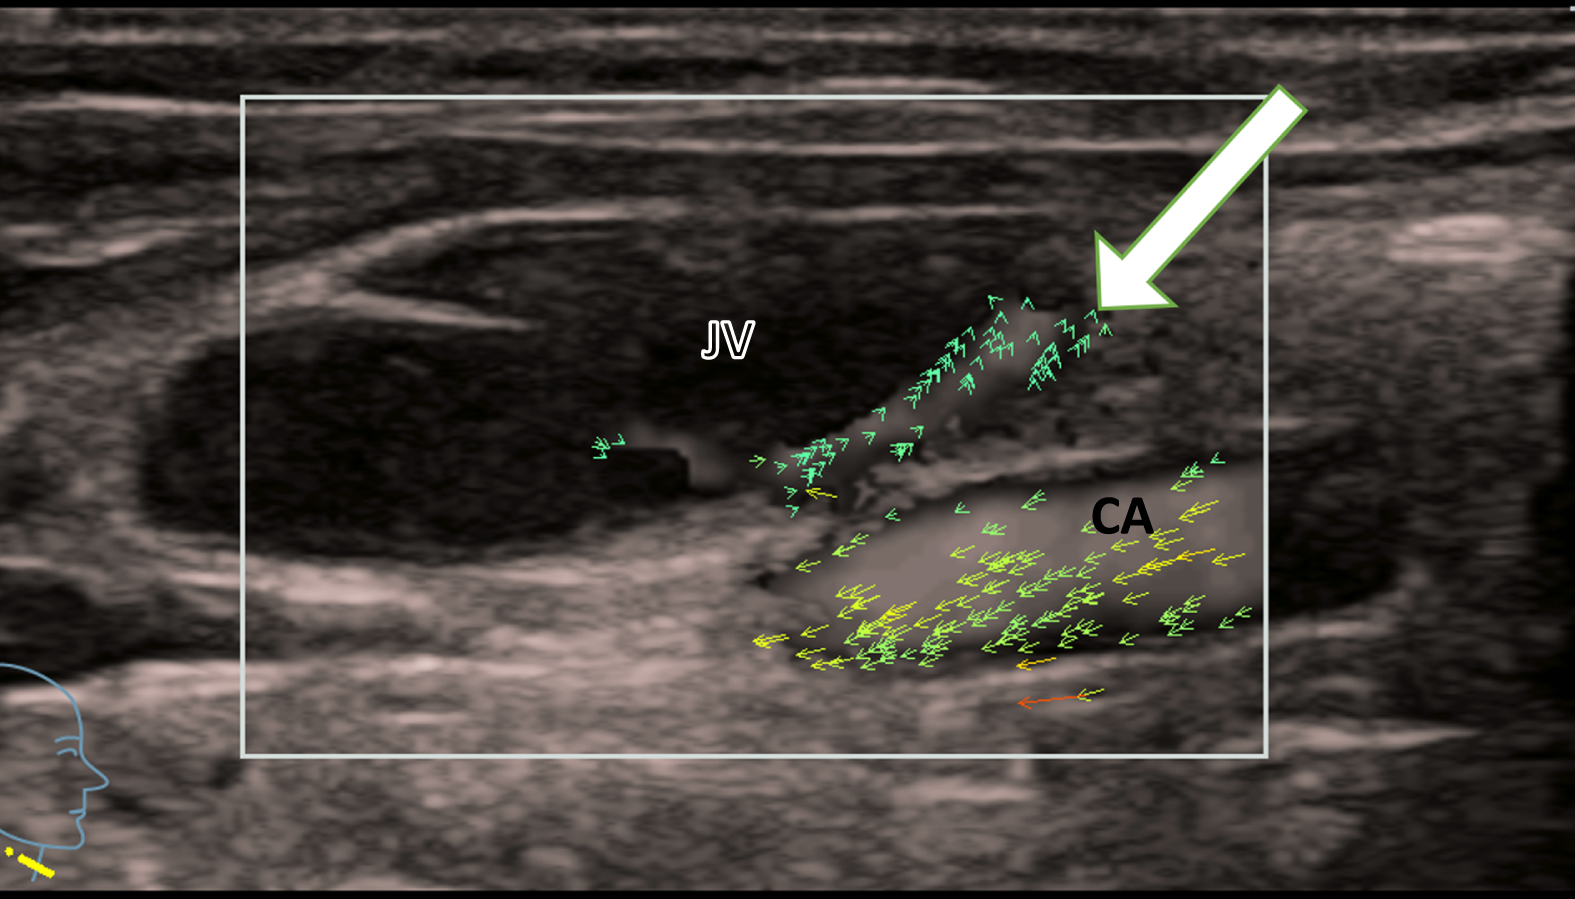
Minimal marginal blood flow (white arrow) of the jugular vein (JV) in a patient with acute thrombosis, shown using vector-flow-imaging. Caudally running carotid artery (CA) with faster vectors in yellow.
Residual flow is barely detectable. Isolated green vectors demonstrate anterograde flow without turbulences (Fig. 3).
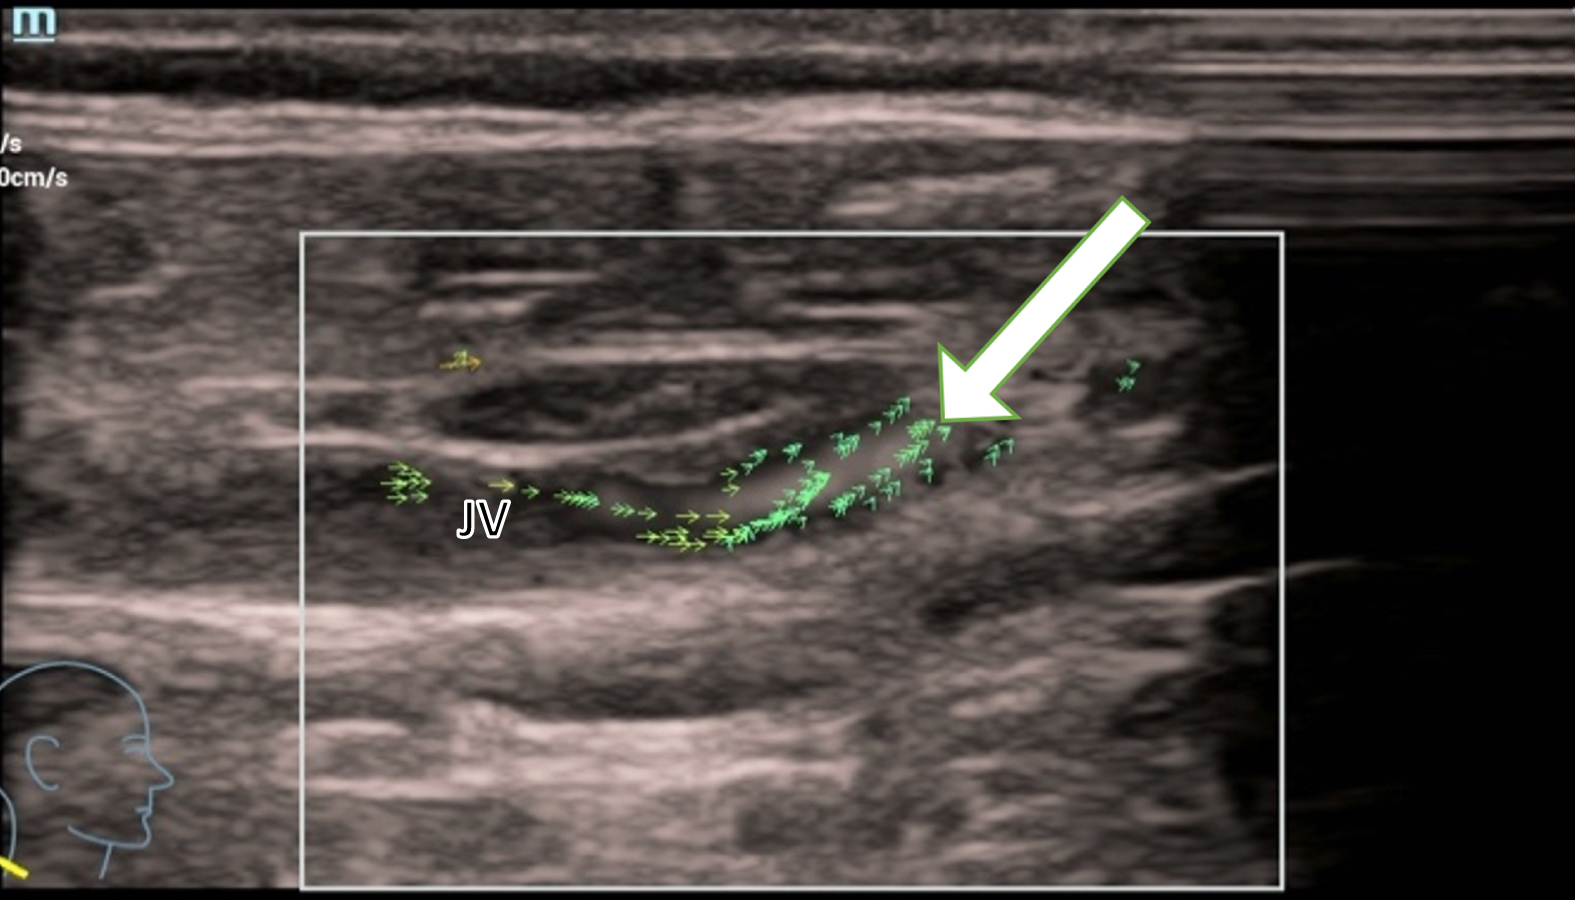
Residual blood flow from an acute thrombosis in the jugular vein (JV) is barely detectable with vectors. Isolated green vectors (white arrow) show the anterograde flow without turbulences.
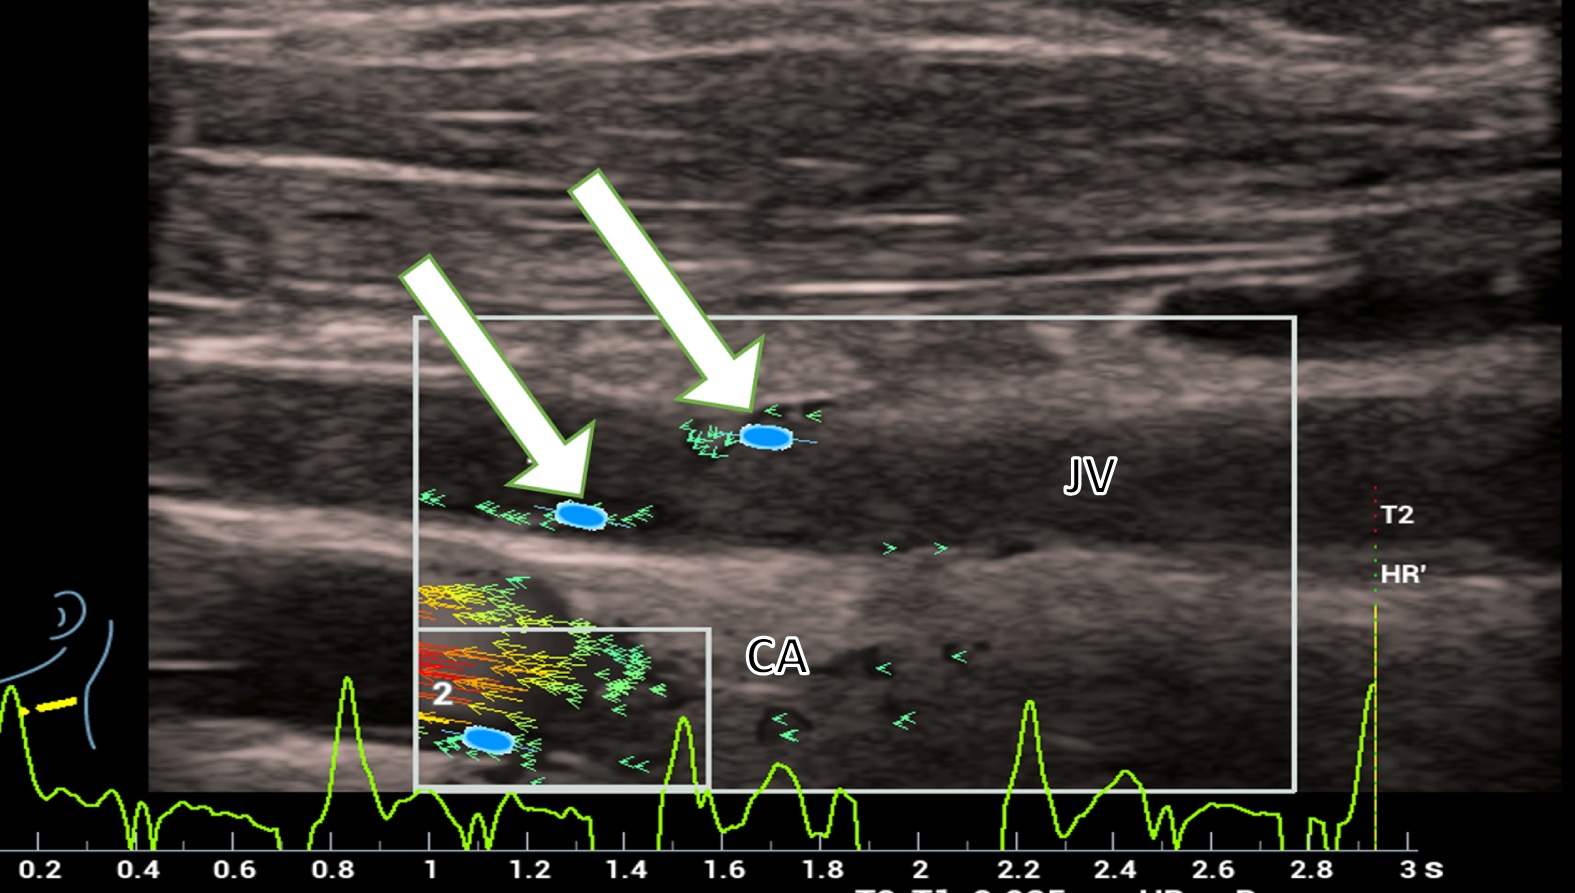
Wall stress measurement yields a pressure of 0.01 Pa and is therefore not measurable acutely (Fig. 4).
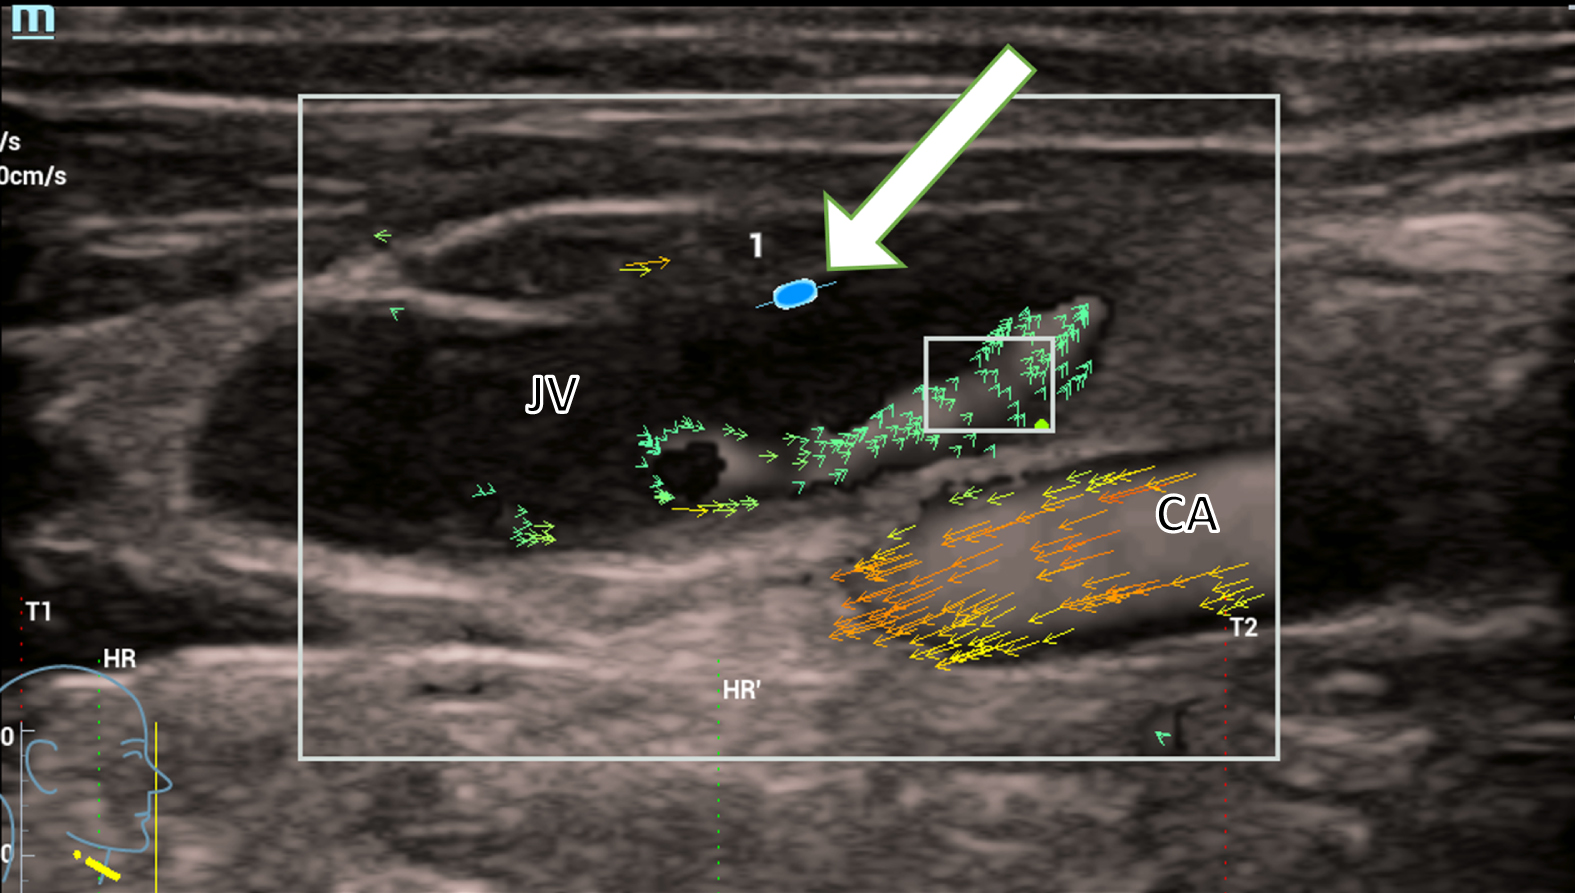
The wall stress measurement (white arrow) yields a pressure of 0.01 Pa, measured at the wall of the jugular vein (JV) in a patient with an acute thrombosis. The pressure is not directly measurable. In the carotid artery (CA), normal turbulent flow is detected shown by orange and yellow vectors.
In contrast, turbulent flow can be seen in post-thrombotic changes of a previous thrombosis and in long-standing scars in the jugular vein. This is shown as yellow vectors in the V-flow image. This is similar to the turbulent flow in the carotid artery, shown by longer red and orange vectors (Fig. 5).
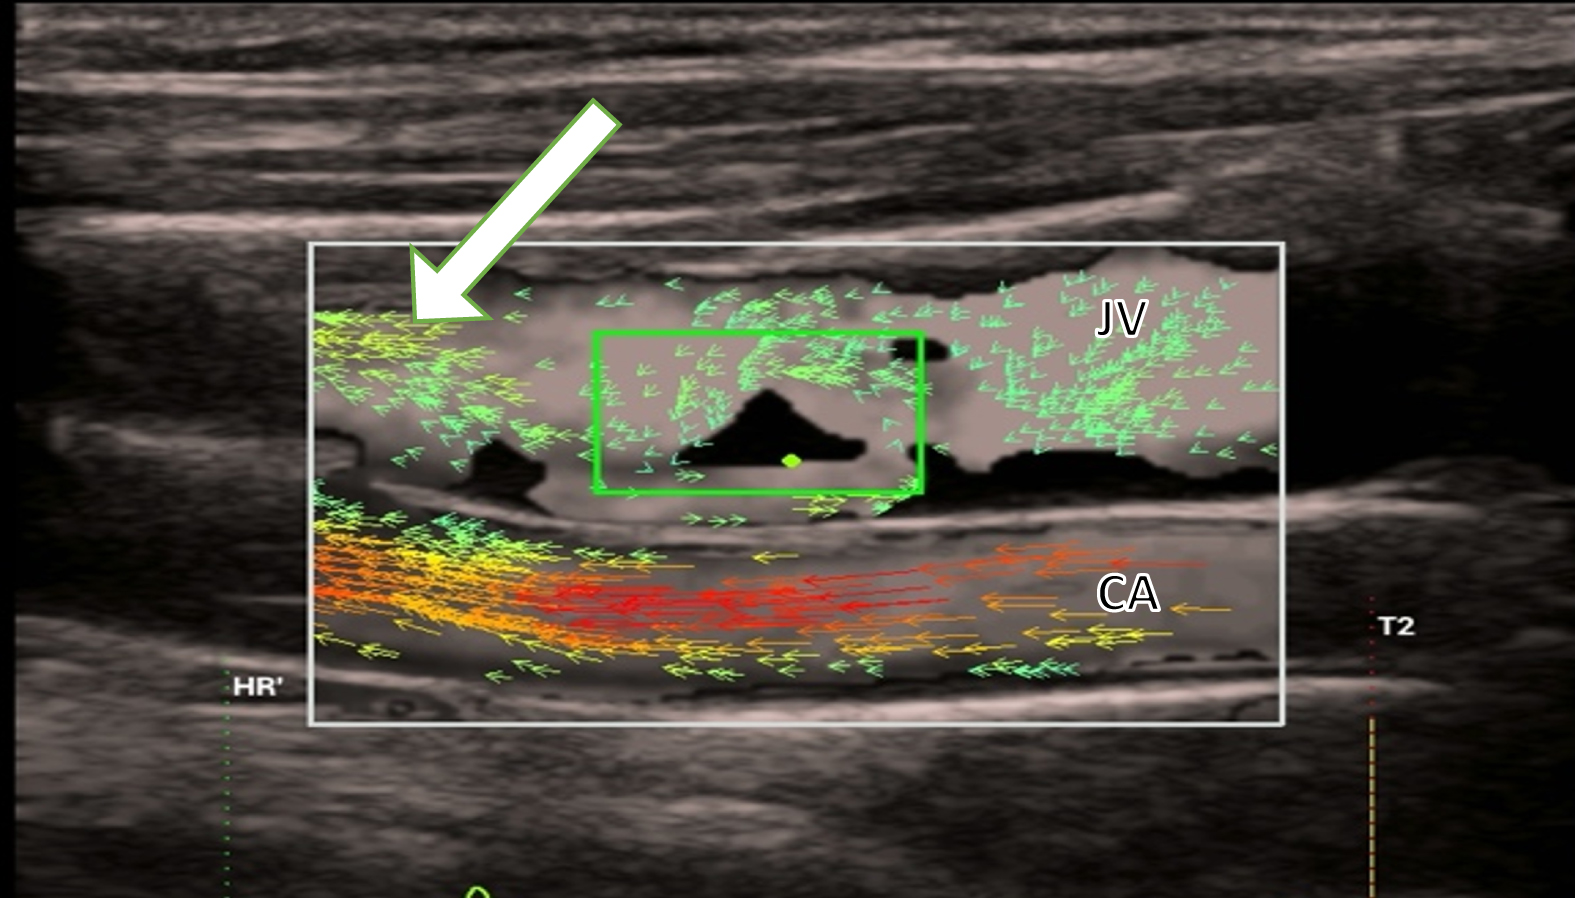
Post thrombotic changes in the jugular vein (JV) represented with yellow vectors (white arrow) showing non-directed blood flow. This is similar to the turbulent flow of the carotid artery (CA), shown with longer red and orange vectors.
The wall stress measurement shows a pressure of up to 1.86±0.62 Pa in the internal jugular vein (Fig. 6).
Wall stress measurement (white arrows) shows a pressure of up to 1.86 Pa in the internal jugular vein (JV) in a patient with post thrombotic syndrome. The carotid artery (CA) shows faster blood flow indicated by red and yellow vectors.
External compression of the jugular veins can also affect blood flow. This can be caused by tumors, lymph nodes or scar tissue. In the case of a 69-year-old patient, scarring of the tissue following lymph node extirpation of unclear etiology led to compression of the jugular vein. In CCDS, the turbulent flow conditions can be clearly seen because it has been optimized for low flow settings (Pulse Repetition Frequency (PRF) < 1000 Hz, wall filter < 50 KHz, color gain flow adapted). Compression of the lumen alters the flow conditions and causes partial flow reversal with turbulence (Fig. 7).
External pressure on the jugular vein (JV) caused by scar tissue (white arrow) due to cervical lymph node extirpation. CCDS shows the changes in blood flow with flow reversal and turbulence by the red, blue, and yellow color.
The external pressure and the narrowing of the lumen increase the pressure on the vessel wall from the inside. This is shown by the wall stress measurement with values of 1.40 Pa and the blood flow is represented by scattered green vectors. Turbulences increases up to values of 10.45 % (Fig. 8).
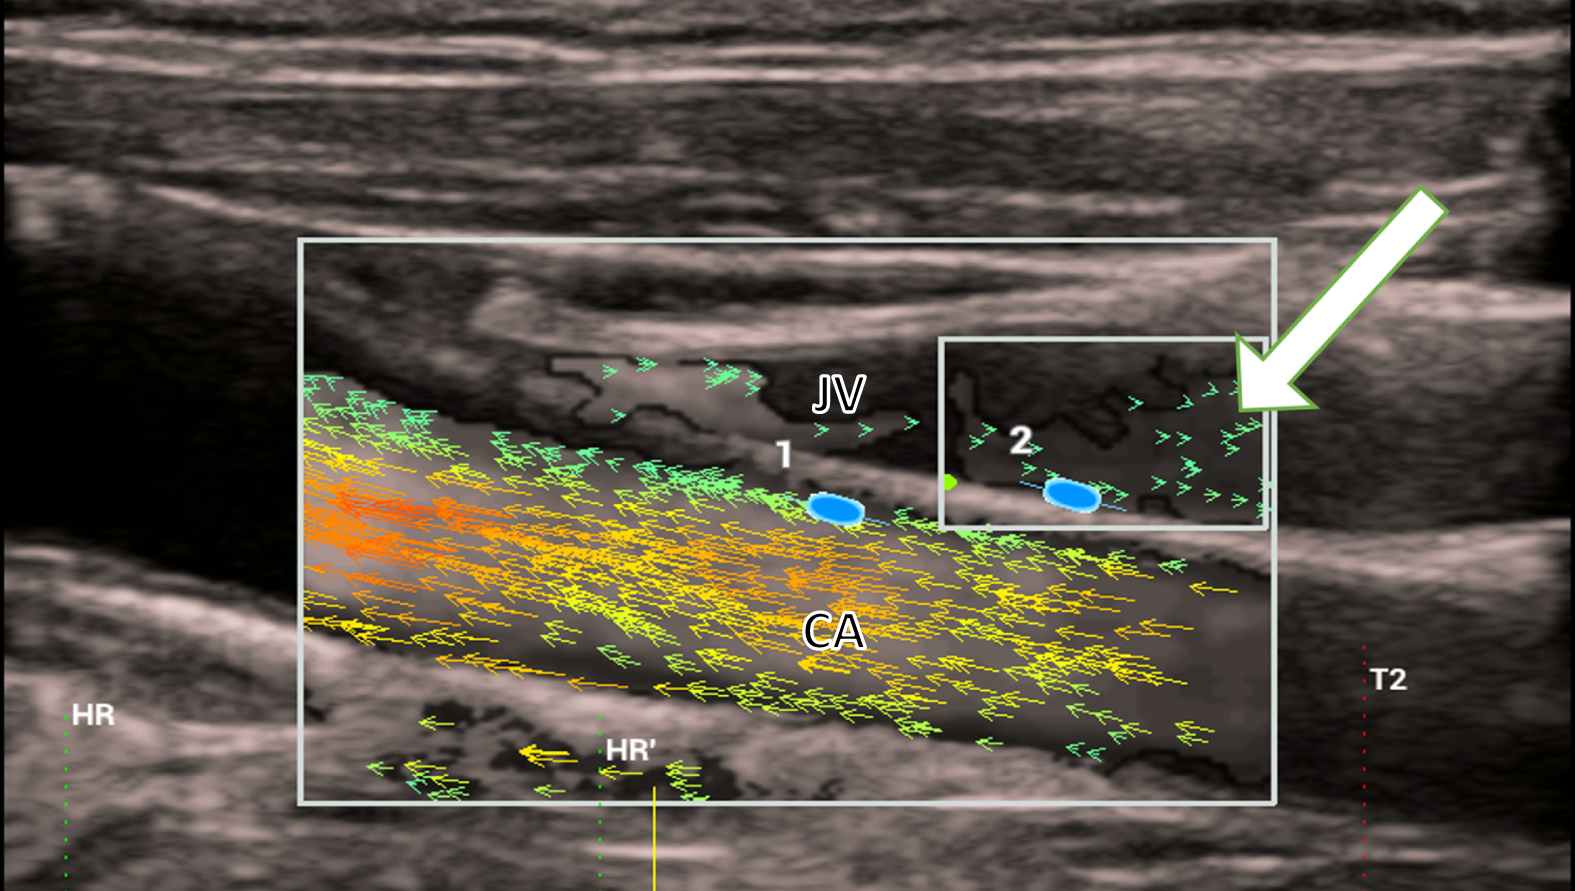
The external pressure and the narrowing of the lumen increase the pressure on the vessel wall from the inside and decrease the blood flow in the jugular vein (JV). This is shown by the wall stress measurement (2) with values of 1.40 Pa and the scattered vectors (white arrow).
Gender, age, and clinical diagnosis with clinic were recorded for 15 patients (Table 1).
Fifteen patient cases broken down by gender (f = female, m = male), age (years), and clinical diagnosis with clinic
Flow velocity ranged from values of 0.01 to 44.7 cm/s (mean 16.38±10.58). Wall stress reached values from 0.01 to 3.14 Pa (mean 1.11±0.84) and turbulence from 0.01 to 64.44 % (mean 19.73±22.06).
Acute thrombosis shows a flow velocity of 8.23±5.39 cm/s on average, in chronic thrombosis of 18.76±10.98 cm/s and in venous compression of 20.09±10.45cm/s. Wall stress is lowest in acute thrombosis with a mean value of 0.10±0.17 Pa, higher in chronic thrombosis at 1.24±0.62 Pa, and highest in venous compression at 1.66±0.70 Pa. In turbulence, the values behave comparably to wall stress. The mean values are lowest for acute thrombosis (0.91 % ±0.54), higher for chronic thrombosis (11.61 % ±0.01), and highest for venous compression (25.55 % ±23.74).
In addition, the values of five healthy subjects are recorded for comparison of wall stress, flow velocity and occurrence of turbulence (Table 2).
Five reference cases with maximum and mean wall stress values, flow velocities and occurrence of turbulence
Normal, healthy veins exhibit lower maximum and mean wall stress, along with lower standard deviations, indicating a softer and more homogeneous vessel wall in non-thrombotic and non-compressed veins. On the other hand, veins with a vessel wall altered by thrombosis or compression not only display higher maximum and mean wall stress but also a higher mean degree of turbulences.
Statistical analysis reveals significant differences between normal and thrombotic or compressed veins in terms of maximum wall stress (p = 0.006) and mean degree of turbulence (p = 0.012), while the difference in mean wall stress is not statistically significant (p = 0.058) (Table 3).
Comparison of healthy with pathologically altered veins with respect to maximal and mean wall stress, flow velocity, and occurrence of turbulence. Detection of significant differences with the p-value
In order to find a more precise demarcation between normal and altered vessel walls in V-flow, cut-off values for the maximum wall stress were calculated. Since there was no statistically significant difference in mean wall stress, a cut-off value for this category was not calculated. As the wall stress increases, the likelihood of the vessel wall being classified as altered by thrombosis or compression also increases. The highest sensitivity and specificity value of 87.5% and 100% was achieved by the maximum wall-stress cut-off value of≥0,31 Pa.
Limitations at this time are that V-flow is a special technique of high-end vascular ultrasound and not available for all users. For final results and cut-off value evaluation multiple evaluations should be performed in the future.
For the first time, the method of V-flow combined with wall stress measurement is applied to jugular vessels with thrombosis of different ages. Four hypotheses were made based on the different patient cases.
In the early stages of thrombosis, the vein wall still resembles a healthy one. There are no changes in its structure. Therefore, our first hypothesis is that acute thrombosis does not show any relevant turbulence in blood flow. The continuous flow is shown by directed green or yellow vectors. The second hypothesis is that its measured wall stress remains around 0.01 Pa due to the residual elasticity of the vein. Both assumptions can be demonstrated by a case of a 58-year-old female patient who received a CVC due to active GvHD (Graft-versus-Host disease). Subsequently, she developed acute thrombosis of the right jugular vein within a few days. The measurement showed a value of 0.01 % turbulence in the blood flow and a wall stress of 0.01 Pa. This confirms the first and second hypothesis, the vein wall is still soft and elastic. In this short time that the thrombosis has been present, no inflammatory changes have occurred in the vein that would have made it rigid.
In chronic venous thrombosis, changes in the blood vessel wall can be detected in V-flow, the vessel walls tend to stiffen up. This results in the formation of collateral veins. In V-flow, these chronic thromboses have an expanding and high flow profile of up to 39,4 cm/s which is more turbulent than in acute thrombosis. They reach wall stress measurement values up to 1.86 Pa.
The third hypothesis is that turbulence occurs in chronic thromboses. The vectors were usually depicted as yellow and red in V-flow, representing non-directed turbulent flow. In the case of an 82-year-old female patient with thrombophlebitis of the right arm due to erysipelas, thrombosis of the right jugular vein developed. The patient did not receive a catheter but developed thrombosis, which was diagnosed later. Measurement of turbulence showed a maximum value up to 64.44%. This can be explained by the inflammatory changes in the vessel wall. Due to connective tissue remodeling, the vein wall becomes less elastic, thus increasing resistance.
As a fourth hypothesis we assumed that wall stress not only increases in patients with chronic thrombosis but as well in venous compression. Venous compression from outside, for example by lymph nodes, tumors, or scarring, also increases the pressure in the vessel. This was the case in a 69-year-old male patient. Following cervical lymph node extirpation of unclear etiology, the patient developed post-operative scarring in the area around the right jugular vein. Measurement of wall stress in this area of compression showed values as high as 3.14 Pa confirming the fourth hypothesis.
In this study, we were able to compare acute thrombosis, which occurred for the first time in the last 2 months, with chronic thrombosis, which had been present for 10 months or more. The differentiation is possible based on V-flow and the wall stress measurement. These microvascular findings are consistent with those obtained by CCDS macrovascular analysis. This can be illustrated by comparing Figure 1 and 2. Comparison with five healthy subjects further confirms the four hypotheses. Turbulence and mean wall stress are lower due to the preserved elasticity of the vein. Furthermore, higher mean velocities of blood flow are achieved in healthy vessels.
All of these blood flow and vessel wall findings allow conclusions to be drawn about whether and how long a thrombosis has been existed in a vein. Therefore, V-flow helps to choose the right therapy. But it also facilitates the follow up of a diagnosed venous thrombosis by depicting the healing process of a blood vessel after the thrombus has been removed. Further V-flow studies on venous thrombosis are required to more accurately predict whether recanalization of an affected blood vessel is possible.
In a first study, Kammerer et al. were able to image the valve of the great saphenous vein in the area around the cross using the V-flow technique [14]. Many other working groups have already dealt with the diagnosis, therapy, and development of thrombosis.
The diagnosis can be supported by a mobile handheld ultrasound. It can be performed by a W-Lan supported device (VScan Air) independent of the location [15]. With this device, imaging can be performed using CCDS. Another working group compared this possibility with high resolution flow (HR Flow) and Glazing flow. They concluded that, among other things, venous hemodynamic changes can be shown with higher image quality [16]. Other working groups were concerned with improving oral medication against thrombosis. A protective effect against clot formation was observed with rivaroxaban which prolonged clotting [17]. It was described that in COVID-19 infection D-dimer as biomarker had the best predictive value for venous thromboembolism [3]. Abdominal thrombosis may be a complication of this infection, and sonographic examination may help to detect and treat this early [18].
Limitations of this study are its retrospective design and the time-consuming examination. In addition, V-flow is only available on high-end devices (Resona 7 and Resona R9, Mindray) with special probe technology. There are no officially standardized schemes for V-flow-procedures. Moreover, the V-flow examination box or window can only be modified horizontally and vertically, not diagonally [19]. At present, CCDS is required for the final evaluation of flow changes of less than 18 cm/s because it allows velocity detection for flows less than 5 cm/s. Nevertheless, vector detections were achieved in all cases. In addition, the examinations had to be performed by an experienced sonographer on a pre-screened group of patients.
V-flow did not allow a complete differentiation of acute and chronic venous thrombosis in all cases. Further sonographic studies are required to improve the informative value of V-flow for example to detect venous compression by tumors or other pathologic structures.
Conclusion
V-flow has great potential to improve microvascular analyzation and therefore the treatment of venous thromboses. It will be a good complement to the established ultrasound modes B-mode and CCDS.