
Abstract
BACKGROUND:
The initiation biomarker-driven trials have revolutionized oncology drug development by challenging the traditional phased approach and introducing basket studies. Notable successes in non-small cell lung cancer (NSCLC) with ALK, ALK/ROS1, and EGFR inhibitors have prompted the need to expand this approach to other cancer sites.
OBJECTIVES:
This study explores the use of dose response modeling and time-to-event algorithms on the biomarker molecular targeted agent (MTA). By simulating subgroup identification in MTA-related time-to-event data, the study aims to develop statistical methodology supporting biomarker-driven trials in oncology.
METHODS:
A total of n patients are selected assigned for different doses. A dataset is prepared to mimic the situation on Subgroup Identification of MTA for time to event data analysis. The response is measured through MTA. The MTA value is also measured through ROC. The Markov Chain Monte Carlo (MCMC) techniques are prepared to perform the proposed algorithm. The analysis is carried out with a simulation study. The subset selection is performed through the Threshold Limit Value (TLV) by the Bayesian approach.
RESULTS:
The MTA is observed with range 12–16. It is expected that there is a marginal level shift of the MTA from pre to post-treatment. The Cox time-varying model can be adopted further as causal-effect relation to establishing the MTA on prolonging the survival duration. The proposed work in the statistical methodology to support the biomarker-driven trial for oncology research.
CONCLUSION:
This study extends the application of biomarker-driven trials beyond NSCLC, opening possibilities for implementation in other cancer sites. By demonstrating the feasibility and efficacy of utilizing MTA as a biomarker, the research lays the foundation for refining and validating biomarker use in clinical trials. These advancements aim to enhance the precision and effectiveness of cancer treatments, ultimately benefiting patients.
Introduction
The initiation of biomarker-driven trials has transformed the oncology drug development process. The approach with conventional drug development process (phase I, phase II, phase III) is being abandoned for the whole procedure where first-in-human explore the dose and activity of different sites of cancer (“basket studies”). It becomes the basic platform for drug development. The ALK, ALK/ROS1 and EGFR inhibitors trial for non-small cell lung cancer (NSCLC) are now available. It is the real examples of current requirement. Now it is required to be expanded for all other sites. Now the subgroup identification on relevant treatment benefit is the most challenging task [1, 2, 3, 4]. Subgroup identification always is taken as a secondary objective for any prospective study. Studies are not powered enough to identify the subgroups with statistical inference. Identification of proper subgroup only provides successive treatment. It promotes treatment practice towards personalized medicine. However, it is not an easy task to perform. Usually, it is hypothesized that covariates are independent of treatment effect. But it is expected that they are contributed towards treatment success. There are other issues like the occurrence of bias towards selecting the subgroups. Recently the related statistical challenges are stretched towards developing the personalized medicine [5]. There are several attempts to develop a statistical methodology to identify and work with the subgroup. The tree-based approach is one of the widely applied methods to generate subgroups from a trial data [6, 7, 8, 9, 10]. The penalized regression model [11] and Bayesian [12] is also observed as capable enough to work with subgroup identification and draw statistical inference. However, all methods are dedicated to the randomized control trial setting. The statistical inference supports to draw an inference between treatment and control arm. The extension from the randomized controlled trial set up to dose finding modeling all is served by statistical methodology. A methodology is developed to work with subgroups for phase-II and phase-II dose-finding studies separately [13, 14]. The challenge is to subgroup identification for different doses is to keep track about changes of doses with different baseline features of the patients. It is required to assume that baseline features are same in the specific subgroup and only changes of doses make the influence on treatment outcomes. Similarly, dose-response relation changes with different subgroups. It is possible to handle through dose-response functional relationship [14, 15]. The dose response relationship is dependent on selection of potential biomarker value. The suspected biomarker is required to be filtered with diagnostic accuracy test. The popular tool to measure the diagnostics accuracy of a clinical feature is obtained by receiver operating curve or area under curve (AUC) [16]. Further, AUC is comprehensive measurement of false positive rate (FPR) and True positive rate (TPR). The TPR is also called as sensitivity and (1-FPR) as specificity. However, there are several limitation on predicting capability of TPR, FPR and AUC [17, 18]. In this scenario, the positive predictive value (PPV) is found satisfactory to predict the future time point time to event outcomes. The PPV is more sensitive with the performance of AUC. It may be observed with poor measurement while the population prevalence is very low. However, the PPV can be presented with attractive matric to test the predictive power of a risk score [19]. The risk score is generated from baseline characteristic of the data and PPV is adapted through dynamic approach towards prediction of future data. The PPV is defined as
where
It is further separated into sub-models to cover different subgroups by
It helps us to solve the problem with Bayesian parametric modeling for
An example of different subgroups and their effect on Molecular Target Agent y-axis,Molecular target agent; x-axis, dose.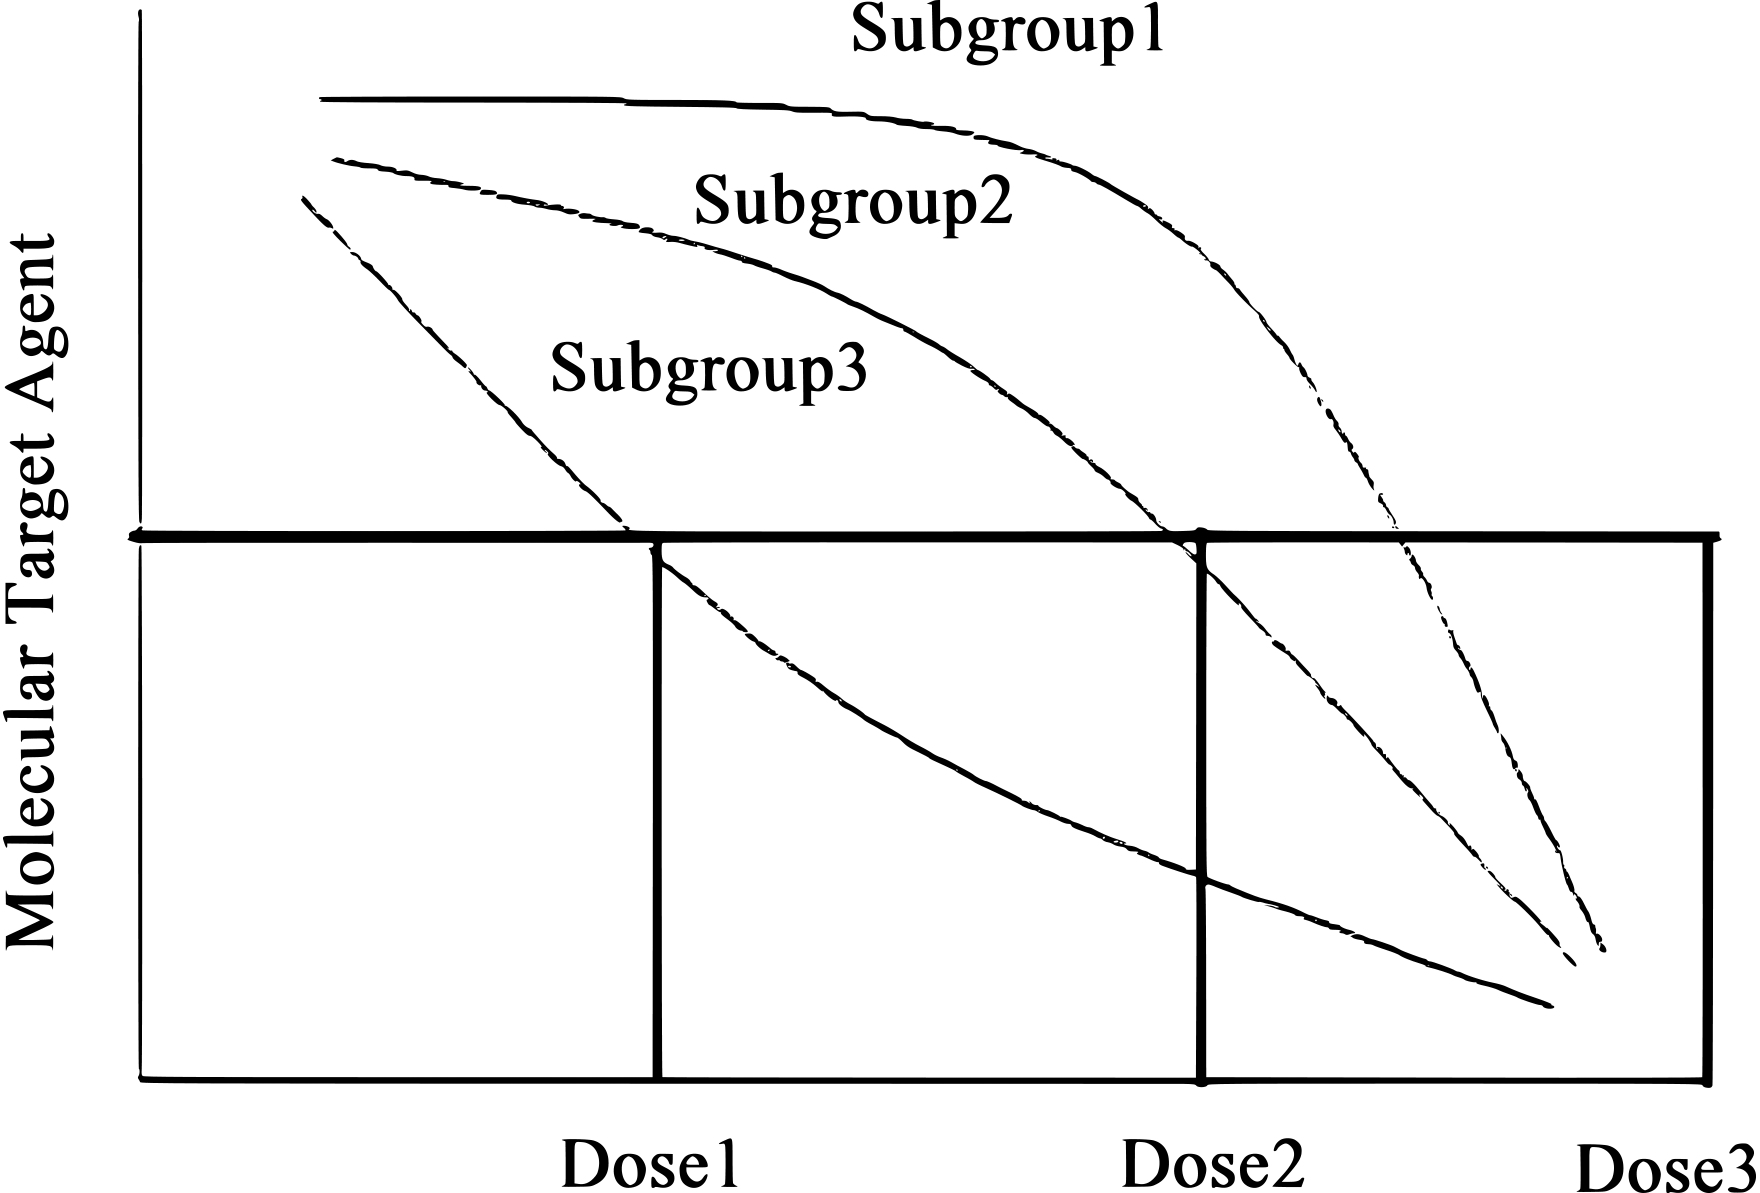
Dose and MTA relation.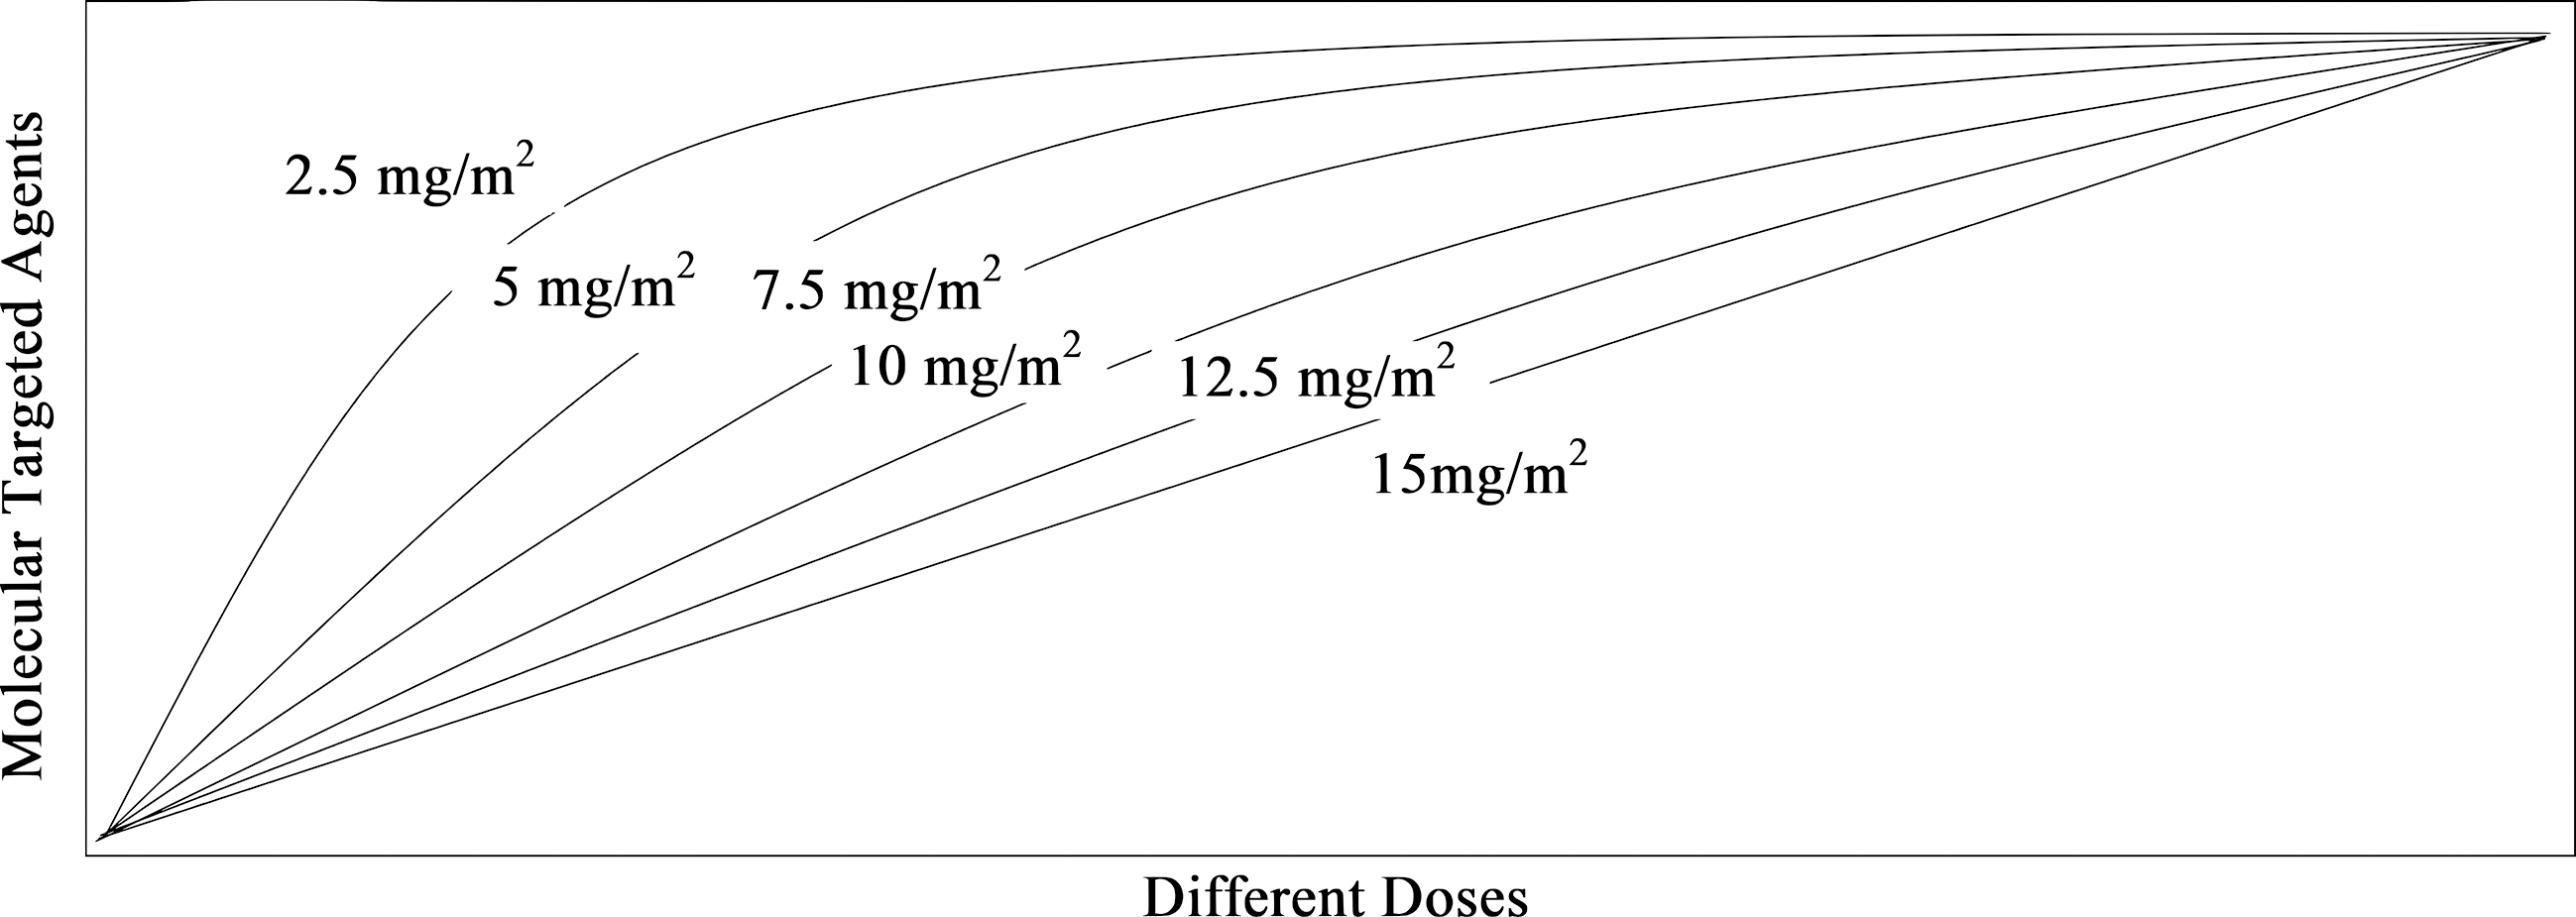
Any study dedicated towards personalized medicine is relatively new. The application of personalized medicine in oncology setup is not in common practice. There are some ethical constraints. But it is the need of the hour towards better successive treatment. Randomization of patients in different treatment groups towards looking their biomarker profile is relatively uncommon. We failed to get permission to use real data for illustration in oncology setup due to ethical constraints. In this analysis, a dataset is prepared to mimic the situation on Subgroup Identification of MTA for time to event data analysis. A total of six doses are generated as
Modeling
Dose response modeling
We will investigate the dose-response modeling based on maximum tolerated activity (MTA) and then extend it towards a time-to-event algorithm. Suppose we have a total of n patients selected and assigned to different doses (di). The response is measured through MTA and assumed as a series of values
The placebo effect is considered as
The
In a clinical trial, it is assumed that treatment effects are equally effective in any population. Only baseline features of the patients are incorporated and understand they are important at the design stage of the trial. The conventional technique to measure the baseline covariates
The term
In this study, we focus on the response value, which is measured as a continuous variable and defined as Z. The event time data is prepared through the measurement time T. The positive predictive value (PPV) and true positive rate (TPR) [31, 32] is defined as
The duration of event is considered as
Now the TPR provides the distributional form of
Similarly,
Now
The distribution function of the MTA value till the time point
The event rate till the time
The
It may be possible to generate the survival data in the presence of censored information. The occurrence of lost to follow-up of patient’s information is common in any survival analysis. The presence of censoring is presented as
and
The term
The estimator
Now redefined function for
It is concluded as consistent estimator [35]. Now the MTA values are incorporated as
The patients are represented as
If
The pre-treatment and post treatment MTA is defined as
The term
The
The term
The intention to develop model is to classify the patient’s population through their MTA value. The model is prepared as
and
The pre and post treatment MTA values are measured as
and
Now,
The distribution is formulated as
Now the individual label changes of MTA value from pre to post treatment is defined as
The
It is assumed that
and
The
Generally, MTA values are observed as continuous measurement. However, decision about MTA or relevance of any biomarker can only be defined as binary indicator. Commonly measured MTA values are available with pre or post measurement on each patient and corresponding response variable are considered as complete response (CR), partial response (PR), stable disease (SD), progressive disease (PD) etc. Our intention is to induce the response as time to event with PFS or OS. The model is preferred into binary format as
Now
The term
The Receiving Operating Characteristic (ROC) is defined as
Our intention is to split the MTA profile based on ability to prolonged the survival duration. The expected distributional change between pre and post treatment arms are presented as
For
The performance of the proposed model is tested through simulation technique. A simulation technique is performed to mimic the Phase II dose detection module. The intention is to define the subgroups based on exploratory measurement. The mimic data is prepared to represent the dose-response relation, different doses and standard error. A total of
The dose intercept effect is observed through
No treatment effect is present. Treatment effect is present and measured only on MTA as covariate Treatment effect is present and measured through presences of different MTA as covariate
Time-dependent-ROC curve estimation
The results obtained through simulation technique are presented in Table 1. Similarly, different scenarios are presented. The scenario is like
The absence of any subgroups. No treatment effect difference observed between the subgroups. In subgroups, the MTA is achieved with the optimum label as expected. Subgroups for which dose-response relation reached a plateau after incline the dosing label.
Our intention is to identify the doses within the contol limit of MTA. This identification procedure is further extended in next sections. The MTA measurement is assumed to follow normal distribution through
Result observed through simulation technique (
A time dependent AUC estimation on threshold value of a MTA.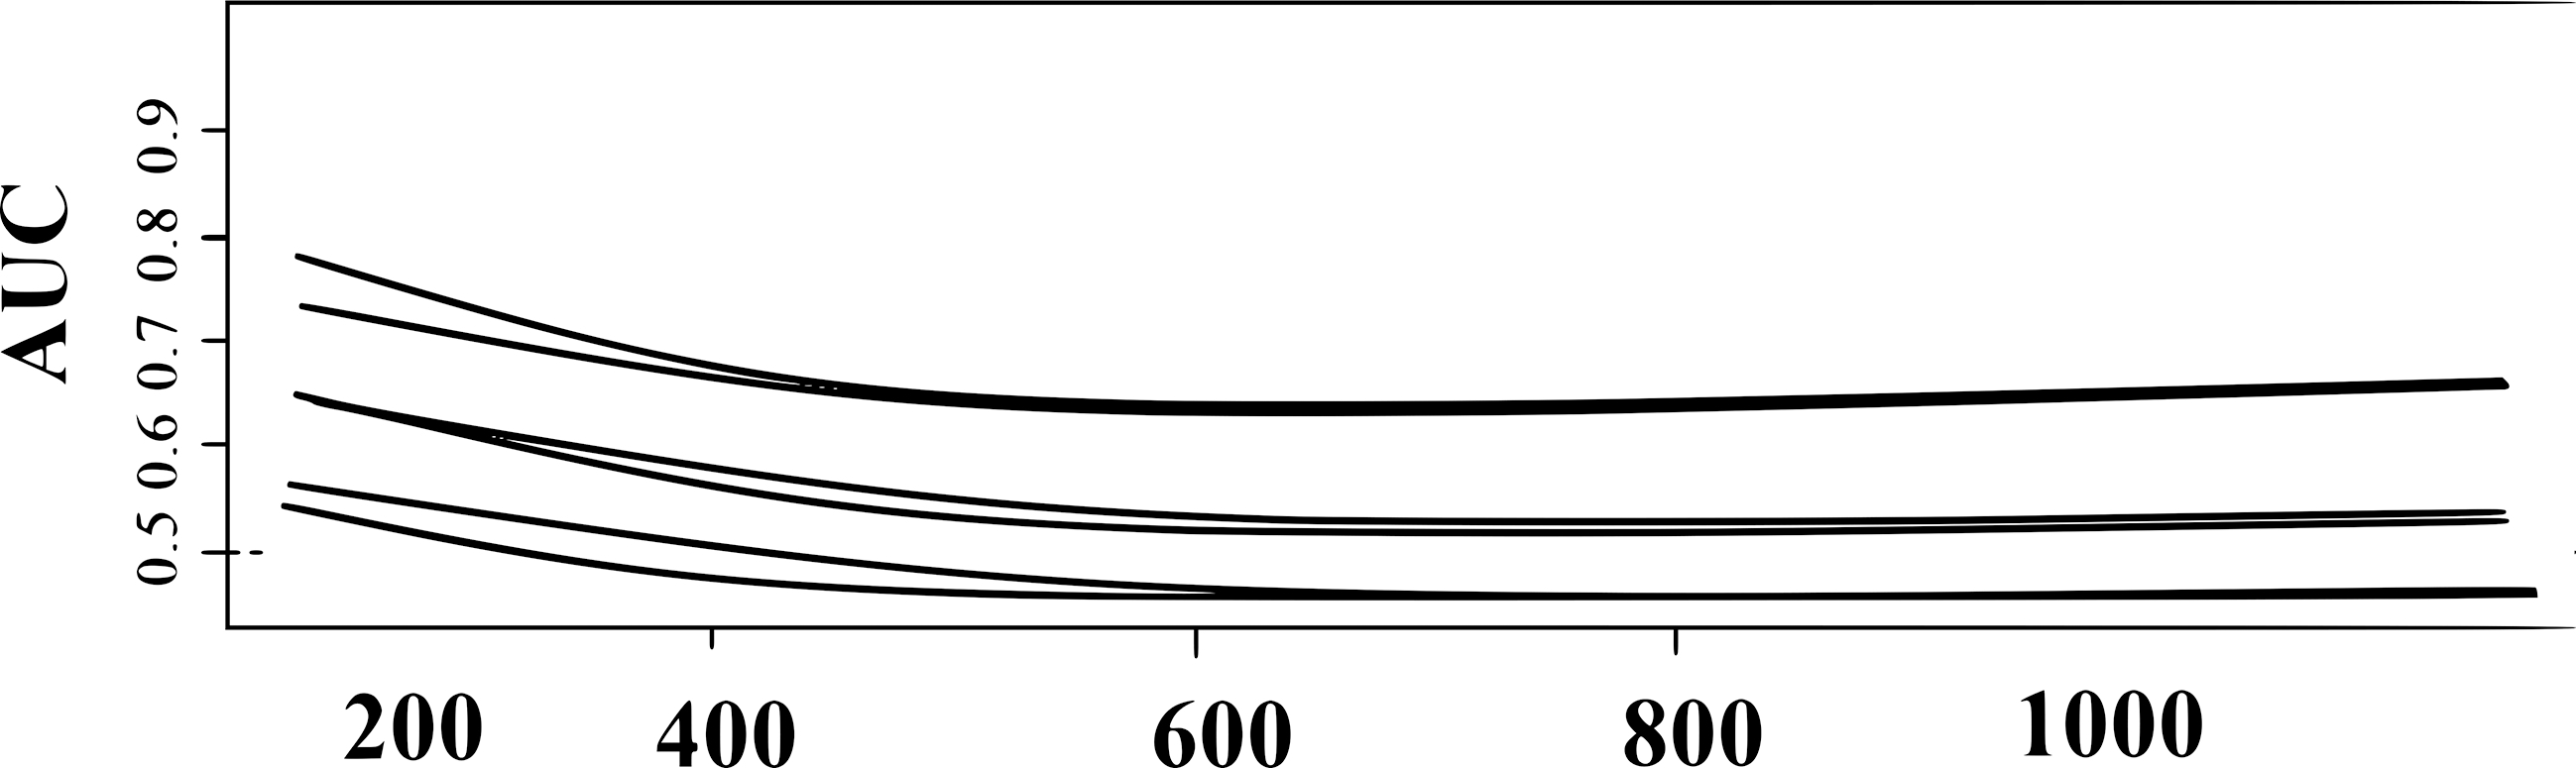
The functional form is captured by
and
Progression free survival with different doses.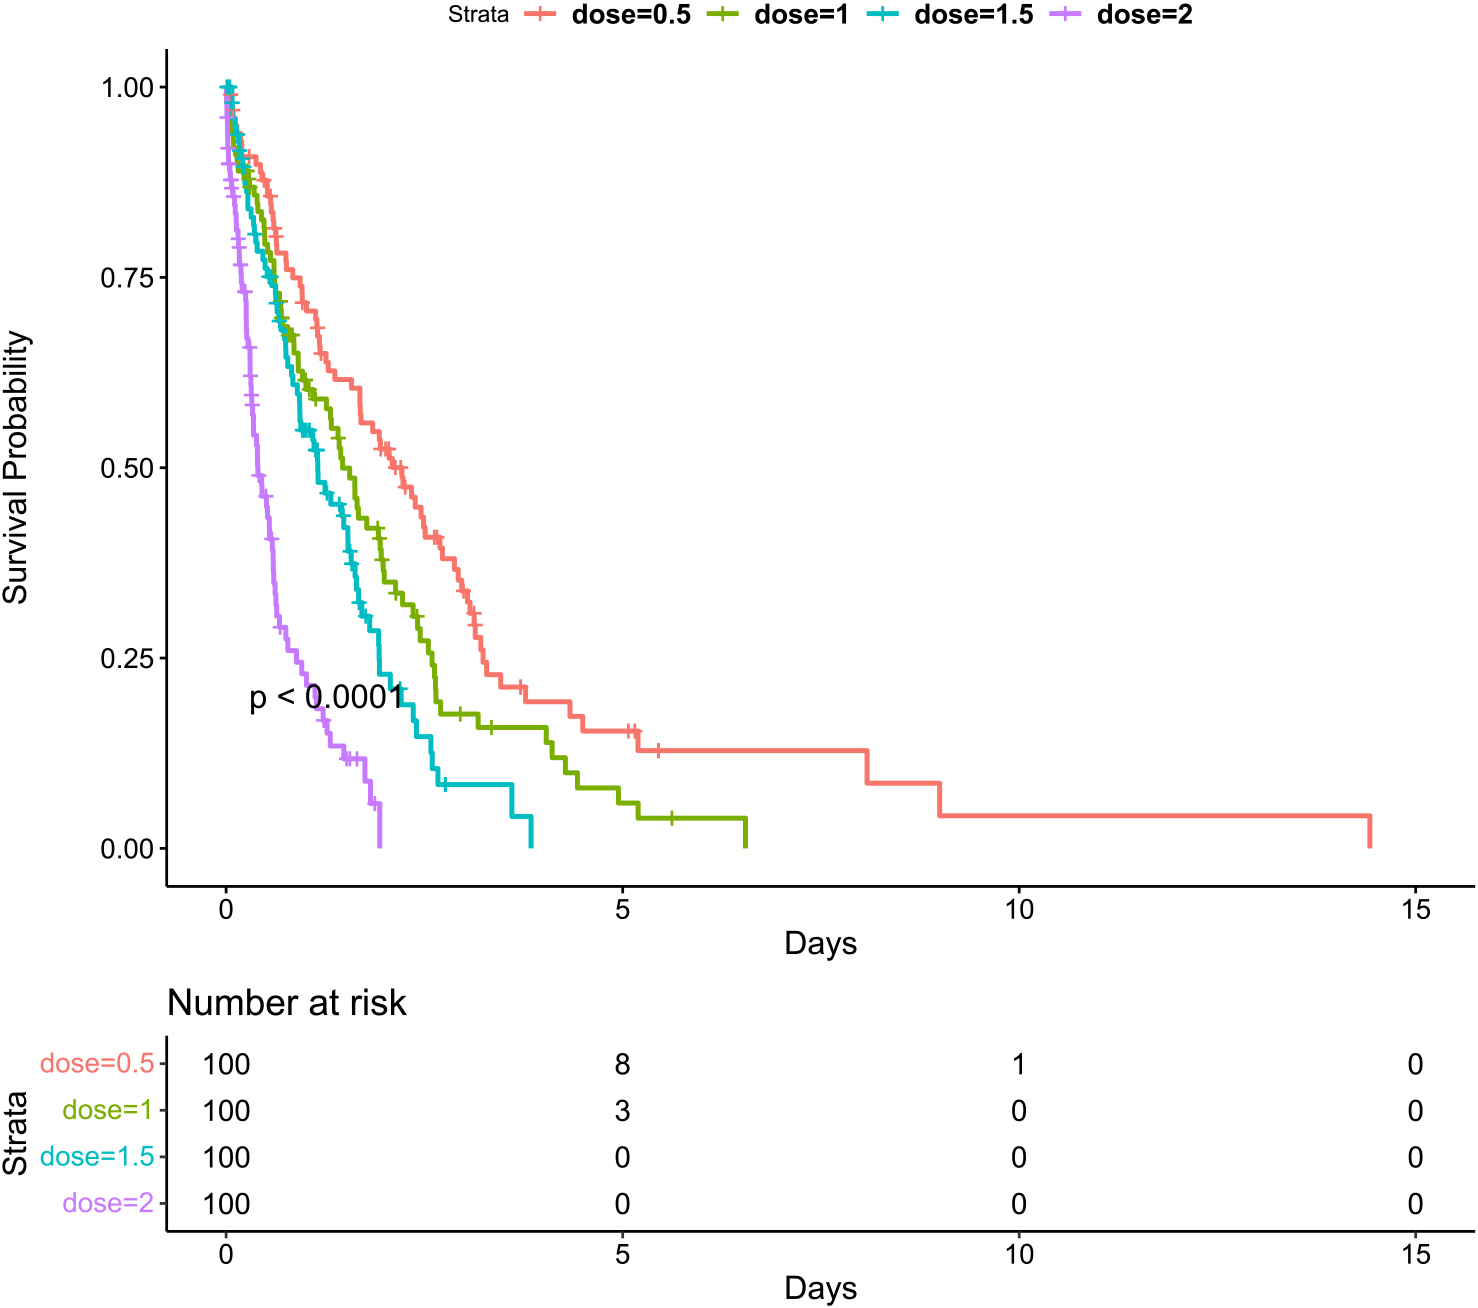
Posterior means computed with
The posterior mean is estimated as
The posterior mean estimates are provided in Table 3.
The computations are performed by MCMC of sample size 20,000. A total of burn-in of 20,000 are observed. The convergences of the MCMC are confirmed visually. The presences of heterogeneity of the MTA are verified graphically for each patient. The posterior estimates obtained through MCMC iterations helps to classify the patients into different clusters.
The MTA is observed with range 12–16. It is expected that there is a marginal level shift of the MTA from pre to post-treatment. Others MTA level change may occur due to the therapeutic efficacy. The loss function for each patient from pre to post-treatment is defined as
The dose is able to control the MTA in post-treatment over the
In conclusion, this study utilizes MCMC with a sample size of 20,000 to perform computations and analyze the heterogeneity of MTA among patients. The results indicate a marginal level shift of MTA from pre to post-treatment and provide insight into the effectiveness of various doses. A threshold value of 14 for MTA is used to cluster patients into two groups, and Kaplan-Meier curves are employed to visualize survival rates. Both parametric and nonparametric approaches are considered for further analysis, with the goal of minimizing posterior predictive loss. Ultimately, this research provides a foundation for understanding the impact of MTA on disease progression and for identifying effective treatment strategies to improve patient outcomes.
Discussion
The dose response modeling is presented with linear and non-linear modeling [15]. The problem with linear and non-linear modeling are settled with spline and B-spline method [41]. Our proposed method is suitable to consider without having assumption between response and covariates. It helps to explore the additional flexibility about dose response modeling.This manuscript is dedicated towards subgroup classification for dose-finding cancer clinical trial. The intention to perform the dose-finding trial has prolonged the duration of PFS and OS. Particularly, this manuscript is bridged the subgroup classification, dose-finding problem and prepare the application of classified prognostic marker towards prolonging the survival. The work is performed through identification of subgroup classification and the application of subgroups into the dose-finding trial. It is really changeling to identify effective treatment with limited sample size. The simulation study is performed to generate the variability due to sample size, treatment effect size etc. The methodology is presented with the exploratory analysis. It is helpful to apply the proposed method to identify subgroups with different dose-response curves and the Bonferroni correction factor is also required to be adopted in this context. The identification of subgroups will be required more with naive approaches without multiplicity adjustments. In this work, only the normal assumption about response variable is assumed. This work is proposed as an integral work to find the best effective dose through MTA. It provides the comprehensive framework to quantify the MTA threshold value, finalize the patients’ subgroups and decide the effective dose. This Bayesian nonparametric approach is used to decide the proper dose for each individual by classifying the patients’ outcomes on the metronomic dose. It is observed that our model can test the conventional clinical hypothesis. This work is merged trough deciding the effective dose on time-to-event data i.e. survival outcomes. It is very difficult to repeatedly measure the MTA due to ethical and feasibility issues. This work is performed with single time point measurement of baseline MTA value. However, computational flexibility can be extended toward repeatedly measurement of the MTA value. This proposed model is used to classify the group of patients into their MTA levels. It is required to consider that the MTA may be harmful to normal cells as an immune suppressor as well. Further, the structural formation is required to considered in this context. The accuracy of MTA is tested by
Footnotes
Acknowledgments
The authors express their sincere gratitude to the editor-inchief, Prof. Sudhir Srivastava, the managing editor, and the learned reviewers for their valuable comments, which have greatly contributed to improving the content and presentation of the original manuscript.
Author contributions
Conception: GKV and AB.
Interpretation and analysis of data: AB and FT.
Preparation of the manuscript: AB and AFP.
Revision for important intellectual content: FT and AFP.
Supervision: GKV.