
Abstract
Breast cancer (BC) is the most common cancer among women and a leading cause of cancer-related deaths worldwide. The diagnosis of early patients and the prognosis of advanced patients have not improved over the past several decades. The purpose of the present study was to identify the lncRNA-related genes based on ceRNA network and construct a credible model for prognosis in BC. Based on The Cancer Genome Atlas (TCGA) database, prognosis-related differently expressed genes (DEGs) and a lncRNA-associated ceRNA regulatory network were obtained in BC. The patients were randomly divided into a training group and a testing group. A ceRNA-related prognostic model as well as a nomogram was constructed for further study. A total of 844 DElncRNAs, 206 DEmiRNAs and 3295 DEmRNAs were extracted in BC, and 12 RNAs (HOTAIR, AC055854.1, ST8SIA6-AS1, AC105999.2, hsa-miR-1258, hsa-miR-7705, hsa-miR-3662, hsa-miR-4501, CCNB1, UHRF1, SPC24 and SHCBP1) among them were recognized for the construction of a prognostic risk model. Patients were then assigned to high-risk and low-risk groups according to the risk score. The Kaplan-Meier (K-M) analysis demonstrated that the high-risk group was closely associated with poor prognosis. The predictive nomogram combined with clinical features showed performance in clinical practice. In a nutshell, our ceRNA-related gene model and the nomogram graph are accurate and reliable tools for predicting prognostic outcomes of BC patients, and may make great contributions to modern precise medicine.
Abbreviations
Introduction
Breast cancer (BC) is the most common cancer among women and a leading cause of cancer-related deaths worldwide [1, 2]. Its morbidity rate is increasing year by year, and the mortality rate ranks second among female malignant tumors [3]. BC is a heterogeneous disease, and the recurrence rate varies greatly [4, 5]. The international guidelines include several polygenic prognostic tests to help determine the risk of recurrence and better inform treatment decisions [6]. Screening and diagnosis of early breast cancer are crucial for reducing morbidity and mortality [7]. Although clinical, pathological and molecular markers are usually used to predict prognosis, the underlying pathogenesis of BC remain poorly understood, and biomarkers for prognosis of BC are important in breast cancer research [8, 9, 10]. Consequently, there is a need for new prognostic factors, and assessment and improvement of the prognosis of patients remains a challenging task.
Long non-coding RNA (lncRNA) is a kind of non-coding RNA (ncRNA) without protein coding ability, and its transcripts are more than 200 nucleotides in length [11]. Recent researches have shown that lncRNAs play significant regulatory roles in various cellular processes, especially in cancers [12, 13, 14]. The hypothesis of competitive endogenous RNA (ceRNA), first proposed in 2011, shows that lncRNAs can bind to miRNA response elements (MREs) bound on targeted miRNAs as ceRNAs, affecting the regulation of microRNAs (miRNAs) on targeted mRNAs, leading to different types of human diseases processes, including cancer [15]. Based on ceRNA theory, Huang et al. [16] demonstrated that lncRNA DANCR may serve as a ceRNA by sponging miR-1225-3p in lung cancer. Kong et al. [17] revealed that lncRNA-CDC6 acted as ceRNA for miR-215 to regulate CDC6 expression, prompting breast cancer progression. Therefore, lncRNAs as a function of ceRNA play an important role in the molecular mechanism of cancer prognosis.
Due to the development of high-throughput RNA sequencing (RNA-seq), more and more lncRNAs, miRNAs and mRNAs have been found [18]. As an open source sequencing database, the Cancer Genome Atlas (TCGA) platform contains clinicopathological information and corresponding bioinformatics data of more than 30 human cancers, which is helpful to comprehensively analyze the ceRNA network [19]. Recently, some studies based on the development of bioinformatics analysis have explored lncRNA-related biomarkers to predict the prognosis of breast cancer. As reported by Zhu et al. [20], a panel of 8-lncRNA signature correlated with prognosis of BC was identified. Zhao et al. [21] developed an hypoxia-related 4-lncRNA model for prediction of breast cancer. However, due to the lack of comprehensive analysis of lncRNAs, miRNAs and mRNAs, these prediction models can not well predict the prognosis [22]. The prognostic value of the nomogram and combined lncRNA-miRNA-mRNA model based on gene expression data confirmed by ceRNA regulatory network in BC is still unclear.
In present study based on TCGA database, we comprehensively analyzed the differentially expressed lncRNAs, miRNAs and mRNAs between breast cancer and paired normal breast samples. By co-expression analysis and establishing ceRNA regulatory network, we screened independent prognosis-related lncRNAs, miRNAs and mRNAs, and constructed risk score system and nomogram survival model. Our study presented a novel prognostic model for BC, and provided a preliminary bioinformatic evidence for understanding the complex mechanism of BC progression.
Methods
Sample selection and data processing
RNA-seq expression profile, miRNA expression data, and clinical phenotype information of all the samples were downloaded from the TCGA (
Screening of differentially expressed lncRNAs (DElncRNAs), miRNA (DEmiRNAs) and mRNAs (DEmRNAs)
The RNA-seq expression profile was separated into mRNA and lncRNA expression data respectively. After normalization and filtering using the “edgeR” package in the R language, the differentially expressed lncRNAs, miRNAs and mRNAs were selected with
Functional enrichment analysis
To further explore the function of the DEmRNAs, Gene Ontology (GO) and Kyoto Encyclopedia of Genes and Genomes (KEGG) pathway enrichment analysis were conducted based on the clusterProfiler package. An enriched GO term or pathway with a
Construction of the co-expression network
To elucidate the potential relationships between DElncRNAs and DEmRNAs, the lncRNA-mRNA co-expression network was constructed. For each DElncRNA, we calculated the Pearson correlation between its expression value and the expression value of each DEmRNA. When the
Construction of the ceRNA network
Based on the co-expression network, the ceRNA network was constructed. The miRcode database was used to predict lncRNA-miRNA interactions. The miRDB, miRTarBase, and TargetScan were applied to identify the corresponding coding genes. We only chose miRNA-targeted mRNAs present in all three databases to enhance the validity of this ceRNA network. Furthermore, cytoscape software (version 3.6.1) was used for network construction.
Cox regression analysis of RNA
The RNA in the ceRNA network was used as candidate RNA. The univariable Cox regression analysis in R survival package (version 2.44-1.1) was performed to analyze the regression coefficient and
Protein-protein interaction (PPI) network construction
The PPI network could display many interactions that connect with hub genes directly or indirectly. To explore the interactions between the prognosis-related DEmRNAs from the ceRNA network, the online Search Tool for the Retrieval of Interacting Genes (STRING, http://string-db.org) was used to get the interactive relationships of mRNA. Confidence score
Construction of the ceRNA related prognostic model
To further screen the prognostic RNA, the calculation model of risk score was defined as follows: Risk score
Validation analysis
To further confirm the classification reliability of the model’s impact on the prognosis of the patients with BC. We also attempted to validate the expression patterns of the model in the testing set. The expression levels of the RNA which contained in the model were extracted from the testing set for further research. The K-M plot was also used to discriminate the difference of OS between the low- and high-risk population in testing cohort.
Construction of a prognostic nomogram
To provide the clinician with a quantitative method by which to predict a patient’s probability of OS the contribution of each covariate was quantified and visualized in a prognostic nomogram with internal validation via 1000-times bootstrapping. The consistency of the resulting model was assessed by the calibration assay. The scatter plots were applied for visualization of the consistency of each model. A 1000-time bootstrapping was employed as indicated.
Statistical analysis
All statistical analyses were performed using R software, and Pearson correlation coefficient test was applied to evaluate the correlation between different variables. Survival data were analyzed by Kaplan-Meier curve and log-rank test. The univariate Cox regression analysis was performed for survival analysis. The multivariate Cox regression analysis was applied to determine independent prognostic factors, and the ROC curve was drawn to evaluate the accuracy of prognostic prediction model. Differences between groups were evaluated using unpaired Student’s
Results
Identification of differentially expressed RNAs in BC
To identify the differentially expressed RNAs involved in BC we devoted the lncRNA, miRNA and mRNA expression profiles to differential expression analysis between breast cancer and paired normal samples. The screening thresholds for lncRNA, miRNA and mRNA were adjusted
Identification of differentially expressed RNAs between tumor and normal samples. (A, B) The heatmap and volcano plot of the DElncRNAs in BC compared to normal tissue. (C, D) The heatmap and volcano plot showed the expression change of DEmiRNAs in BC when compared with normal tissue. (E, F) The heatmap and volcano plot of the DEmRNAs in BC compared to normal tissue.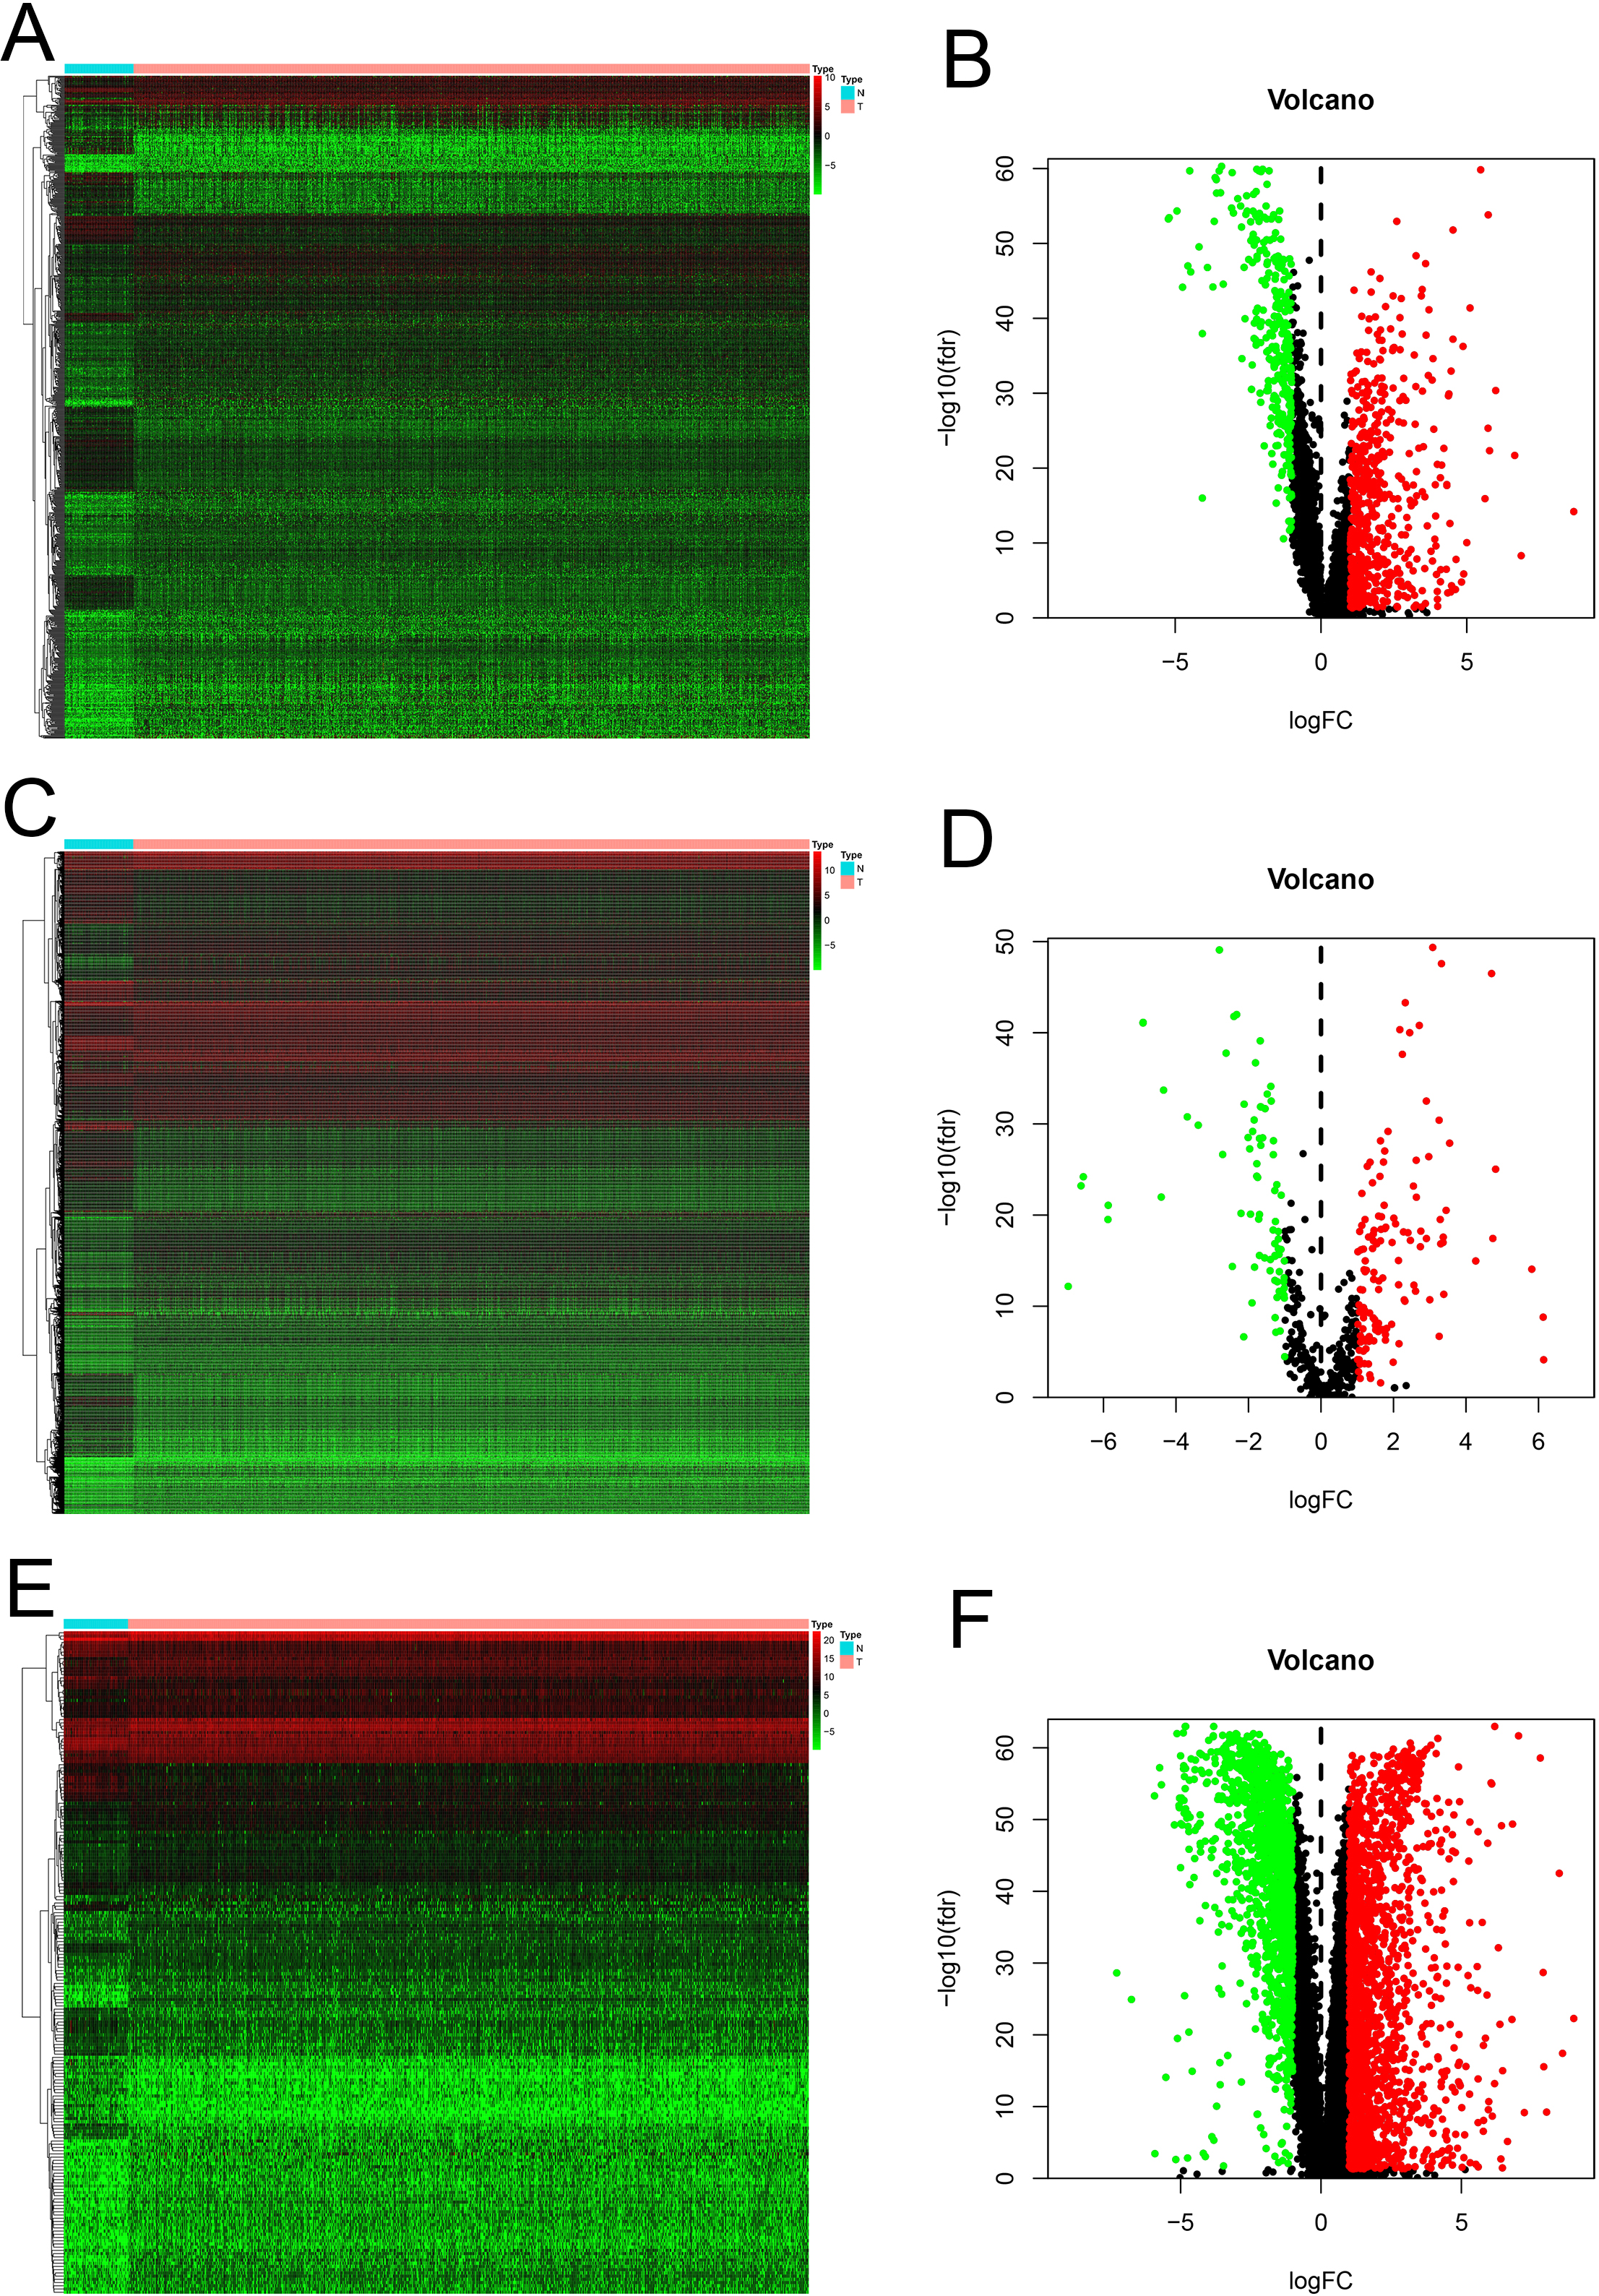
Enrichment analysis of DEmRNAs, co-expression and ceRNA network in BC. (A) GO analysis presented the top 5 enriched GO terms in the biological process, cellular components and molecular functions. (B) KEGG pathway analysis exhibited the top 5 most enrichment pathways. (C) The co-expression network exhibited the potential correlation of DElncRNAs and DEmRNAs. (D) The ceRNA network of the DElncRNAs, DEmiRNAs and DEmRNAs based on the co-expression network.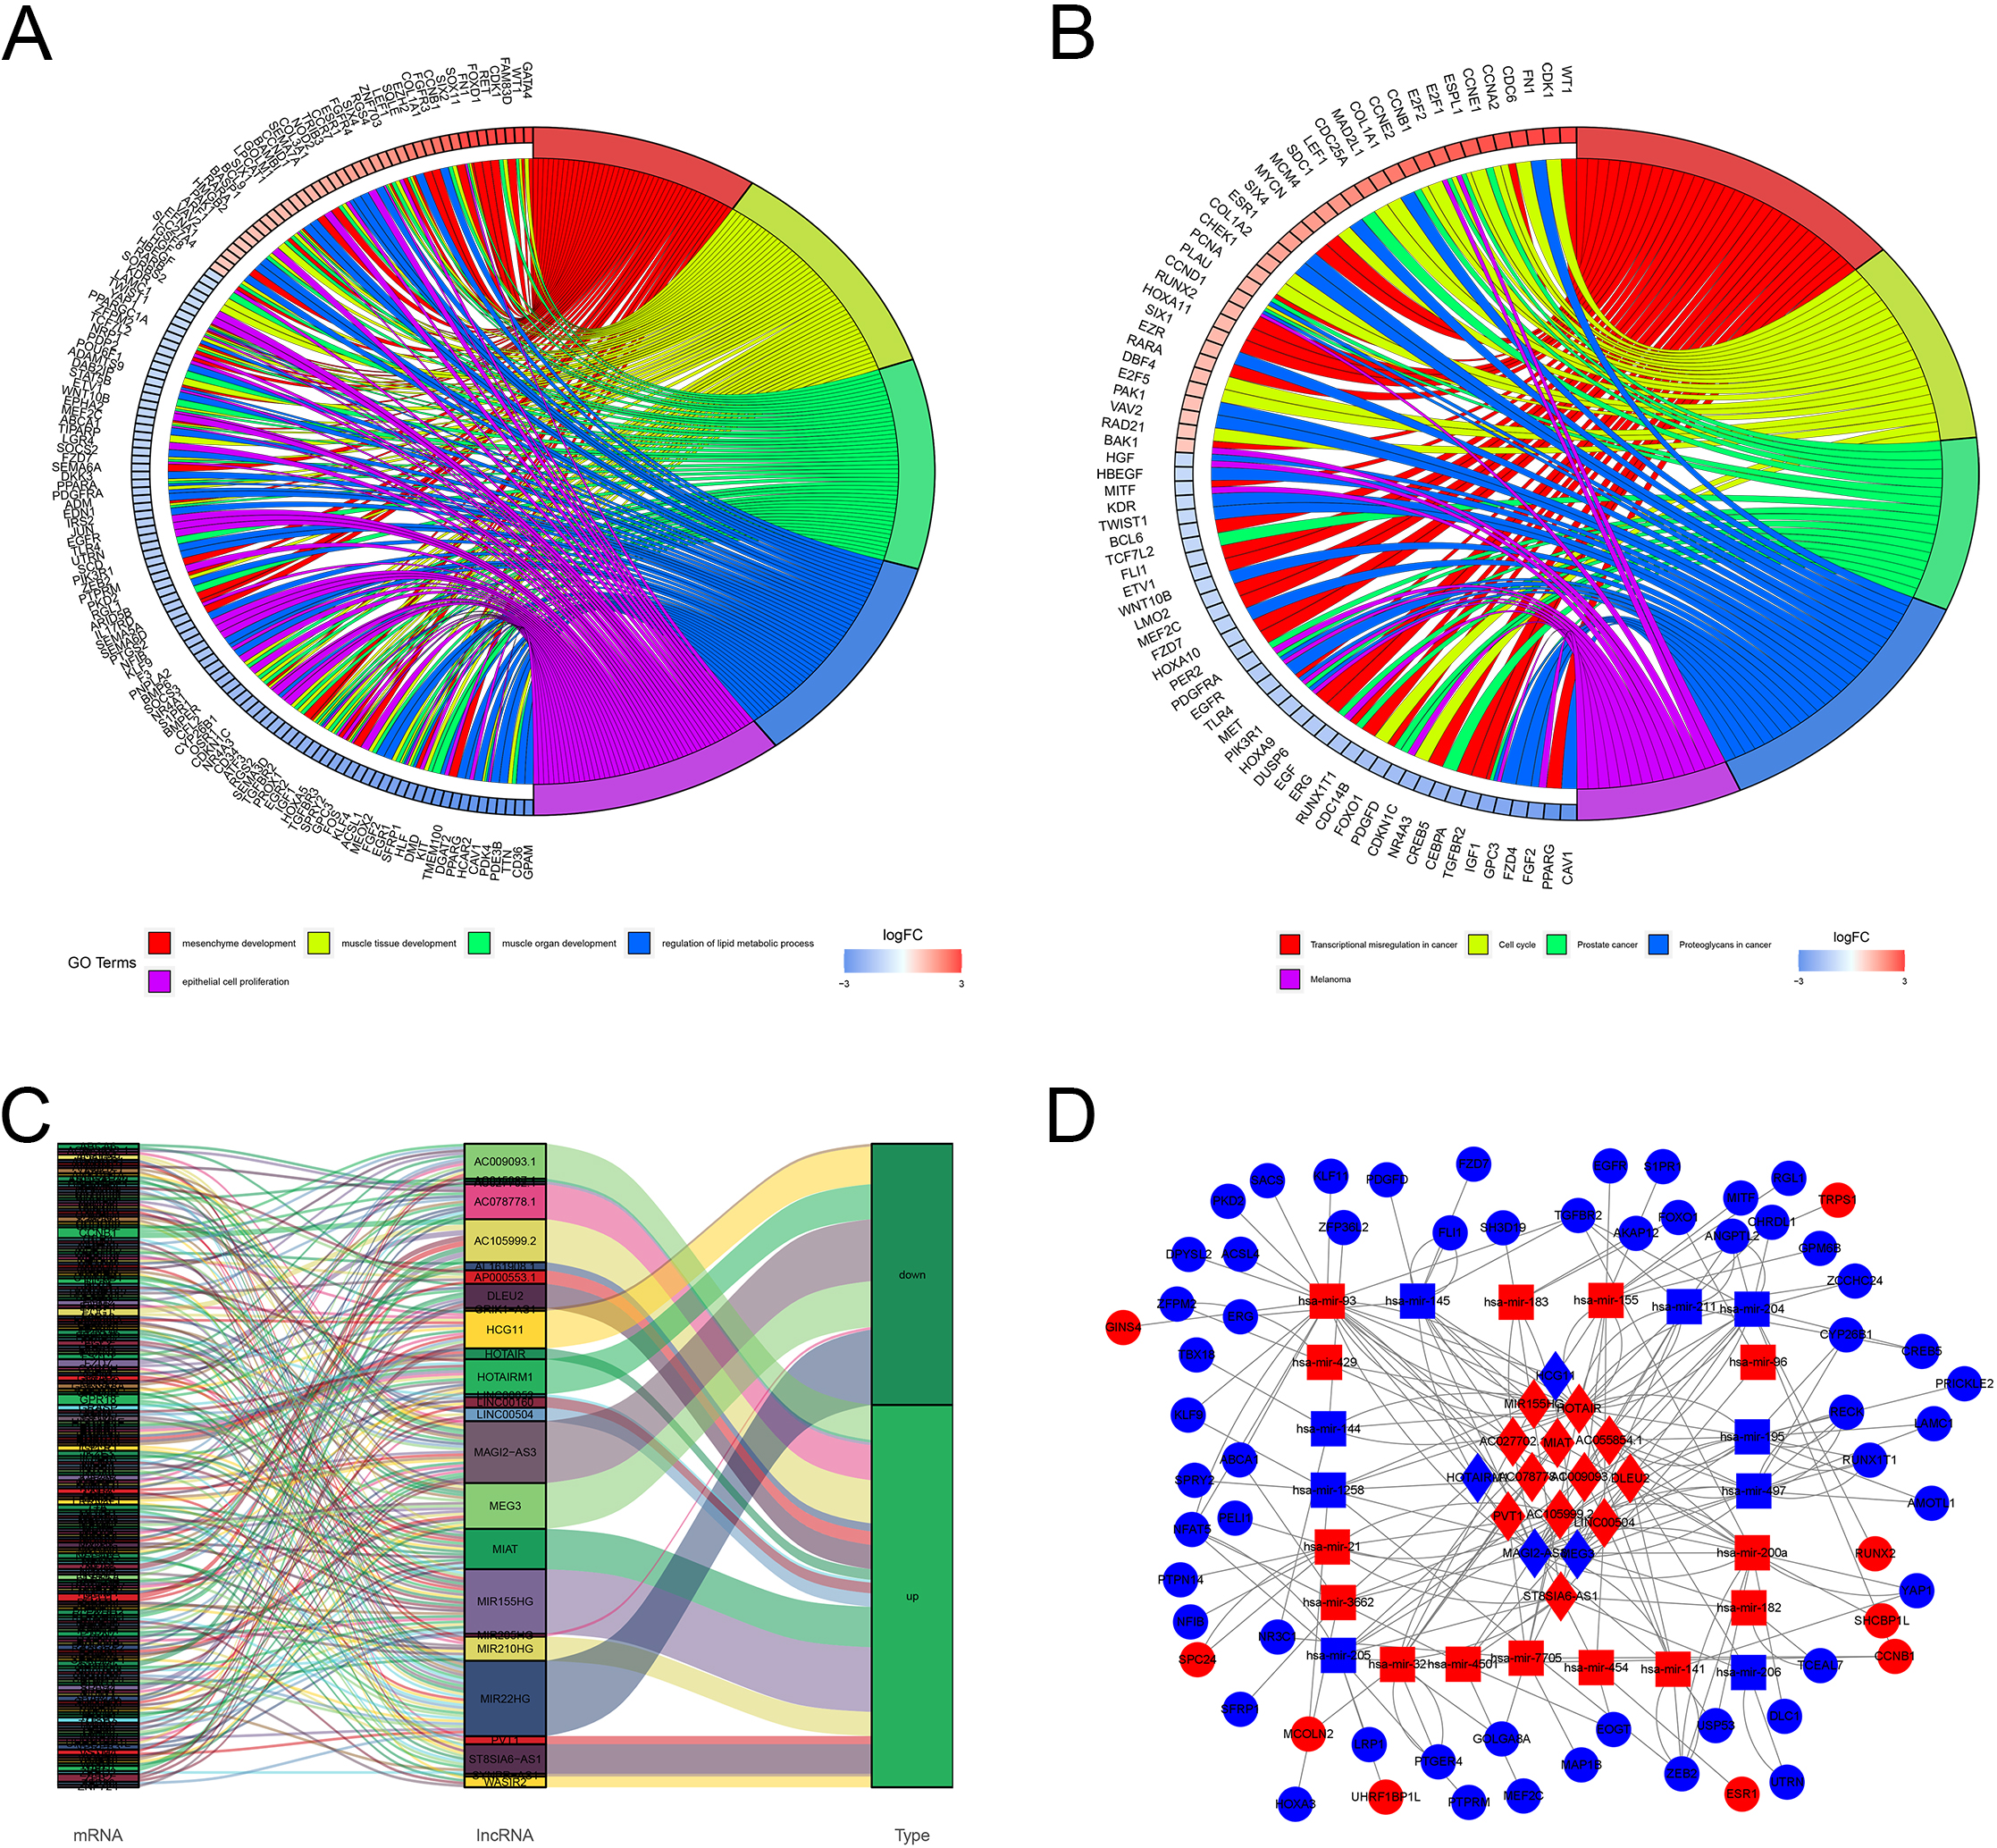
For a better understanding of the molecular underpinnings of the DEmRNAs, these mRNAs were applied to GO and KEGG enrichment analysis. Functional enrichment analysis revealed that these genes were actively associated with functions of mesenchyme development, muscle tissue development, muscle organ development, regulation of lipid metabolic process and epithelial cell proliferation in GO Terms (Fig. 2A), and the genes associated with abnormal transcriptional regulation in cancer, cell cycle, prostate cancer, proteoglycans in cancer and melanoma in KEGG Terms were shown in Fig. 2B.
Construction of DElncRNA-DEmRNA co-expression and ceRNA network
To explore the potential relationships between lncRNAs and mRNAs, the DElnRNAs and DEmRNAs were selected for the co-expression analysis. The co-expression network implied a complex relationship that one lncRNA could correlate with multiple mRNAs and one mRNA could regulate multiple lncRNAs in different ways. As shown in Fig. 2C, the network contained 239 lncRNA-mRNA pairs, in which 26 DElncRNAs and 191 DEmRNAs were included. The co-expression network might indicate the potential regulatory mechanisms between lncRNAs and mRNAs.
To better discuss the ceRNA mechanism of BC, a ceRNA network of lncRNA-miRNA-mRNA was constructed based on the DElncRNA-DEmRNA co-expression network. Our data showed that a total of 16 DElncRNAs were found to be combined with 23 binding miRNAs. In addition, 63 mRNAs were the target genes of these miRNAs (Fig. 2D).
Identification of prognostic-related RNAs
In order to identify the RNAs that were related to patient survival in the ceRNA network, we combined the survival time and survival status of each BC patient with gene expression data. The univariate Cox regression analysis were conducted to figure out the correlation of lncRNA, miRNA and mRNA expression with survival (Fig. 3A, C, E). Then, the Multivariate Cox regression analysis was performed to identify independent prognostic risk factors (Fig. 3B, D, F). After filtering via PPI analysis (Fig. 3G), a prognostic model based on 12 genes (HOTAIR, AC055854.1, ST8SIA6-AS1, AC105999.2, hsa-miR-1258, hsa-miR-7705, hsa-miR-3662, hsa-miR-4501, CCNB1, UHRF1, SPC24 and SHCBP1) was obtained. The expression of these 12 genes in breast cancer and paired normal samples was shown in Fig. 3H.
Identification of ceRNA-related DERNAs related to prognosis of BC by Cox regression analysis. (A, B) Forest map of ceRNA-related DElncRNAs related to survival in BC analyzed by univariate and multivariate Cox regression. (C, D) Forest map of ceRNA-related DEmiRNAs related to survival in BC analyzed by univariate and multivariate Cox regression. (E, F) Forest map of ceRNA-related DEmRNAs related to survival in BC analyzed by univariate and multivariate Cox regression. (G) PPI network analysis of the prognosis-related DEmRNAs. (H) The gene expression of the 12 biomarkers associated with BC survival.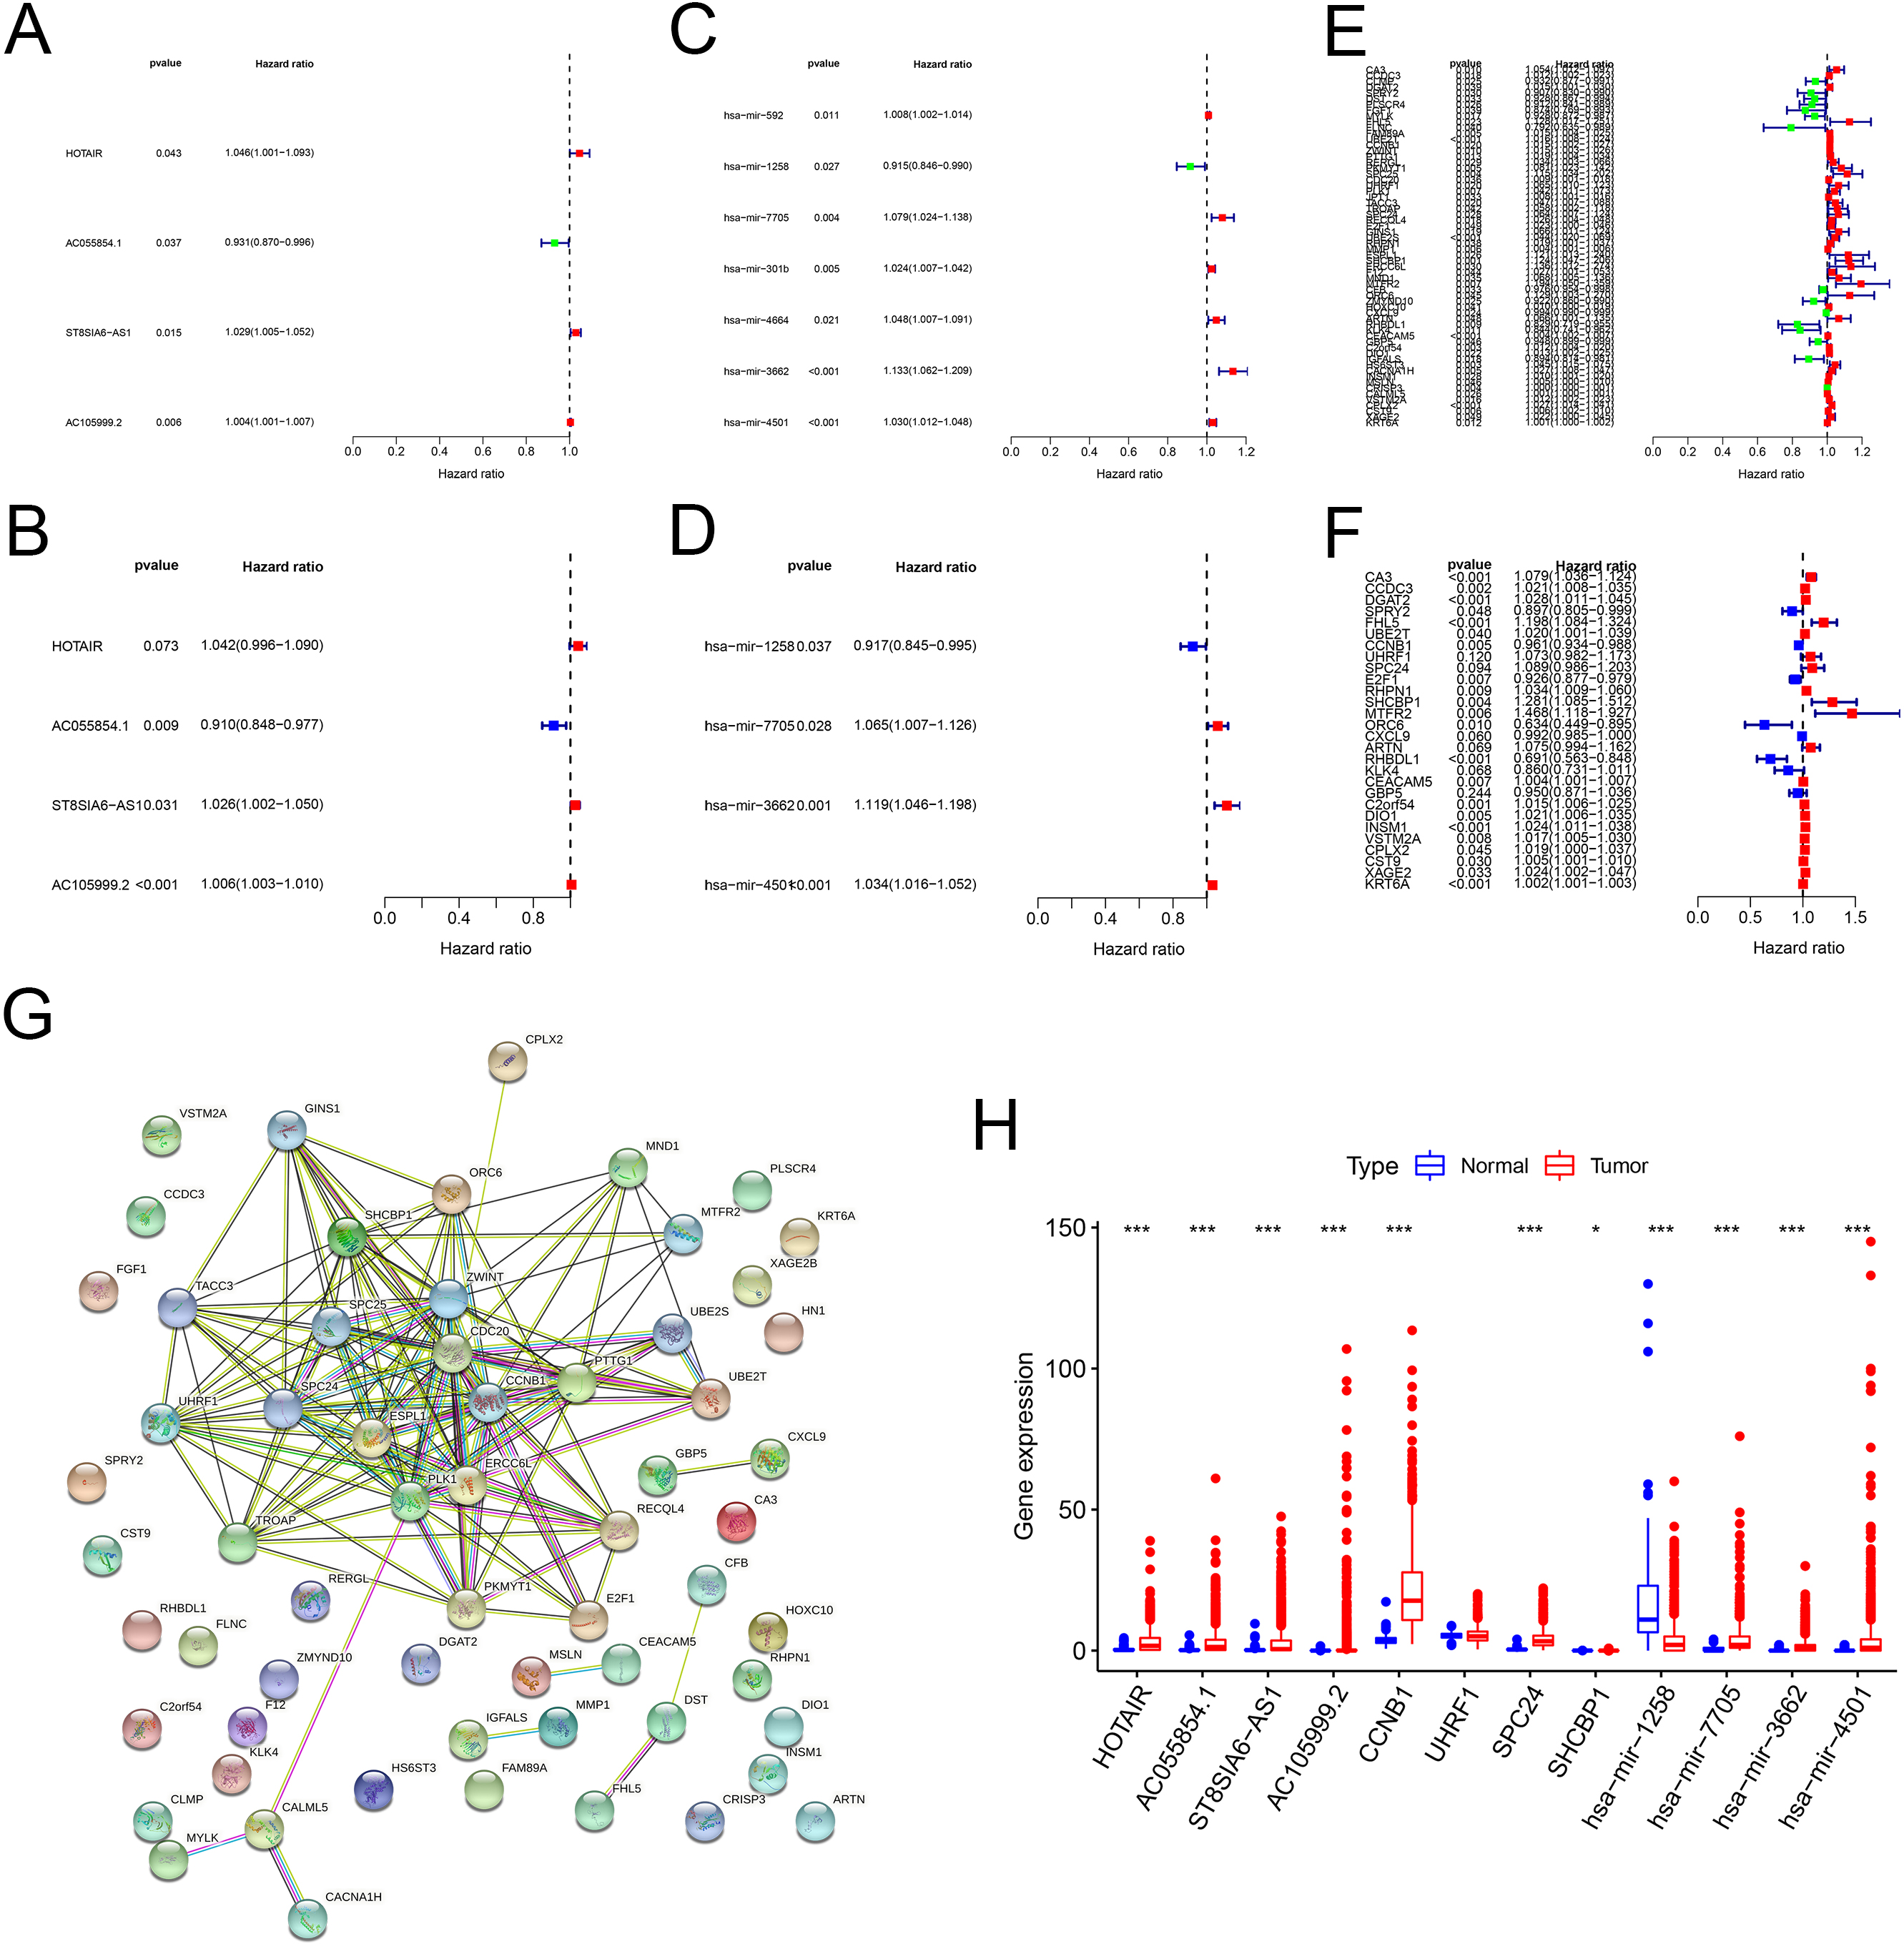
To verify the predictive performance of the model, 970 patients were randomly divided into two subgroups at a rate of 1:1: training set (dataset 1:
Survival analysis and ROC curves for the prognostic model based on the 12 prognostic signatures. (A, B) Kaplan-Meier survival curves of high- and low-risk patients in the training and testing cohorts. (C, D) ROC curves with calculated AUCs for OS prediction in the training and testing cohort.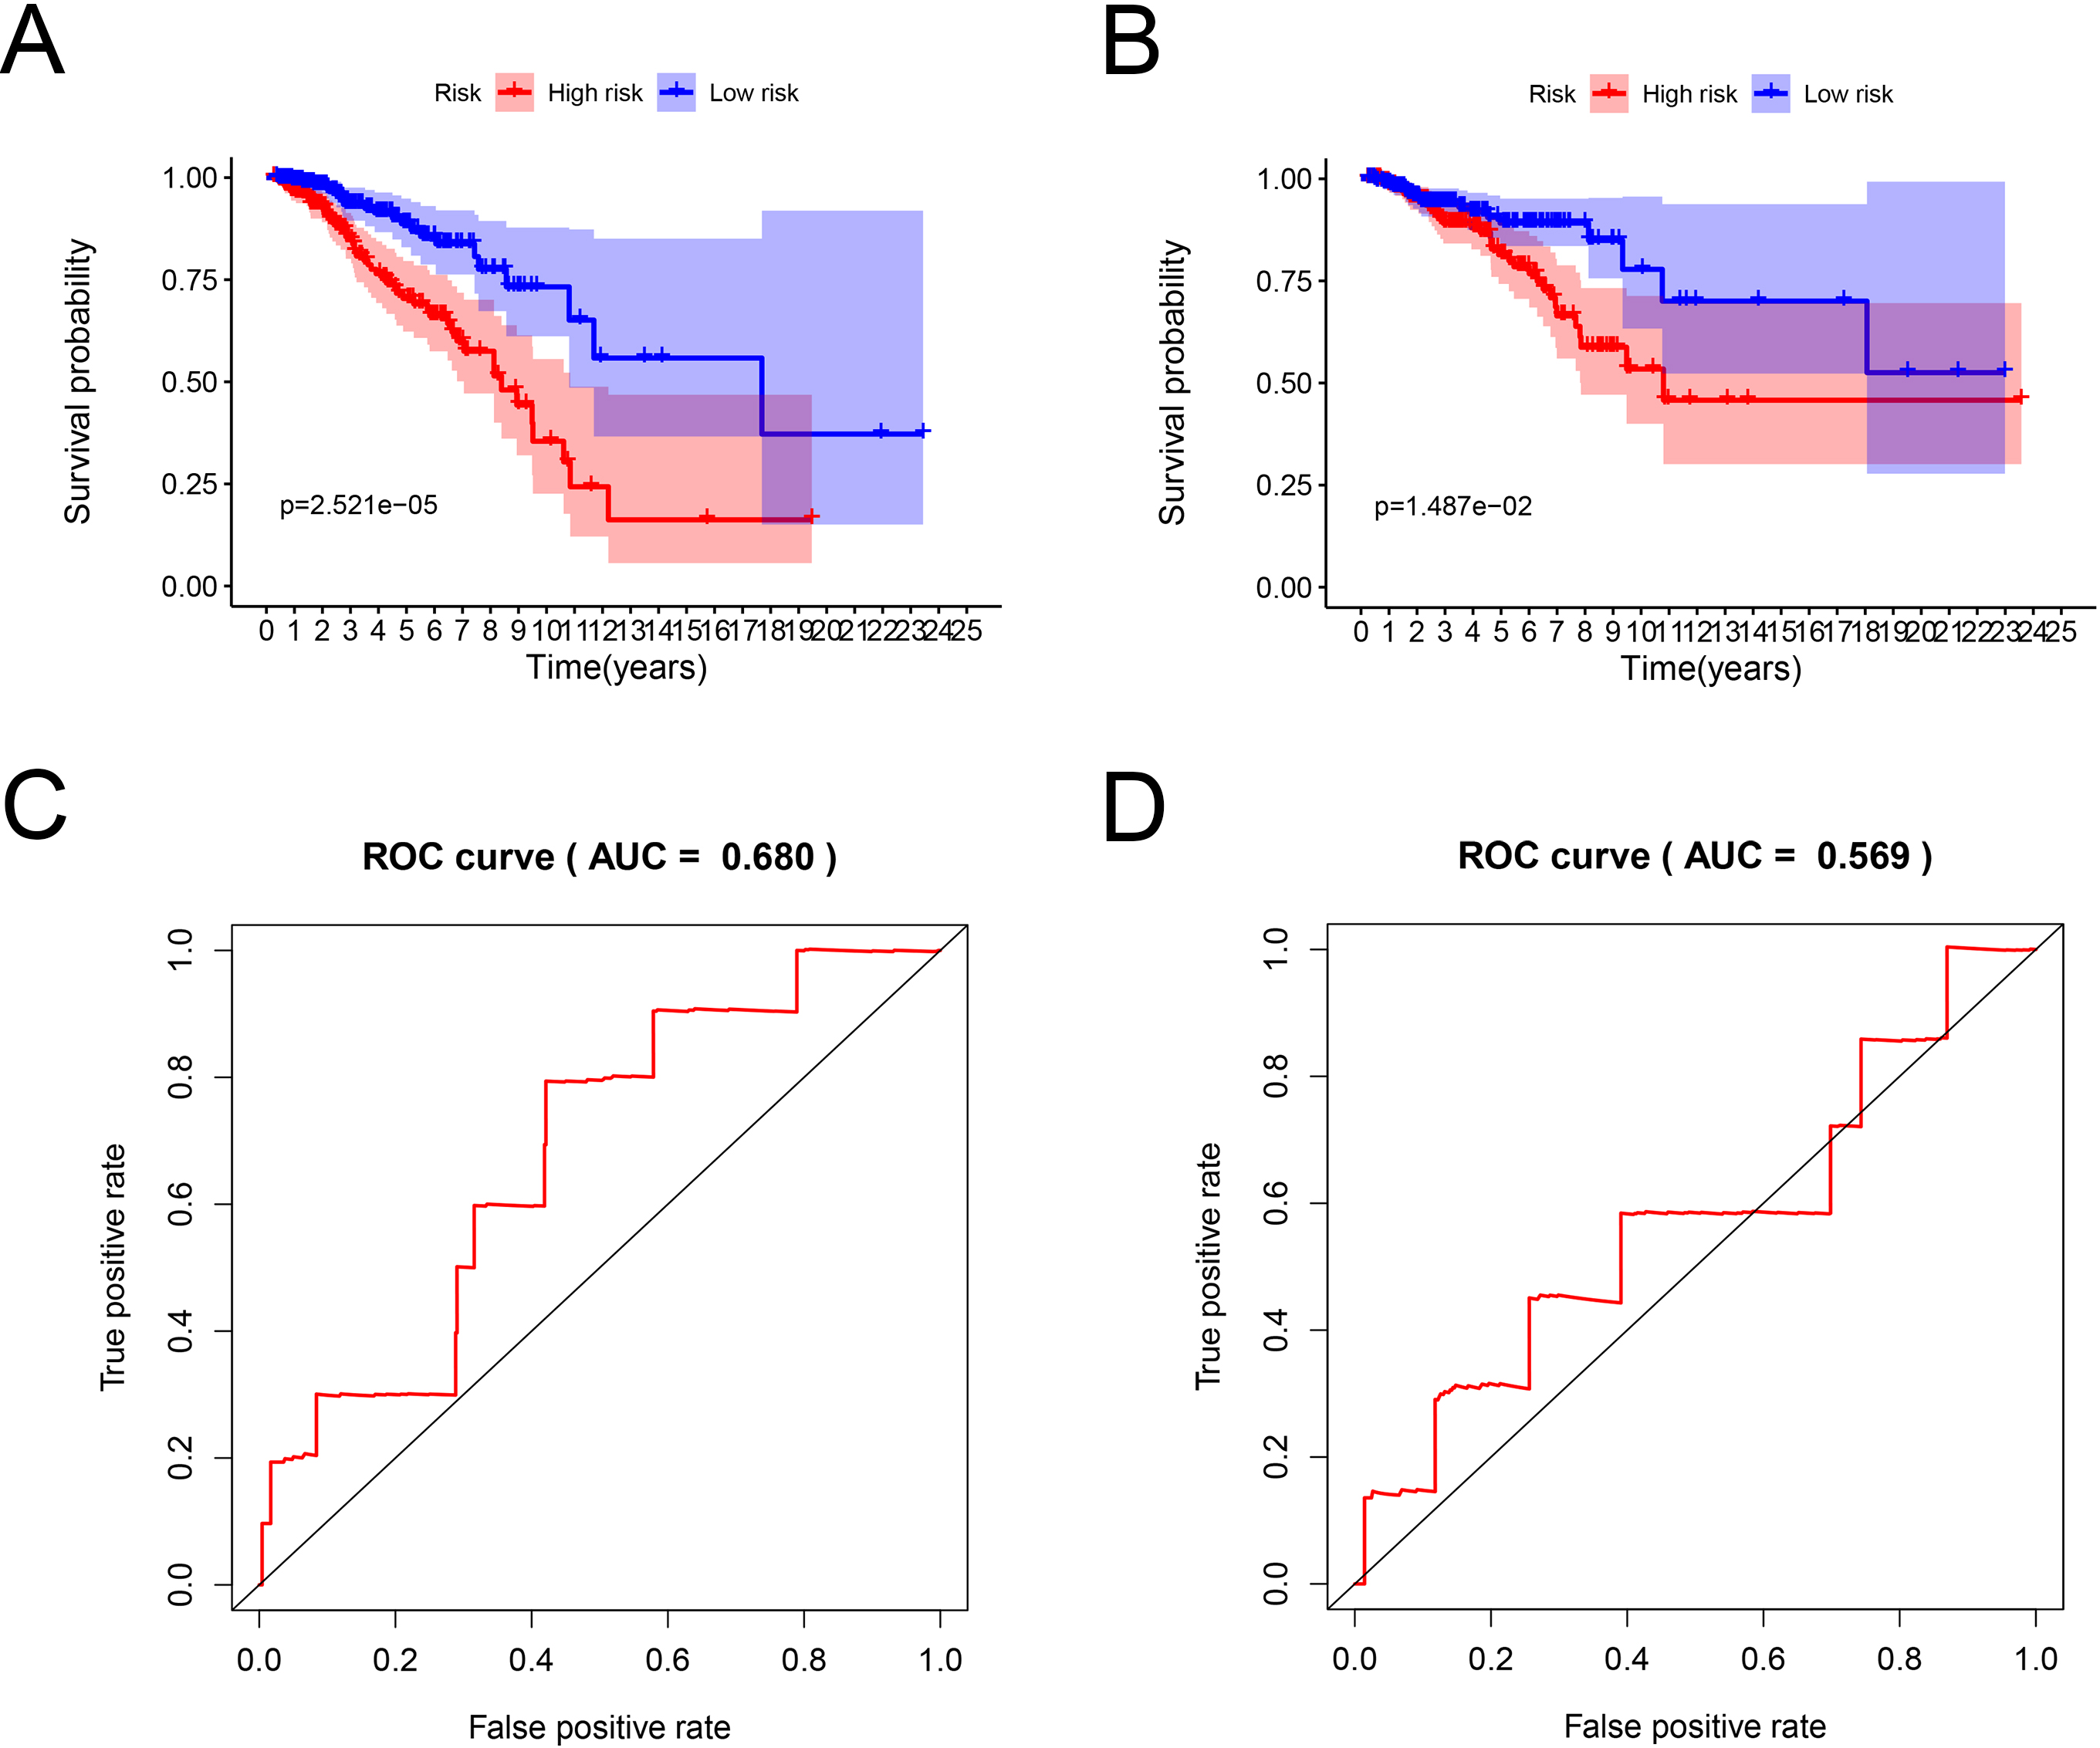
Characteristics of prognostic signatures in the training and testing test. (A, D) Distribution of the BC patients based on risk scores in the training and testing cohorts. (B, E) Distribution of survival time and status of BC patients in the training and testing cohorts. The black dotted line is the optimal cut-off value for dividing patients into low-risk and high-risk groups. (C, F) Heat map of prognostic ceRNA-related gene expression levels in the training and testing sets.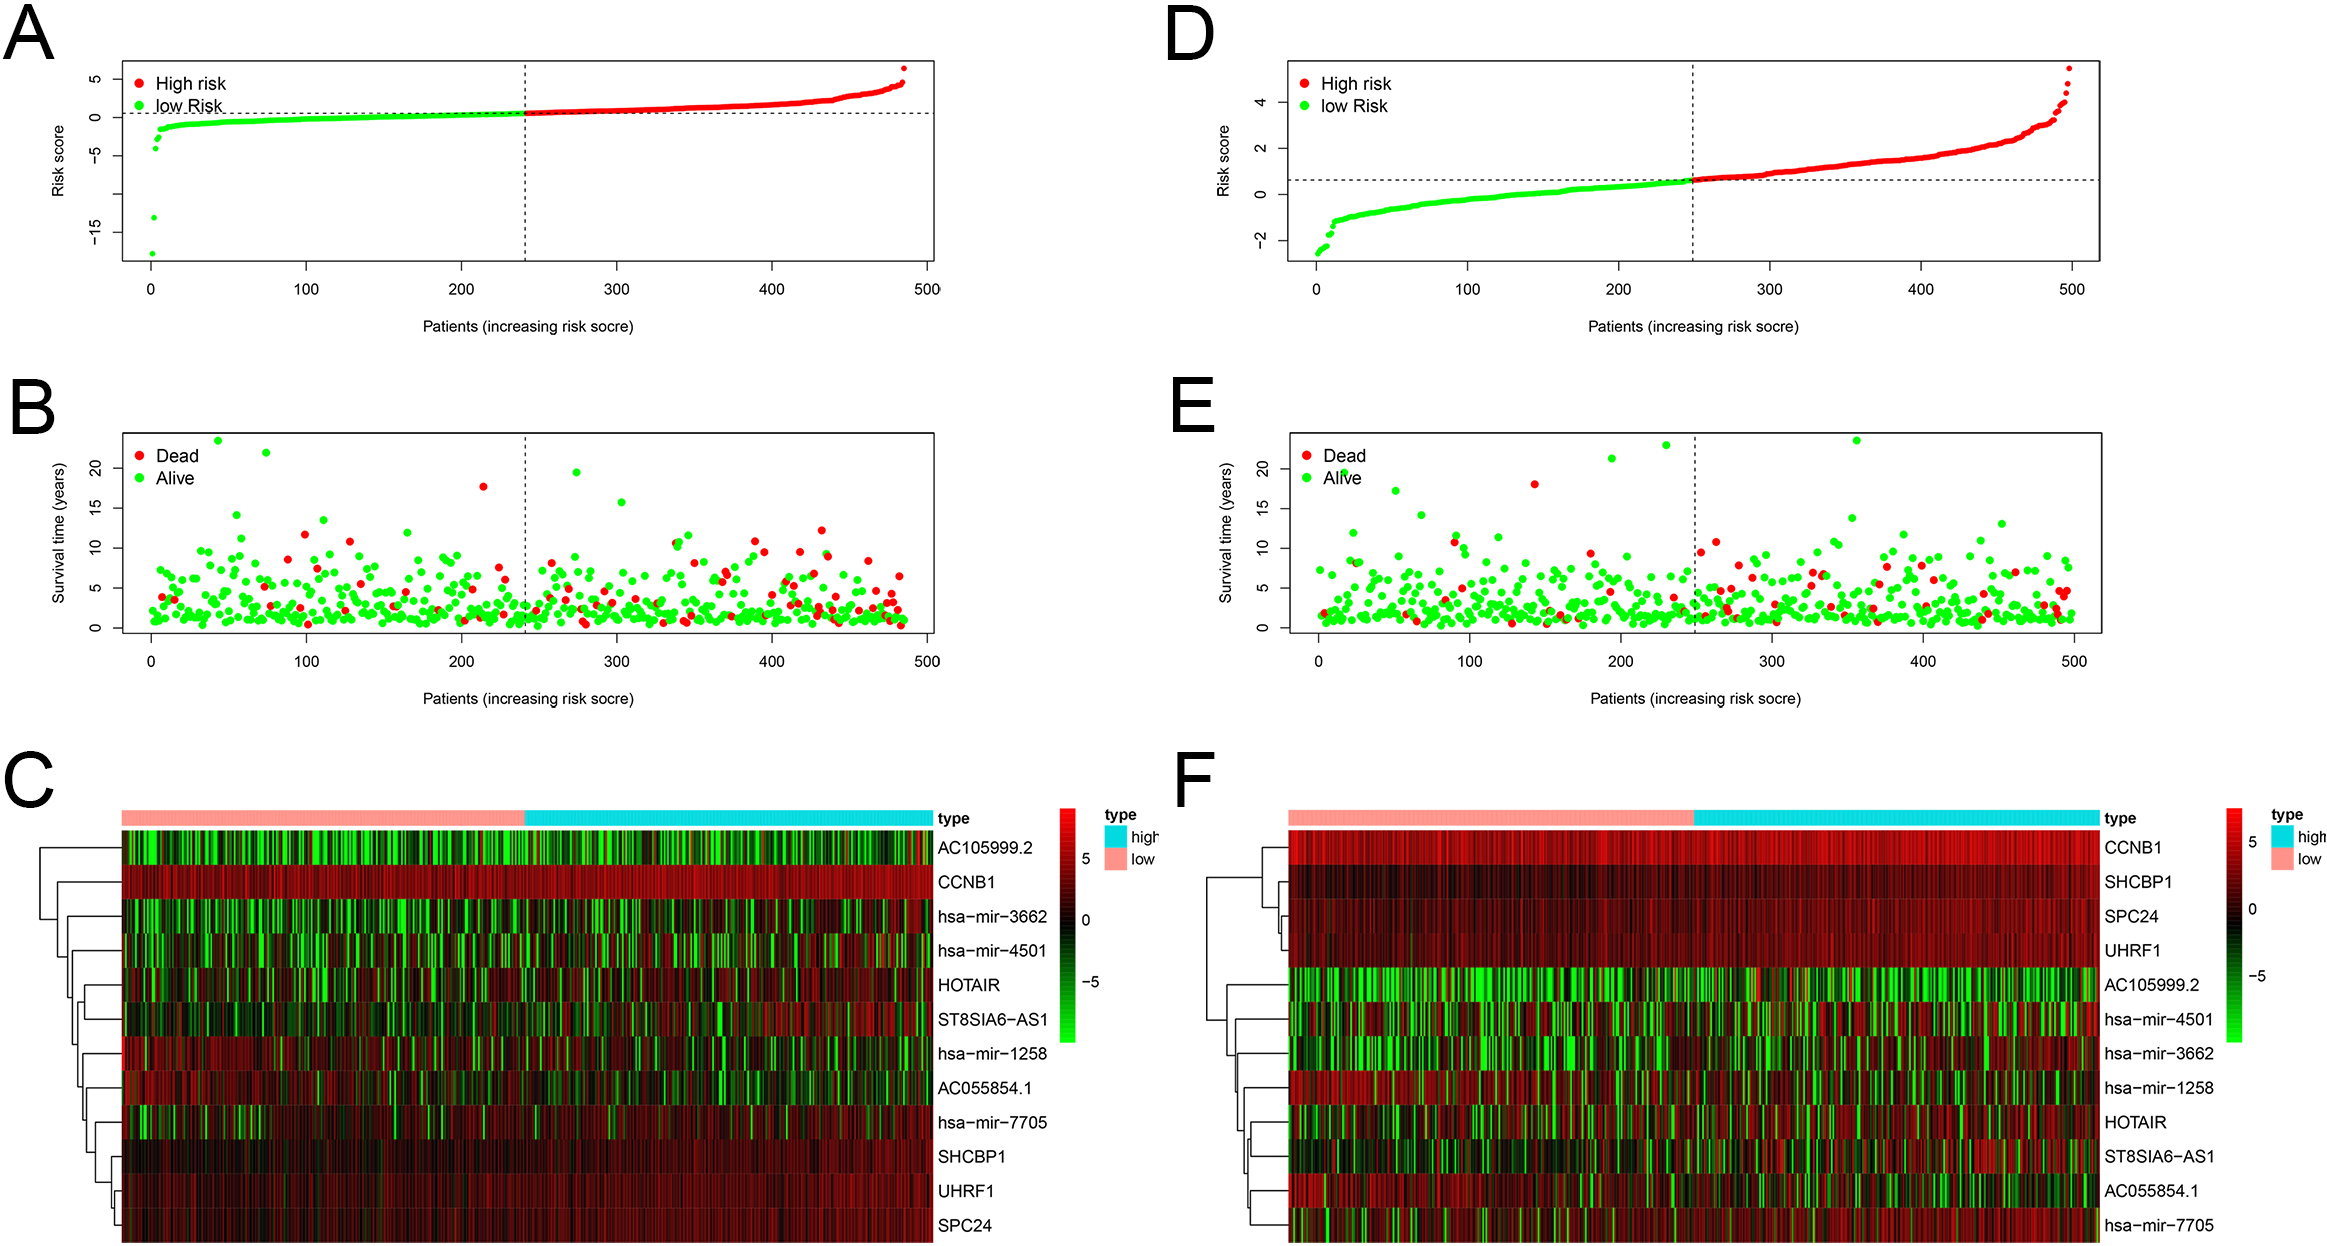
The correlation between clinicopathological features and the 12 biomarkers. (A) The association between clinico-pathological features and gene expression levels of the 12 prognostic genes in BC patients. (B) PCA analysis showed the differences between low-risk and high-risk groups according to the risk model of 12 RNAs.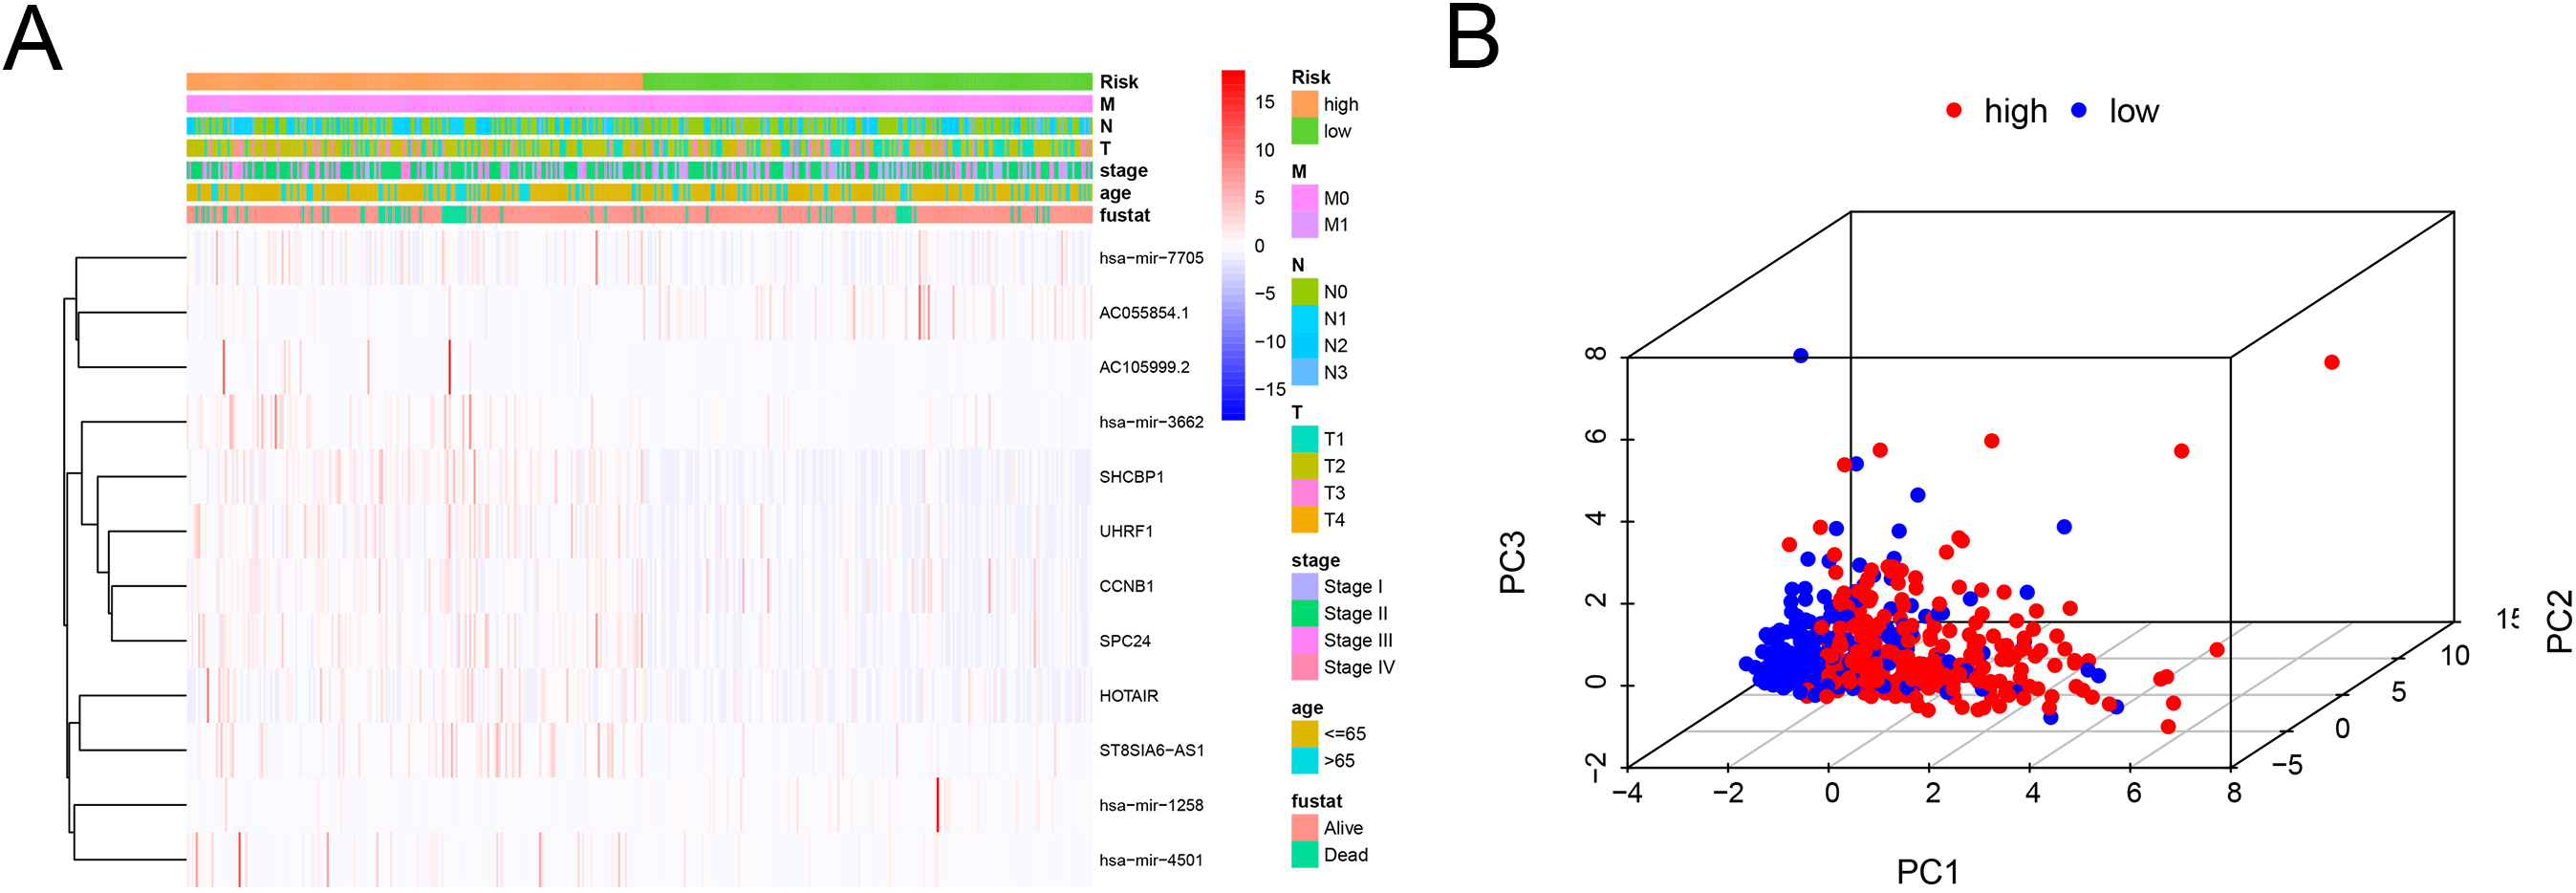
Expression levels of the biomarkers in clinicopathological features. (A) The expression levels of AC055854.1 between M0 and M1 samples. (B) The expression levels of AC105999.2 between T1-2 and T3-4 patients. (C) The expression levels of hsa-miR-3662 between M0 and M1 samples. (D) The expression levels of hsa-miR-3662 between T1-2 and T3-4 patients. (E) The expression levels of hsa-miR-7705 between N0 and N1-3 patients. (F) The expression levels of SHCBP1 between N0 and N1-3 patients.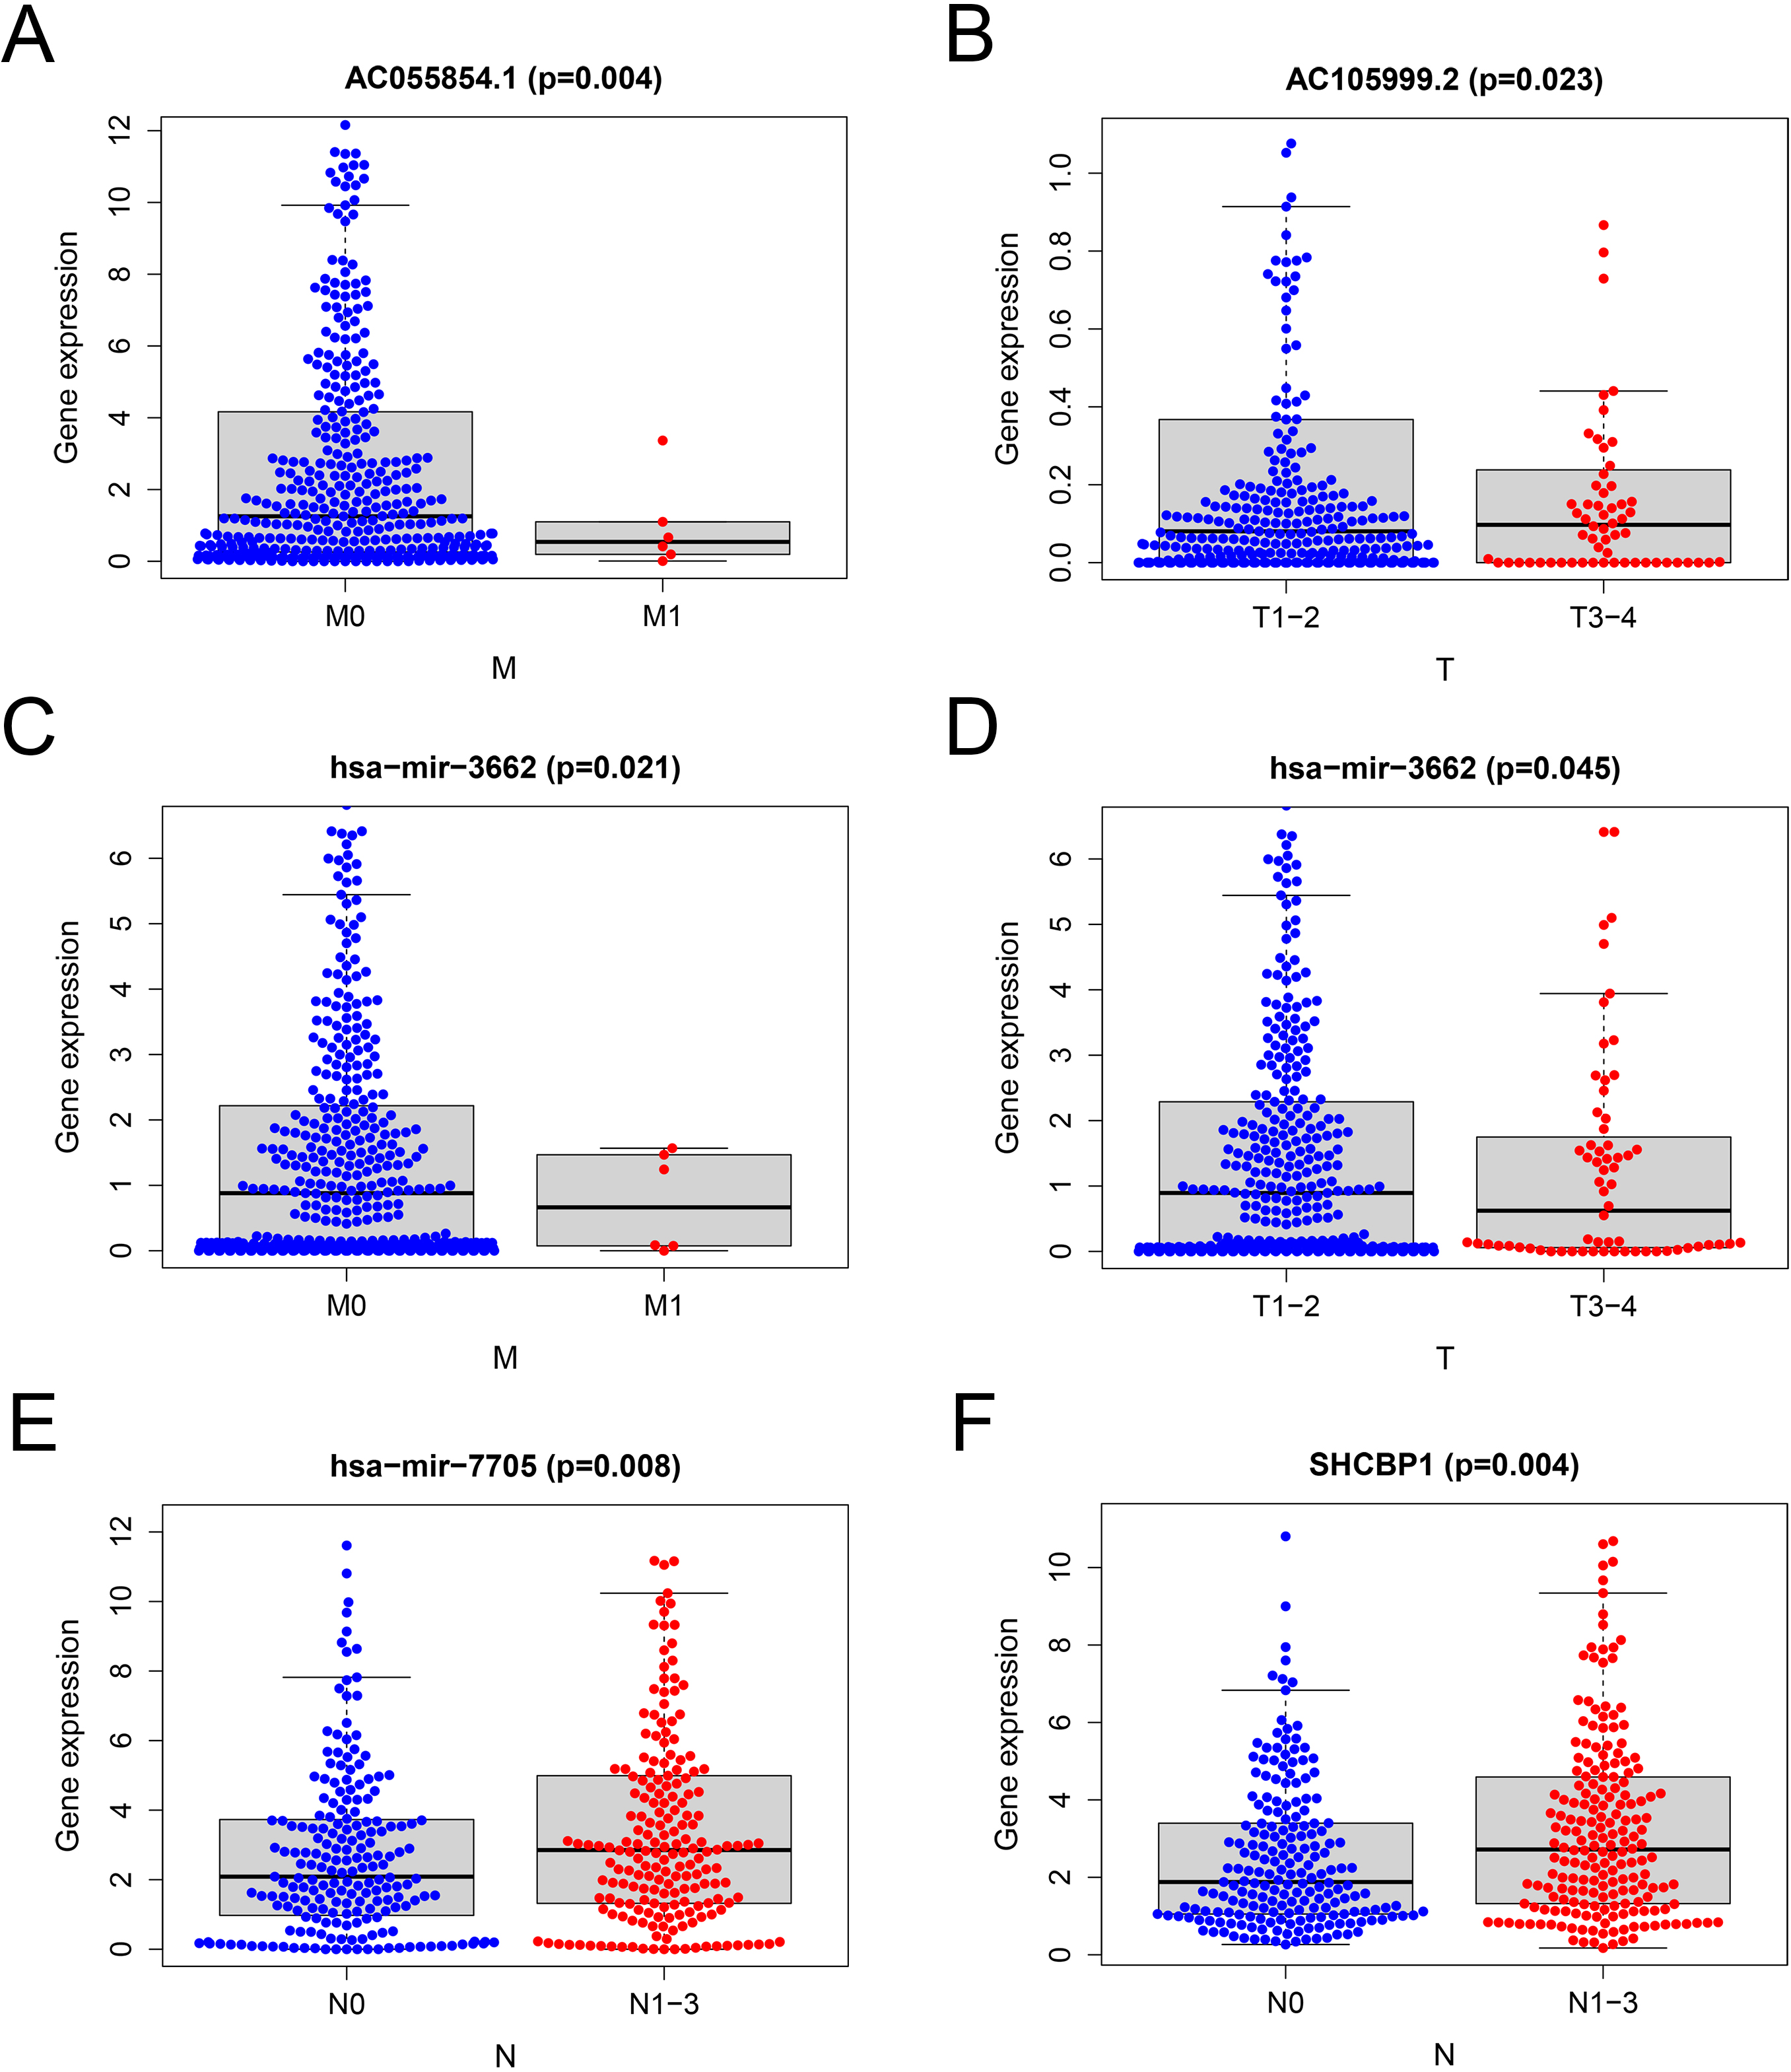
Construction and validation of a nomogram for overall survival prediction in BC patients. (A) Univariate Cox analysis of the clinical features. (B) Multivariate Cox regression analysis of the clinical features. (C) The nomogram consisting of age, T stage and risk score predicting 1-, 3-, and 5-year survival for BC patients. (D) Calibration curves of the nomogram in terms of agreement between predicted and observed 1-, 3-, 5-year outcomes.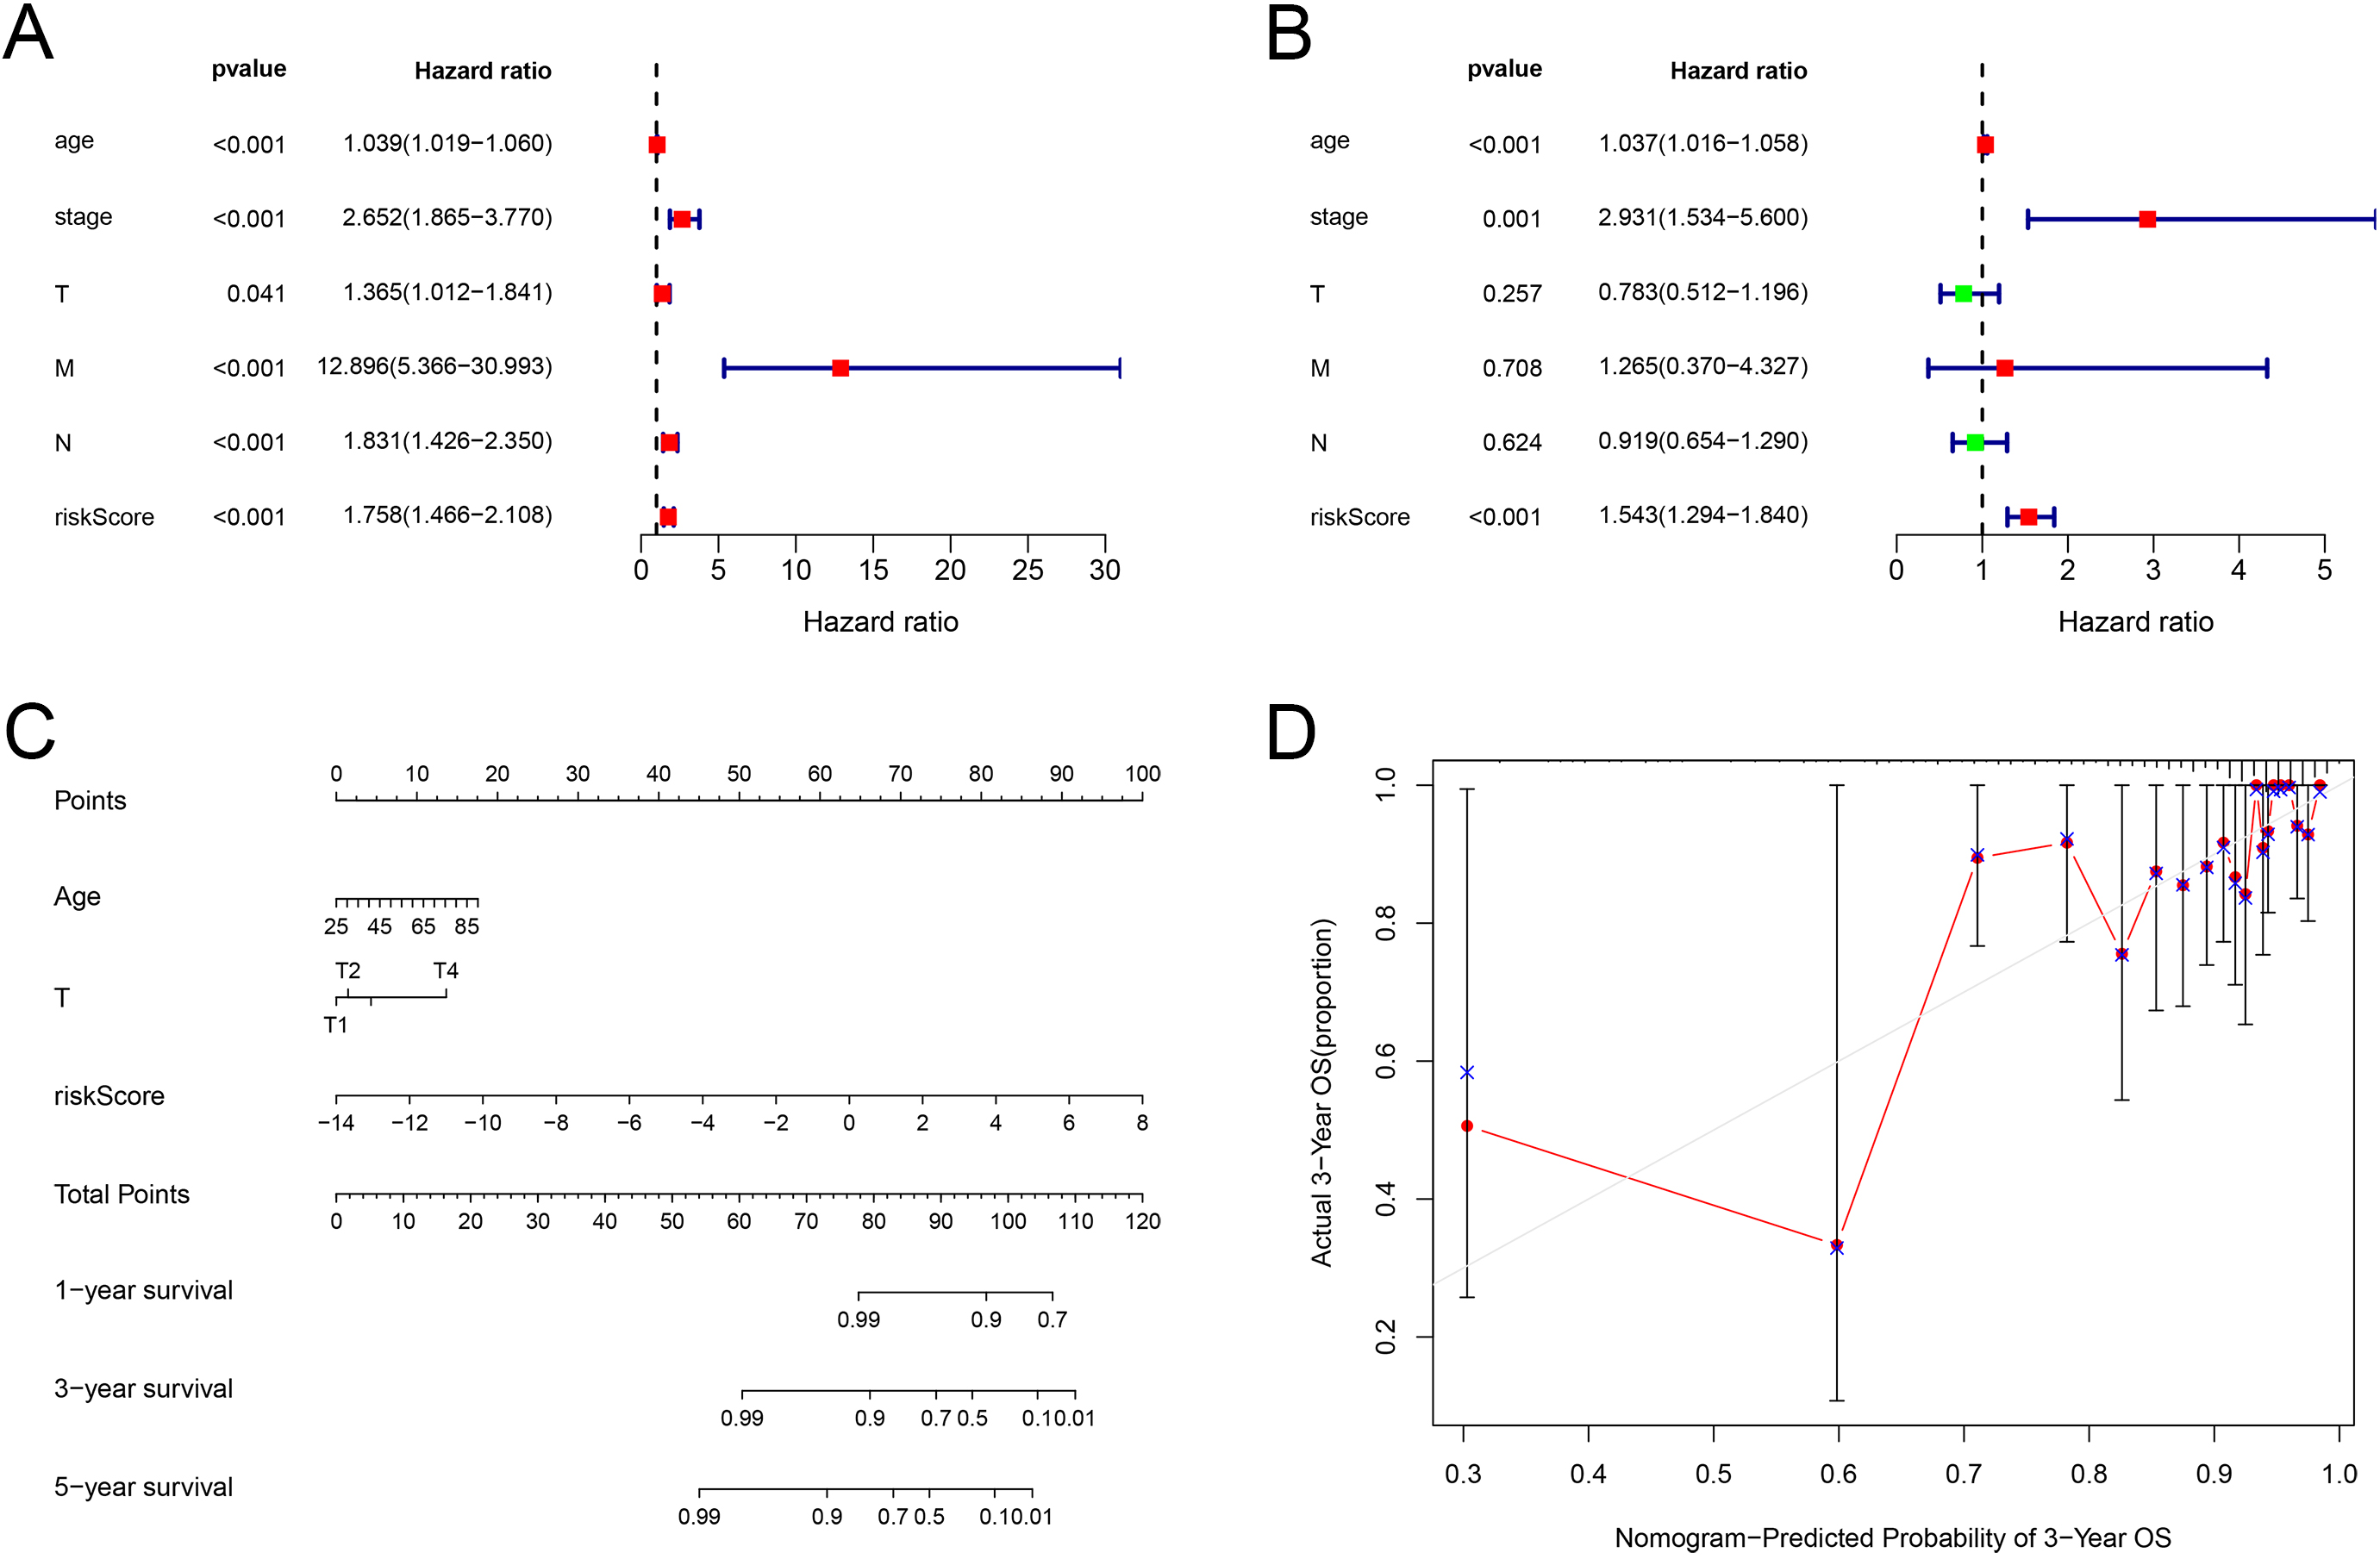
According to the risk score of patients, we ranked all patients in training set and analyzed their distribution (Fig. 5A). After classifying the patients according to the risk score, we observed that the number of deaths in the low-risk group was less than that in the high-risk group. With the increase of risk score, an increasing number of patients died. In addition, patients in the low-risk group survived longer than those in the high-risk group (Fig. 5B). The heat map revealed the expression of the 12 prognostic genes in the low-risk and high-risk group (Fig. 5C). Similar results were obtained in the testing set (Fig. 5D–F). These results suggested that the predictive performance of the prognostic model was reliable in BC patients.
To explore the relationship between 12 RNAs in the risk model and clinicopathological features, we performed correlation analysis (Fig. 6A). The results suggested that the expressions of these 12 RNAs were correlated with clinicopathological parameters. PCA analysis was conducted to compare the differences between low-risk and high-risk groups according to the risk model of 12 RNAs (Fig. 6B). The results showed that the high-risk group and the low-risk group were distributed in different directions, indicating that the risk model could divide BC patients into two parts, and the ceRNA status of the high-risk group was different from that of the low-risk group.
In order to further identify the correlation of the RNAs in the risk model with clinicopathological parameters, we analyzed the correlation between the expression of RNAs and clinical pathological features. The Student’s
Construction of a nomogram
To further explore the comprehensive value of the risk model combined with other factors, we performed the univariate Cox regression analysis to determine the clinical characteristics related to prognosis. The results showed that age (
Discussion
Breast cancer is the most common cancer in woman worldwide [23]. Currently, several therapeutic strategies such as surgery, radiation therapy and chemotherapy are employed in clinical treatment [24]. Owing to the development of treatment strategies for this malignancy, the survival rates of breast cancer patients have improved to some extent [25]. However, the diagnosis of early patients and the prognosis of advanced patients have not improved over the past several decades [26]. In recent, biomarkers have played important roles in the diagnosis and prognosis of cancer patients, including breast cancer patients [27]. For patients with early-stage cancer, biomarkers could serve as a detection tool to identify susceptibility [28]. For patients with advanced cancer, biomarkers could serve as therapeutic targets to improve patient survival [29, 30]. Owing to local recurrence and distant metastasis, BC is still a major challenge for clinicians [31]. Therefore, it is urgent to explore novel and effective prognostic indicators in BC.
With the development of high-throughput sequencing technology, more and more sequencing data were used in the research of cancer diagnosis, treatment and prognosis [32, 33]. In the present study, we downloaded RNA-seq data and related clinical data related to patients with breast cancer from TCGA database. We analyzed and constructed a ceRNA network containing lncRNAs, miRNAs and mRNAs, and a clinical risk prognostic model. Firstly, the expression profiles of 1222 patients were obtained based on TCGA data. The differential expression of 844 lncRNAs, 206 miRNAs and 3295 mRNAs were identified. GO and KEGG enrichment analyses were applied to further explore the main biological processes and regulatory pathways involved in these DEmRNAs. GO enrichment analysis showed that the DEmRNAs were mainly related to mesenchyme development, muscle tissue development, muscle organ development, regulation of lipid metabolic process and epithelial cell proliferation, and KEGG enrichment analysis revealed that the DEmRNAs were mainly related to abnormal transcriptional regulation in cancer, cell cycle, prostate cancer, proteoglycans in cancer and melanoma. Then, we conducted the co-expression analysis of DElncRNAs and DEmRNAs to identify the potential relationship between lncRNAs and mRNAs. The co-expression network exhibited that 26 DElncRNAs and 191 DEmRNAs were correlated, including 239 lncRNA-mRNA pairs. The results indicated that these DElncRNAs and DEmRNAs may interact with each other through some mechanism.
Previous researches demonstrated that lncRNA can act as ceRNAs, affecting the regulation of miRNAs on targeted mRNAs, leading to different types of human cancer processes [34, 35]. Based on the co-expression network and the miRNA prediction website [36], negatively correlated DElncRNA-DEmiRNA and DEmiRNA-DEmRNA relationship pairs were analyzed and a ceRNA network was constructed. In the ceRNA network, we found that 16 lncRNAs could regulate the expression of 63 mRNAs by competitively binding 23 miRNAs. Considering the important role of ceRNA in breast cancer, we explored the correlation between these ceRNA molecules and the prognosis of breast cancer patients. Through integrating these ceRNA molecules with data of matched clinical survival time of BC patients and PPI network, we presented the interactin among proteins and obtained 12 candidate survival-associated genes, which were HOTAIR, AC055854.1, ST8SIA6-AS1, AC105999.2, hsa-miR-1258, hsa-miR-7705, hsa-miR-3662, hsa-miR-4501, CCNB1, UHRF1, SPC24 and SHCBP1. Previous study demonstrated that silencing of CCNB1 had effects on cell cycle, senescence and apoptosis through the p53 signaling pathway in pancreatic cancer [37]. Elia et al. revealed that UHRF1 could epigenetically orchestrate smooth muscle cell plasticity in arterial disease [38]. A study of Zhou et al. suggested that SPC24 was an important component of the mitotic checkpoint machinery and regulated breast cancer progression by PI3K/AKT signaling pathway [39]. Mo et al. indicated that SHCBP1 could activate STAT3/c-Myc signaling pathway to promote tumor progression in penile cancer [40]. These findings suggested that the genes in our prognostic model played important roles in breast cancer.
To identify the impact of combination of the 12 candidate genes on survival prognosis, we constructed a risk prediction model. The risk score of each patient was calculated according to the estimated regression coefficient and expression level of the genes Based on the median risk score, the patients were divided into high-risk group and low-risk group. Kaplan-Meier curve analysis showed that the prognosis of high-risk group was worse than that of low-risk group. The AUC value confirmed the efficiency of the prognostic model in predicting prognosis for BC patients. The accuracy of the model was tested in the testing group Similar results were observed in the testing group. These results suggested that the prognostic model functioned in BC patients.
Nomogram is widely used as prognostic tool in cancer patients. By including clinical prognostic variables and generating survival probability, nomogram can help clinicians make better treatment decisions [41]. Therefore, to better predict the prognosis of BC patients at 1, 3, and 5 years after operation a concise nomogram was developed by incorporating the gene characteristics based on the ceRNA network and other relevant clinical characteristics into the stepwise Cox model. The calibration curve suggested its perfect calibrations. However, our research has some deficiencies. First, we used data from a public database, and the results need to be further verified by prospective clinical trials. In addition, the mechanism of the genes from risk model affecting BC progression needs further experimental research in vitro and vivo.
In conclusion, our research constructed a prognostic risk model of the ceRNA network and nomogram. The two models can potentially predict the prognosis of patients with BC. These results provide new insights for predicting the prognosis of BC patients, and may be of great value in exploring new cancer treatment strategies and prognostic methods.
Author contributions
Conception: Mengni Wu, Yan Chen and Zhihua Xu.
Interpretation or analysis of data: Mengni Wu, Linlin Lu, Yadi Li and Aoshuang Li.
Preparation of the manuscript: Mengni Wu, Tiantian Dai and Yue Yu.
Revision for important intellectual content: Yan Chen and Zhihua Xu.
Supervision: Yan Chen and Zhihua Xu.
Funding
This work was supported by The Natural Science Foundation of Jiangsu Province (BK20211076); Scientific Development Program of Suzhou City (SS202052); Postgraduate Research & Practice Innovation Program of Jiangsu Province (SJCX22_1507).
Competing interests
The authors declare that they have no competing interests.
Patient consent
Not required.