
Abstract
Breast cancer is the most diagnosed cancer worldwide and remains the second leading cause of cancer death. While breast cancer mortality has steadily declined over the past decades through medical advances, an alarming disparity in breast cancer mortality has emerged between African American women (AAW) and Caucasian American women (CAW). New evidence suggests more aggressive behavior of triple-negative breast cancer (TNBC) in AAW may contribute to racial differences in tumor biology and mortality. Progesterone (PRG) can exert its cellular effects through either its classic, non-classic, or combined responses through binding to either classic nuclear PRG receptors (nPRs) or non-classic membrane PRG receptors (mPRs), warranting both pathways equally important in PRG-mediated signaling. In our previous report, we demonstrated that the CCM signaling complex (CSC) consisting of CCM1, CCM2, and CCM3 can couple both nPRs and mPRs signaling cascades to form a CSC-mPRs-PRG-nPRs (CmPn) signaling network in nPR positive(
Keywords

Abbreviations
Introduction
Breast cancer is the most commonly diagnosed cancer worldwide and remains the second leading cause of cancer death in the United States [1]. While breast cancer mortality has steadily declined over the past three decades through medical advances [2], an alarming Black-White disparity in breast cancer mortality has emerged in the United States. Compared to Caucasian American Women (CAW) with breast cancer, African American Women (AAW) are less likely to be diagnosed at earlier stages [3], face more aggressive forms of the disease [4], and experience a higher mortality rate [3]. Additionally, despite the lower lifetime incidence of breast cancer, AAW diagnosed with breast cancer are 38% more likely to die from the disease than age- and prognosis-matched CAW [2]. Overall, AAW face disproportionately higher breast cancer mortality rates than that of CAW [1, 2, 4]. In addition to key social, political, and economic factors that impact the biological expression of breast cancer in AAW and CAW, mounting evidence indicates the presence of intrinsic molecular factors that contribute to racial disparities in breast cancer mortality. AAW were independently associated with poorer survival and worse prognosis than age- and clinically matched CAW, suggesting that breast cancer is a more biologically aggressive disease in AAW under equal treatment [5]. Furthermore, studies found that poorer rates of breast cancer survival are associated with an increased frequency of triple-negative breast cancer (TNBC), especially in young AAW [3, 6]. This suggests that a higher prevalence of TNBCs and a lower prevalence of luminal A tumors could contribute to the poor prognosis of young AAW with breast cancer. TNBC is a subtype of breast cancer that is defined by the absence of estrogen, nuclear progesterone, and HER-2 receptors [ER(
Progesterone (PRG), a sex steroid hormone, can exert its cellular effects through either its classic, non-classic, or combined responses by binding to either nuclear PRG receptors (nPRs) and/or membrane PRG receptors (mPRs), respectively, warranting both pathways equally important in PRG-mediated signaling. In our previous report, we demonstrated that the CCM signaling complex (CSC) consisting of CCM1, CCM2, and CCM3 can couple both nPRs and mPRs signaling cascades to form a CSC-mPRs-PRG-nPRs (CmPn) signaling network in nPR positive(
Among TNBCs, over 70% are basal phenotype breast cancers, one of the most aggressive sub-types; mPRs role in tumorigenesis in this sub-type of PRG-responsive tumors is especially of great interest since these cells do not express nPRs [16]. In this report, we utilized two basal phenotype breast cancer cell lines, MDA-MB-468 (MB468) and MDA-MB-231(MB231), both only expressing mPRs [17, 18] (Suppl. Fig. 1A), to investigate the roles and relationships of key players of the newly defined CSC-mPRs-PRG (CmP) signaling network under mPR-specific PRG actions [treatment with PRG
The overall objective of this project is to understand the molecular regulatory mechanisms of racial disparities in breast cancer mortality concerning breast cancer tumorigenesis under mPR-specific PRG actions for the first time through molecular and cellular manipulation of cultured TNBC cell lines in-vitro. We also aim to analyze the dynamic role of the CmP network systematically and comparatively by deconvoluting the CmP signalosome utilizing systems biology approaches. Our data demonstrate that a common core mechanism exists among nPR(
Results
Altered expression of mPRs and CCM genes across clinical tumors suggests their involvement in breast cancer tumorigenesis
Given our recent findings of the CSC potentially playing a significant role in reproductive tumorigenesis, and the important functions of mPRs for PRG signaling [19, 20, 21, 22, 23], we evaluated basal expression of key CmP players including the CSC (CCM1-3) and mPRs (PAQR5-9, PGRMC1/PGRMC2) in breast cancer tumor tissues using publicly available databases including TCGA. We first assessed expression profiles using The TCGA PANCAN database which allows for expression analysis by filtering tissues based on receptors and PAM50 classification, to evaluate CmP members expression data for two distinct breast cancer tissues, Basal [ER(
RNAseq expression profiling for key CmP players utilizing multiple TCGA breast cancer databases: The TCGA PANCAN database allows for expression analysis by filtering tissue based on PAM50 classification, various phenotypic filters, and is the most comprehensive breast cancer database to date. A) We evaluated CmP members expression data for two distinct breast cancer tissues based on PAM50 classification, Basal [ER(
Prognostic effects for key CmP players utilizing microarray data of breast cancer patients. Publicly available microarray data from breast cancer patients was analyzed using either kmplot software or Xena browser (TCGA database) to integrate gene expression and clinical data simultaneously to generate the displayed Kaplan-Meier survival curves. A) Decreased expression of CCM1 and CCM3 had significantly worst prognostic effects [Overall survival (OS)] in basal type cancers using kmplot. B) Increased expression of most major mPRs (PAQR5-7 and PGRMC2) while decreased expression of PAQR8 and PGRMC1 had significantly worst prognostic effects in basal type cancers using kmplot. C) Our analysis utilizing the TCGA database confirmed that decreased expression of PAQR8 had significantly worst prognostic effects in basal type cancers. D) Similarly, utilizing the same TCGA database, we confirmed decreased OS rates with decreased CCM1 expression in basal type cancers. Breast cancer patients were filtered to only analyze patient samples classified as basal (TNBC) subtype. Logrank 
TNM staging is a widely used standardized system, which allows for assisting in prognostic cancer assessment to evaluate tumor size (T), regional lymph node involvement (N), and metastases of the primary tumor (M). Since the TCGA database contains phenotypic filters that allow for filtering of tissues, based on TNM staging, we evaluated expression profiles for the CSC and mPRs for each category, using only Basal phenotype breast cancer tissues. Tumor size assessment revealed significant alterations in the expression of CCM2 across various tumor size categories (Fig. 1E), suggesting the involvement of the CSC in influencing the size and extent of the primary tumor in TNBCs. Next, we repeated expression profiling to evaluate genes potentially involved in infiltration mechanisms into the lymph nodes. We discovered significant differences in expression of PAQR6, PAQR7, and PGRMC2 across various tumor lymph node status clinical samples, suggesting potential involvement of these key mPRs in lymph node infiltration mechanisms in TNBCs (Fig. 1F). Next, we assessed expression profiles to evaluate genes potentially involved in metastases mechanisms. Our analysis revealed significant differences in gene expression of PAQR5 and PGRMC1 across various stages of tumor metastases (Fig. 1G), also suggesting potential involvement of mPRs in metastases mechanisms in TNBC tumorigenesis. Finally, evaluation of expression profiles based on overall tumor staging categories illustrated significant differential expression in PAQR7, PAQR9, and PGRMC2, confirming the involvement of mPRs in overall tumorigenesis in TNBCs (Fig. 1H).
To further evaluate prognostic effects for the CSC and mPRs in TNBC tissues, we utilized publicly available breast cancer tumor tissue gene expression data (microarray) [24] integrating gene expression and clinical data simultaneously to generate Kaplan-Meier survival curves. First, breast cancer patients were filtered to only analyze patient samples classified as TNBC subtypes. Our analysis revealed that decreased expression of CCM1 and CCM3 had significantly worst prognostic effects in TNBCs (Fig. 2A), re-affirming the essential role of the CSC in TNBC tumorigenesis. Our analysis also revealed that increased expression of most mPRs (PAQR5-7 and PGRMC2) but decreased expression of PAQR8 and PGRMC1 had significantly worst prognostic effects in TNBCs (Fig. 2B), confirming the essential role of mPRs in TNBC tumorigenesis. Interestingly, when we repeated our analysis utilizing a different breast cancer database (TCGA) through the Xena browser software, our new analysis confirmed that decreased expression of PAQR8 had significantly worst overall survival (OS) (Fig. 2C) validating our previous results (Fig. 2B). Finally, decreased expression of CCM1 was also confirmed to result in significantly worst OS rates in TNBCs (Fig. 2D), further validating our previous results (Fig. 2A). These results solidify the involvement of the CmP signaling network in TNBC tumorigenesis and elucidate the great potential of the CmP signaling network for prognostic applications in TNBCs.
Distinct responses to mPR-specific PRG actions through mPRs in nPR(
Common relationships among the CmP signaling network in nPR(
New subtypes of TNBC cells are based on the role and expression patterns of the CSC and mPRs. The expression levels of all CCMs (1, 2, 3) proteins are very low in the two nPR(
RNA expression levels of key factors of the CmP network in nPR(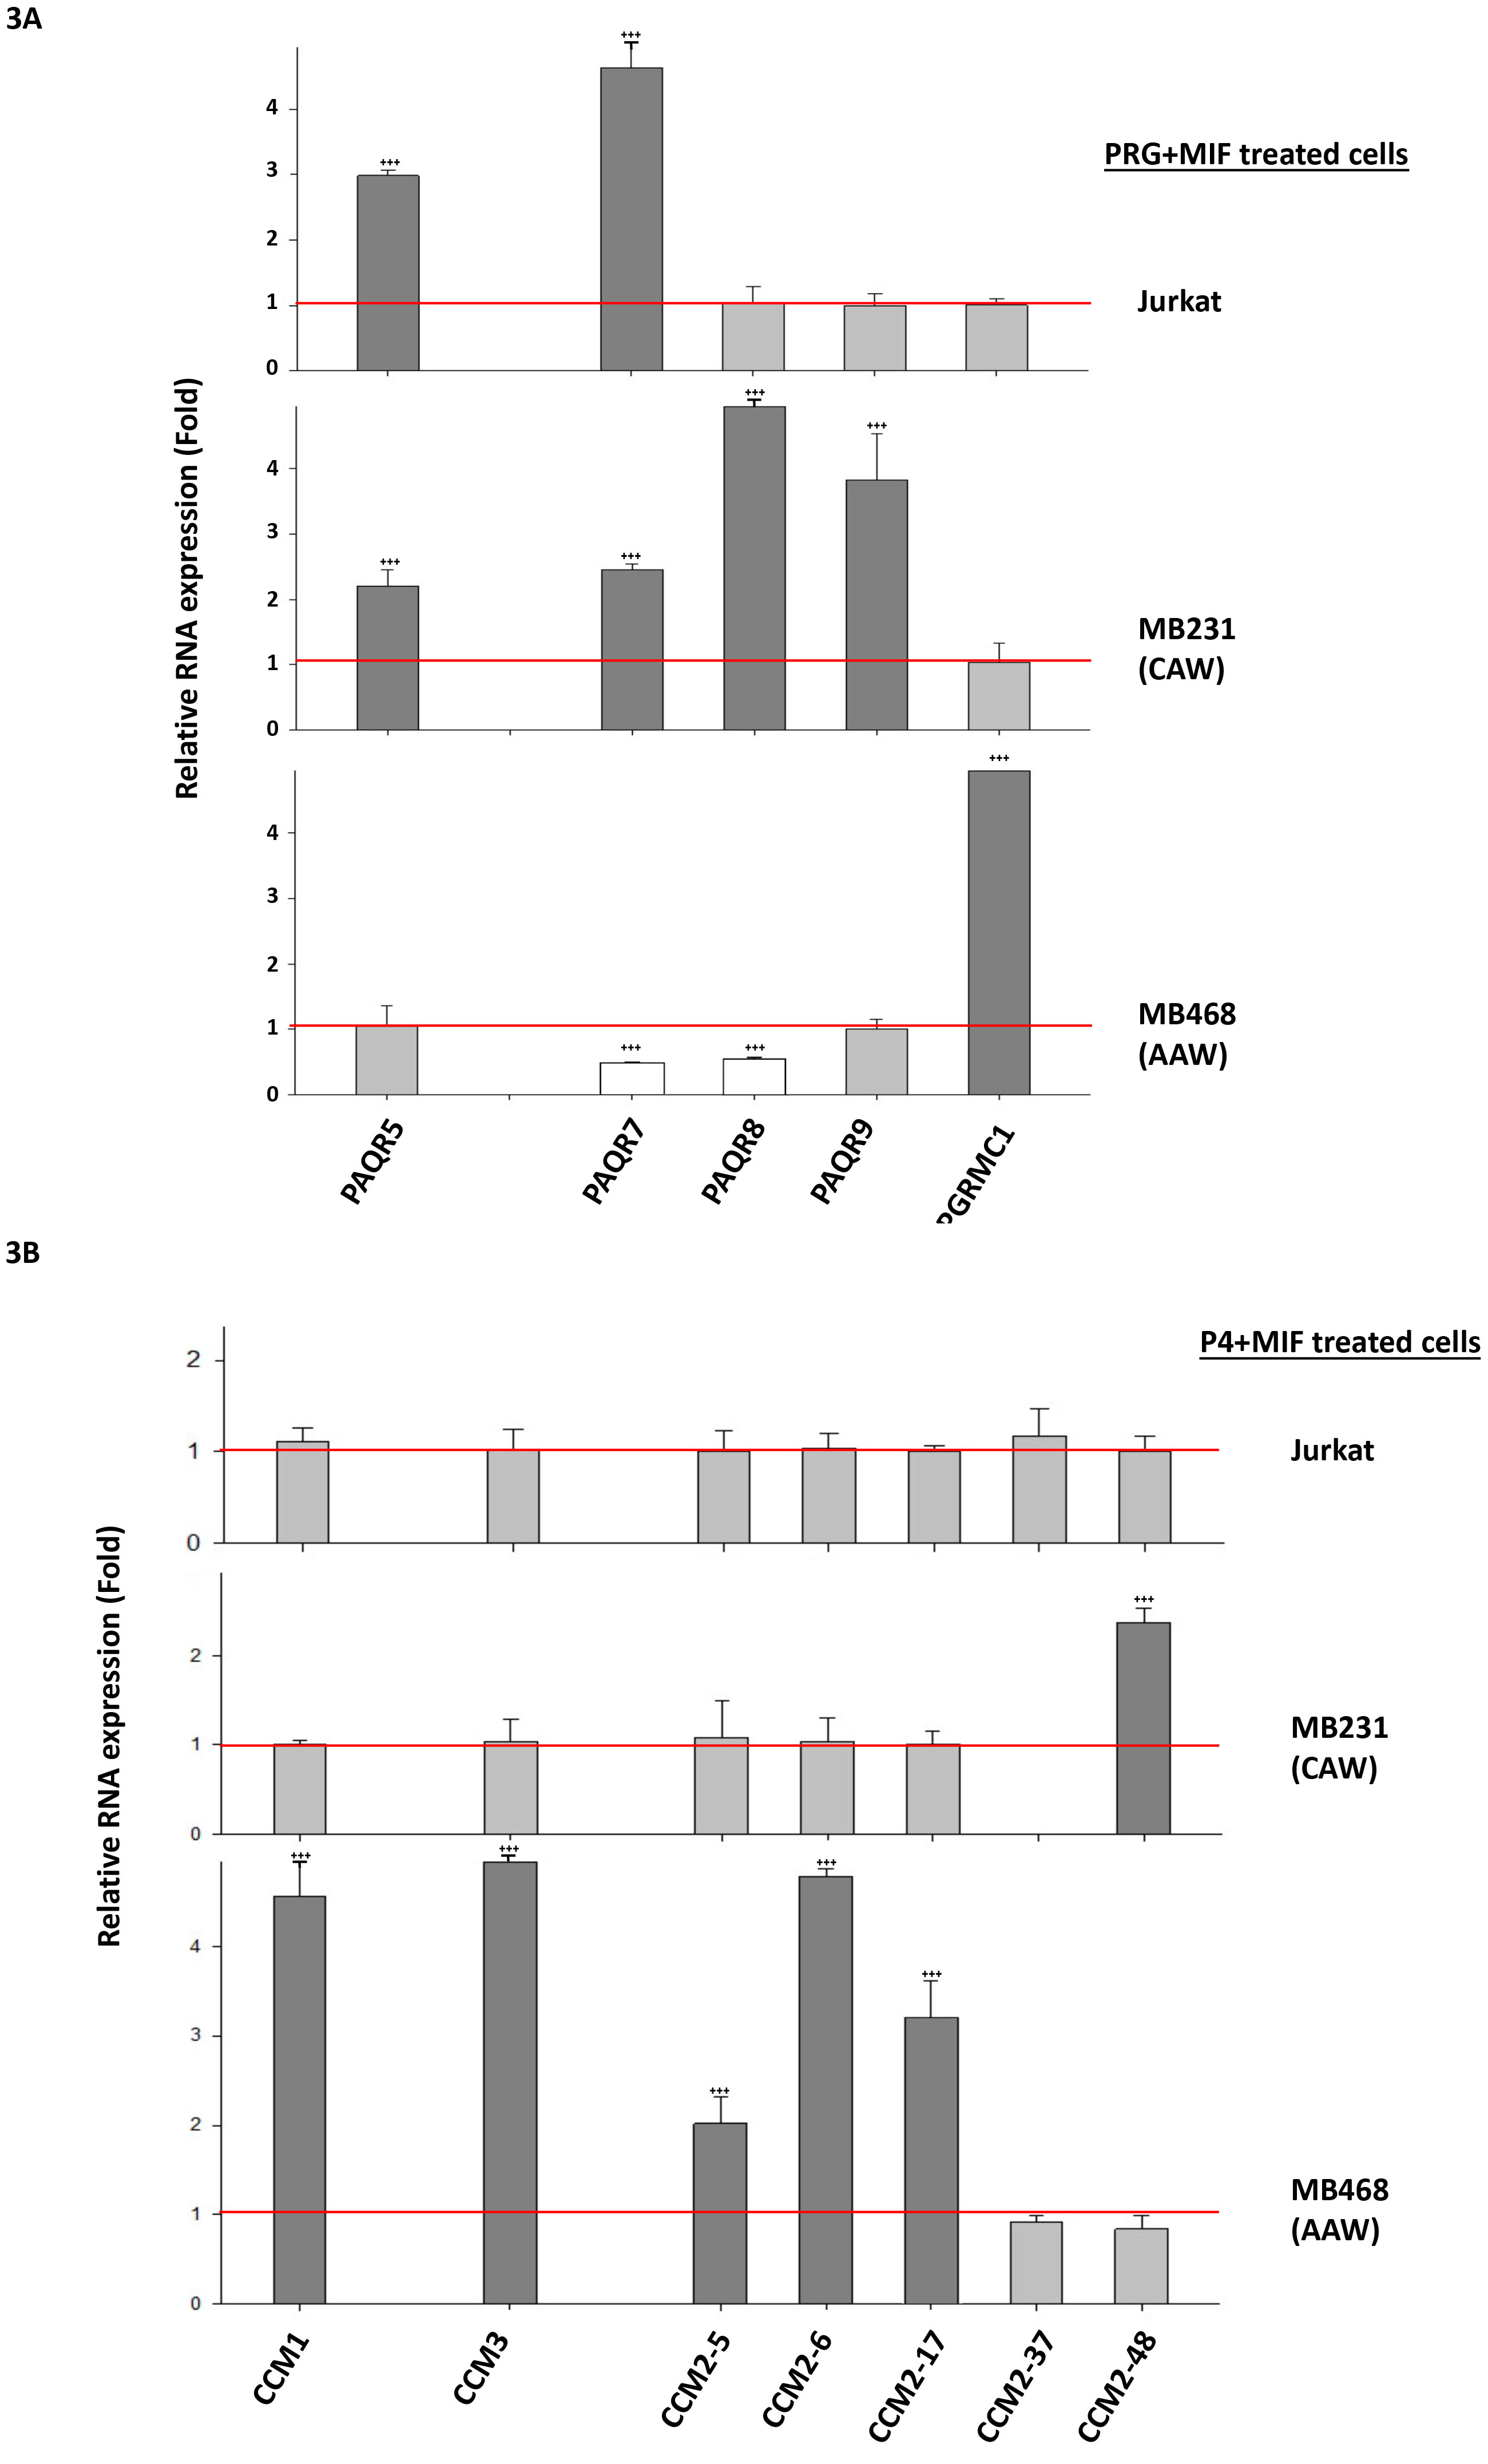
Tumorigenic assessment of TNBC cells under mPR-specific PRG treatment. AAW- and CAW-TNBC cells, were treated in triplicates in FBS-free medium containing vehicle control (EtOH, DMSO), Mifepristone (MIF, 20 
Modulation of key factors of the CmP network in TNBC cells under mPR-specific PRG actions. CAW and AAW-TNBC cells were treated with mPR-specific PRG treatment (MIF
Continued. A-3. IF approaches revealed CAW-TNBC cells showed more PAQR8 staining inside the nucleus at 0 hrs followed by altering localization of PAQR8 back to the cytosol at 72 hrs. AAW-TNBC cells did not show much change in localization or expression of PAQR8 at 72 hrs compared to 0 hrs. B. Using NIKON elements analysis tools, localization of PAQR8 demonstrated the increased expression observed in total PAQR8 in both CAW-TNBC and AAW-TNBC cells appears to localize specifically inside the nucleus, and even when levels have decreased back down to those levels observed at 0 h, the ratio decreases back towards the cytosol, but is still predominantly located in the nucleus (top panels). Localization of CCM1 demonstrated increased expression in nuclear CCM1 in AAW-TNBC cells after 8 hours and the expression appears to still be predominantly located in the nucleus throughout the time course while the opposite trend was observed for CCM1 expression in CAW-TNBC cells, where CCM1 is localized in the cytosol for most timepoints (middle panels). Localization of CCM3 demonstrated expression of CCM3 in AAW-TNBC cells appears to localize specifically inside the nucleus at the earlier time points (0–12 hrs), and then localizes back into the cytosol closer to a 1:1 ratio, (except for 48 hrs) (bottom left panel). Expression of CCM3 in CAW-TNBC cells appears to localize specifically inside the nucleus at the earlier time points (0–12 hrs), shuttles back into the cytosol at 24–36 hrs, and then shuttles back into the nucleus for the remainder of the experiment. Red line indicates a 1:1 ratio of proteins in nucleus: cytosol. CCM1 was quantified through ROI intensities using wavelength 488 nm. PAQR8 and CCM3 was quantified through ROI intensities using wavelength 555 nm. Data were acquired from 8 sets of independent images and normalized against their respective internal controls using 408 nm wavelength for DAPI (nuclear) and background staining subtraction. For each replicate, Region of Interest (ROI) intensities were automatically quantified (over 1000 times/per area). In all bar plots, 
Continued. C. Cellular fractionation and Western blot analysis show that PAQR8 (mPR
TNBC cell performance is determined by the CmP signaling network. Based on our previous findings, under steroid actions, the intricate balance among key players of the CmPn signaling network is achieved through a balance between the negative effects of PRG/MIF signaling via mPRs and the positive effects of PRG signaling through nPRs in nPR(
Inducible expression patterns of key factors of the CmP signaling network under mPR-specific PRG actions. The distinct RNA expression patterns between CAW- and AAW-TNBC cells are novel and interesting (Fig. 3A and B). We followed these phenomena temporally and found validating pieces of evidence for these opposite expression patterns. RNA expression of major mPR genes (PAQR7, PAQR8) in CAW-TNBC cells can be drastically induced by mPR-specific PRG actions (Fig. 4C, middle and right panels), compared to no response in AAW-TNBC cells (Fig. 4C, left panel), while RNA expression of CCM1 gene in AAW-TNBC cells can be significantly induced by sex steroids (Fig. 4C, left panel), compared to little or no response in CAW-TNBC cells (Fig. 4C, middle and right panels). These opposite temporal RNA expression patterns, seen among CAW- and AAW-TNBC cells, agree with RT-qPCR data (see Fig. 3A and B). Increased RNA expression levels of Glucocorticoid Receptor (GR) gene in AAW-TNBC cells under steroid actions is quite interesting (Fig. 4C, left panel), however, the same inducible RNA expression enhancement of GR gene under mPR-specific PRG actions was also observed in nPR(
mPRs are nucleocytoplasmic shuttling proteins
Temporal and spatial cellular compartmentation of key factors of the CmP signaling network. Since mPRs were initially identified as cell surface and membrane-bound PRG receptors [29] with seven predicted membrane-spanning motifs [29] functioning as putative G-protein coupled receptors (GPCRs) [30], membrane-impermeable PRG-BSA conjugate techniques [31] have been widely used to measure PRG-mPRs signaling with a sole focus on its non-genomic actions [32, 33, 34]. It has been reported that there is very low expression of PAQR7 in MB231 cells [27, 32] therefore, we performed cellular localization of PAQR8 along with other key factors (CCM1/3) in the CmP network in both CAW/AAW-TNBC cells. Under our observations, initially, CCM1 is equally distributed in the nucleus in both TNBC cells, however, after mPR-specific PRG actions, both nuclear and cytoplasmic increased expression of CCM1 is visualized in AAW-TNBC cells (Fig. 5A-1, left panel), while CCM1 expression not only increases as well but concentrates along the nuclear membrane (peri-nucleus) in CAW-TNBC cells (Fig. 5A-1, right panel). In contrast, CCM3 appears to be distributed dominantly in the nucleus initially and mPR-specific PRG-enhanced expression of CCM3 was visualized more towards the cytosol (more dramatic in AAW-TNBC cells) (Fig. 5A-2). Intriguingly, PAQR8 localizes within the nucleus and remains unchanged under mPR-specific PRG actions in AAW-TNBC cells (Fig. 5A-3, left panel), while PAQR8 is dominantly distributed initially within the nucleus (likely associated with the nucleolus), and becomes more evenly distributed in both nucleus and cytosol after mPR-specific PRG actions in CAW-TNBC cells (Fig. 5A-3, right panel). It was not a total surprise for us to observe nuclear localization of PAQR8 in TNBC cells since we have observed a similar phenomenon in Luminal-A T47D cells [15]. Interestingly, there have been contradicting reports of cellular localization of mPRs in either the cytoplasmic membrane or cytoplasmic compartmentations (mainly rough ERs) in several cell types, including MB231 cells [30, 35], while cellular compartmentations of mPRs on MB468 cells have yet to be reported. Our data clearly show that PAQR8 is capable of nuclear sub-compartmentation in both TNBC cells. Furthermore, we also observed nuclear localization of PAQR5 (mPR
Next, we examined the temporal expression patterns under mPR-specific PRG actions, demonstrating steroid-induced expression of CCM1 again in AAW-TNBC cells (Suppl. Fig. 4A-1), in line with our previous data (Figs 3B, 4D, 4E). Interestingly, there is an early surge (non-genomic) of CCM3 protein expression in AAW-TNBC cells (Suppl. Fig. 4A-2), which is unrelated to the genomic induced expression of CCM3 (increased RNA expression at earlier time points, Fig. 4C), and opposite to the data observed in luminal A T47D breast cancer cells [15]. The underlined mechanisms of CCM3 fluctuation in AAW-TNBC cells is still unknown. A visual subtle decrease of PAQR8 in AAW-TNBC cells under mPR-specific PRG actions was also observed(Suppl. Fig. 4A-3). Interestingly, mPR-specific PRG-induced expression of CCM1 was observed again in CAW-TNBC cells (Suppl. Fig. 4A-4), collaborating with our previous data (Fig. 4D). Likewise, mPR-specific PRG-induced expression of CCM3 (Suppl. Fig. 4A-5) and PAQR8 in CAW-TNBC cells (Suppl. Fig. 4A-6) were also visualized, in line with our previous data (Figs 3B and 4D). The major discovery from these observations is the temporal and spatial regulation of protein expression of key players of the CmP network under mPR-specific PRG actions in both AAW- and CAW-TNBC cells.
Cytoplasmic-nuclear trafficking of key players of the CmP network. One of the major findings associated with our data is the cytoplasmic-nuclear trafficking of mPRs. Utilizing a larger sample size, we carefully examined the temporal subcellular localization of key factors (CCM1/3, PAQR8) of the CmP network under mPR-specific PRG actions in both TNBC cells and not only found PAQR8 inside the nucleus (Suppl. Figs 4A-3, 4A-6) but also found the temporally dynamic expression patterns of PAQR8 in the nucleus and cytosol in both TNBC cells (Fig. 5B, upper panels). Cytoplasmic-nuclear trafficking of CCM1 has been well studied by our lab [36, 37, 38, 39, 40, 41], therefore, we used CCM1 as a positive control to validate the possible cytoplasmic-nuclear trafficking of PAQR8. We found that both CCM1 and CCM3 proteins are predominantly in the nucleus in AAW-TNBC cells (Fig. 5B, middle and lower left panels), while CCM1 and CCM3 show distinct nucleo-cytoplasmic shuttling capabilities with a more equal subcellular compartmentation in CAW-TNBC cells (Fig. 5B, middle and lower right panels). Intriguingly, CCM1 and PAQR8 localization, in CAW-TNBC cells, displayed the same temporal and spatial trends observed after 4 hrs, indicating perhaps coordinately synchronized cytoplasmic-nuclear trafficking activities of endogenous CCM1 and PAQR8 only in CAW-TNBC cells under mPR-specific PRG actions (Fig. 5B, middle and upper right panels). The observed phenomena suggest that PAQR8 nucleocytoplasmic shuttling might be CCM1-dependent, and recent data have shown that many proteins constantly shuttle between the cytoplasm and the nucleus without an obvious bona fide classic NLS and/or NES signaling site [42]; however, our bioinformatics simulation data suggested the possible existence of one NLS and two NES sites within PAQR8 (Suppl. Fig. 4C), further strengthening our observations of nuclear-cytoplasmic shuttling of PAQR8 in both TNBC cells. Finally, due to abundant nuclear localization of PAQR8 observed in CAW-TNBCs through IF imaging (Fig. 5A-3), cellular fractionation of CAW-TNBCs confirmed that PAQR8 (mPR
Different responses to sex steroid actions in TNBCs. In the era of personalized medicine or precision medicine, the correct classification of breast cancer into molecular subtypes with distinctive gene expression signatures or profiles to provide a needed prognosis for treatment is an unmet task for this remarkably heterogeneous and deadly human condition. Although nPR(
Our novel findings are further validated through Omics
Dissecting the CmP network in AAW-derived TNBC cells using omic approaches. To define key altered pathways, potential partners involved in the CmP signaling network, and potential biomarkers, we examined the expression patterns of AAW-TNBC cells under mPR-specific PRG actions, at both the transcriptional and translational levels using high-throughput Omic approaches, including RNAseq and Tandem Mass Spectrometry (LC-MS/MS). Since RNA expression of CCM1 gene in AAW-TNBC cells can be significantly induced by sex steroids (Fig. 4C, left panel), compared to no or little response in CAW-TNBC and Jurkat cells (Fig. 4C, middle and right panels), we filtered out our RNAseq and proteomics data for AAW-TNBC cells by removing similarly altered Differentially Expressed Genes/Proteins (DEGs/DEPs) shared between AAW-and CAW-TNBC cells (including Jurkat) to evaluate AAW-TNBC specific DEGs/DEPs.
Key signaling cascades identified within the CmP network in AAW-TNBC cells using RNAseq. Among the identified DEGs (Suppl. Table 4A), we were able to visualize hierarchical clustering (Suppl. Fig. 5A, top panel), and found similar temporal patterns in both intersection and union of DEGs(Suppl. Fig. 5A, bottom panels). Identification of up and down-regulated genes at each time point revealed that mPR-specific PRG actions have an overall stronger up-regulation on AAW-TNBC specific DEGs (Fig. 6A, top panel). Further stratification demonstrated 1300
Differentially Expressed Genes/proteins (DEGs/DEPs) among AAW-TNBC cells utilizing high-throughput OMIC approaches: AAW-TNBC cells were treated with MIF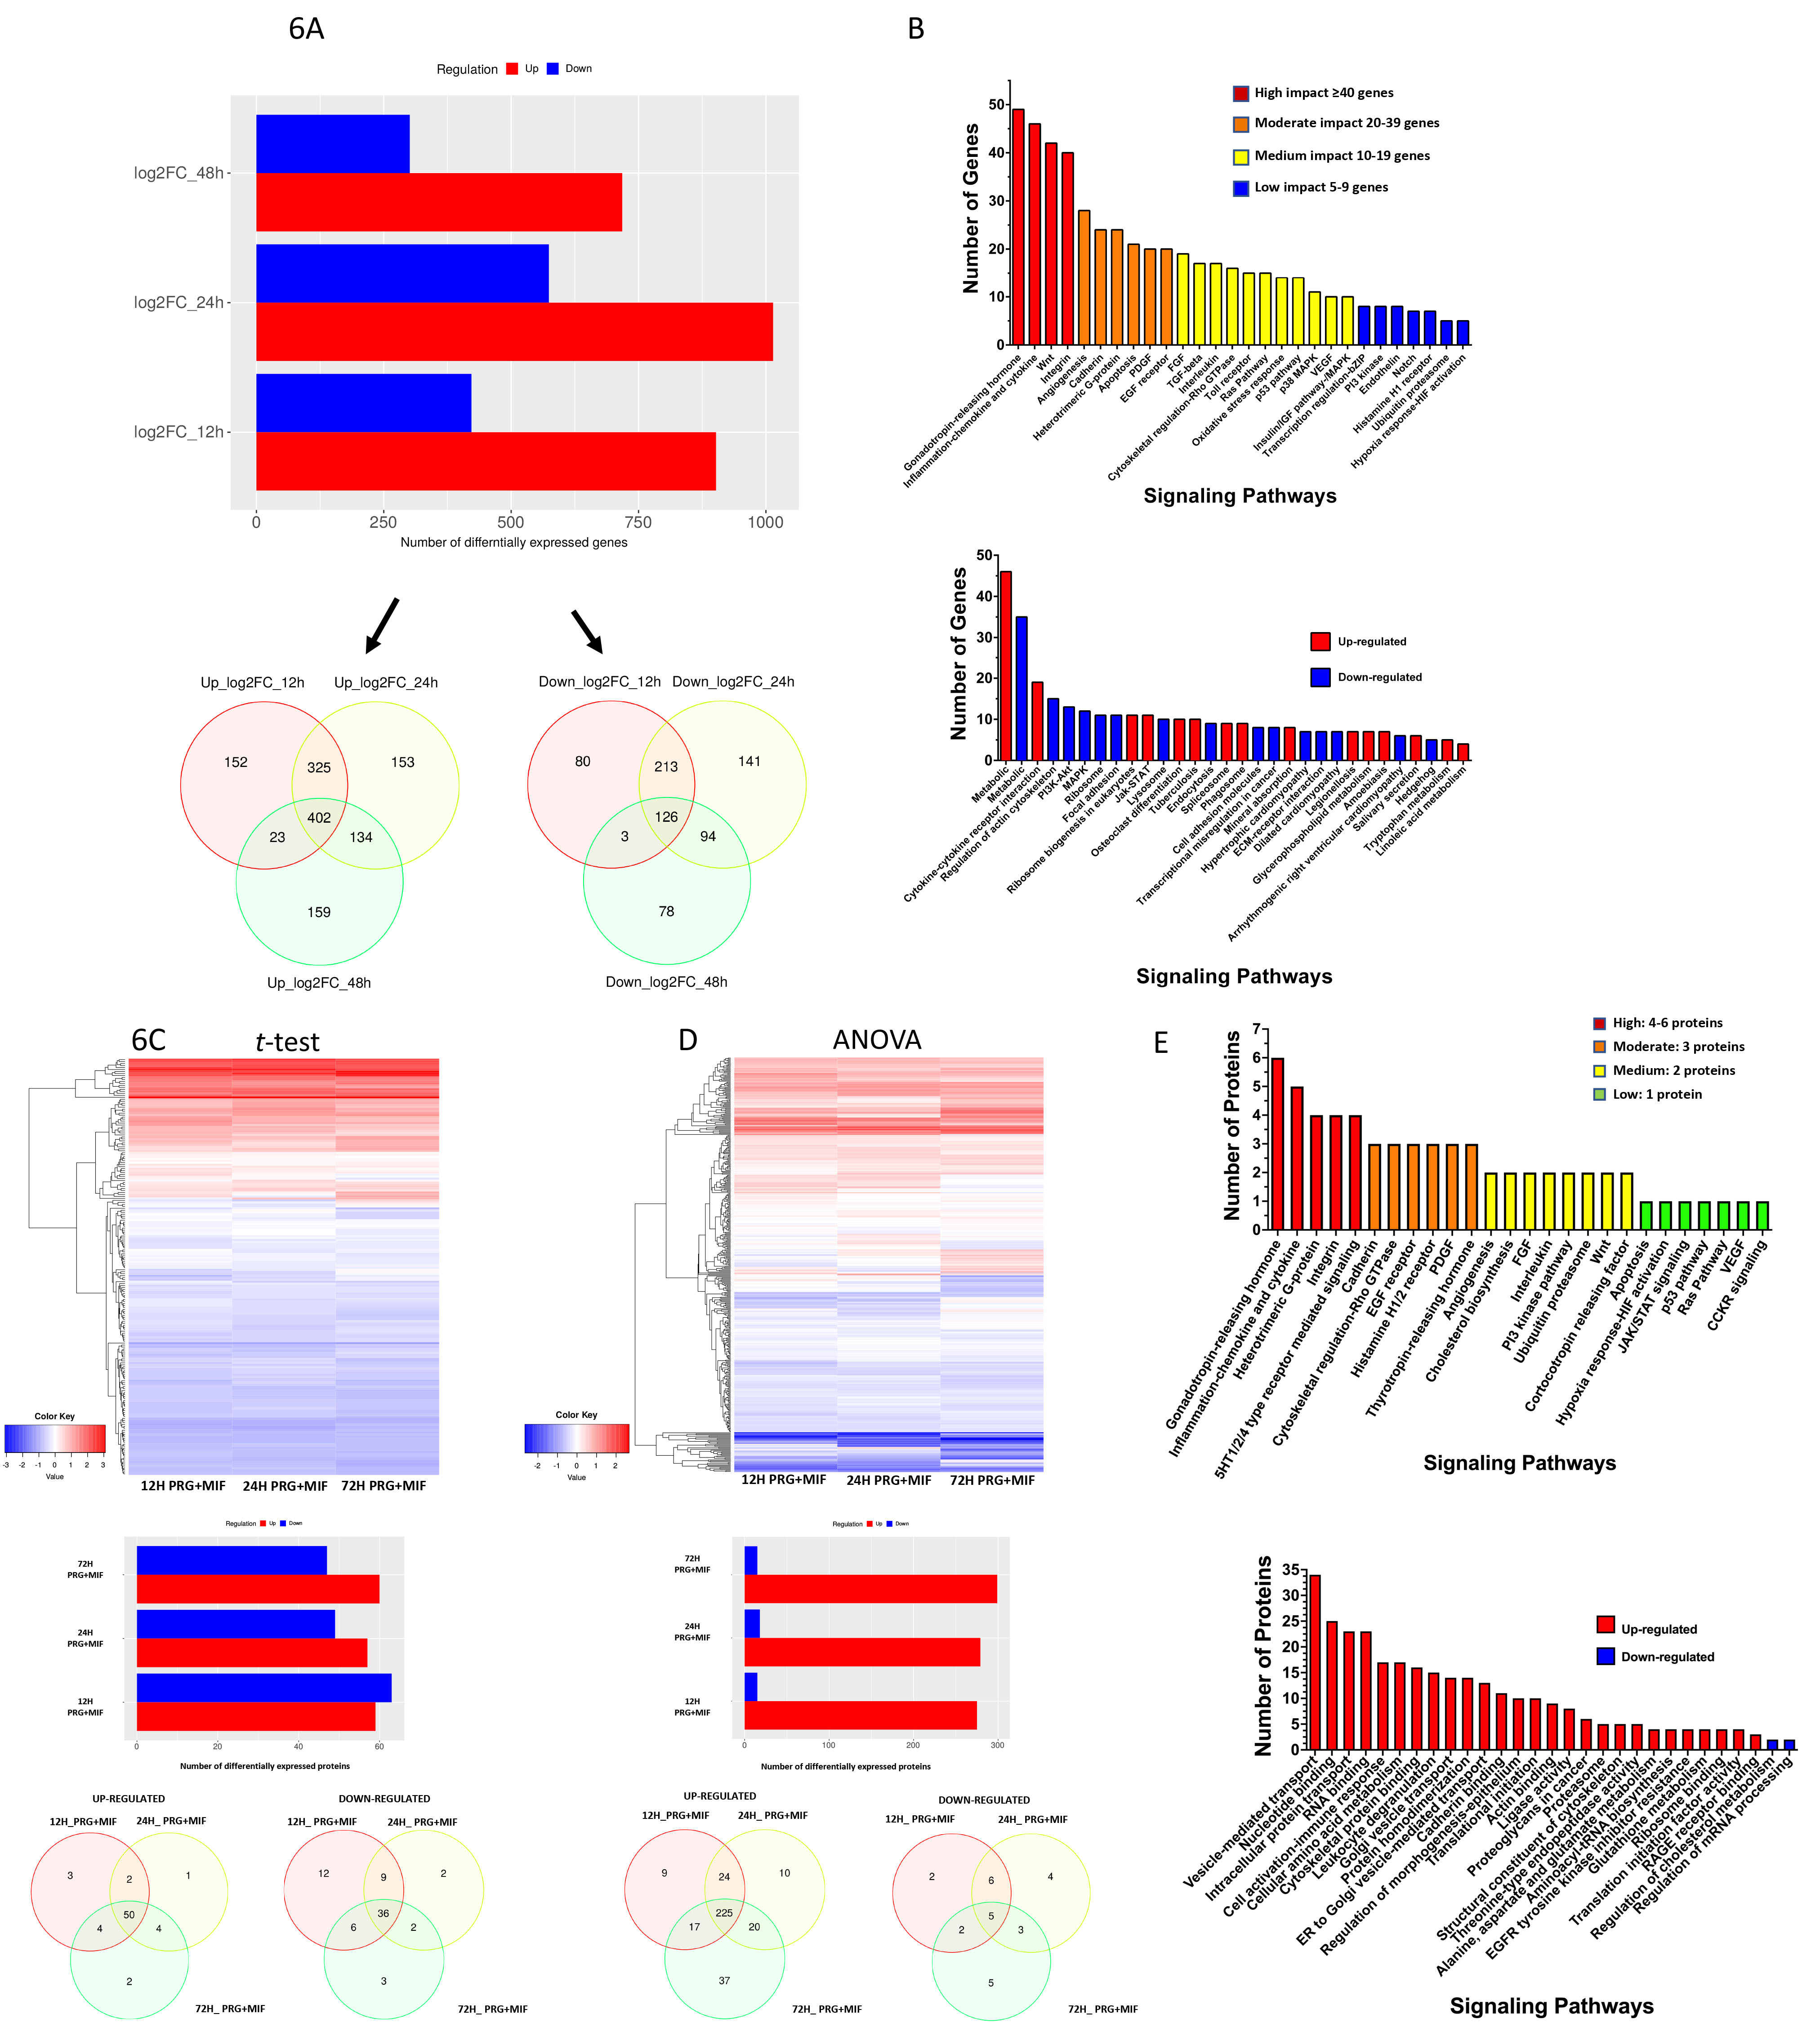
To delineate cellular partners sharing the same inducible RNA expression patterns as CCM1 (Fig. 4C, left panel), we temporally analyzed RNAseq data to search for significantly inducible up-regulated genes (Suppl. Table 4B), and identified 14 genes under mPR-specific PRG actions (Suppl. Fig. 5B, left panel). These findings suggest that mPR-specific PRG actions can induce RNA expression for a subset of genes, identical to the expression patterns seen for CCM1 in AAW-TNBC cells. Among the identified 14 AAW-TNBC-specific DEGs, was IL6, a well-known player in key cancer pathways. Additionally, identified inducible expression of PLK3 has been suggested as a novel independent prognostic marker in breast cancer [56]. Alterations in several key pathways, resulting from these 14 DEGS, included cell population proliferation, reproduction, and immune system processes(Suppl. Fig. 5D). Additionally, these results validated altered pathways seen in the global RNAseq profiling of AAW-TNBC cells under mPR-specific PRG actions (compare Fig. 6B, and Suppl. Fig. 5D). Next, we also searched for significantly inducible down-regulated genes (Suppl. Table 4B) and identified 8 genes under mPR-specific PRG actions (Suppl. Fig. 5C). Altered signaling pathways, resulting from these 8 DEGS, included angiogenesis, WNT, and apoptosis (Suppl. Fig. 5E).
Key signaling cascades within the CmP network in AAW-TNBC cells using LC-MS/MS approaches. Through Euclidean mapping of DEPs (Suppl. Table 5A), we were able to visualize proteomic regulation (Fig. 6C–D, top panels), and upon identifying up and down-regulated genes temporally, revealed that there is a greater propensity of upregulated proteins at 24 and 72 hrs when analyzed using
We again delineated cellular partners sharing the same/reverse inducible expression patterns as CCM1 (Fig. 4D), as we did with our transcriptomic data, at the translational level. We identified 50 consistently up-regulated proteins (Suppl. Table 5B and Suppl. Fig. 7A) with similar expression patterns as CCM1. Intriguingly, 30 of the 50 consistently up-regulated proteins are differentially expressed in numerous cancers including breast, cervical, liver, lung, and brain cancer, contributing to tumor growth, metastasis, and high invasive activities(Suppl. Table 5C). We observed several of the previously altered signaling pathways (detected using DEGs) for these up-regulated DEPs(Suppl. Fig. 7A), including Integrin, Inflammation, toll receptor, and interleukin signaling pathways (Suppl. Fig. 7C). Finally, we identified only 4 DEPs with inverse expression patterns to CCM1 (Suppl. Fig. 7B, Suppl. Table 5B) and observed similar regulatory effects (seen at the transcriptional level) in the analysis of signaling pathways for these down-regulated DEPs(Suppl. Fig. 7B) including biological regulation, response to stimuli and localization pathways (Suppl. Fig. 7D).
Together, these results solidify the existence of a cellular relationship between the CSC and mPRs signaling at the translational level by establishing the CmP signaling network in AAW-TNBC cells. Our extensive omics analysis has also provided several new candidate biomarkers, that can be further investigated to determine their potential clinical applications for AAW-TNBCs.
Key signaling cascades within the CmP network in AAW-TNBC cells identified using systems biology approaches. To look at the inter-relationship between RNA and protein expression from AAW-TNBC cells under mPR-specific PRG actions, we overlaid the regulation patterns and extrapolated the overlaps between our two OMIC datasets(Suppl. Table 6A). When looking at the enriched annotations we see pathways involved in the regulation of cancer and tumor factors still consistently present from the individual analyses, including Integrin, cytokine-mediated responses, GnRH, WNT, and angiogenesis among the top 10 affected pathways (Fig. 7A and Suppl. Table 6B). These results further validate our independent observations at both the transcriptional and translational levels (Fig. 6 and Suppl. Figs 5-8). When reviewing DEG/DEP expression patterns, it should be noted that DEGs/DEPs with the same regulation trends (averaged log2 Fold Changes) seen at both levels (Bolded blue and red ID’s) are key AAW-TNBC specific potential biomarker candidates (Fig. 7B), while DEGs/DEPs displaying opposite expression patterns (black-colored ID’s) commonly reflect genes that are capable of undergoing potential feedback auto-regulation (Fig. 7B). Up-regulated DEGs/DEPs illustrate a significant impact on essential cancer pathways including Integrin, Rho GTPase, angiogenesis, VEGF, GNRH, G-protein, EGF, PDGF, and Cadherin signaling pathways (Fig. 7B).
Systems biology analysis utilizing high-throughput omics data to identify novel biomarkers unique to tumorigenesis in AAW-TNBC cells under mPR-specific PRG actions: Extracted significant DEGs/DEPs were further filtered using corresponding MB231/Jurkat cells to obtain DEGs/DEPs specific to AAW-TNBC cells. A. Pathway functional enrichment results for corresponding DEGs/DEPs were compiled using the PANTHER classification system. Coloring indicates the potential impact on each signaling pathway; high (5–6 genes/proteins): red, moderate (3–4 genes/proteins): orange, medium (2 genes/proteins): yellow, low (1 gene/protein): green. B. A corresponding table is provided for each signaling pathway that details the genes involved, and the statistical analysis used with the proteomics data (A, ANOVA; T, 
We then performed a meta-analysis using a working database (Suppl. Table 6C) with CHIP-seq data from various breast cancer cells (containing AAW-TNBC cells) treated with either PRG/MIF. This task was accomplished by using the NCBI Batch Web CD-Search tool [58, 59]. The list of overlapped genes (Suppl. Table 6C) was graphed through Euclidian heat maps for both RNA and protein as well as their regulation patterns (Fig. 7C–F). In general, we observed that most of the genes identified in our systems-wide analysis with combined RNA-seq/Proteomics/CHIP-seq data appear to be capable of being auto-regulated through feedback mechanisms in AAW-TNBC cells under mPR-specific PRG actions. However, we still identified two steroid-inducible AAW-TNBC specific candidate biomarkers namely EGFR and MYO1B (Fig. 7G).
We set out to filter our identified candidate biomarkers for AAW-TNBCs from our omics approaches to obtain a more clinically relevant set of prognostic biomarkers. To accomplish this, 11 publicly available breast cancer datasets from the University of California-Santa Cruz (UCSC) Xena Browser [60, 61, 62, 63, 64, 65, 66, 67, 68, 69, 70, 71] as well as two TCGA-BRCA databases available in Xena Browser (TCGA-BRCA and GDC-TCGA-BRCA) were compiled to validate differential expression among breast cancer subtypes for our Identified candidate biomarkers(Suppl. Table 6D). Additionally, we evaluated prognostic effects for our candidate biomarkers [24] integrating clinical and gene expression data simultaneously to generate Kaplan-Meier (KM) survival curves. Breast cancer patient samples were filtered to only analyze patient samples classified as TNBC subtype. For the first group of 12 biomarkers, a worst prognostic effect was observed with higher expression(Suppl. Fig. 9A1–A12). We also observed up-regulation for 10/12 biomarkers (CNN3 and LSS were down-regulated) with a disrupted CmP signaling network, under mPR-specific PRG actions, in TNBC cells(Suppl. Table 6D), demonstrating that mPR-specific PRG actions could lead to worst prognostic outcomes in AAW-TNBCs. Alternatively, our second group of 9 biomarkers demonstrated a better prognostic effect with higher expression(Suppl. Fig. 9B1–B9). Interestingly, we observed up-regulation of all 9 genes/proteins with a disrupted CmP signaling network, under mPR-specific PRG actions, in TNBC cells(Suppl. Table 6D). Together these results demonstrate the heterogeneity response of TNBCs under mPR-specific PRG treatments. Utilizing our KM survival curve data, we further assessed our biomarkers by only proceeding with biomarkers that had significant KM survival curves in TNBC patients to assess their basal expression patterns in clinical samples.
Utilizing publicly available breast cancer tumor tissue gene expression data (microarray) [24] we explored expression patterns of our identified candidate biomarkers in 925 nPR(
6 identified prognostic candidate biomarkers in AAW-TNBCs
6 identified prognostic candidate biomarkers in AAW-TNBCs
Candidate biomarkers shared at both RNA/Protein levels under mPR-specific PRG actions (columns 1, 2, 3), were preliminarily validated in the first set of AAW- (
Dual validation of our candidate biomarkers between CAW- and AAW-TNBC tissues for their prognostic effects. We next sought to enhance our analysis to investigate differential expression patterns between two cohorts of comparative expression data from AAW- and CAW-TNBC tumor tissues. To accomplish this task, first, we utilized publicly available RNA-seq data comparing expression levels in 23 AAW-TNBC and 19 CAW-TNBC samples (filter 1) [72] that were used to obtain expression data for the candidate biomarkers associated with significant KM curves identified in this study. 10 of our markers displayed similar trends with a disrupted CmP signaling network, as was uniquely observed in the 23 AAW-TNBC patient samples(Suppl. Table 6D, red and blue colored, bolded biomarkers, column 1). This allowed us to preliminarily define these genes as intrinsic biomarkers for AAW-TNBCs. Alternatively, the remainder of our biomarkers displayed opposite or inducible trends with a disrupted CmP signaling network in AAW-TNBC cells, as was naturally observed in the 23 AAW-TNBC patient samples, preliminarily allowing us to define these genes as inducible biomarkers (CmP disruption) for AAW-TNBCs(Suppl. Table 6D, black-colored, bolded biomarkers). Finally, we wanted to confirm our initial 21 identified biomarkers with differential expression patterns between AAW and CAW-TNBCs(Suppl. Table 6D, bolded markers column 1) using a separate and larger cohort (filter 2) of publicly available microarray data containing 64 AAW-TNBC and 113 CAW-TNBC samples through the TCGA database. Our analysis confirmed the identification of EGFR and LSS as inducible biomarkers (Table 1, black-colored biomarkers) as well as identification of COPE as an intrinsic biomarker (Table 1, red-colored biomarker) for AAW-TNBCs(Suppl. Fig. 10B). Interestingly, this larger cohort instead identified GARS and LANCL2 as inducible biomarkers (Table 1, black colored biomarkers) for AAW-TNBCs, while EML2 emerged as a newly identified intrinsic biomarker(Suppl. Fig. 10B and Table 1, red-colored biomarker). Together, these results reinforce the existence of both intrinsic and inducible biomarkers in AAW-TNBCs, a pioneering first step to tackle the currently alarming Black-White disparity in breast cancer mortality.
Utilizing all the expression and prognostic data, we filtered out our initial 47 biomarker hits (Suppl. Table 6D) to a preliminary list of 21 intrinsic and inducible biomarkers for AAW-TNBCs(Suppl. Table 6D, bolded biomarkers), that were even further condensed to a clinically relevant list of 2 intrinsic and 4 inducible biomarkers (Table 1) confirmed to have statistically significant differential expression among AAW and CAW-derived TNBC tumors.
There has been sufficient evidence for the existence of PRG-mPRs signaling cascade in either nPR(
Novel discoveries in the CmP signaling network with potential revolutionary impacts
The CmP signaling network and mPRs subcellular compartmentation. mPR expression patterns in many tissues and cell lines, and the possible involvement of mPRs in various biological processes have been extensively studied, however, the precise functions of mPRs remain controversial [73], especially regarding their subcellular compartmentation [74]. Up to date, mPRs have been agreed upon as a new type of PRG receptor, with only confirmed non-genomic PRG-actions, and while their stimulation varies drastically in a tissue- and cell-dependent fashion, debates on their subcellular compartmentation continue [74]. As mentioned earlier, mPRs were initially identified as a new family of membrane-bound PRG receptors [29], and PRG-mPRs signaling cascades, as well as their mediated cellular functions, have been investigated in various organisms and cell types [32, 33, 34, 75, 76]. However, recently, evidence of cytoplasmic localization or cytoplasmic compartmentation of mPRs in various cell types, including MB231 cells, has emerged [30, 35]. Initial pieces of evidence of cytoplasmic vesicles of mPRs [30, 35] were speculated as to the result of either technical issues/cytotoxic events for recombinant mPRs from transiently transfected constructs [30] or being found in the membrane of the endoplasmic reticulum (ER) [35]. Recently, contradicting evidence has emerged of localized recombinant mPR
Our novel finding of cytoplasmic-nuclear trafficking of mPRs will certainly revolutionize the current view of the functions and subcellular compartmentation of mPRs. Since only endogenous mPR
The most common and significant characteristic shared by all steroid hormone receptors is the ability for cytoplasmic-nuclear trafficking [83]. The molecular mechanisms of nucleocytoplasmic shuttling have been well defined for AR [84], GR [85], ERs [86], and nPRs [87]. In this study, our finding that nucleocytoplasmic shuttling of PAQR8 (mPR
CmP signaling network and breast cancer
Potential involvement of mPRs in breast cancer has been suggested, however, due to the existence of both nPR(
Previous reports suggested that mPR
Potential implication for cancer therapy: PRG regulates specific functions in nPR(
As a well-known antagonist of PRG, MIF has been regarded as a great candidate for the treatment of reproductive cancers [98] and is currently on many active interventional clinical trials [99, 100]. Some data demonstrated that elevated levels of MIF act as a growth inhibitory agent enhancing induction of apoptosis triggered by high doses of PRG in either nPR(
Although the anti-proliferative activity of MIF in cancer cells is independent of nPRs [106], the cellular effects of MIF on proliferation are controversial, being reported as both a growth inhibitor [107] as well as a stimulator [108], depending on cell types [107, 109], dosage, and perhaps even existence or ratio of mPRs/nPRs [110]. Interestingly, MIF works synergistically with high dose PRG to inhibit endometrial cancer cell growth [101] and anticancer properties of MIF are known as an endocrine-related phenomenon [102]. In summary, the previous contradicting data with PRG, MIF, or a combination of both (mPR-specific PRG actions) might all reflect one thing in common, the final cellular effects and outcomes are dependent on cell types, dosage, and existence or ratio of mPRs/nPRs in breast cancer cells.
Our data of mPR-specific PRG actions on two nPR(
Potential prognostic biomarkers for AAW-TNBCs. Biomarkers have been widely used for breast cancer therapies and offer precise treatment based on tumor and patient characteristics by utilizing almost all available current cutting-edge biomedical technologies (genetics, epigenetics, genomics, proteomics, etc.) [112]. Biomarkers can be used as a prognostic tool to predict the future course of the disease and patient response to the designated therapy [113]. The treatment of metastatic breast cancer has become more complicated due to the increasing number of new therapies necessary to treat the elevated number of various histological, molecular, and cellular subgroups. More biomarkers are urgently needed to assist these new therapies, such as the treatment of patients with/without BRCA mutations [114]. The difference among breast cancer subtypes is quite large in terms of clinical relevance, patterns of gene expression, selection of therapeutic strategies, responses to treatment, and prognosis [115, 116, 117, 118, 119]. Therefore, the identification of new biomarkers for specific breast cancer subtypes is important in guiding treatment decisions and predicting prognosis [120].
With our experience in multi-omics and systems biology analysis, we utilized AAW-derived TNBC cells, to discover a total of 47 potential biomarkers synchronously regulated at both the transcriptional and translational levels, associated with tumorigenesis in AAW-derived TNBCs (Suppl. Table 6D). Utilizing publicly available clinical data of expression and prognosis, we filtered these 47 biomarkers down to 6 clinically relevant AAW-TNBC specific biomarkers with differential expression and significant survival curves in multiple TNBC databases (Table 1), resulting in two groups of biomarkers; intrinsic and inducible for AAW-TNBCs (Table 1). Despite previous reports of differentially expressed cellular markers between TNBC subtypes [24, 64, 121, 122], our data show that mPR-specific PRG-induced differential expression patterns among AAW-TNBCs is not overlapped with any previous data and is unrelated to the reported differentially expressed cellular markers in TNBC subtypes, making our newly identified biomarkers great candidates for AAW-TNBC clinical applications. The identified potential AAW-TNBC specific biomarkers (Table 1) will be the first important tool for breast cancer therapy/prevention in AAW-TNBC patients, a pioneering first step to tackle the currently alarming ethnic disparity in breast cancer mortality.
Conclusion
With very limited knowledge, there has been much speculation regarding the relationship between classic PRG actions via nPRs and non-classic PRG actions via mPRs. It has been reported that increased expression of mPRs often leads to activation of nuclear response elements and transcriptional changes, suggesting an integrated model of sex steroid receptor signaling where early steroid-dependent (non-genomic) effects can contribute to late nuclear (genomic) actions [123]. However, this integrated model is only viable in nPR(
Materials and methods
Cell culture, treatments, and performance assays
Cell culture and treatments. Multiple nPR(
Cell migration Assay. Cell migration was assessed using scratch assays. Briefly, a cell scratch was pressed through the confluent TNBC (triple negative breast cancer cells, MB231, MB468) cell monolayer in the plate to mark the starting line. The cells were swept away on one side of that line. Vehicle control (EtOH, DMSO), Mifepristone (MIF, 20
Wound healing assay. MB231, MB468 breast cancer cells were cultured in 24-well plates (5
Cell Invasion assay. The migration of MB231 and MB468 cells were performed using 24-well transwell plates (8
Immunofluorescence (IF) of CAW-/AAW-TNBC cells under mPR-specific PRG actions
Growth of TNBC cells using chamber slides for IF applications: IF staining methods were performed as previously described [15]. Briefly, cells were grown to 80% confluency and then treated with MIF
Staining/mounting/sealing: Slides were treated and stained as previously described [15]. Briefly, slides were blocked with Pierce fast blocking buffer (Fisher) for 2 hours at RT. CCM1-Alexafluor® 488 (1:50), CCM3-Alexafluor® 546 (1:50), and PAQR8 (1:50) antibodies to incubate for 4 hrs at RT in the dark. Secondary antibody was added for PAQR8 stained slides only using mouse anti-rabbit IgG-CFL 555 (1:100). All antibodies used are detailed in Suppl. Table 2. Slides are DAPI stained during the mounting/sealing process (Suppl. Table 2).
Imaging and Quantification: Imaging was performed using a Nikon Eclipse Ti confocal microscope using a 60X objective lens. Quantification was done automatically using Elements Analysis software provided with the Nikon microscope. Thresholding (used for quantification) was defined and maintained throughout all images for each application to ensure no bias was applied to data and to exclude low and high outliers. Using Nikon elements analysis tools, localization of CCM1/CCM3/PAQR8 was performed using binary operations to identify the relative ratio of expressed proteins that localized inside the nucleus (overlaps of DAPI/GFP or mCherry) compared to expressed proteins that localized in the cytosol (unique GFP or mCherry without overlapping DAPI signal). Fluorescent images are quantified for CCM1 using wavelength channel 488 nm while CCM3 and PAQR8 were quantified using wavelength channel 555 nm.
RNA extraction, RT-qPCR, and RNA-seq for TNBC cells
Total RNAs were extracted with TRIZOL reagent (Invitrogen) following the manufacturer’s protocol. For cultured cells, monolayer was rinsed with ice cold PBS. Cells were lysed directly in a culture dish by adding 1 ml of TRIZOL reagent per flask and scraping with a cell scraper. The cell lysate was passed several times through a pipette and vortexed thoroughly. The quality (purity and integrity) of each RNA sample was assessed using a Bioanalyzer (Agilent) before downstream applications. All RNA-seq data were produced using Illumina HiSeq 2000; clean reads for all samples were over 99.5%; 60-80% of reads were mapped to respective reference genomes.
Real Time Quantitative PCR analysis (RT-qPCR). Real-time quantitative PCR (RT-qPCR) assays were designed using primer sets (Suppl. Table 3) and applied to quantify the RNA levels of the endogenously expressed CCMs (1, 2, 3) and mPRs (PAQR5, 6, 7, 8, 9) using Power SYBR Green Master Mix with ViiA 7 Real-Time PCR System (Applied Biosystems). RT-qPCR plates with various cell-lines were prepared using an epMotion 5075 automated liquid handling system (Eppendorf). The RT-qPCR data were analyzed with DataAssist (ABI) and Rest 2009 software (Qiagen). The relative expression level (2-
RNA-seq processing of files to assemble interactomes for TNBC cells: The data consisted of 8 FASTQ files, 2 PE FASTQ files for each of the four groups: 468_Veh, 468_MP treated 12 hrs, 468_MP treated 24 hrs and 468_MP treated 48 hrs. All cohorts consisted of two samples and the RNA-seq files were processed and analyzed as previously described [23]. The identified Differentially expressed Genes (DEGs) were inputted into the PANTHER [126] classification system (GeneONTOLOGY) as well as iDEP [127] (Integrated Differential Expression and Pathway Analysis) program to build signaling networks with altered KEGG pathways, GO cellular components, GO molecular functions and GO biological processes.
Protein extraction, Western blots, and proteomics analysis for TNBC cells
Protein Extraction and quality assessment: TNBC cell lines were harvested and lysed using a digital sonifier cell disruptor (Branson model 450 with model 102C converter and double step microtip) in ice cold lysis buffer containing 50 mM Tris-HCl (pH 7.5), 150 mM NaCl, 0.5% NP-40 (Sigma), 50 mM sodium fluoride (Sigma), 1 mM PMSF (Sigma), 1 mM dithiothreitol (Invitrogen) and 1 EDTA-free complete protease inhibitor tablet (Roche). The concentration of protein lysates was measure by Qubit assay (Invitrogen) before analysis. For proteomics analysis, proteins were prepped using the filter-aided sample preparation (FASP) method (Expedeon, San Diego, CA). Samples were reduced with 10 mM DTT for 30 min at RT and centrifuged on a spin filter at 14,000
Cell fractionation and Western blots. Subcellular fractionation of breast cancer cells was performed as previously described [40]. The relative expression levels of candidate proteins were measured with Western blots (WB) with equal amounts of protein lysates from different treatments or cellular fractionations loaded into Criterion precast gels for SDS-PAGE gel electrophoresis and transferred onto PVDF membranes at 4
Liquid Chromatography-Tandem Mass Spectrometry (LC-MS/MS): The cell lysates were generated from the four cohorts, 468_Veh, 468_MP treated 12 hrs, 468_MP treated 24 hrs and 468_MP treated 72 hrs. All cohorts consisted of three replicates and were processed and analyzed as previously described [23]. Proteomic samples were analyzed via two statistical methods, Students
Omics analysis to assemble interactomes for TNBC cells at both the transcriptional and translational levels. A Python script was created to identify shared differentially expressed genes/proteins between cohorts. The overlaps were inputted into the PANTHER [126] classification system (GeneONTOLOGY) as well as iDEP [127] as previously aforementioned. Identified overlaps were compared between proteomics and RNA-seq data. The agreements in differential expression were noted using the Python comparison script.
Meta-analysis of CHIP-seq data overlaps with AAW-TNBC cells under mPR-specific PRG actions. Four databases were used [128], from various breast cancer cells (containing AAW-TNBCs) treated with either PRG/MIF. Additionally, 11 publicly available breast cancer datasets [60, 61, 62, 63, 64, 65, 66, 67, 68, 69, 70, 71] as well as two TCGA-BRCA databases (TCGA-BRCA and GDC-TCGA-BRCA) were compiled to validate differential expression among breast cancer subtypes for key CmP members as well as our Identified candidate biomarkers. Proteomic and RNA matching to the curated datasets was carried out using general python scripts. Gene names were used as identifiers when processing overlaps between RNA and Proteomic Analysis. Expression patterns of up or down regulation were integrated to determine transcriptional and proteomic relationships.
Prognostic effects for identified candidate biomarkers associated with a perturbed CmP signaling network
Differential expression of candidate biomarkers and key CmP members using Microarray expression data. Expression analysis was performed as previously described [15]. Briefly, microarray data containing breast cancer tumors, with nPR status determined by IHC, were analyzed using kmplot software [24]. This resulted in 925 nPR(
Differential expression of candidate biomarkers using RNA-seq data for AAW- and CAW-TNBCs. To preliminarily evaluate basal expression of our identified candidate biomarkers in AAW- and CAW- TNBCs, we utilized publicly available RNA-seq data comparing expression levels in 23 AAW- and 19 CAW-TNBC samples that were used as filter 1 to obtain expression data for the candidate biomarkers identified in this study [72]. Next, we utilized a larger cohort of AAW and CAW TNBCs with any biomarkers that passed filter 1, to evaluate basal expression from TCGA which contained 64 AAW- and 113 CAW-TNBC samples [69].
Construction of Kaplan-Meier (KM) survival curves for identified biomarkers. KM survival curves were generated as previously described [24]. Additionally, publicly available microarray data was also assessed from TCGA to integrate gene expression and clinical data simultaneously [69] to confirm the initial analysis performed using kmplot. To ensure the patients in the database reflected cohorts seen in the everyday clinical practice, we only selected cohort data similar to SEER published prevalence’s [24]. Breast cancer patients were filtered to only analyze patient samples classified as TNBC (BASAL) subtype, which reduced our initial 1,809 patients to 176/392 patient samples (depending on biomarker analyzed). Logrank
Statistical analysis
For RT-qPCR analysis, the relative RNA expression changes of CmP network genes were measured by qPCR (Fold changes). All pairwise multiple comparison procedures were analyzed using Tukey and Student’s
Author contributions
JZ: Conceptualization, Methodology, Investigation, Writing-Original draft preparation, Writing-Reviewing and Editing; JAF: Investigation, Visualization, Software, Data curation, Validation, Writing-Reviewing and Editing, XTJ: Investigation, Visualization; BG: Software, Data curation, Validation; AP: Investigation, Writing-Original draft preparation; CCE: Data curation, Validation; EF and AMDCDLO: Investigation, Visualization.
Funding
1R21NS061191 (NINDS/NIH) and the Coldwell foundation (JZ).
Supplementary data
The supplementary files are available to download from http://dx.doi.org/10.3233/CBM-210351.
sj-pdf-1-cbm-10.3233_CBM-210351.pdf - Supplemental material
Supplemental material, sj-pdf-1-cbm-10.3233_CBM-210351.pdf
sj-xlsx-1-cbm-10.3233_CBM-210351.xlsx - Supplemental material
Supplemental material, sj-xlsx-1-cbm-10.3233_CBM-210351.xlsx
sj-xlsx-2-cbm-10.3233_CBM-210351.xlsx - Supplemental material
Supplemental material, sj-xlsx-2-cbm-10.3233_CBM-210351.xlsx
sj-xlsx-3-cbm-10.3233_CBM-210351.xlsx - Supplemental material
Supplemental material, sj-xlsx-3-cbm-10.3233_CBM-210351.xlsx
sj-xlsx-4-cbm-10.3233_CBM-210351.xlsx - Supplemental material
Supplemental material, sj-xlsx-4-cbm-10.3233_CBM-210351.xlsx
sj-xlsx-5-cbm-10.3233_CBM-210351.xlsx - Supplemental material
Supplemental material, sj-xlsx-5-cbm-10.3233_CBM-210351.xlsx
sj-xlsx-6-cbm-10.3233_CBM-210351.xlsx - Supplemental material
Supplemental material, sj-xlsx-6-cbm-10.3233_CBM-210351.xlsx
sj-xlsx-7-cbm-10.3233_CBM-210351.xlsx - Supplemental material
Supplemental material, sj-xlsx-7-cbm-10.3233_CBM-210351.xlsx
sj-xlsx-8-cbm-10.3233_CBM-210351.xlsx - Supplemental material
Supplemental material, sj-xlsx-8-cbm-10.3233_CBM-210351.xlsx
sj-xlsx-9-cbm-10.3233_CBM-210351.xlsx - Supplemental material
Supplemental material, sj-xlsx-9-cbm-10.3233_CBM-210351.xlsx
Footnotes
Acknowledgments
We wish to thank Kamran Falahati, Mark Smith, Khalid Shoukat, Deepak Muthyala, Mike Yao, Yanchun Qu, Shen Sheng, Ahmed Badr, Junli Zhang, Amna Siddiqui, Pallavi Dubey, Saafan Malik, and Edna Lopez at Texas Tech University Health Science Center El Paso (TTUHSCEP) for their technical help during the experiments. The results shown here are in part based upon data generated by the TCGA Research Network: https://www.cancer.gov/tcga.
Conflict of interest
The authors declare that no competing interests exist.