Somatic variations in rearranged during transfection (RET) proto-oncogene acts to influence Thyroid cancer (TC) in a low penetrance manner, but their effects tend to vary between different populations.
OBJECTIVE:
This case-control study was aimed to evaluate effect of RET G691S, S904S and L769L single nucleotide polymorphisms (SNPs) on the risk for differentiated thyroid carcinoma (DTC).
METHODS:
A total of 180 patients and 220 controls were genotyped by Polymerase chain reaction – restriction fragment length polymorphism (PCR-RFLP). Di-Deoxy Sanger sequencing was performed on 100 samples with variations and 20 wild samples for each amplified exon. In addition, In Silico tools were used to evaluate structural and functional impact of individual SNPs in disease progression.
RESULTS:
In RET G691S/L769L/S904S SNPs, frequency of variant genotypes in DTC cases was 61.1%, 54.4% and 76.6% as compared to 45.9%, 43.6% and 89.09% in controls respectively ( 0.05). In Silico analysis revealed that different protein formed due to G691S substitution decreases the stability of 3D structure of protein. The RET G691S and L769L SNP followed “Dominant” but RET S904S SNP confirmed an “Additive” mode of inheritance.
CONCLUSION:
RET G691S/L769L/S904S SNPs are significantly associated with DTC with G691S SNP declining the stability of final protein product.
Thyroid cancer is the most common malignancy of endocrine system. Majority of endocrine carcinoma deaths are associated with this cancer type, representing 3–4% of all cancers [1]. Though TC is relatively curable, the incidence rate has increased during the past few decades with higher prevalence in females as compared to males [2, 3, 4, 5]. The rising trend is commonly attributed to DTC which includes Papillary thyroid carcinoma (PTC), Follicular thyroid carcinoma (FTC) and Hurthle cell carcinoma (HCC), accounting for 80%, 15% and 5% of DTC cases respectively [2, 3, 4]. PTC and FTC generally have good prognosis, especially, if diagnosed earlier. The probable environmental risk factors are physical influences such as lifestyle, uptake of abnormal iodine, chemical pollutants, unnecessary neck scans and exposure to ionizing radiations [5, 6, 7]. Various low to moderately penetrant genes have been characterized with the pathogenesis of TC.
The human rearranged during transfection (RET) proto-oncogene is positioned in chromosome 10q11.2. The gene encodes transmembrane receptor kinase (TRK) family of proteins that are associated with different diseases, especially cancer [12, 13, 14, 15]. Gain-of-function mutations in RET proto-oncogene results in aberrant activation of RET gene, involved in human carcinomas [8]. Loss-of-function mutation in RET is accountable for genetic disorder known as Hirschsprung disease [9], while as, germ line point mutations in RET gene are responsible for the occurrence of Medullary thyroid carcinoma (MTC) [9, 10]. Furthermore, somatic mutations in RET are present in sporadic MTC and rearrangements in RET/PTC are found in early childhood PTC [11, 12].
Several SNPs are present in RET gene but G691S, L767L and S904S present in exon 11, 13 and 15 respectively are extensively studied because these are located in exons where MTC associated germline mutations are concentrated [6]. These polymorphisms are recurrently associated with the increase risk of MTC and represented as low penetrant genetic modifiers [13]. Several studies have reported association of RET Polymorphic haplotypes with the risk of DTC [14, 15, 16].
Therefore, in current study we have comprehensively investigated the role of G691S, L767L and S904S SNPs in DTC risk and association of genotypes with socio-demographic and clinicopathological risk factors of DTC.
Materials and methods
Study design
This was a case-control study conducted by the Department of Biochemistry, Pakistan Institute of Medical Sciences (PIMS), Islamabad and Central Military Hospital (CMH) Muzaffarabad, Pakistan. A written informed consent was obtained from each study subject. The study was approved by Ethical Review Board (ERB) of PIMS. Written informed consent was taken from all patients involved in the study procedure and allowed the use of their blood samples.
Study participants
The study was conducted on 180 histologically confirmed DTC patients attending Department of General Surgery, PIMS and CMH, Muzaffarabad Pakistan. The patients having any other type of cancer, genetic disorder and having received chemotherapy were excluded from the study. Controls ( 220) were randomly selected from a pool of healthy volunteers who visited the hospital for health check-up during the same period and enrolled in the study.
Sample collection and DNA extraction
Around 3 ml of blood was collected in EDTA coated vials from DTC patients and were stored at 80C until further processing. DNA was isolated from the DTC patients and healthy controls using DNA extraction kit (Invitrogen; Thermo Fisher Scientific, Inc., USA). The quality, purity and concentration of DNA was measured using Qubit 4.0 fluorometer (ThermoFischer Scientific, USA). In particular, purity of DNA was assessed by measuring optical density at A260/A280. Quality threshold used was; A260/A280 1.7. Further quality of DNA was checked through agarose gel electrophoresis which gives the information weather the isolated DNA is intact or sheared.
Polymerase chain reaction (PCR)
Exon 11, 13 and 15 of RET gene were amplified using optimized PCR conditions and PCR primer sequences with considerable modifications, as described previously [17]. 50 l reaction mixture containing 50–100 ng genomic DNA; 1X PCR buffer (2 mM MgCl) (Biotools, B&M Labs, S.A. Madrid, Spain); 200 M dNTPs (Biotools, B&M Labs, S.A. Madrid, Spain); 1.5 Units of Taq polymerase (Thermo Fischer Scientific, USA); 0.25 M of forward and reverse primers (Eurofins Genomics, Germany) was setup for the amplification of respective exons resulting in the formation of 454 bp (exon 11 fragment), 460 bp (exon 13 fragment) and 332 bp (exon 15 fragment) amplicons.
Restriction fragment length polymorphism
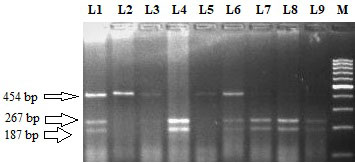
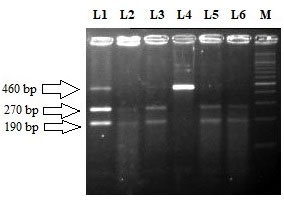
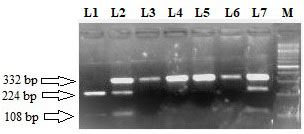
Amplification fragments of exon 11, 13 and 15 were subjected to restriction digestion with BanI, TaqI and RsaI (Thermo Fischer Scientific, USA) for elucidation of genotypes for respective SNPs. G691S SNP (G2071A) was analysed by digesting the PCR product with BanI, resulting in the formation of 267 and 187 bp fragments (wild homozygote; GG), uncut 454 bp fragment (variant homozygote; AA), 454 bp, 267 bp and 187 bp fragments (heterozygous genotype; GA). 10 l of Digested DNA fragments were subjected to electrophoresis on a 2.0% agarose gel for resolution and then analysed under the UV illuminator. In case of L769L SNP (T2307G), the wild homozygous type (TT) gets digested with TaqI and characterized by 270 bp and 190 bp fragments, while variant homozygote (GG) is represented by an uncut 460 bp fragment and heterozygote form (TG) presented 460 bp, 270 bp and 190 bp fragments. 10 l of digested products were loaded into 2.0% agarose gel and then analysed under the UV illuminator. In case of S904S SNP (C2712G), PCR product was digested with RsaI restriction enzyme, resulting in one uncut fragment of 332 bp representing wild type (CC), variant homozygote (GG) characterized by 224 bp and 108 bp fragments while as heterozygote (CG) displaying 332 bp, 224 bp and 108 bp fragments. 10 l of digested products were loaded into 3.0% agarose gel and then analysed under the UV illuminator. Ethidium bromide was used as a nucleic acid stain in agarose gels which intercalates between the bases of DNA giving fluorescence with an orange colour, when exposed to ultraviolet light.
DNA sequencing
In order to re-confirm the PCR-RFLP results for G691S, L767L and S904S SNPs, a total of hundred ( 100) DNA samples showing variations and twenty ( 20) wild samples pertaining to each amplified exon were subjected to DNA sequencing based on the chain termination reaction, using the automated DNA sequencer ABI prism 310 (ThermoFisher Scientific, USA).
Dataset collection and computational prediction tools for functional impact of SNPs
A dataset of RET SNPs (G691S/L769L/S904S) was collected from NCBI database of SNPs (dbSNP) [18] for structural and functional analysis. In addition, protein sequence of RET (P07949) was retrieved from UniProt database [19]. Insilico methods of high accuracy were used for investigating the biological hypothesis. SNAP2 [20] and SNPnexus [21] were used to predict functional context of SNPs using data from external independent databases such as SIFT (Sorting Intolerant from Tolerant) [22] and Polyphen(Polymorphism Phenotyping) [23]. Score 0.05 was considered as damaging whereas score greater than 0.05 has been characterized as tolerant. On the other hand, Polyphen predicts the potential effect of amino acid substitution upon the structure and function of protein based on evolutionary and physical comparative considerations [24].
MU protein (mutant protein) online vector machine based server was used to predict protein stability of protein on single site amino acid mutation [25]. Furthermore, ModPred software [26] was used to predict post transcriptional modifications (PTM) in target protein sequences. HOPE is an automatic mutant analysis server used to determine structural effects of a mutation by calculating 3D coordinate information from wide range of web services including YASARA, WHAT IF software, UniProt database and DAS server [27].
Statistical analysis
Independent and paired -tests were performed for continuous variables while as fisher’s exact test or tests were applied on discrete variables [28]. Hardy-Weinberg equilibrium was performed using goodness of fit test, to compare statistical significant difference of allele frequency and genotype distribution between cases and controls [29]. Statistical difference in allele, genotype and haplotype frequencies between cases (DTC) and controls were compared by pearson- test and odds ratios (ORs) with 95% confidence intervals (CIs) using logistic regression analysis. Degree of association between genotypes and associated risk factors were obtained using ORs, CIs and -value. -value 0.05 was considered as statistically significant. All statistical tests were performed using SPSS 20.0 software [30, 31] (SPSS Inc., Chicago, Illinois, USA) and power of the study was calculated using G-Power (version 16.0) [32, 33]. Haplotype analyses was conducted by using HapMap software. Akaike information (AIC) was used to estimate the relevance of each genetic model and haplotype [34].
Socio-demographic and clinicopathological parameters of DTC cases and controls
The socio-demographic and clinicopathological parameters of DTC cases ( 180) and controls ( 220) are given in Table 1. The cases and controls were matched with respect to age, gender, dwelling and smoking status ( 0.05). The mean age (in years) of cases and controls was 47.4 13 and 46.1 15.8 respectively ( 0.05). In this study, females were more affected than males (62.3% vs. 37.7%) and people of rural areas were more predisposed to DTC than those living in urban areas (66.6% vs. 33.4%). Benign thyroid disease (BTD) was found in 58.3% of DTC patients (35.7%; multinodular goitre, 12.6%; thyroiditis and 10%; thyroid adenomas). 83.9% of enrolled patients were having PTC and 16.1% were having FTC (Table 1).
Restriction fragment length polymorphism pattern of RET G691S (G2071A) using BanI restriction enzyme. Lane M: 100 bp ladder. Lane 4 and 9 represent the homozygous wild (G/G) genotype (size 267 bp 187 bp). Lane 2, 3 and 5 represent homozygous variant (A/A) genotype (size 454 bp). Lane 1, 6, 7 and 8 represent G/A heterozygous genotype (size 454,267 and 187 bp).
Restriction fragment length polymorphism pattern of RET L769L (T2307G) using TaqI restriction enzyme. Lane M: 100 bp ladder. Lane 2, 3, 5 and 6 represent the homozygous wild (T/T) genotype (size270 bp 190 bp). Lane 4 represent homozygous variant (G/G) genotype (size 460 bp). Lane 1 represent T/G heterozygous genotype (size 460, 270 and 190 bp).
Restriction fragment length polymorphism pattern of RET S904S (C2712G) using RsaI restriction enzyme. Lane M: 100 bp ladder. Lane 3, 4, 5 and 6 represent the homozygous wild (C/C) genotype (size 332 bp). Lane 1 represent homozygous variant (G/G) genotype (size 224 bp 108 bp). Lane 2 and 7 represent C/G heterozygous genotype (size 332, 224 and 108 bp).
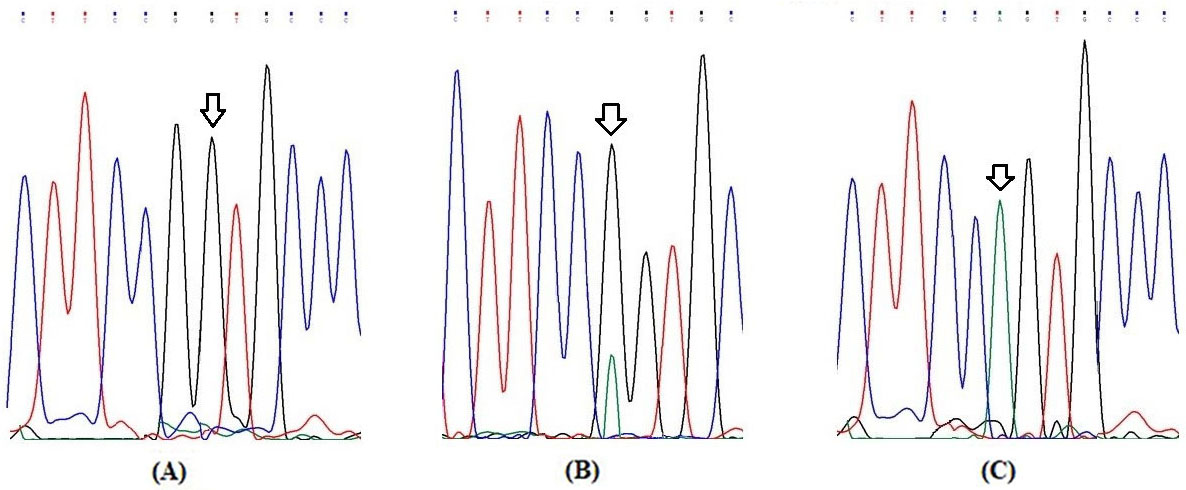
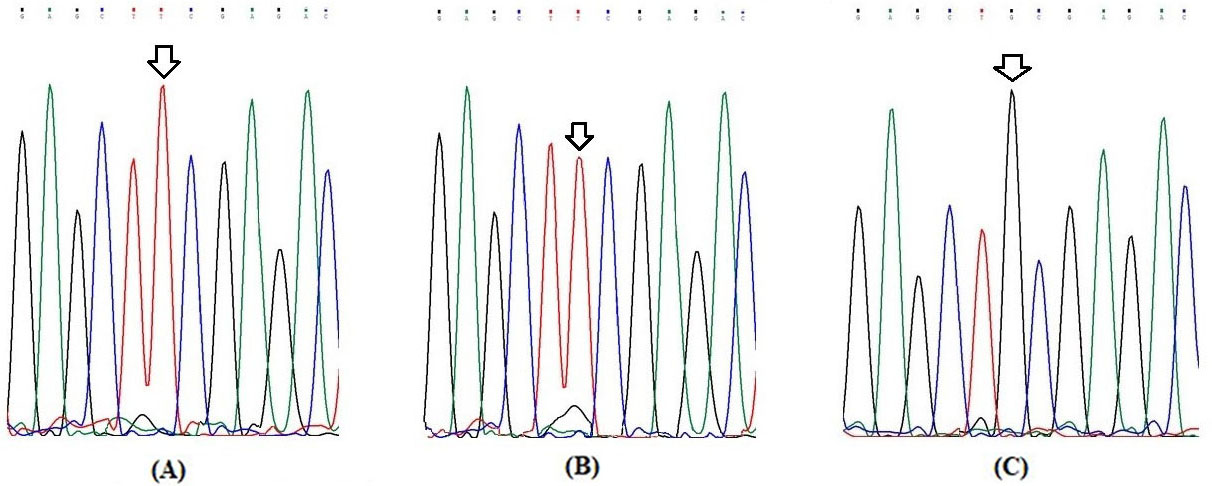
Partial electrophoretograms of Exon 11 fragment of RET gene for elucidation of G691S (G2071A) genotypes (A) Arrow shows homozygous wild (G/G) genotype at nucleotide position 2071 (B) Arrow shows heterozygous (G/A) genotype at nucleotide position 2071 and (C) Arrow shows homozygous variant (A/A) genotype at nucleotide position 2071.
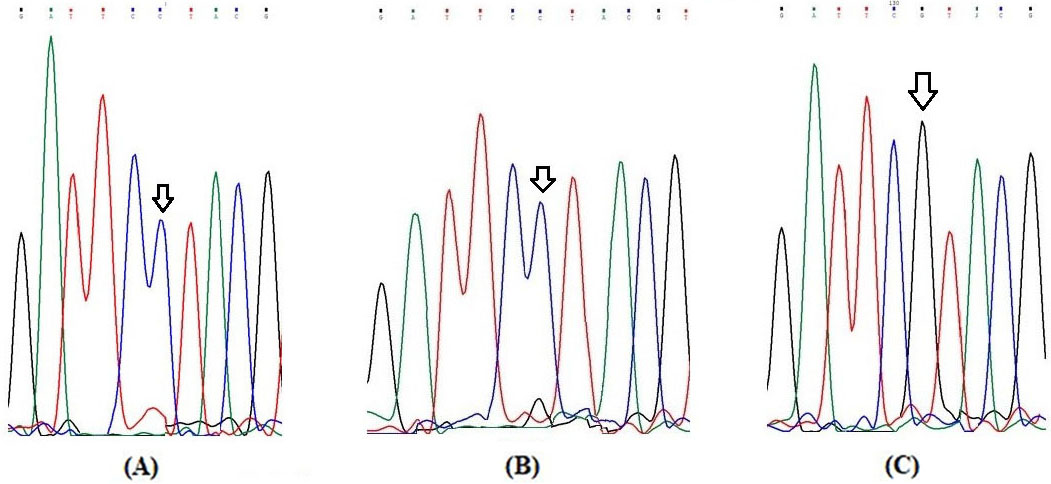
Partial electrophoretograms of Exon 13 fragment of RET gene for elucidation of L769L (T2307G) genotypes (A) Arrow shows homozygous wild (T/T) genotype at nucleotide position 2307 (B) Arrow shows heterozygous (T/G) genotype at nucleotide position 2307 and (C) Arrow shows homozygous variant (G/G) genotype at nucleotide position 2307.
Genotypic and allelic frequency of DTC cases and controls in respective SNPs
Genotype/ allele
Cases ( 180)
Controls ( 220)
OR (95%CI)
value
G691S (G2071A)
Genotype
GG
69 (38.3)
119 (54.1)
1.0 (Ref)
GA
81 (45.0)
77 (35.0)
1.8 (1.18–2.8)
0.006
AA
30 (16.7)
24 (10.9)
2.1 (1.17–3.98)
0.01
GA AA
111 (61.7)
101 (45.9)
1.9 (1.2–2.8)
0.001
Allele type
219 (60.8)
315 (71.5)
1.0 (Ref)
141 (39.1)
125 (28.5)
1.6 (1.20–2.2)
0.0008
L769L (T2307G)
Genotype
TT
52 (28.8)
24 (10.9)
1.0 (Ref)
TG
90 (50.0)
134 (60.9)
0.3 (0.2–0.5)
0.00001
GG
38 (21.2)
62 (28.2)
0.28 (0.15–0.53)
0.00005
TG GG
128 (71.1)
196 (89.0)
0.3 (0.1–0.5)
0.000004
Allele type
194 (53.8)
182 (41.4)
1.0 (Ref)
166 (46.1)
258 (58.6)
0.6 (0.4–0.8)
0.0002
S904S (C2712G)
Genotype
CC
79 (43.8)
124 (56.4)
1.0 (Ref)
CG
83 (46.1)
84 (38.2)
1.5 (1.02–2.3)
0.02
GG
18 (10.1)
12 (5.4)
2.3 (1.07–5.15)
0.03
CG GG
101 (56.2)
96 (43.6)
1.6 (1.1–2.4)
0.01
Allele type
241 (66.9)
332 (75.5)
1.0 (Ref)
119 (33.05)
108 (24.5)
1.5 (1.1–2.06)
0.005
Partial electrophoretograms of Exon 13 fragment of RET gene for elucidation of S904S (C2712G) genotype (A) Arrow shows homozygous wild (C/C) genotype at nucleotide position 2712 (B) Arrow shows heterozygous (C/G) genotype at nucleotide position 2712 and (C) Arrow shows homozygous variant (G/G) genotype at nucleotide position 2712.
Elucidation of RET genotypes and alleles
The representative pictures of restriction fragment pattern for RETG691S, L767L and S904S SNPs are shown in Figs 1–3 respectively. The Figs 4–6 show partial electropherograms pertaining to homozygous wild, heterozygous and homozygous variant genotypes of RET G691S, L767L and S904S SNPs respectively. Genotype and allele distributions of RET polymorphisms in DTC cases and controls are summarized in Table 2. The three SNPs have significant differences in genotype and allele frequencies between cases and controls. In case of G691S SNP, frequency of variant genotype (GA AA) in cases was greater as compared to controls (61.6% vs. 45.9%; OR 1.9; 0.001). In case of L769L SNP, overall variant genotype distribution (TG GG) was lower in cases as compared to control group (71.1% vs. 89.0%; OR 0.3; 0.000004). In case of S904S SNP, distribution of variant genotype (CG GG) was higher in cases against controls (56.2% vs. 43.6%; OR 1.6, 0.01) (Table 2).
Analysis of genotype frequencies of SNPs associated with clinicopathological factors
Stratification analysis of RET polymorphisms and risk of DTC
We stratified all three SNPs with respect to various socio-demographic and clinicopathological parameters of DTC cases and controls. Table 3 summarizes the parameters who were found to be significantly associated with variant genotype of studied RET SNPs. In case of G691S SNP, frequency of variant genotypes (GA AA; 64.1%) was significantly higher in young patients ( 55 years) than controls (46.2%) of same age group ( 0.02). There was a significant high distribution of variant genotypes (GA AA; 60.7%) in female cases in contrast to female healthy controls (45.1%) ( 0.01). Similarly non-smoker cases and cases living in rural areas had significantly higher frequency of combined GA and AA variant genotypes as compared to smoker controls ( 0.00001) and controls living in rural areas ( 0.001) respectively (Table 3).
Insilico analysis of RET SNPs
Variation ID
Ch; location
NT change
AA position
SIFT
Polyphen
ClinVar
Score
Prediction
Score
Prediction
Clinical significance
Phenotype
rs1799939 (G691S)
10; 436114671
G/A
691
0.940
Tolerated
0.015
Benign
Conflicting interpretation of pathogenecity
MTC, MEN2A, PTC, Hirschsprung disease
rs1800861 (L769L)
10; 43118395
T G
769
n/a
–
n/a
–
–
–
rs1800863 (S904S)
10: 43120185
C G
904
n/a
–
n/a
–
–
–
Applicable inheritance models for RET SNPs
SNP
Genotypes
DTC cases
Controls
OR (95%CI)
value
(Patients vs controls)
( 140)
( 180)
(Dominant model)
G2071A
GG
69 (38.3)
119 (54.1)
1.9 (1.27–2.8)
0.001
(G691S)
GA AA
111 (61.6)
101 (45.9)
(Dominant model)
T2307G
TT
52 (28.8)
24 (10.9)
0.3 (0.2–0.5)
0.0001
(L769L)
TG GG
128 (71.1)
196 (89.1)
(Additive model)
C2712G
CC
79 (43.8)
124 (68.8)
2.3 (1.1–5.1)
0.03
(S904S)
GG
18 (10.1)
12 (5.4)
In case of L769L SNP, significant low frequency of variant genotype (TG GG) was found in cases with 55 years of age ( 0.001), female gender ( 0.0001), rural dwelling ( 0.001) and non-smokers ( 0.00001) as compared to their respective controls (Table 3).
In case of S904S SNP, frequency of combined CG and GG variant genotype was significantly high in cases having 55 years of age as compared to respective controls (56.4% vs. 44.3%; 0.04). Similarly, variant genotype (CG GG) distribution was high in patients having female gender than controls of same gender (61.6% vs. 45.9%; 0.045). Also, DTC patients of rural areas had higher frequency variant allele (CG GG) frequency than control group (56.6% vs. 43.5%; 0.04). Additionally, patients who never smoked were found to have high frequency of variant genotype as compared to controls (58.8% vs. 53.7%; 0.01). No statistical significant association was found between other clinical risk factors and genotype of all three SNPs.
In silico analysis of RET SNPs
Table 4 depicts the In Silico results for RET SNPs. Through In Silico analysis functional impact of non-synonymous variant G691S was analysed using different tools. In SNPnexus software, REACTOME database predicted G691S polymorphism as significantly associated with RET signalling, RAF/MAP kinase cascade and MAPK1/MAPK3 signalling pathway. While cancer genome interpreter predict that RET (RET_TPCN1), a biomarker of G691S act as a target against cabozantinib, vandetanib, Sunitinib and RET inhibitors (Pan-TK inhibitor/Pan-kinase inhibitor). MuPro determined that G691S polymorphism decreases the stability of protein by 0.825 and 1.14 kcal/mol respectively [35]. Additionally, ModPred showed G691S polymorphism influence low level of proteolytic cleavage in protein sequence. According to HOPE project no protein structure with G691S polymorphism was found in database, because SNP is located in loop region [27]. In the G691S polymorphism, the size of polymorphic amino acid increases whereas charge, polarity and hydrophobicity of 3D structure remain unchanged. Glycine, the only residue has the ability to maintain the torsion angles of 3D structure. When G was substituted with S, disruption of torsion angles could result in the conformational change and hence disturbed 3D structure of protein. Polymorphic residue has been found among homologous sequences as well, but probably not damaging to proteins. We found that synonymous L769L and S904S variations have no direct effect on protein structure and function.
Genetic association study and inheritance models
Different models of inheritance were found appropriate to RETG691S, L769L and S904S polymorphism. Dominant model of inheritance was found suitable for the inheritance of RET G691S and L769L polymorphism while as Additive model of inheritance was appropriate for RET S904S polymorphism (Table 5).
Haplotype frequencies estimation and haplotype association with disease (adjusted by gender age smoking status dwelling)
G2071A
T2307G
C2712G
Total frequency
Cases
Controls
OR (95% CI)
value
G
T
C
0.5986
0.5820
0.6152
Ref. (1.00)
–
G
G
C
0.3200
0.2880
0.3252
1.38 (0.22–0.67)
0.2
G
T
G
0.2016
0.1896
0.2136
1.1 (0.22–0.61)
0.002
A
T
C
0.0843
0.0555
0.1131
1.69 (0.84–3.38)
0.14
A
G
C
0.0572
0.0695
0.0449
1.23 (0.07–0.69)
0.0094
A
T
G
0.0459
0.0220
0.0698
9.03 (2.14–38.13)
0.003
Global haplotype association. value: 0.0001. Haplotypes having 1% frequency were considered rare and excluded. All haplotypes were included in the same model and the OR (95%CI) of DTC associated with each haplotype estimated by comparison with the common reference haplotype. ref: reference group.
Haplotype frequencies estimation and its association with disease
Haplotype analysis was conducted to assess the combined effect of the RET G691S, L769L and S904S polymorphisms on DTC risk. Both the cases and controls had haplotypes frequencies of 5%. G T C was the most common haplotype, having frequencies of 58.2% and 61.5% in cases and controls respectively. There was a marked difference between overall distribution of G T G, A G C and A T G haplotype in cases vs. controls ( 0.0001). Haplotype frequencies were adjusted by gender, age, smoking status and dwelling. Table 6 reveals the haplotype pattern for three SNPs among patients and controls.
Discussion
In addition to environmental and lifestyle factors, certain SNPs in RET gene influence TC in complex, polygenic and low penetrance manner. RET polymorphisms have strong correlation with disease phenotypes and its incidence was detected upto 60% of sporadic PTC [36]. Up to this time, only limited number of studies analysed RET SNPs in DTC that too with conflicting results. We have firstly conducted this case-control study to find out the frequency of RET genotypes; isolated and synergistic effect of RET variants on socio-demographic and clinicopathological risk factor of DTC patients and controls of Pakistan.
In case of RET G691S SNP, the overall frequency of variant genotype (GA AA) was significantly more frequent in cases as compared to controls (61.7% vs. 45.9%; 0.001). The confidence on results has been augmented when earlier studies from different population were in line with genotype and allele frequencies found in this study [15]. Similarly, the study conducted by Huang et al. indicated the influence of RET G691S variant genotype (AA) in the predisposition of DTC [37]. Our study was contradictory to previous reports in which RET G691S genotype frequency was same in both cases and controls [38]. Furthermore, in our study, RET G691S variant genotypes (GA AA) were found to be significantly associated with DTC patients of 55 years of age, females, rural dwellers and patients with no history of smoking. Khan and his co-workers observed that variant genotypes (GA AA) were significantly associated with females and patients without smoking history [15]. Interestingly some previous studies have proposed that cigarette smoking might lower TSH (thyroid stimulating hormone) levels, thus preventing thyroid carcinogenesis [39]. In contrary, there are some studies which have not supported the influence of smoking on TSH levels [40]. For further classification, high distribution of variant alleles (GA AA) was found in patients of age 55 years as equated to healthy controls which is in contrast to the study of Mudassar et al. [41], in which RETG691S polymorphism was not associated with patients of lower age group ( 55 years). Furthermore, RET G691S polymorphism was associated with patients dwelling in rural areas as compared to respective healthy controls, which is in discordance with earlier studies [15].
In case of RET L769L SNP, we observed a significantly higher frequency of variant genotypes (TG GG) in DTC cases compared to controls (71.0% vs. 89.0%; 0.000004) indicating a protective role of RET L769L SNP in predisposition to DTC. Our study corresponds to the previous reported studies of different ethnic groups such as from European/Australian and North American population which reported association of RET L769L polymorphism with TC [42, 43]. Our results indicate that variant genotypes in L769L SNP were associated with non-smokers which was in agreement with a previous study on DTC [41]. For further stratification in groups, our study found low frequency of variant alleles (TG GG) in patients of age 55 years, females and dwelling in rural areas as compared to healthy controls which is in line with the study performed on a different ethnic group (North Indian population) [15].
In the case of RET S904S SNP, we observed over representation of variant genotype (CG GG) in DTC with significant difference between DTC cases and controls (56.2% vs. 43.6%; 0.01). This study was supported by a recent study in which polymorphic allele (G) was more frequent in cases as compared to controls [41], but in contrast to a previous study which reported low frequency of polymorphic allele (G) in cases as compared to controls [16]. Our study was in contradiction to the study by Santos et al. wherein they have found no difference in the distribution of genotype and allele frequency between cases and controls [17]. Furthermore, variant genotype was significantly more frequent in DTC patients having female gender and lower age group ( 55 years). Santos et al. reported no significant difference of variant genotypes (CG GG) between cases and controls with respect to gender and age [17]. Khan et al. reported that DTC patients with male gender and higher age group ( 45 years) were more susceptible to DTC risk [35, 15]. Furthermore, overrepresentation of variant genotype (CG GG) was observed in patients with no smoking status and living in rural areas as compared to matched healthy controls. Khan et al. also observed high frequency of S904S SNP in patients with no smoking history but did not find any association of this SNP with patient’s residence [15].
RET G691S SNP involves a change of glycine to serine and has understated effects on its function. RET G691S alter the 3D structure by disrupting torsion angles and flexibility of protein. The new polymorphic protein decreases the stability of 3D structure, and drug resistance occurs due to sub-localization of tyrosine kinase receptor. This is in coherence with previously reported studies [44]. RET L769L and S904S SNPS are synonymous/silent. Although not clearly understood, the silent polymorphisms in the RET gene may affect the development and progression of DTC by effecting the RNA stability thereby indirectly effecting the final protein synthesis [15]. In addition, the fact that RET L769L and S904S SNPs are present in linkage disequilibrium with other unknown functional SNPs, cannot be ignored [45] suggested that these silent polymorphisms have a non-neutral effect on RET function thus playing a key role in thyroid carcinogenesis.
This study evaluated association of multiple RET risk alleles in DTC development and aggressiveness, indicating dominant and additive effect of different RET polymorphisms in the pathogenesis of DTC. We considered Genomic association studies (GAS) with significant association only. In RET G691S SNP, heterozygous genotype (GA) lies towards homozygous mutant genotype (AA) conferring the deleterious role to AA genotype. In case of RET L769L SNP, heterozygous genotype (TG) lies towards homozygous mutant genotype (GG) conferring the deleterious role to GG genotype [46, 47]. In both G691S and L769L SNPs, single allele seems to modulate the disease susceptibility thus following “Dominant mode of inheritance” [46]. The findings were in line with previous studies [44]. In case of RET S904S SNP, the heterozygote (CG) lies in the middle of the two homozygotes, with homozygous variant (GG) genotype having the maximum susceptibility of being diseased and homozygous wild (CC) having the least thus supporting non-dominance (i.e., perfect additivity) [47]. Furthermore additive model selected for RET S904S was supported by a study of Khan et al. [15]. Our results showed that G T G, A G C and A T G haplotypes are associated with an increased risk of DTC. These haplotype includes variant alleles of G691S and S904S SNP that are associated with the increased risk of DTC in the single locus analysis. The variant alleles of RET L769L seem to have protective role towards thyroid carcinogenesis. The two minor alleles in combination may amplify the influence of single SNPs and may produce a synergistic effect, the phenomenon shown in other tumors [48]. Therefore, S904S/G691S in combination may amplify the risk of aggressiveness of the disease which is in line with the study of Santos et al. [17] and Khan et al. [15].
Conclusion
In conclusion, current data suggests that the RET G691S and S904S SNPs significantly increase the risk of DTC while as RET L769L SNP has a protective role towards predisposition to DTC. Specific haplotypes of RET such as G T G, A G C and A T G are risk factors for DTC. Furthermore, these haplotypes are over represented, and may act as low penetrant alleles in the predisposition of disease. In future, more studies with large sample size are required to authenticate the role of RET polymorphisms in DTC.
Footnotes
Conflict of interest
The authors report no conflict of interest.
References
1.
BrayF. et al., Global cancer statistics 2018: GLOBOCAN estimates of incidence and mortality worldwide for 36 cancers in 185 countries, CA: A Cancer Journal for Clinicians68 (2018), 394–424.
2.
FaamB. et al., Epigenetic modifications in human thyroid cancer, Biomedical Reports3 (2015), 3–8.
3.
HanM.A.KimJ.H. and SongH.S., Persistent organic pollutants, pesticides, and the risk of thyroid cancer: Systematic review and meta-analysis, European Journal of Cancer Prevention28 (2019), 344–349.
4.
LusterM. et al., European perspective on 2015 American Thyroid Association management guidelines for adult patients with thyroid nodules and differentiated thyroid cancer: Proceedings of an interactive international symposium, Thyroid29 (2019), 7–26.
5.
FerrariS.M. et al., Environmental issues in thyroid diseases, Frontiers in Endocrinology8 (2017), 50.
6.
WellsS.A. et al., Multiple endocrine neoplasia type 2 and familial medullary thyroid carcinoma: An update, The Journal of Clinical Endocrinology & Metabolism98 (2013), 3149–3164.
7.
OscanoaJ. et al., SNPnexus: A web server for functional annotation of human genome sequence variation (2020 update), Nucleic Acids Research48 (2020), W185–W192.
8.
WellsS.A., Advances in the management of MEN2: From improved surgical and medical treatment to novel kinase inhibitors, Endocr Relat Cancer25 (2018), T1–T13.
9.
GuiH. et al., Whole exome sequencing coupled with unbiased functional analysis reveals new Hirschsprung disease genes, Genome Biol18 (2017), 48.
10.
MathiesenJ.S. et al., Variability in medullary thyroid carcinoma in RET L790F carriers: A case comparison study of index patient, Front Endocrinol (Lausanne)11 (2020), 251.
11.
SantoroM. et al., RET gene fusions in malignancies of the thyroid and other tissues, Genes (Basel)11 (2020), 424.
12.
MaoX.C. et al., Clinical characteristics and treatment of thyroid cancer in children and adolescents: A retrospective analysis of 83 patients, Journal of Zhejiang University18 (2017), 430–436.
13.
KitamuraY. et al., Novel germline RET proto-oncogene mutations associated with medullary thyroid carcinoma (MTC): Mutation analysis in Japanese patients with MTC, Oncogene14 (1997), 3103–3106.
14.
HeC.MaJ.JiangY.SuX.ZhangX.ChenW.YeZ.DengT.DengW. and YangA., Associations between RET tagSNPs and their haplotypes and susceptibility, clinical severity, and thyroid function in patients with differentiated thyroid cancer, PLoS One12 (2017), e0187968.
15.
KhanM.S. et al., Possible impact of RET polymorphism and its haplotypic association modulates the susceptibility to thyroid cancer, J Cell Biochem116 (2015), 1712–1718.
16.
HoT. et al., RET polymorphisms and haplotypes and risk of differentiated thyroid cancer, The Laryngoscope115 (2005), 1035–1041.
17.
SantosM. et al., Association of RET genetic polymorphisms and haplotypes with papillary thyroid carcinoma in the Portuguese population: A case-control study, PloS One9 (2014), e109822.
18.
SherryS.T. et al., dbSNP: The NCBI database of genetic variation, Nucleic Acids Research29 (2001), 308–311.
19.
ConsortiumU., UniProt: A hub for protein information, Nucleic Acids Research43 (2015), D204–D212.
20.
HechtM.BrombergY. and RostB., Better prediction of functional effects for sequence variants, BMC Genomics16 (2015), S1.
21.
A.Z. Dayem UllahLemoineN.R. and ChelalaC., SNPnexus: A web server for functional annotation of novel and publicly known genetic variants (2012 update), Nucleic Acids Research40 (2012), W65–W70.
22.
KumarP.HenikoffS. and NgP.C., Predicting the effects of coding non-synonymous variants on protein function using the SIFT algorithm, Nature Protocols4 (2009), 1073.
23.
AdzhubeiI.A. et al., A method and server for predicting damaging missense mutations, Nature Methods7 (2010), 248–249.
24.
SunyaevS.R. et al., PSIC: Profile extraction from sequence alignments with position-specific counts of independent observations, Protein Engineering12 (1999), 387–394.
25.
TianJ. et al., Predicting changes in protein thermostability brought about by single-or multi-site mutations, BMC Bioinformatics11 (2010), 370.
26.
PejaverV. et al., The structural and functional signatures of proteins that undergo multiple events of post-translational modification, Protein Science23 (2014), 1077–1093.
27.
VenselaarH. et al., Protein structure analysis of mutations causing inheritable diseases. An e-science approach with life scientist friendly interfaces, BMC Bioinformatics11 (2010), 1–10.
28.
McHughM.L., The chi-square test of independence, Biochem Med (Zagreb)23 (2013), 143–149.
NieN.H.BentD.H. and HullC.H., SPSS: Statistical package for the social sciences, McGraw-Hill New York227 (1975).
31.
AhmedA.E.MohamedR.A. and NohaG.A., A review of software packages for structural equation modeling: A comparative study, Applied Mathematics and Physics5 (2017), 85–94.
32.
FaulF. et al., G* Power 3: A flexible statistical power analysis program for the social, behavioral, and biomedical sciences, Behavior Research Methods39 (2007), 175–191.
33.
FaulF. et al., Statistical power analyses using G* Power 3.1: Tests for correlation and regression analyses, Behavior Research Methods41 (2009), 1149–1160.
34.
AndersonD.BurnhamK. and WhiteG., Comparison of Akaike information criterion and consistent Akaike information criterion for model selection and statistical inference from capture-recapture studies, Journal of Applied Statistics25 (1998), 263–282.
35.
MassoM. and VaismanI.I., AUTO-MUTE: Web-based tools for predicting stability changes in proteins due to single amino acid replacements, Protein Engineering, Design & Selection23 (2010), 683–687.
36.
CintiR. et al., RET rearrangements in papillary thyroid carcinomas and adenomas detected by interphase FISH, Cytogenetic and Genome Research88 (2000), 56–61.
37.
HuangR.X. and YangF., RET polymorphisms might be the risk factors for thyroid cancer, International Journal of Clinical and Experimental Pathology8 (2015), 5793.
38.
WangD.G. et al., The correlation analysis of RET gene polymorphism with papillary thyroid carcinoma, Int J Clin Exp Pathol9 (2016), 10717–10713.
39.
GruppenE.G. et al., Cigarette smoking is associated with higher thyroid hormone and lower TSH levels: The PREVEND study, Endocrine67 (2020), 613–622.
40.
ChoA. et al., Cigarette smoking and thyroid cancer risk: A cohort study, British Journal of Cancer119 (2018), 638–645.
41.
MudassarS. et al., Genetic alterations of RET: Possible implications and clinical correlations in thyroid carcinogenesis, in: Knowledges on Thyroid CancerEngineO., ed., IntechOpen, Austria, 2019, pp. 1–25.
42.
LesueurF. et al., Specific haplotypes of the RET proto-oncogene are over-represented in patients with sporadic papillary thyroid carcinoma, Journal of Medical Genetics39 (2002), 260–265.
43.
LönnS. et al., Papillary thyroid cancer and polymorphic variants in TSHR-and RET-related genes: A nested case-control study within a cohort of US radiologic technologists, Cancer Epidemiology and Prevention Biomarkers16 (2007), 174–177.
44.
Plaza-MenachoI. et al., Current concepts in RET-related genetics, signaling and therapeutics, Trends Genet22 (2006), 627–636.
45.
SaunaZ.E. and Kimchi-SarfatyC., Understanding the contribution of synonymous mutations to human disease, Nature Reviews Genetics12 (2011), 683–691.
46.
ZintzarasE. and SantosM., Estimating the mode of inheritance in genetic association studies of qualitative traits based on the degree of dominance index, BMC Medical Research Methodology11 (2011), 171.
47.
MinelliC. et al., The choice of a genetic model in the meta-analysis of molecular association studies, Int J Epidemiol34 (2005), 1319–1328.
48.
CeolinL. et al., Additive effect of RET polymorphisms on sporadic medullary thyroid carcinoma susceptibility and tumor aggressiveness, European Journal of Endocrinology166 (2012), 847.