There is an urgent need for better prostate cancer (PCa) biomarkers due to the low specificity of prostate specific antigen (PSA).
OBJECTIVE:
Prostate Health Index (PHI) is an advanced PSA-based test for early detection of PCa. The present study aim was to investigate the potential improvement of diagnostic accuracy of PHI by its combination with suitable discriminative microRNAs (miRNAs).
METHODS:
A two-phase study was performed. In a discovery phase, a panel of 177 miRNAs was measured in ten men with biopsy proven PCa and ten men with histologically no evidence of malignancy (NEM). These results were validated in a second phase including 25 patients in each group. The patients of all groups were matched regarding their PSA values and PHI were measured.
RESULTS:
Based on data in the discovery phase, four elevated miRNAs were selected as potential miRNA candidates for further validation. A combination of miR-222-3p as the best discriminative miRNA with PHI extended the diagnostic accuracy of PHI from an AUC value of 0.690 to 0.787 and resulted in a sensitivity of 72.0% and a specificity of 84.0%.
CONCLUSION:
Circulating microRNAs show useful diagnostic potential in combination with common used biomarkers to enhance their diagnostic power.
Prostate cancer (PCa) detection still relies on the measurement of prostate specific antigen (PSA) but the Prostate Health Index (PHI), an approved assay by the Food and Drug Administration (FDA), shows a clear improvement of the diagnostic accuracy in comparison with PSA in large serum studies [1, 2]. It has additionally been proven that PHI selectively identifies clinically significant PCa [3] and predicts the pathological outcome in PCa patients undergoing radical prostatectomy [4] and biochemical recurrence [5]. A recent systematic review and meta-analysis of 28 studies on PHI as overall predictor of PCa resulted in a pooled sensitivity of 89% and specificity of 34% [6]. However PHI shows in its correlation with the Gleason Score ambiguous results, particularly in moderately differentiated tumors [4, 7]. Thus despite the diagnostic advantages of PHI in comparison with PSA, these data also underline the need to develop new tools in combination with other markers for a better PCa prediction accuracy. The incorporation of multiparametric MRI (mpMRI) data together with PHI is another option to avoid unnecessary biopsies [8, 9].
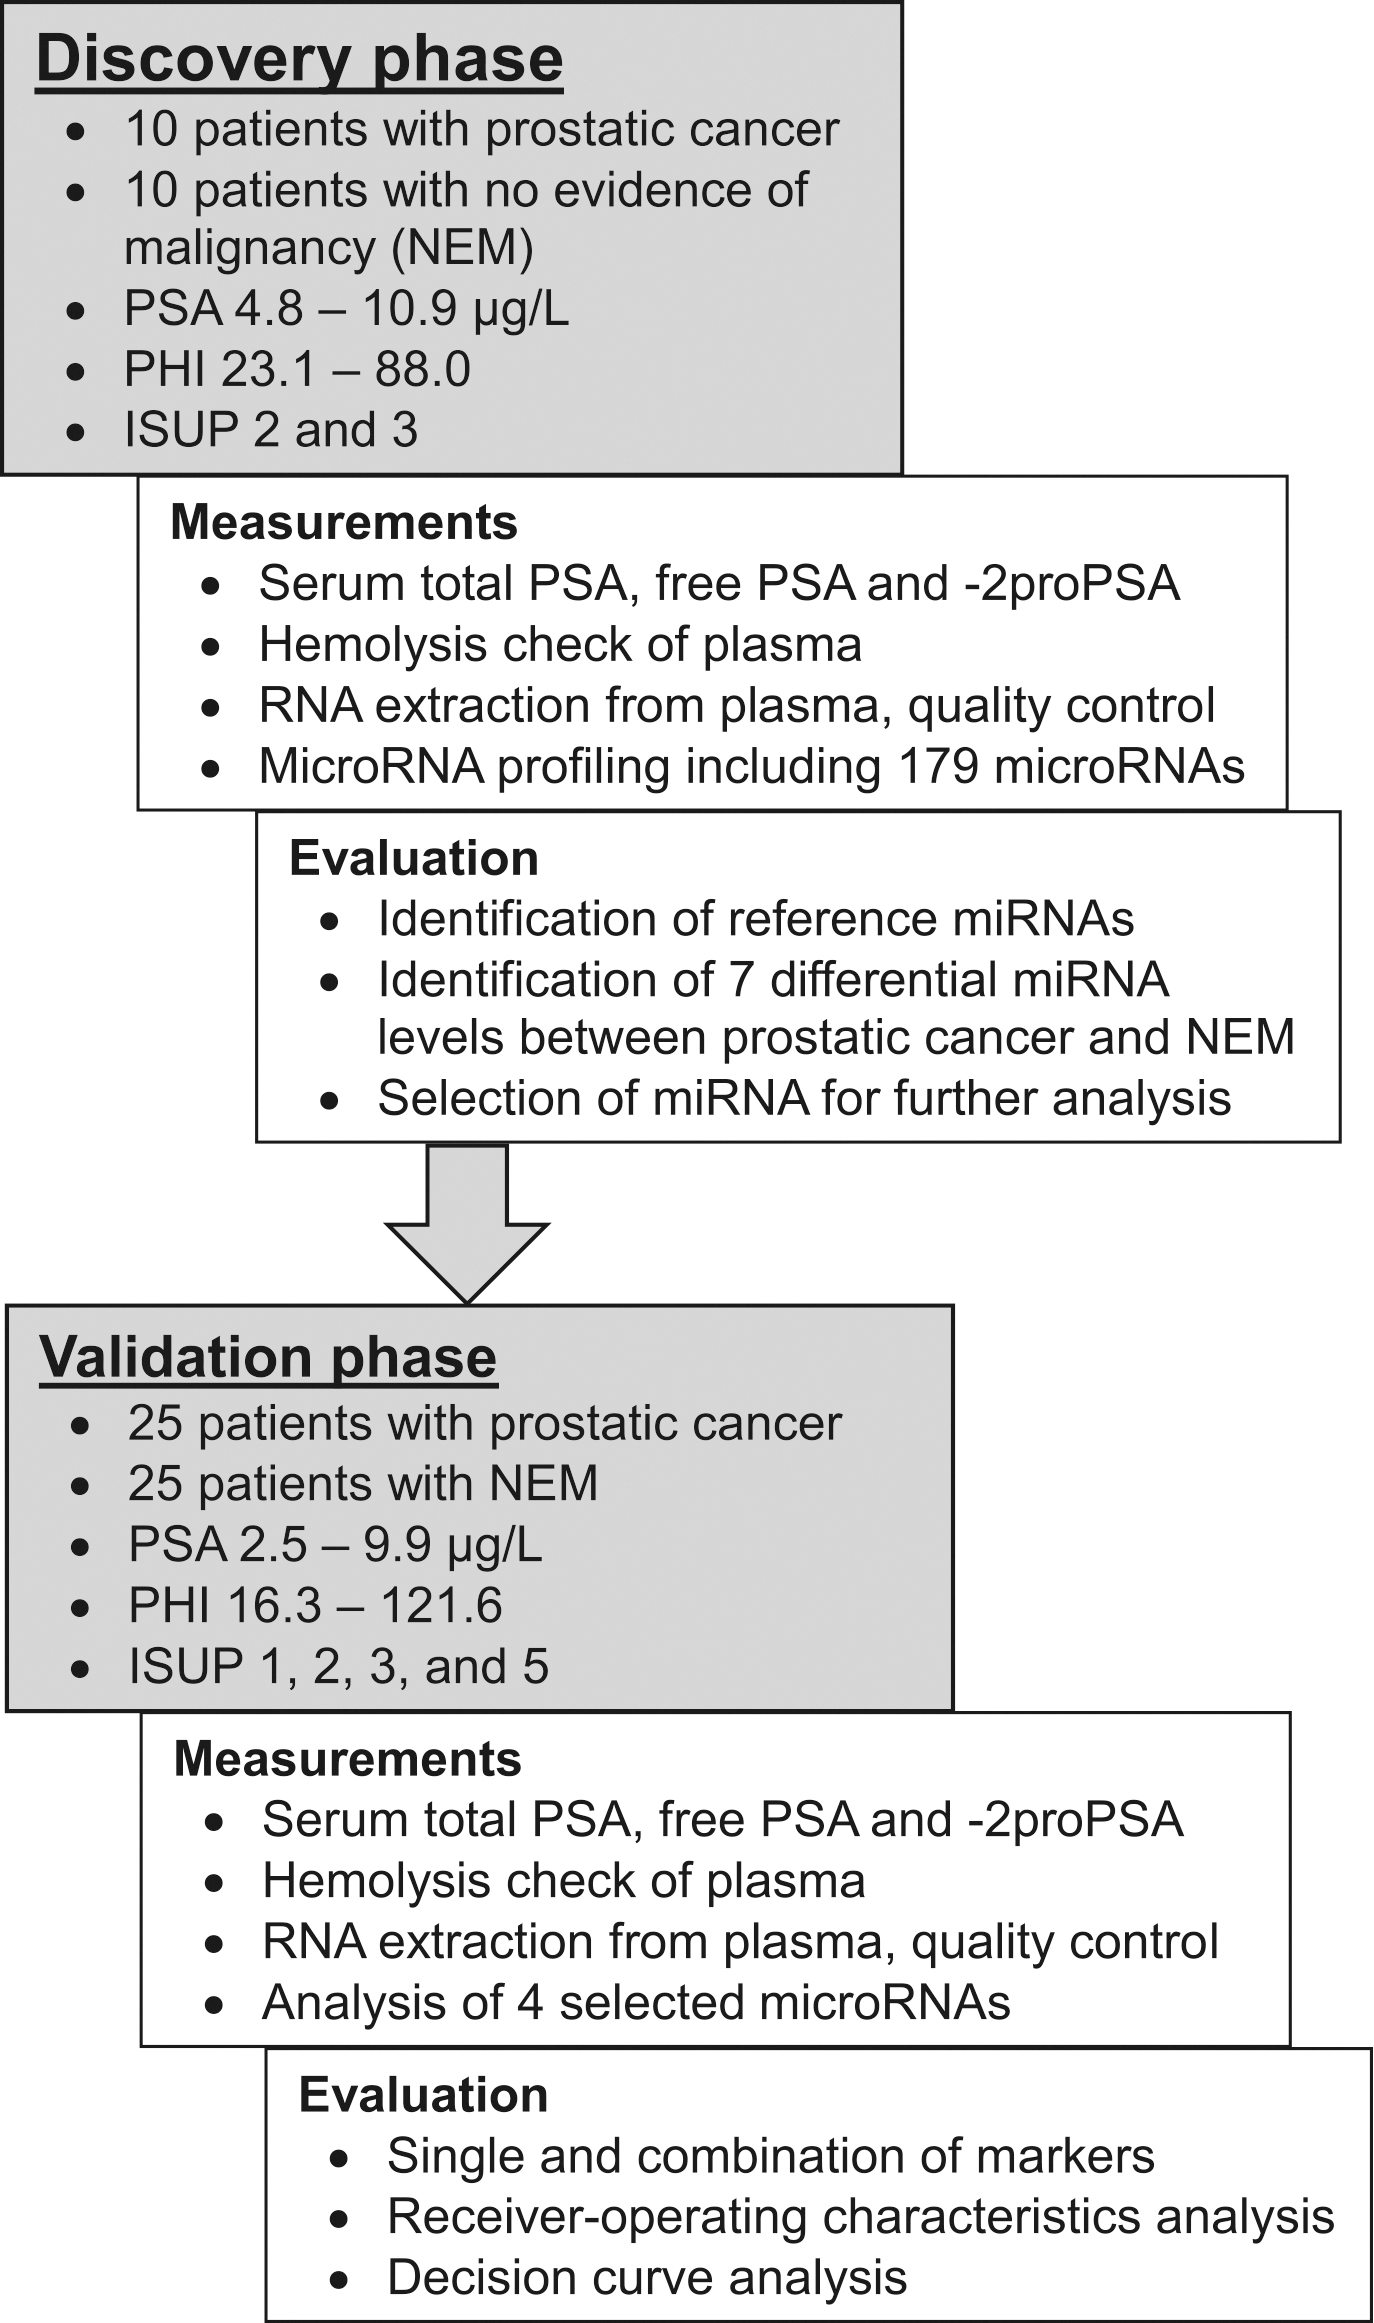
Study outline.
Apart from the search for potential new biomarkers, a combined tool based on PSA with various serum/plasma or urine markers has been shown a successful way to improve the noninvasive diagnostic accuracy of PCa prediction before carrying out a biopsy [10, 11, 12, 13]. As shown by the 4Kscore test [14] incorporating serum PSA with three other kallikreins or the Mi-Prostate Score assay [15] combining serum PSA with urine TMPRSS2:ERG and prostate cancer antigen 3, a combination of biomarkers from different pathways could be particularly helpful because of the biological PCa heterogeneity. Taking into account this aspect, we decided to combine PHI with circulating micro-RNAs (miRNAs). MiRNAs have proven to be promising circulating biomarkers in numerous studies of patients with prostate cancer (reviewed in [16, 17, 18]). A PubMed literature search revealed PHI in combination with miRNAs was used in one study with miR-21 and miR-221 without considering other miRNAs [19]. Our intention was to evaluate the potential clinical significance of PHI in initial prostate biopsy in men with PSA levels 10 g/L using selected diagnostic effective miRNAs based on a preceding discovery phase of wide miRNA profiling in this PSA range.
Clinico-pathological characteristics of the discovery cohort of patients with prostate cancer and no evidence of malignancy
Prostate cancer
No evidence of malignancy
value
All cases
10
10
Age median, years (IQR)
68 (62–71)
68 (60–71)
0.909
PSA [g/L] median (IQR)
5.8 (5.2–6.5)
5.6 (5.0–6.5)
0.879
PHI median (IQR)
53.6 (31.7–72.6)
42.8 (41.1–54.2)
0.436
Tumor stage
pT2
8
pT3
1
ISUP grade group at radical prostatectomy
2
3
3
6
Distant metastasis
M0
10
Lymph nodes
N0
9
Venous invasion
V0
9
Surgical margins
Negative
7
Positive
2
One patient only with biopsy data ISUP 4 and hormone therapy. PSA, prostate specific antigen in serum; PHI, prostate health index; IQR, interquartile range. values were calculated with Mann-Whitney -test.
The objective of our study was therefore divided into the following steps:
To identify the miRNAs from a global plasma miRNA panel with the best discriminative potential between men with PCa and no evidence of malignancy (NEM),
to compare PHI with these best miRNAs,
to estimate if the best miRNAs enhance the value of the primary input parameter PHI and
to evaluate if a combination of PHI and miRNAs may further improve the diagnostic accuracy of PCa detection in men with PSA levels 10 g/L.
Material and methods
Sample collection
Plasma and serum samples were collected from patients with PCa or NEM patients before undergoing prostate biopsy or radical prostatectomy at the Department of Urology, Charité – Universitätsmedizin Berlin, Germany between March 2012 and January 2014. The pathological classification of tissues was performed according to the Union of International Cancer Control (UICC) 2010 [20] and International Society of Urological Pathology (ISUP) 2014 [21]. All patients provided written informed consent and the present study was approved by the Ethics Committee of the Hospital Charité – Universitätsmedizin Berlin (EA1/134/12). The pathological classification for all PCa patients are summarized in Tables 1 and 2. The study was performed in two analytical steps and by a final clinical assessment process (Fig. 1).
Clinico-pathological characteristics of the validation cohort of patients with prostate cancer and no evidence of malignancy
Prostate cancer
No evidence of malignancy
value
All cases
25
25
Age median years (IQR)
67 (59–71)
60 (53–65)
0.026
PSA [g/L] median (IQR)
5.1 (3.9–6.6)
5.1 (3.9–6.5)
0.961
PHI median (IQR)
52.1 (39.1–70.8)
40.5 (37.3–48.0)
0.023
Tumor stage
pT2
15
pT3
4
Only biopsies and active surveillance
6/25
ISUP grade groups at radical prostatectomy
1
5
2
8
3
4
5
2
Distant metastasis
M0
25
Lymph nodes
N0/Nx
13/12
Venous invasion
V0/Vx
19/6
Surgical margins
Negative
16
Positive
2
No information
1
PSA, prostate specific antigen in serum; PHI, prostate health index. values were calculated with Mann-Whitney -test.
In the discovery phase (Fig. 1) a cohort of 10 men with biopsy proven prostate cancer and 10 men with histologically NEM were analyzed (Table 1). In a second validation phase (Fig. 1), a cohort including 50 patients were analyzed (Table 2). Six PCa patients were included under active surveillance after biopsy and all other ( 19) underwent radical prostatectomy. To obtain reliable data and to see the real improvement in diagnostic accuracy in ROC analysis and decision curve analysis (DCA), a matched pair analysis between PCa and non PCa patients was performed regarding their serum PSA values as recommended earlier [22].
Sample preparations, control of interfering hemolysis, and PSA measurements
Peripheral venous blood was collected in a BD Vacutainer EDTA-tube for plasma and in BD Vacutainer SST™ II Advance tube for serum (BD Biosciences, Franklin Lakes, NJ, USA, Cat.No. 367864 respectively 367953). For the preparation of plasma samples, two centrifugation steps at room temperature within 2 h after blood collection were used to gain cell-free plasma The first centrifugation step was conducted at 2500 g for 15 min. The obtained supernatant was re-centrifuged at 1500 g for 10 min afterwards aliquoted, and stored at 80C. For a reliable miRNA analysis, it is important that the plasma is free from hemolysis. To exclude this interference, the absorption of plasma samples was measured at 414 nm using NanoDrop 1000 spectrophotometer (NanoDrop Technologies; Thermo Fisher Scientific, Waltham, MA, USA). Only samples with absorption values lower than 0.3 were used for further analysis [23]. In addition to measuring the absorption of samples, hemolysis was assessed by determining the levels of miR-451 and miR-23a via reverse transcription-quantitative polymerase chain reaction (RT-qPCR). MiR-451 is expressed in red blood cells and miR-23a is relatively stable in plasma and is not affected by hemolysis [24, 25, 26]. If samples have quantification cycle (Cq) differences between miR-23a and miR-451 higher than 7.0, analytical interferences caused by hemolysis are very likely [24]. These samples were excluded from further analysis.
Serum samples were prepared as previously described taking into account the instability of -2proPSA [27, 28]. Aliquots were stored at 80C until analysis. Concentrations of total PSA, free PSA and -2proPSA were measured using WHO PSA standard calibrated Access total and free PSA immunoassays and the automated -2proPSA assay on an Access 2 Immunoassay System (Beckman Coulter, Brea, CA, USA) with analytical performance data as reported [29]. PHI was calculated according to the equation: -2proPSA/free PSA total PSA
RNA preparation and microRNA RT-qPCR
Exiqon Services (Vedbaek, Denmark) performed all preparation and analysis steps for process in the present study, including total RNA extraction from plasma, quality control and the RT-qPCR of miRNA. MiRNAs were assayed by qPCR on the microRNA Ready-to-Use PCR, Serum/Plasma Focus panel v.4.0, including 177 human microRNAs from Exiqon Services (Vedbaek, Denmark). All further details are described in a former publication [30].
The primer sequences and primer sets are proprietary information of Exiqon Services (Vedbaek, Denmark) available by QIAGEN GmbH, Hilden, Germany and are listed in Table 3. After selection of reference miRNAs, the geometric mean of miR-101-3p and miR-19b-3p was used for relative quantification of RT-qPCR data in both phases. The amplification was performed in a LightCycler 480 Real-Time PCR system (Roche GmbH Mannheim, Germany) in 384-well plates. The amplification curves were analyzed using the Roche LC software version 1.5.0.39, both for determination of Cq (by the 2nd derivative method) and for melting curve analysis[31].
MicroRNAs measured with RT-qPCR
A: miRs
Human miRNA
microRNA target sequence (5’-3’)
Corresponding LNA™ microRNA
PCR primer set (cat. no)
Cat.no.
miR-150-5p
UCUCCCAACCCUUGUACCAGUG
204660
YP00204660
miR-193a-5p
UGGGUCUUUGCGGGCGAGAUGA
204665
YP00204665
miR-205-5p
UCCUUCAUUCCACCGGAGUCUG
204487
YP00204487
miR-222-3p
AGCUACAUCUGGCUACUGGGU
204551
YP00204551
miR-19b-3p
UGUGCAAAUCCAUGCAAAACUGA
204450
YP00204450
miR-101-3p
UACAGUACUGUGAUAACUGAA
204786
YP00204786
B: Internal RNA spike-in references
Reference
Sequence (5’-3’)
Corresponding LNA™ microRNA
PCR primer set (cat. no)
Cat.no.
UniSp2
_
203950
YP00203950
UniSp4
_
203953
YP00203953
UniSp5
_
203955
YP00203955
Cel-miR39-3p
_
203952
YP00203952
Interplate calibrator
_
Not for sale
Not for sale
Primers available from Qiagen GmbH. -, sequences are proprietary information. miR, microRNA.
Data analysis
Data were presented as median values with the interquartile range. The miRNA levels of the Serum/ Plasma Focus panel v.4.0 were assessed using the qBase (Biogazelle, Zwignaarde, Belgium) software version 3.2[32, 33, 34]. This software included the geNorm computer program [35] that was used to identify reference miRNAs and to detect differential miRNA levels between NEM and PCa patients based on the global normalization and reference miRNA-based approaches described below. Statistical analyses area under the curves (AUC) of receiver-operating characteristics (ROC) analyses according to DeLong et al. [36] and the precision-recall analyses were performed with the MedCalc Statistical Software version 19.5.3 (MedCalc Software Ltd., Ostend, Belgium). The precision-recall curve is a novel alternative for ROC analysis and plots the positive predictive value (named precision; y-axis) against the diagnostic sensitivity (named recall; x-axis) for different thresholds [37]. Non-parametric tests (Wilcoxon test Mann-Whitney -test, McNemar test, and Spearman rank correlation coefficient), binary logistic regression analysis, and sample size calculations were applied and mentioned at the corresponding places in the text. The DCA analysis was performed as previously described to determine the utility of the combination of PHI and miRNAs by quantifying the net benefits at different threshold probabilities in the validation cohort [29, 38]. The Cancer Genome Atlas Prostate Cancer (TCGA-PRAD) RNAseq data were downloaded and analyzed with R (version 3.6) using the “TCGA2stat” library and the “survival” library for univariable Cox regression analyses in relation to outcome characteristics as described previously [39].
Results
Discovery phase: Different plasma miRNA levels between controls and prostate cancer patients
The prostate cancer cohort consisted of patients with Gleason 7 (3 4 and 4 3) corresponding to the new ISUP grade groups of 2 and 3 (Table 1). These patients were deliberately chosen to establish a miRNA profile particularly in patients with moderately differentiated tumors and facilitate therefore the identification of sensitive markers for diagnostic purposes. The comparison group included NEM patients with similar values of PSA (Table 1).
Of the 177 miRNAs on the Exiqon panel, 125 mi-RNAs were detected in the 20 samples of NEM and PCa group (Supplementary Table). Based on the global normalization approach, the levels of eight out of nine mi-RNAs (Table 4) were different between the two groups. In the case of a large number of analytes, the global normalization procedure is well applicable. However, for a small number of miRNAs, stably expressed endogenous miRNAs should be used as normalizer. Such normalizer should be expressed at a constant non-regulated level independent of biological variations, disease stages or treatments. Therefore, we performed a reference miRNA search in the panel of the 125 detected miRNAs.
MiRNA-level changes in plasma samples of prostate cancer patients in relation to the NEM group of discovery cohort
miRNA
Normalization with
Global mean
Two reference miRNAs
Fold change (95% CI)
value
Fold change (95% CI)
value
miR-29a-3p
1.89 (1.13–3.15)
0.019
1.94 (1.17–3.21)
0.014
miR-150-5p
2.95 (1.17–7.41)
0.024
3.03 (1.28–7.18)
0.016
let-7b-3p
1.69 (1.17–2.43)
0.008
1.64 (1.10–2.42)
0.017
miR-193a-5p
1.99 (1.01–3.93)
0.047
2.05 (1.13–3.72)
0.021
miR-222-3p
1.39 (1.04–1.85)
0.027
1.43 (1.05–1.94)
0.026
miR-342-3p
2.19 (1.10–4.38)
0.029
2.25 (1.11–4.57)
0.027
miR-205-5p
2.30 (0.84–5.92)
0.079
2.53 (1.08–5.90)
0.035
miR-132-3p
1.53 (1.02–2.31)
0.043
1.57 (0.94–2.64)
0.083
miR-223-5p
1.69 (1.00–2.84)
0.049
1.65 (0.86–3.18)
0.123
MicroRNAs with significant fold changes ( 0.05) are bold marked. values were calculated Wilcoxon test. CI, confidence interval.
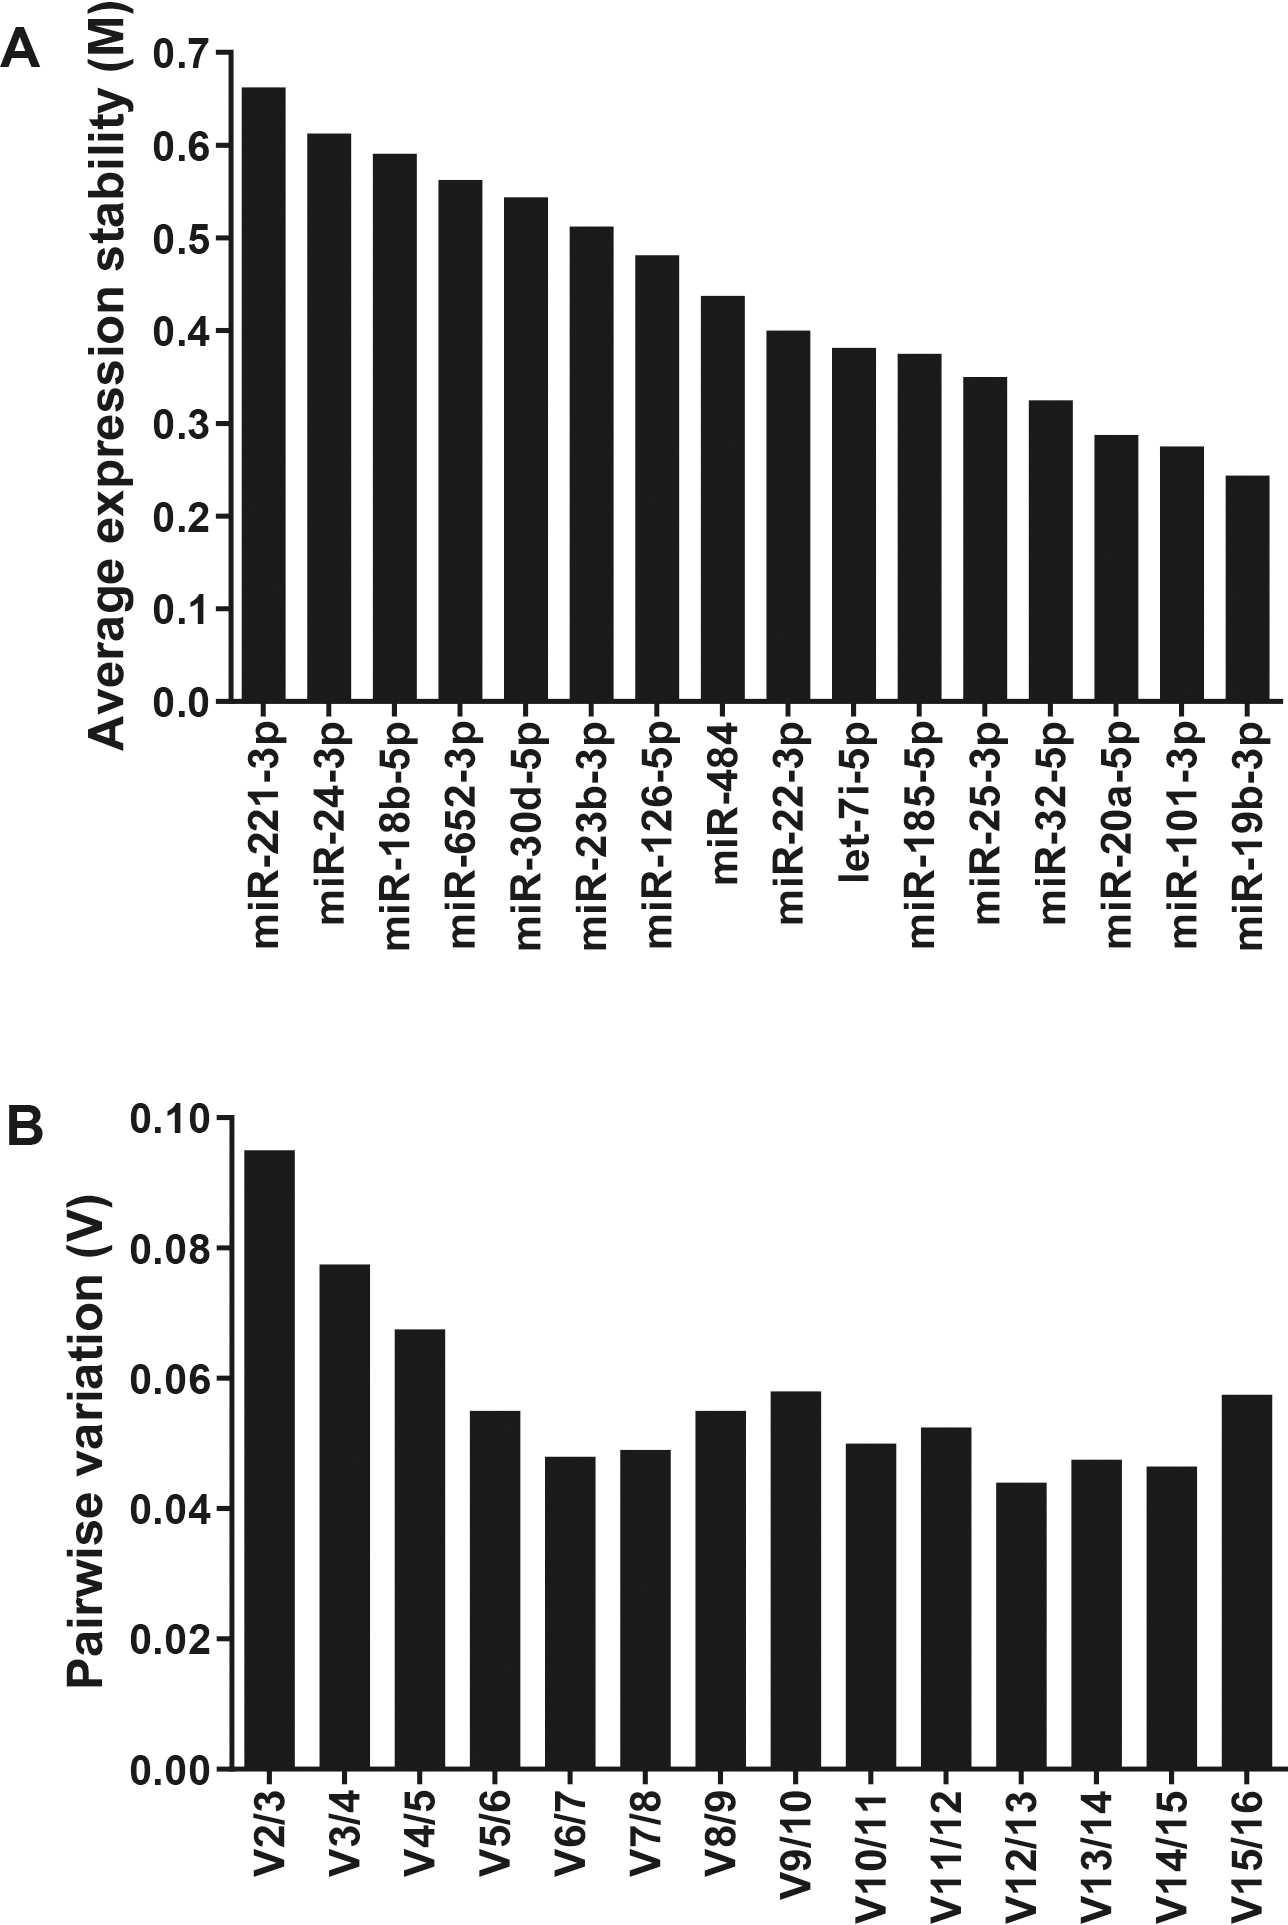
GeNorm analysis of potential reference genes to determine the most stable genes for normalization of miRNA expression. (A) The expression stability parameter M of one gene based on the average pairwise variation between all studied genes. The smallest stability M value indicates the gene with the most stable expression. (B) Calculation of the optimal number of reference genes for normalization. The optimal number of reference genes in this experiment is two (miR-101-3p and miR-19b-3p). All results are presented according to the output files of geNorm program.
For this search, the inclusion criteria of potential suitable normalizer miRNAs were a fold change of 1.05 to 1.05 between NEM and PCa patients and Cq values below 31. These criteria fulfilled 16 miRNAs of the 125 detectable miRNAs. According to the geNorm approach in the software qBase (Fig. 2), miR-101-3p and miR-19b-3p were identified as most suitable normalizers. The average expression stability value M of all candidate reference miRNA between 0.244 and 0.662 denoted a good stability for all candidate reference miRNAs that were distinctly lower than the default limit of 1.5 in the geNorm program. The lowest M value indicates the gene with the best stability (Fig. 2A). Furthermore, the program calculates a normalization factor (V), which is a criterion for the useful number of reference miRNAs. The program generally suggests V values less than 0.15 for reliable normalization. The pair miR-101-3p and miR-19b-3p achieved this cut-off value (Fig. 2B). Therefore, the geometric mean of mi-RNAs miR-101-3p and miR-19b-3p was recommended as optimal approach for normalization and served as the normalization factor.
Based on this reference miRNA approach, seven differentially expressed miRNAs were identified between the two cohorts (Table 4). Six miRNAs with statistically significant different levels ( 0.05) between PCa and NEM patients overlapped regarding to both normalization approaches (Table 4). To select differentially expressed miRNAs for further validation as candidates to discriminate between NEM and PCa, we compared the two normalization approaches. The following criteria were defined: i) a fold change level higher than 2.0 obtained in both normalization approaches, ii) detection of miRNAs in at least 80% of samples of every patient cohort, and iii) significant values 0.05 with both normalization methods. According to these criteria, three elevated miRNAs (miR-150-5p, miR-193a-5p and miR-222-3p) were selected as potential miRNA candidates for further validation in patient samples. MiR-222-3p was selected as potential marker in the validation process despite the fold change of only 1.43, because Singh et al. [40] reported a changed level of miR-222-3p in serum as predictor of post-operative recurrence of PCa. In addition miR-205-5p was included in further analyses although it was detectable in only 80% of the samples with a p value of 0.076. However, this miRNA was found to be downregulated in plasma and urine of PCa patients in other studies [41, 42].
Receiver-operating characteristics analyses of PHI, single miRNAs and their combinations to discriminate between PCa and NEM patients
Variables
AUC (95% CI)
value different to
Differentiating ability at the
Youden index
AUC 0.5
Sensitivity (95% CI)
Specificity (95% CI)
Single variable
PSA
0.505 (0.360–0.649)
0.954
100 (86–100)
4 (0.1–20)
PHI
0.690 (0.544–0.813)
0.0164
68 (47–85)
76 (55–96)
miR-150-5p
0.560 (0.413–0.700)
0.474
84 (64–95)
40 (21–61)
miR-193a-5p
0.613 (0.465–0.747)
0.167
80 (59–93)
44 (24–65)
miR-222-3p
0.682 (0.535–0.806)
0.018
88 (69–98)
48 (29–69)
Combined variables
All miRNAs
0.682 (0.535–0.806)
0.018
88 (69–98)
48 (29–69)
PHI miR-222-5p
0.787 (0.648–0.890)
0.0001
72 (51–88)
84 (64–96)
AUC, area under the ROC curve; CI, confidence interval; miR, microRNA; NEM, no evidence of malignancy; PCa, prostate cancer; PSA, prostate specific antigen; PHI, prostate health index. AUC values were calculated according to DeLong [36]. As cutoff for the evaluation of data was used the maximum value of the Youden index corresponding to the overall diagnostic effectiveness with the equal weight to sensitivity and specificity. Calculated by a combined model using binary logistic analysis with all three listed miRNAs. Calculated by a model build by binary logistic analysis using the backward elimination procedure (entry: 0.05; removal: 0.10) with PHI and three listed miRNAs resulting in a final model with PHI and miR-222-5p.
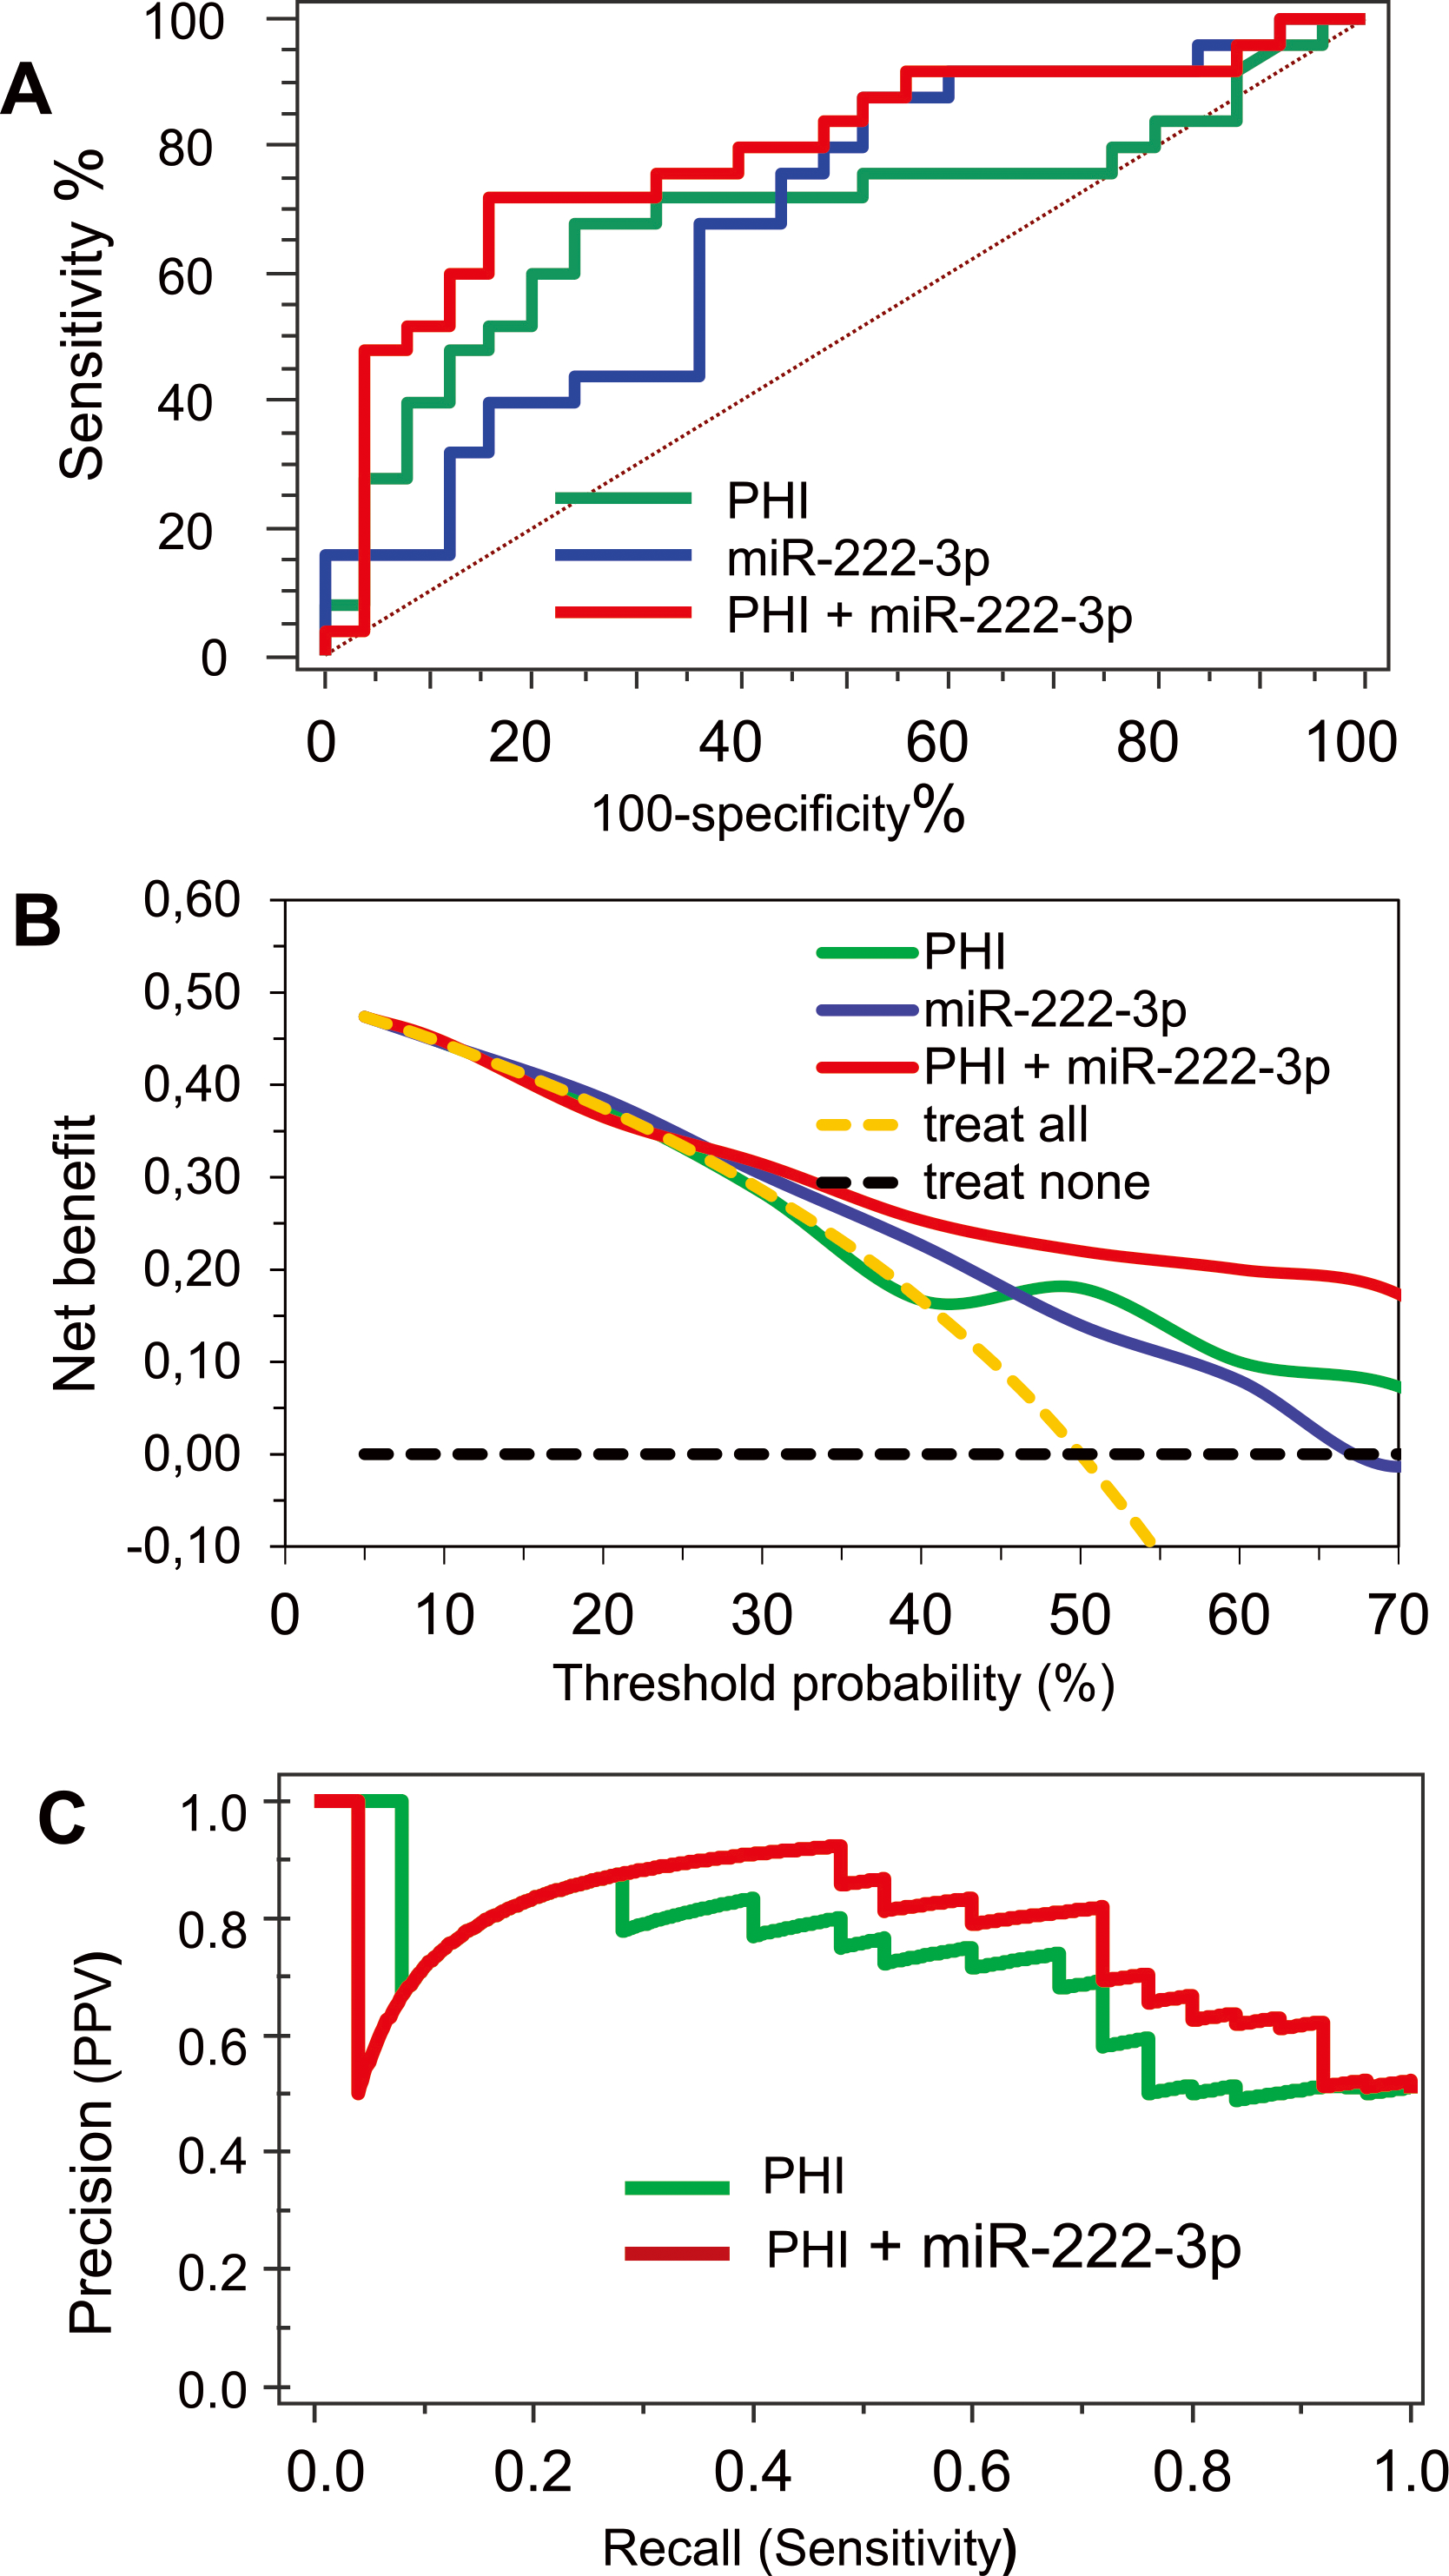
Diagnostic performance analysis of PHI, miR-222-3p and their combination. (A) ROC curve analysis of PHI, miR-222-3p and their combination. (B) Decision curve analysis of both parameters and their combination. (C) Precision-recall curve for PHI alone and in combination with miR-222-3p.
Validation and clinical assessment phases: Plasma miRNAs as diagnostic markers in combination with PHI
The sample size calculation for the validation phase was based on the mean difference and their standard deviations of the seven significant candidate miRNAs between the two study groups in the discovery phase. The necessary sample size was calculated with a power of 0.8 to obtain data for statistically significant results on a level of 0.05. For the ratio of NEM to tumor patients of 1:1, a necessary sample size of each 25 men in the two groups was calculated. Taking into account the pooled AUC value of 0.76 in the PHI meta-analysis by Russo et al. [6], 18 patients are required in each study group to obtain significance from the null hypothesis AUC value of 0.5. Thus, we included 25 patients into each group for the miRNA validation process.
MiR-205-5p was detectable only in plasma samples from 12/25 of PCa patients and in 7/25 of NEM patients and therefore unsuitable to discriminate between the patients.
The ROC analysis of PHI, miR-222-3p and miR-193a-5p showed AUCs greater than 0.60 (Table 5). MiR-150-5p did not reach this value and it was not considered in the further evaluation of data (Table 5). PHI did not correlate with the miRNA levels ( values of 0.011 to 0.068, values between 0.581 and 0.981). PHI alone showed the greatest AUC (0.690) in comparison with the miRNAs alone. A comparison of the AUC values between PHI alone and the single miRNAs proved no statistical difference (PHI vs miR-222-3p 0.939 and PHI vs miR-193a-5p 0.491). The combination of all three miRNAs based on a logistic regression model did not expand the AUC value of miR-222-3p. Furthermore, using a backward elimination approach of the logistic regression model only miR-222-3p remained as statistically significant marker ( 0.030) in the model. Therefore, only a model constructed by logistic regression with PHI and miR-222-3p was further evaluated. This combination extended the AUC to 0.787 and resulted in a sensitivity of 72% and specificity of 84% using the Youden index data (Table 5, Fig. 3A). Despite the considerable increase of the AUC value by 0.97, the AUC value of PHI in combination with miR-222-3p was not statistically different from the AUC of PHI alone ( 0.137). Regarding a diagnostic sensitivity of 90% for PHI, the diagnostic specificity was significantly increased from 12% to 44% by combining PHI with miR-222-3p (McNemar test, 0.07). This improvement of the diagnostic accuracy is particularly shown in the DCA and the precison-recall curves (Fig. 3B and C). These two approaches have been introduced as more informative alternatives for the ROC analysis [37, 43]. In both cases, the curves of PHI combined with miR-222-3p run over the curves of PHI. The results of the DCA and precision-recall curve analyses can be regarded as distinct increment of diagnostic accuracy of PHI due to the combination with miR-222-3p. In DCA, it is noticeable that this applies over the relatively wide probability range from 30 to 70%.
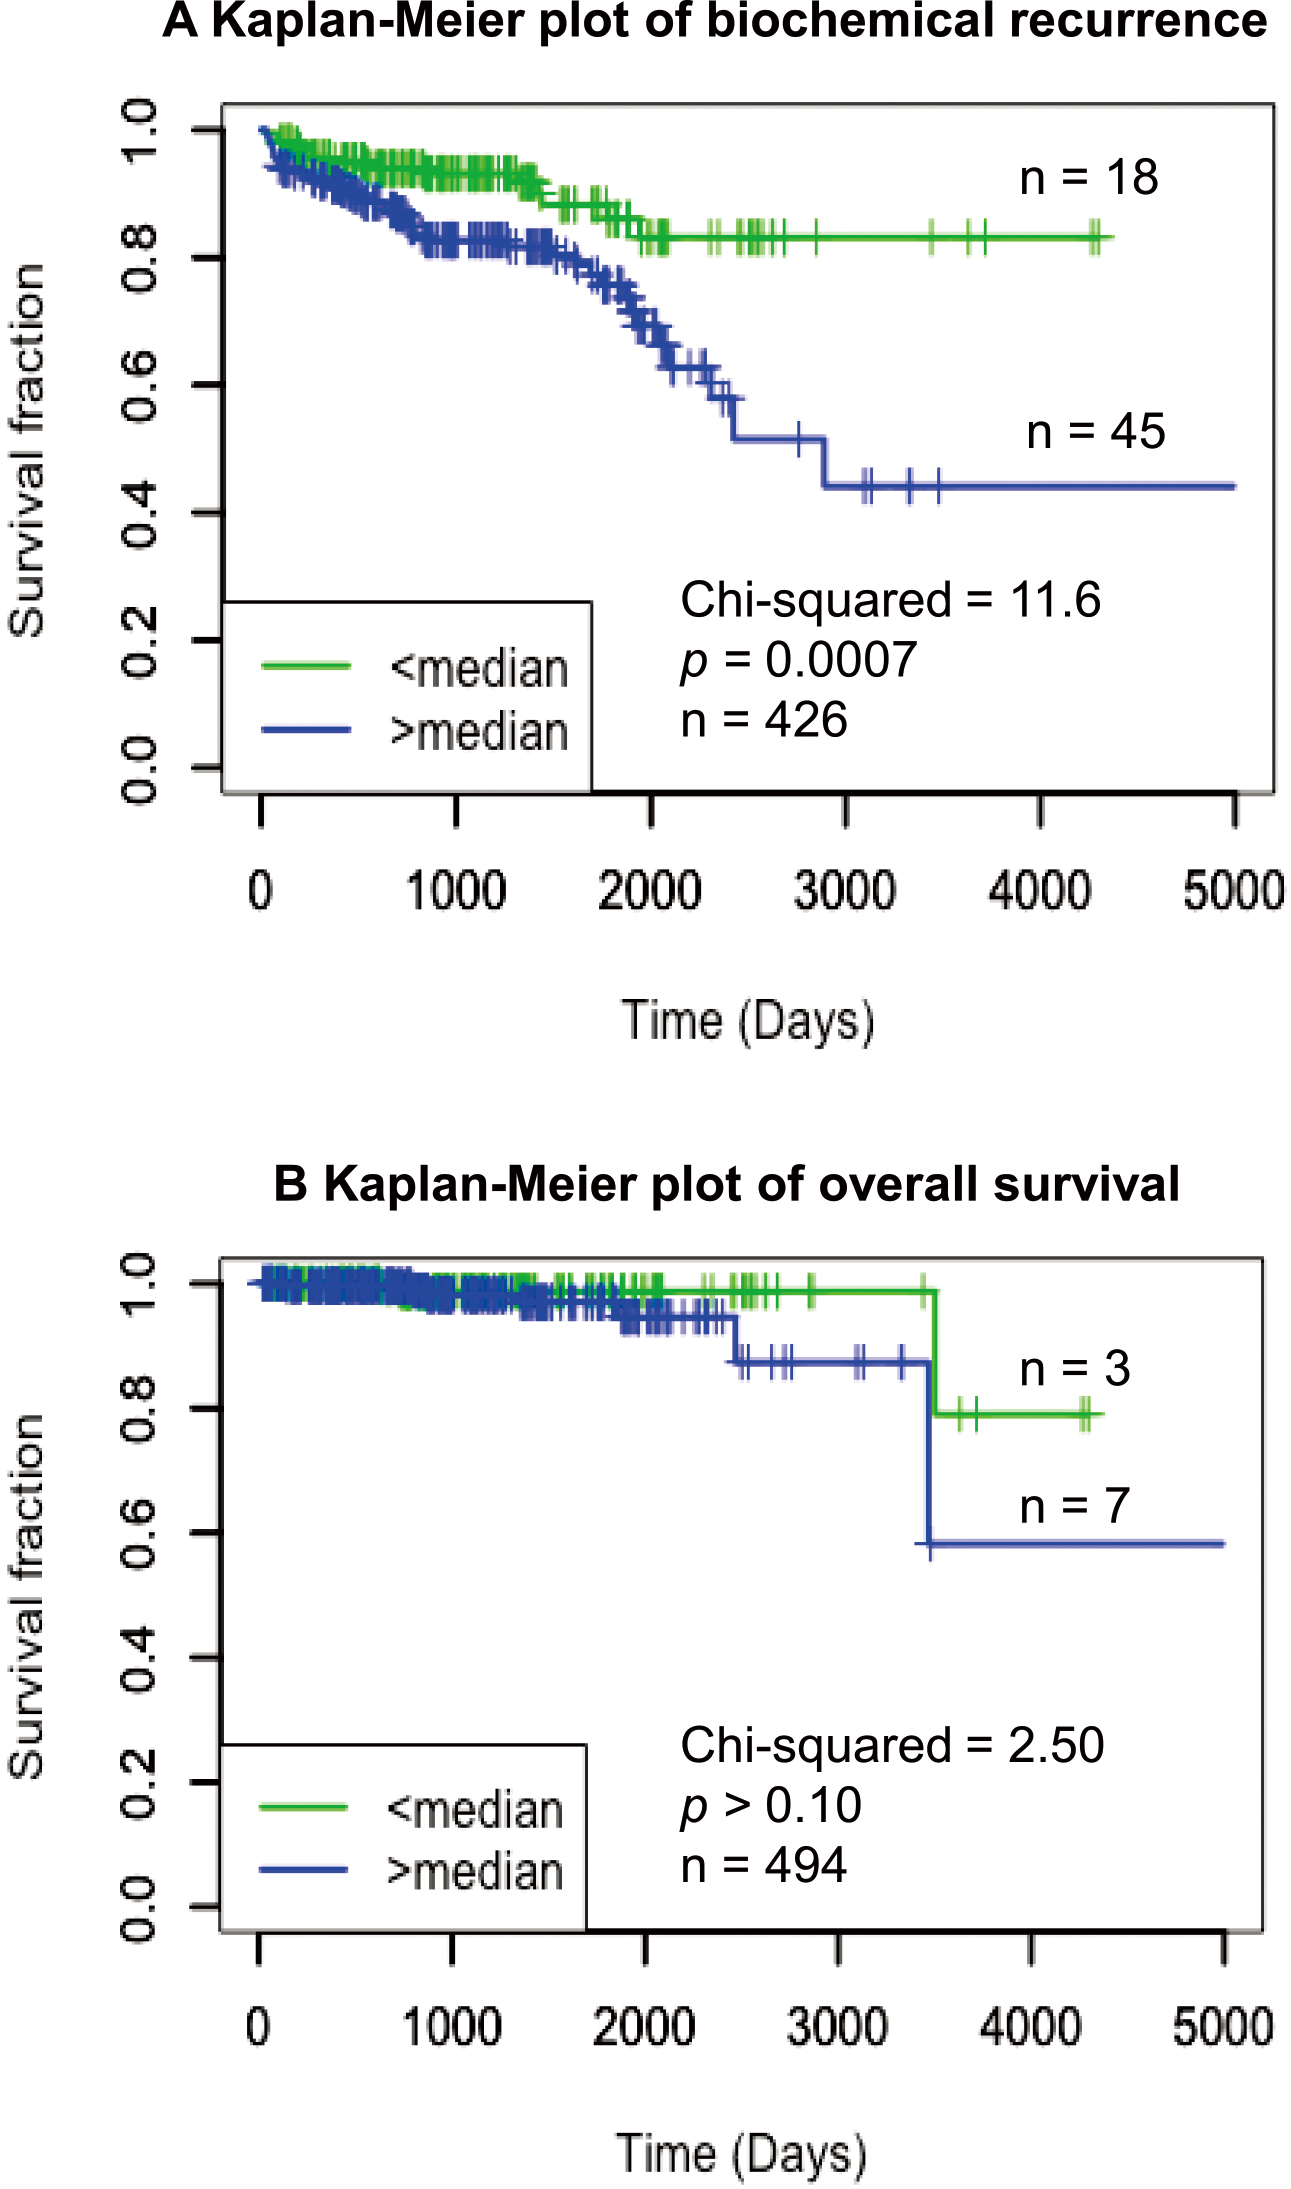
To determine the potential significance of miR-222-3p alone with regard to its prognostic relevance, we used the publicly available TCGA data set for Kaplan-Meier analyses in relation to the clinical endpoints biochemical recurrence and overall survival. Biochemical recurrence was defined as a postoperative PSA re-increase above 0.2 g/L from undetectable levels after radical prostatectomy. The increased expression of miR-222-3p was closely associated to the biochemical recurrence (Fig. 4A) but not to the overall survival (Fig. 4A and B).
Kaplan-Meier analysis of miR-222-3p with regard to (A) biochemical recurrence survival and (B) overall survival of patients after radical prostatectomy from the TCGA data set. The total number of patients with the corresponding events are indicated in the figure of the two studies.
Discussion
We hypothesized that the diagnostic accuracy of the FDA-approved tool PHI could be improved in combination with suitable plasma miRNAs regarding the discrimination between patients with PCa and NEM. In the present study, we demonstrate that PHI together with miR-222-3p enhances the diagnostic accuracy in patients with PSA levels in the diagnostic PSA gray zone until 10 g/L. Thus, we consider this biomarker combination to be of interest to improve as a biopsy indicator for patients with suspicion for PCa.
As briefly mentioned in the introduction, PHI and circulating miRNAs have been so far reported in numerous separate studies as useful noninvasive PCa markers (reviewed in [6, 16, 17, 18]). Since 2012, PHI has been an FDA-approved blood test in PCa diagnostics [10, 13]. Circulating miRNAs have also been evaluated frequently as PCa biomarkers since the initial investigations by Mitchell et al. [44] but they have not yet found their way into routine diagnostics [16, 17, 18]. To the best of our knowledge, Ibrahim et al. [19] performed the first study in which they combined both tools for diagnosis and prognosis of PCa. However, the poorly balanced patient selection in the diagnostic PSA gray zone ( 10 g/L) and the limitation to only two microRNAs in that study makes it difficult to assess whether mi-RNAs can really improve diagnostic accuracy compared to the standard PHI parameter or in combination with PHI.
Therefore, our study design was primarily focused to answer this question based on the multistep approach outlined in the introduction and shown in Fig. 1. We matched men with PCa and NEM according to their PSA level within the discovery and validation phases to obtain a good PSA balance between the two cohorts of this case-control study. This is a precondition for the correct evaluation of all following comparisons between the individual biomarkers or their combinations. Such a matching approach has already been successfully applied to other PSA marker studies in order to exclude expected confounding effects in case-control studies[22].
In addition to the addressed issue of study design and patient selection, we paid special attention to the analytical performance of measurements in accordance with the recommendations made for such studies [16]. For reliable measurements of PHI with its three individual analytes of total PSA, free PSA and proPSA, we followed the well-known special preanalytical and analytical requirements of PHI measurements as described in one of our previous reports [2]. Due to the instability of proPSA, strict attention was paid to ensure that the blood samples were centrifuged within 1–2 hours after collection [27, 28]. On the other hand, two aspects of miRNA measurements in this study required particular observation: firstly, possible erroneous results due to confounding miRNAs released from blood cells by hemolysis [25, 26] and secondly, the identification of suitable reference miRNAs for the normalization of measured miRNA data [32]. A systematic review of all studies on circulating miRNAs in PCa patients until 2016 showed that only few studies mentioned whether hemolysis was checked [16]. Results of studies that use hemolysis-affected miRNAs as biomarkers must generally be regarded as biased. The interfering effect of hemolysis on circulating miRNA determinations was also shown for miR-21 and miR-221[45]. In contrast to the data by Ibrahim et al. [19] several studies proved miR-21 to be unsuitable as early marker of detecting PCa [46, 47, 48, 49]. Since miRNA measurements can be falsified even by invisible hemolysis, we consider it necessary for our study to perform a strict hemolysis control for every sample with no evident hemolysis. As described in methods, samples with a suspicious absorbance value and Cq difference between miR-23a and miR-451 were excluded from this study. We believe that such a pre-analytical control measurement is especially essential when blood sample collections done at different study sites. The second analytical issue that we had to resolve in this study was the normalization of miRNA data. To avoid analytical problems with RT-qPCR determinations, including due to the low concentrations of total RNA generally found in plasma [50], the miRNA data were normalized to the reference miRNAs miR-101-3p and miR-19b-3p. Using the software qBase with its geNorm tool to find suitable reference genes for normalization [32, 33, 34, 35], these two miRNAs proved to be the best miRNA combination for this purpose (Fig. 2). Small nuclear or nucleolar RNAs are frequently used to normalize circulating miRNA levels without their suitability as normalizers having been evaluated for the respective study [16]. However, small RNAs can also be dysregulated in tumors [51]. Therefore, if small RNAs are used as reference genes, this can lead to biased miRNA expression data. This requires testing the stability of the normalizers an essential step in achieving reliable data. The suitability of our reference miRNA combination as a normalizer approach was confirmed in the discovery phase by the well comparable miRNA changes between the PCa and NEM cohorts that were obtained with this miRNA combination and the global mean method (Table 4).
The Exiqon panel of circulating miRNAs used in the discovery phase of our study contained a small number of 177 miRNAs. Of these, 125 miRNAs were reliably detectable in our study and we defined based on reference miRNA approach seven miRNAs as potentially diagnostically suitable marker candidates (Table 4). Four miRNAs (miR-150-5p, miR-193a-5p, miR-205-5p and miR-222-3p) were further investigated in the subsequent validation phase. As result of these investigations, miR-222-3p finally remained the most suitable discriminative miRNA. This miRNA has been implicated to have a role in PCa diagnostics [52, 53, 54]. MiR-222-3p was found to be dysregulated in PCa in comparison with normal prostate tissue depending on Gleason score[54, 55, 56, 57]. Up-regulation was observed in low-grade PCa and down-regulation in high-grade tumors [56, 57, 58, 59]. Based on TCGA data, Panigrahi et al. [60] confirmed these data showing an invers correlation between miR-222-3p and the pathological characteristics Gleason score, tumor stage, and nodal status. Another study group [58] using also the TCGA data set reported on the outcome prediction of miR-222 in combination with three other miRNAs (miR-133a-3p, miR-1301-3p, and miR-30c-2-3p) with regard to biochemical recurrence and also clinical recurrence [58]. Our data evaluation of the TCGA data set focused on the miR-222-3p alone confimed that the increased miR-222-3p is closely associated with the biochemical recurrence (Fig. 4A). In serum, but also in urine, changed miR-222-3p values alone or in combination with other miRNAs have been reported as early PCa recurrence marker after radical prostatectomy and discriminative marker between PCa and benign prostatic hyperplasia [40, 46, 61, 62]. However, as useful supportive marker in the PSA gray zone until 10 g/L, miR-222-3p has not been validated until now. Moreover, it should be mentioned that numerous studies have recommended other circulating miRNAs in plasma/serum as noninvasive marker, frequently in combination, to improve PCa diagnosis or outcome prediction [63, 64, 65, 66, 67, 68].
Although PHI and miR-222-3p did not significantly differ in their AUC values of the ROC analysis, their combination increased the AUC values from 0.690 of PHI and from 0.682 of miR-222-3p by approximately 0.1 AUC points to an AUC value of 0.787 (Table 5, Fig. 3A). This improvement of diagnostic accuracy obtained by the combination of PHI and miR-222-3p is one of the important results of this study. As already stated in the results, a further positive aspect is the enhanced power of this biomarker combination in the DCA and the precision-recall curve analysis (Fig. 3B and C). PHI and miR-222-3p as single markers were clearly outperformed by their combined use within the probability range of 30 to 70% in DCA analysis (Fig. 3B) and its positive predictive value is generally higher than that of PHI alone (Fig. 3C). Because 20 to 30% of men with PSA values in the range until 10 g/L are at risk for PCa, this combination can be used both by the primary physician and in tertiary centers with a selected patient population of higher prevalence of risk of PCa. The DCA is considered more informative than ROC analysis and is currently the recommended standard to assess the diagnostic/prognostic benefit of different biomarkers [43]. Since circulating miR222-3p does not correlate with PHI, it can be assumed that miRNA-222-3p acts as an orthogonal marker in this two-assay combination. Orthogonal markers are characterized by missing or opposite association to other variables [69]. Thus, orthogonal markers can provide additional information and represent important components of marker combinations [70]. This also partly explains the netbenefit of the marker combinations 4Kscore [14] and Mi-Prostate Score [15] compared with PSA as mentioned in the introduction. The marker combination PHI and miR-222-3p evaluated here is therefore also in this line to stratify men with PSA values in the gray zone concerning their PCa risk more accurately
As already briefly stated in the introduction, a combination of mpMRI with PHI is another option to improve early PCa detection and it may save 42 to 50% of unnecessary biopsies missing only one clinical significant PCa[8, 9]. Especially within the PSA gray zone of 2–10 g/L an improved detection of significant PCa is of utmost importance. We propose a stepwise schedule for PCa diagnostics. First, biomarkers and their combination (e.g. PHI and others like PCA3 or miRNAs) should be used to avoid the costly mpMRI for each man with an elevated PSA of 2 or 4 g/L. Second (and only in case of suspicion for PCa), mpMRI should be incorporated. This improved preselection before finally performing a biopsy should avoid unnecessary biopsies in more men than with the current standards. Further, physicians should consider clinical risk factors when ordering and interpreting mpMRI results to avoid unnecessary testing [71].
Some limitations of this study need to be mentioned. These are the sample collection from only one center with a limited number of cases, the retrospective design of the study, and the lack of external validation. However, we believe that these shortcomings and potential Types I and II errors have been largely eliminated by the two-step study approach applied, with a discovery phase followed by a validation phase with PSA matched pairs of patients, and by the calculated sample size based on an effect size of a PHI meta-analysis.
Conclusion
MiR-222-3p was identified as suitable circulating miRNA in plasma for PCa risk stratification of men with PSA values in the gray zone 10 g/L based on a discovery study using a profiling panel of 177 miRNAs and a subsequent validation phase. The combined determination of miR-222-3p and PHI as FDA approved diagnostic assay of PCa improved the diagnostic accuracy of PHI alone in men with PCa at risk in comparison to men without PCa. Such an integrated approach would be helpful in a decision-making in clinical routine and counseling patients in order to avoid unnecessary biopsies or costly other examinations. We suggest including this combined assay in future prospective studies in comparison with other classifiers to elaborate a reliable tool for clinical practice.
Author contribution
AT
KJ
FF
AM
ML
AF
CS
CONCEPTION
x
x
x
INTERPRETATION OR ANALYSIS OF DATA
x
x
x
x
x
x
x
PREPARATION OF MANUSCRIPT
x
x
x
x
x
x
x
REVISION OF IMPORTANT INTELLECTUAL CONTENT
x
x
x
x
x
x
x
SUPERVISION
x
x
x
Supplementary data
The supplementary files are available to download from http://dx.doi.org/10.3233/CBM-201600.
sj-xlsx-1-cbm-10.3233_CBM-201600.xlsx - Supplemental material
The project was partly supported by Stiftung Urologische Forschung.
Conflict of interest
The authors declare that they have no competing interests.
References
1.
CatalonaW.J.PartinA.W.SandaM.G.WeiJ.T.KleeG.G.BangmaC.H.SlawinK.M.MarksL.S.LoebS.BroylesD.L.ShinS.S.CruzA.B.ChanD.W.SokollL.J.RobertsW.L.van SchaikR.H. and MizrahiI.A., A multicenter study of [-2]pro-prostate specific antigen combined with prostate specific antigen and free prostate specific antigen for prostate cancer detection in the 2.0 to 10.0 ng/ml prostate specific antigen range, J Urol185 (2011), 1650–1655.
2.
StephanC.VincendeauS.HoulgatteA.CammannH.JungK. and SemjonowA., Multicenter evaluation of [-2]proprostate-specific antigen and the prostate health index for detecting prostate cancer, Clin Chem59 (2013), 306–314.
3.
LoebS.SandaM.G.BroylesD.L.ShinS.S.BangmaC.H.WeiJ.T.PartinA.W.KleeG.G.SlawinK.M.MarksL.S.van SchaikR.H.ChanD.W.SokollL.J.CruzA.B.MizrahiI.A. and CatalonaW.J., The prostate health index selectively identifies clinically significant prostate cancer, J Urol193 (2015), 1163–1169.
4.
GuazzoniG.LazzeriM.NavaL.LughezzaniG.LarcherA.ScattoniV.GaddaG.M.BiniV.CestariA.BuffiN.M.FreschiM.RigattiP. and MontorsiF., Preoperative prostate-specific antigen isoform p2PSA and its derivatives, %p2PSA and prostate health index, predict pathologic outcomes in patients undergoing radical prostatectomy for prostate cancer, Eur Urol61 (2012), 455–466.
5.
MaxeinerA.KilicE.MatalonJ.FriedersdorffF.MillerK.JungK.StephanC. and BuschJ., The prostate health index PHI predicts oncological outcome and biochemical recurrence after radical prostatectomy – analysis in 437 patients, Oncotarget8 (2017), 79279–79288.
6.
RussoG.I.RegisF.CastelliT.FavillaV.PriviteraS.GiardinaR.CiminoS. and MorgiaG., A systematic review and meta-analysis of the diagnostic accuracy of Prostate Health Index and 4-Kallikrein Panel Score in predicting overall and high-grade prostate cancer, Clin Genitourin Cancer15 (2017), 429–439.
7.
Sanchis-BonetA.Barrionuevo-GonzalezM.Bajo-ChuecaA.M.Pulido-FonsecaL.Ortega-PolledoL.E.Tamayo-RuizJ.C. and Sanchez-ChapadoM., Validation of the prostate health index in a predictive model of prostate cancer, Actas Urol Esp42 (2018), 25–32.
8.
HsiehP.F.LiW.J.LinW.C.ChangH.ChangC.H.HuangC.P.YangC.R.ChenW.C.ChangY.H. and WuH.C., Combining prostate health index and multiparametric magnetic resonance imaging in the diagnosis of clinically significant prostate cancer in an Asian population, World J Urol38 (2019), 1207–1214.
9.
GnanapragasamV.J.BurlingK.GeorgeA.StearnS.WarrenA.BarrettT.KooB.GallagherF.A.DobleA.KastnerC. and ParkerR.A., The Prostate Health Index adds predictive value to multi-parametric MRI in detecting significant prostate cancers in a repeat biopsy population, Sci Rep6 (2016), 35364.
10.
DuffyM.J., Biomarkers for prostate cancer: prostate-specific antigen and beyond, Clin Chem Lab Med58 (2020), 326–339.
11.
SainiS., PSA and beyond: alternative prostate cancer biomarkers, Cell Oncol (Dordr)39 (2016), 97–106.
12.
KearnsJ.T. and LinD.W., Improving the specificity of PSA Screening with serum and urine markers, Curr Urol Rep19 (2018), 80.
13.
FilellaX.Fernandez-GalanE.FernandezB.R. and FojL., Emerging biomarkers in the diagnosis of prostate cancer, Pharmgenomics Pers Med11 (2018), 83–94.
14.
VickersA.VertosickE.A.SjobergD.D.HamdyF.NealD.BjartellA.HugossonJ.DonovanJ.L.VillersA.ZappalaS. and LiljaH., Value of intact prostate specific antigen and human kallikrein 2 in the 4 kallikrein predictive model: an individual patient data meta-analysis, J Urol199 (2018), 1470–1474.
15.
TomlinsS.A.DayJ.R.LonigroR.J.HovelsonD.H.SiddiquiJ.KunjuL.P.DunnR.L.MeyerS.HodgeP.GroskopfJ.WeiJ.T. and ChinnaiyanA.M., Urine TMPRSS2:ERG plus PCA3 for individualized prostate cancer risk assessment, Eur Urol70 (2016), 45–53.
16.
FendlerA.StephanC.YousefG.M.KristiansenG. and JungK., The translational potential of microRNAs as biofluid markers of urological tumours, Nat Rev Urol13 (2016), 734–752.
17.
MovahedpourA.AhmadiN.GhasemiY.SavardashtakiA. and ShabaninejadZ., Circulating microRNAs as potential diagnostic biomarkers and therapeutic targets in prostate cancer: Current status and future perspectives, J Cell Biochem120 (2019), 16316–16329.
18.
FilellaX. and FojL., miRNAs as novel biomarkers in the management of prostate cancer, Clin Chem Lab Med55 (2017), 715–736.
19.
IbrahimN.H.AbdellateifM.S.ThabetG.KassemS.H.El-SalamM.A.El-LeithyA.A. and SelimM.M., Combining PHI and miRNAs as biomarkers in prostate cancer diagnosis and prognosis, Clin Lab65 (2019), 1159–1168.
20.
WittekindC.AsamuraH. and SobinL.H., TNM Atlas, Wiley-Backwell Publishing, Hoboken, New Jersey, US, 2014.
21.
EpsteinJ.I.EgevadL.AminM.B.DelahuntB.SrigleyJ.R. and HumphreyP.A., The 2014 International Society of Urological Pathology (ISUP) Consensus Conference on Gleason grading of prostatic carcinoma: definition of grading patterns and proposal for a new grading system, Am J Surg Pathol40 (2016), 244–252.
22.
JungK.StephanC.LeinM.BruxB.SinhaP.SchnorrD. and LoeningS.A., Receiver-operating characteristic as a tool for evaluating the diagnostic performance of prostate-specific antigen and its molecular forms – What has to be considered?Prostate46 (2001), 307–310.
23.
ShahJ.S.SoonP.S. and MarshD.J., Comparison of methodologies to detect low levels of hemolysis in serum for accurate assessment of serum microRNAs, PLoS One11 (2016), e0153200.
24.
BlondalT.JensbyN.S.BakerA.AndreasenD.MouritzenP.WrangT.M. and DahlsveenI.K., Assessing sample and miRNA profile quality in serum and plasma or other biofluids, Methods59 (2013), S1–S6.
25.
PritchardC.C.KrohE.WoodB.ArroyoJ.D.DoughertyK.J.MiyajiM.M.TaitJ.F. and TewariM., Blood cell origin of circulating microRNAs: a cautionary note for cancer biomarker studies, Cancer Prev Res (Phila)5 (2012), 492–497.
26.
KirschnerM.B.EdelmanJ.J.KaoS.C.VallelyM.P.van ZandwijkN. and ReidG., The impact of hemolysis on cell-free microRNA biomarkers, Front Genet4 (2013), 94.
27.
SemjonowA.KöpkeT.EltzeE.Pepping-SchefersB.BürgelH. and DarteC., Pre-analytical in-vitro stability of [-2]proPSA in blood and serum, Clin Biochem43 (2010), 926–928.
28.
DittadiR.FabricioA.S.C.RainatoG.PeroniE.DiT.F.VezzuB.MazzariolC.SquarcinaE.TammoneL. and GionM., Preanalytical stability of [-2]proPSA in whole blood stored at room temperature before separation of serum and plasma: implications to Phi determination, Clin Chem Lab Med57 (2019), 521–531.
29.
StephanC.JungK.SemjonowA.Schulze-ForsterK.CammannH.HuX.MeyerH.A.BogemannM.MillerK. and FriedersdorffF., Comparative assessment of urinary prostate cancer antigen 3 and TMPRSS2:ERG gene fusion with the serum [-2]proprostate-specific antigen-based prostate health index for detection of prostate cancer, Clin Chem59 (2013), 280–288.
30.
TölleA.BuckendahlL. and JungK., Plasma miR-15b-5p and miR-590-5p for distinguishing patients with bladder cancer from healthy individuals, Oncol Rep42 (2019), 1609–1620.
31.
LivakK.J. and SchmittgenT.D., Analysis of relative gene expression data using real-time quantitative PCR and the 2(-Delta Delta C(T)) Method, Methods25 (2001), 402–408.
32.
D’haeneB.MestdaghP.HellemansJ. and VandesompeleJ., miRNA expression profiling: from reference genes to global mean normalization, Methods Mol Biol822 (2012), 261–272.
33.
HellemansJ.MortierG.De PaepeA.SpelemanF. and VandesompeleJ., qBase relative quantification framework and software for management and automated analysis of real-time quantitative PCR data, Genome Biol8 (2007), R19.
34.
MestdaghP.Van VlierbergheP.De WeerA.MuthD.WestermannF.SpelemanF. and VandesompeleJ., A novel and universal method for microRNA RT-qPCR data normalization, Genome Biol10 (2009), R64.
35.
VandesompeleJ.De PreterK.PattynF.PoppeB.Van RoyN.De PaepeA. and SpelemanF., Accurate normalization of real-time quantitative RT-PCR data by geometric averaging of multiple internal control genes, Genome Biol3 (2002), RESEARCH0034.
36.
DeLongE.R.DeLongD.M. and Clarke-PearsonD.L., Comparing the areas under two or more correlated receiver operating characteristic curves: a nonparametric approach, Biometrics44 (1988), 837–845.
37.
SaitoT. and RehmsmeierM., The precision-recall plot is more informative than the ROC plot when evaluating binary classifiers on imbalanced datasets, PLoS One10 (2015), e0118432.
38.
VickersA.J. and ElkinE.B., Decision curve analysis: a novel method for evaluating prediction models, Med Decis Making26 (2006), 565–574.
39.
RochowH.JungM.WeickmannS.RallaB.StephanC.ElezkurtajS.KilicE.ZhaoZ.JungK.FendlerA. and FranzA., Circular RNAs and their linear transcripts as diagnostic and rognostic tissue biomarkers in prostate cancer after prostatectomy in combination with clinicopathological factors, Int J Mol Sci21 (2020), E7812.
40.
SinghP.K.PreusL.HuQ.YanL.LongM.D.MorrisonC.D.NeslineM.JohnsonC.S.KoochekpourS.KohliM.LiuS.TrumpD.L.Sucheston-CampbellL.E. and CampbellM.J., Serum microRNA expression patterns that predict early treatment failure in prostate cancer patients, Oncotarget5 (2014), 824–840.
41.
WatahikiA.MacfarlaneR.J.GleaveM.E.CreaF.WangY.HelgasonC.D. and ChiK.N., Plasma miRNAs as biomarkers to identify patients with castration-resistant metastatic prostate cancer, Int J Mol Sci14 (2013), 7757–7770.
42.
SrivastavaA.GoldbergerH.DimtchevA.RamalingaM.ChijiokeJ.MarianC.OermannE.K.UhmS.KimJ.S.ChenL.N.LiX.BerryD.L.KallakuryB.V.ChauhanS.C.CollinsS.P.SuyS. and KumarD., MicroRNA profiling in prostate cancer–the diagnostic potential of urinary miR-205 and miR-214, PLoS One8 (2013), e76994.
43.
SteyerbergE.W.PencinaM.J.LingsmaH.F.KattanM.W.VickersA.J. and Van CalsterB., Assessing the incremental value of diagnostic and prognostic markers: a review and illustration, Eur J Clin Invest42 (2012), 216–228.
44.
MitchellP.S.ParkinR.K.KrohE.M.FritzB.R.WymanS.K.Pogosova-AgadjanyanE.L.PetersonA.NoteboomJ.O’BriantK.C.AllenA.LinD.W.UrbanN.DrescherC.W.KnudsenB.S.StirewaltD.L.GentlemanR.VessellaR.L.NelsonP.S.MartinD.B. and TewariM., Circulating microRNAs as stable blood-based markers for cancer detection, Proc Natl Acad Sci USA105 (2008), 10513–10518.
SapreN.HongM.K.MacintyreG.LewisH.KowalczykA.CostelloA.J.CorcoranN.M. and HovensC.M., Curated microRNAs in urine and blood fail to validate as predictive biomarkers for high-risk prostate cancer, PLoS One9 (2014), e91729.
47.
EgidiM.G.CochettiG.ServaM.R.GuelfiG.ZampiniD.MechelliL. and MeariniE., Circulating microRNAs and kallikreins before and after radical prostatectomy: are they really prostate cancer markers?, Biomed Res Int2013 (2013), 241780.
48.
ChenH.LiuH.ZouH.ChenR.DouY.ShengS.DaiS.AiJ.MelsonJ.KittlesR.A.PiroozniaM.LiptayM.J.BorgiaJ.A. and DengY., Evaluation of plasma miR-21 and miR-152 as diagnostic biomarkers for common types of human cancers, J Cancer7 (2016), 490–499.
49.
ZhangH.L.YangL.F.ZhuY.YaoX.D.ZhangS.L.DaiB.ZhuY.P.ShenY.J.ShiG.H. and YeD.W., Serum miRNA-21: elevated levels in patients with metastatic hormone-refractory prostate cancer and potential predictive factor for the efficacy of docetaxel-based chemotherapy, Prostate71 (2011), 326–331.
50.
Garcia-EliasA.AllozaL.PuigdecanetE.NonellL.TajesM.CuradoJ.EnjuanesC.DiazO.BrugueraJ.Marti-AlmorJ.Comin-ColetJ. and BenitoB., Defining quantification methods and optimizing protocols for microarray hybridization of circulating microRNAs, Sci Rep7 (2017), 7725.
51.
GeeH.E.BuffaF.M.CampsC.RamachandranA.LeekR.TaylorM.PatilM.SheldonH.BettsG.HomerJ.WestC.RagoussisJ. and HarrisA.L., The small-nucleolar RNAs commonly used for microRNA normalisation correlate with tumour pathology and prognosis, Br J Cancer104 (2011), 1168–1177.
52.
ZhangY.JiangF.HeH.YeJ.MaoX.GuoQ.WuS.L.ZhongW.WuC.L. and LinN., Identification of a novel microRNA-mRNA regulatory biomodule in human prostate cancer, Cell Death Dis9 (2018), 301.
53.
RavegniniG.CargninS.SammariniG.ZanottiF.BermejoJ.L.HreliaP.TerrazzinoS. and AngeliniS., Prognostic role of miR-221 and miR-222 expression in cancer patients: a systematic review and meta-analysis, Cancers (Basel)11 (2019), E970.
54.
GotoY.KojimaS.NishikawaR.KurozumiA.KatoM.EnokidaH.MatsushitaR.yamazakiK.IshidaY.NakagawaM.NayaY.IchikawaT. and SekiN., MicroRNA expression signature of castration-resistant prostate cancer: the microRNA-221/222 cluster functions as a tumour suppressor and disease progression marker, Br J Cancer113 (2015), 1055–1065.
55.
SchaeferA.JungM.MollenkopfH.J.WagnerI.StephanC.JentzmikF.MillerK.LeinM.KristiansenG. and JungK., Diagnostic and prognostic implications of microRNA profiling in prostate carcinoma, Int J Cancer126 (2010), 1166–1176.
56.
WalterB.A.ValeraV.A.PintoP.A. and MerinoM.J., Comprehensive microRNA profiling of prostate cancer, J Cancer4 (2013), 350–357.
57.
SongC.ChenH.WangT.ZhangW.RuG. and LangJ., Expression profile analysis of microRNAs in prostate cancer by next-generation sequencing, Prostate75 (2015), 500–516.
58.
ChengB.HeQ.ChengY.YangH.PeiL.DengQ.LongH.ZhuL. and JiangR., A three-gene classifier associated with microRNA mediated regulation predicts prostate cancer recurrence after radical prostatectomy, Front Genet10 (2019), 1402.
59.
LinD.CuiF.BuQ. and YanC., The expression and clinical significance of GTP-binding RAS-like 3 (ARHI) and microRNA 221 and 222 in prostate cancer, J Int Med Res39 (2011), 1870–1875.
60.
PanigrahiG.K.RamtekeA.BirksD.Abouzeid AliH.E.VenkataramanS.AgarwalC.VibhakarR.MillerL.D.AgarwalR.Abd ElmageedZ.Y. and DeepG., Exosomal microRNA profiling to identify hypoxia-related biomarkers in prostate cancer, Oncotarget9 (2018), 13894–13910.
61.
FredsoeJ.RasmussenA.K.I.MouritzenP.BorreM.OrntoftT. and SorensenK.D., A five-microRNA model (pCaP) for predicting prostate cancer aggressiveness using cell-free urine, Int J Cancer145 (2019), 2558–2567.
62.
FredsoeJ.RasmussenA.K.I.LaursenE.B.CaiY.HowardK.A.PedersenB.G.BorreM.MouritzenP.OrntoftT. and SorensenK.D., Independent validation of a diagnostic noninvasive 3-microRNA ratio model (uCaP) for prostate cancer in cell-free urine, Clin Chem65 (2019), 540–548.
63.
BidarraD.ConstancioV.Barros-SilvaD.Ramalho-CarvalhoJ.Moreira-BarbosaC.AntunesL.MauricioJ.OliveiraJ.HenriqueR. and JeronimoC., Circulating microRNAs as biomarkers for prostate cancer detection and metastasis development prediction, Front Oncol9 (2019), 900.
64.
HoeyC.AhmedM.FotouhiG.A.VespriniD.HuangX.CommissoK.CommissoA.RayJ.FokasE.LoblawD.A.HeH.H. and LiuS.K., Circulating miRNAs as non-invasive biomarkers to predict aggressive prostate cancer after radical prostatectomy, J Transl Med17 (2019), 173.
65.
McDonaldA.C.ViraM.WalterV.ShenJ.RamanJ.D.SandaM.G.PatilD. and TaioliE., Circulating microRNAs in plasma among men with low-grade and high-grade prostate cancer at prostate biopsy, Prostate79 (2019), 961–968.
66.
McDonaldA.C.RamanJ.D.ShenJ.LiaoJ.PandyaB. and ViraM.A., Circulating microRNAs in plasma before and after radical prostatectomy, Urol Oncol37 (2019), 814.
67.
SchmidtL.FredsoeJ.KristensenH.StrandS.H.RasmussenA.HoyerS.BorreM.MouritzenP.OrntoftT. and SorensenK.D., Training and validation of a novel 4-miRNA ratio model (MiCaP) for prediction of postoperative outcome in prostate cancer patients, Ann Oncol29 (2018), 2003–2009.
68.
TinayI.TanM.GuiB.WernerL.KibelA.S. and JiaL., Functional roles and potential clinical application of miRNA-345-5p in prostate cancer, Prostate78 (2018), 927–937.
69.
GersztenR.E. and WangT.J., The search for new cardiovascular biomarkers, Nature451 (2008), 949–952.
70.
FranzA.RallaB.WeickmannS.JungM.RochowH.StephanC.ErbersdoblerA.KilicE.FendlerA. and JungK., Circular RNAs in clear cell renal cell carcinoma: their microarray-based identification, analytical validation, and potential use in a clinico-genomic model to improve prognostic accuracy, Cancers (Basel)11 (2019), E1473.
71.
FalagarioU.G.MartiniA.WajswolE.TreacyP.J.RatnaniP.JamborI.AnastosH.LewisS.HainesK.CormioL.CarrieriG.RastinehadA.R.WiklundP. and TewariA., Avoiding unnecessary magnetic resonance Imaging (MRI) and biopsies: negative and positive predictive value of MRI according to prostate-specific antigen density, 4Kscore and risk calculators, Eur Urol Oncol3 (2020), 700–704.