This study aimed to evaluate the association of potential functional tagging single nucleotide polymorphisms (tagSNPs) in BRAF and TSHR with papillary thyroid cancer (PTC). Two tagSNPs (rs6464149 and rs7810757) in BRAF and six tagSNPs (rs17630128, rs2075179, rs7144481, rs2371462, rs2268477, and rs2288496) in TSHR were genotyped in 300 cases of PTC and 252 healthy controls. There was no difference in the genotype frequencies of BRAF and TSHR between PTC patients and control subjects, suggesting no contribution of BRAF or TSHR polymorphisms to the susceptibility to PTC. We observed that a tagSNP located in the 3’ untranslated region of TSHR, rs2288496, could affect the incidence of lymph node metastasis (LNM). The variant TC and TC CC genotypes conferred an increased risk of LNM (for TC vs. TT: odds ratio (OR) 2.01, 95% confidence interval (CI): 1.07–3.77; 0.030; for TC CC vs. TT: OR 1.87, 95% CI: 1.04–3.39, 0.038). Moreover, subjects carrying variant genotypes had higher TSH levels and lower thyroxine (T4) and Anti-TG levels compared with those in subjects carrying common genotypes. Our findings showed that PTC patients carrying the TSHR rs2288496 TC and CC variants were associated with higher TSH level and lower T4 and Anti-TG levels and were prone to developing LNM. To confirm these results, additional studies and functional experiments, especially in other ethnic populations, are needed.
The incidence rate of papillary thyroid carcinoma (PTC) has grown rapidly. Finding susceptibility gene locus for this disease and its clinical phenotype could provide new thought and method for the preventive treatment of PTC. BRAF (7q34; encoding B-Raf serine/threonine-protein) and TSHR (14q31; encoding thyroid stimulating hormone receptor) have been proposed as candidate driver genes in PTC [1, 2]. Mutations in BRAF have been identified as dominant genetic alterations in papillary thyroid cancer [3]. Somatic mutations in TSHR have been reported in follicular variant papillary thyroid cancer and follicular thyroid cancer [4]. BRAF mutations are confirmed to confer a risk of distinctive pathological and phenotypic features of thyroid cancer [5, 6]. In particular, BRAF gene-altered status showed a close association with TSHR gene promoter hypermethylation [1]. Most of the thyroid tumors that harbored BRAF mutations were had hypermethylated TSHR promoters and decreased TSHR gene expression [1]. These two genes showed a biological interaction in thyroid tumors; therefore they were selected as candidate genes in this study.
Single nucleotide polymorphisms (SNPs), the most common variation in the population, underlie differences in our susceptibility to a wide range of diseases. So far, a large amount of SNPs have been found for BRAF and TSHR. There is little information on these SNPs and the susceptibility to PTC. The association between common SNPs of these two genes and PTC still requires further investigation. Therefore, to comprehensively assess the role of BRAF and TSHR polymorphisms, we employed a candidate gene association study strategy using potentially functional tagging SNPs (tagSNPs) in these genes. The individual and combined effects on the risk of PTC and their relationship with clinical phenotype were tested.
Baseline characteristics of the study population
Parameters
Control
PTC
value
Total ( 1042)
252
298
Age in years (mean SD)
42.35 11.82
40.37 12.18
0.055
Range
17–75
6–74
Sex
0.549
Male
91 (36.1%)
115 (38.6%)
Female
161 (63.9%)
183 (61.4%)
Common SNPs captured using the selected 8 tagSNPs in the BRAF and TSHR genes based on the HapMap population data for Chinese in Beijing (release 27)
This research protocol was authorized by the Ethics Committee of Sun Yat-sen University Cancer Center. At their first visit, all patients signed the informed consent. 300 cases of PTC and 252 health volunteers were included in the genetic association study. All the included subjects were ethnic Chinese, which received physical examination or surgical treatment in Sun Yat-sen University Cancer Center between July 2011 and June 2016. Ultrasound and serum examination showed the healthy subjects comprised individuals have normal thyroid gland and normal thyroid function. Healthy subjects exclusion criteria: Hashimoto’s thyroiditis, nodular goiter, or other benign diseases of thyroid, history of other malignancies. The geographical characteristics of the matched study populations were summarized in Table 1.
The clinical data, the pathologic features of the tumors, and the parameters of thyroid function were obtained by reviewed the clinicopathologic data. Pathological sections were reviewed by two pathologists to make sure the diagnosis is right. We used National Comprehensive Cancer Network (NCCN Guidelines, Version 2, 2018) to stage the tumor.
Association between BRAF and TSHR tagSNPs and the TNM stage of thyroid cancer
Association between BRAF and TSHR tagSNPs and the pathological features of thyroid cancer
TagSNP
Extrathyroid extension
No. of lesions
Concomitant thyroid benign diseases
No. of no/yes
OR (95% CI)
No. of single/ multiple lesions
OR (95% CI)
No. of no/yes
OR (95% CI)
BRAF_rs6464149
AA
124/109
1 (ref)
115/109
1 (ref)
100/133
1 (ref)
CA
35/23
0.75 (0.42–1.34)
0.328
35/23
0.70 (0.39–1.27)
0.239
24/34
1.11 (0.61–2.01)
0.733
CC
0/3
/
/
2/1
0.50 (0.04–5.73)
0.575
1/2
0.27 (0.02–3.06)
0.288
CC CA vs. AA
0.85 (0.48–1.50)
0.567
0.69 (0.39–1.23)
0.204
1.04 (0.58–1.85)
0.901
CC vs. AA CA
/
/
0.48 (0.04–5.49)
0.558
0.29 (0.03–3.33)
0.321
BRAF_rs7810757
TT
130/113
1 (ref)
120/117
1 (ref)
103/140
1 (ref)
TC
23/20
0.96 (0.50–1.85)
0.907
27/14
0.55 (0.27–1.11)
0.094
18/25
1.01 (0.52–1.98)
0.975
CC
1/2
2.39 (0.21–26.86)
0.481
2/1
0.56 (0.05–6.31)
0.637
2/1
0.45 (0.04–5.18)
0.518
CC TC vs. TT
1.02 (0.54–1.92)
0.954
0.55 (0.28–1.08)
0.084
0.96 (0.50–1.83)
0.896
CC vs. TT TC
2.36 (0.21–26.43)
0.487
0.60 (0.05–6.72)
0.677
0.44 (0.04–5.08)
0.511
TSHR_rs17630128
TT
76/68
1 (ref)
71/69
1 (ref)
60/84
1 (ref)
TC
61/55
1.00 (0.61–1.64)
1
61/50
0.85 (0.51–1.41)
0.521
53/63
0.77 (0.46–1.28)
0.305
CC
19/11
0.65 (0.29–1.46)
0.296
17/13
0.78 (0.35–1.75)
0.553
10/20
1.45 (0.61–3.41)
0.397
CC TC vs. TT
0.91 (0.57–1.45)
0.697
0.84 (0.52–1.34)
0.459
0.88 (0.55–1.42)
0.6
CC vs. TT TC
0.65 (0.30–1.42)
0.275
0.84 (0.39–1.81)
0.655
1.61 (0.71–3.63)
0.255
TSHR_rs2075179
TT
70/66
1 (ref)
62/69
1 (ref)
58/78
1 (ref)
TC
73/50
0.72 (0.44–1.19)
0.201
72/47
0.83 (0.63–1.09)
0.177
53/70
0.98 (0.60–1.62)
0.943
CC
16/20
1.40 (0.66–2.95)
0.382
18/18
1.00 (0.65–1.53)
0.987
15/21
1.14 (0.53–2.46)
0.732
CC TC vs. TT
0.84 (0.53–1.33)
0.448
0.85 (0.66–1.10)
0.222
1.02 (0.64–1.63)
0.948
CC vs. TT TC
1.58 (0.78–3.19)
0.206
1.11 (0.74–1.67)
0.615
1.15 (0.56–2.37)
0.7
TSHR_rs7144481
TT
102/97
1 (ref)
98/95
1 (ref)
87/112
1 (ref)
TC
50/30
0.64 (0.37–1.09)
0.097
47/31
0.68 (0.40–1.17)
0.165
33/47
1.14 (0.67–1.95)
0.623
CC
4/7
1.98 (0.55–7.15)
0.295
4/7
1.60 (0.45–5.71)
0.470
2/9
3.12 (0.64–15.11)
0.158
CC TC vs. TT
0.73 (0.44–1.21)
0.22
0.76 (0.46–1.27)
0.294
1.27 (0.76–2.13)
0.361
CC vs. TT TC
2.21 (0.63–7.81)
0.218
1.82 (0.52–6.42)
0.352
3.25 (0.68–15.61)
0.141
TSHR_rs2371462
CC
60/63
1 (ref)
56/62
1 (ref)
51/72
1 (ref)
TC
78/53
0.65 (0.40–1.08)
0.094
75/55
0.66 (0.40–1.10)
0.110
61/70
0.84 (0.51–1.39)
0.495
TT
20/16
0.74 (0.3501.57)
0.433
21/12
0.53 (0.24–1.18)
0.120
13/23
1.31 (0.60–2.89)
0.501
TT TC vs. CC
0.67 (0.42–1.08)
0.1
0.63 (0.39–1.02)
0.059
0.92 (0.57–1.49)
0.732
TT vs. CC TC
0.94 (0.46–1.90)
0.857
0.66 (0.31–1.40)
0.655
1.40 (0.67–2.91)
0.374
TSHR_rs2268477
CC
69/62
1 (ref)
70/58
1 (ref)
50/81
1 (ref)
CA
72/53
0.80 (0.48–1.31)
0.367
67/53
0.99 (0.59–1.64)
0.952
58/67
0.70 (0.42–1.16)
0.162
AA
16/21
1.45 (0.70–3.03)
0.321
14/22
1.89 (0.89–4.03)
0.098
17/20
0.72 (0.34–1.54)
0.4
AA CA vs. CC
0.92 (0.58–1.46)
0.708
1.14 (0.71–1.84)
0.576
0.69 (0.43–1.12)
0.136
AA vs. CC CA
1.63 (0.81–3.28)
0.168
1.96 (0.95–4.02)
0.068
0.88 (0.44–1.79)
0.728
TSHR_rs2288496
TT
115/89
1 (ref)
109/90
1 (ref)
87/117
1 (ref)
TC
41/40
1.30 (0.77–2.19)
0.319
39/38
1.16 (0.68–1.98)
0.580
37/44
0.90 (0.53–1.53)
0.707
CC
2/7
4.52 (0.91–22.39)
0.065
5/4
1.04 (0.27–4.04)
0.953
3/6
1.62 (0.39–6.81)
0.51
CC TC vs. TT
1.45 (0.88–2.40)
0.145
1.4 (0.69–1.90)
0.612
0.96 (0.58–1.59)
0.867
CC vs. TT TC
4.22 (0.86–20.78)
0.077
1.00 (0.26–3.85)
1.000
1.70 (0.41–7.10)
0.47
Analyses results with 0.05 were highlighted in bold. BRAF, B-Raf serine/threonine-protein; TSHR, thyroid stimulating hormone receptor; tagSNP; tagging single nucleotide polymorphism.
Haplotype analysis of TSHRtagSNPs for the risk of the occurrence of lymph node metastasis
Haplotype for TSHR
Case (freq)
Control (freq)
Fisher’s
OR (95% CI)
C C T C C T
24.53 (6.8%)
7.23 (4.3%)
0.199
1.74 (0.74–4.07)
C C T T C T
7.41 (2.0%)
7.37 (4.4%)
0.165
0.49 (0.17–1.37)
C T T C C T
50.99 (14.1%)
20.05 (11.9%)
0.341
1.31 (0.75–2.28)
C T T T C T
29.11 (8.0%)
13.35 (7.9%)
0.805
1.09 (0.55–2.15)
T C C C C T
29.07 (8.0%)
14.77 (8.8%)
0.934
0.97 (0.50–1.88)
T C C T C T
17.46 (4.8%)
5.80 (3.5%)
0.39
1.52 (0.58–3.96)
T C T C C C
15.24 (4.2%)
6.82 (4.1%)
0.822
1.11 (0.44–2.80)
T T C C C T
6.44 (1.8%)
12.42 (7.4%)
0.002
0.24 (0.09–0.64)
T T T C A T
62.46 (17.3%)
37.60 (22.4%)
0.288
0.78 (0.49–1.23)
T T T C C C
34.39 (9.5%)
11.66 (6.9%)
0.236
1.52 (0.76–3.04)
T T T T A T
43.78 (12.1%)
21.92 (13.0%)
0.967
0.99 (0.57–1.72)
Analyses results with 0.05 were highlighted in bold characters. TSHR, thyroid stimulating hormone receptor; OR, odds ratio; tagSNP; tagging single nucleotide polymorphism.
Relationship between TSHR rs2288496 and thyroid function in patients with papillary thyroid cancer with or without lymph node metastasis
Thyroid function
Total PTC patients
PTC without lymph node metastasis
PTC with lymph node metastasis
TT
TC
CC
CC TC
TT
TC
CC
CC TC
TT
TC
CC
CC TC
T3
Mean
1.61
1.61
1.77
1.62
1.53
1.44
1.95
1.52
1.65
1.65
1.67
1.65
value
0.793
0.830
0.990
T4
Mean
105.24
98.46
101.70
98.79
96.39
97.69
127.10
102.34
110.15
98.65
89.01
97.83
value
0.024
0.179
0.001
fT3
Mean
4.73
4.70
5.13
4.74
4.48
4.32
5.31
4.48
4.87
4.79
5.04
4.81
value
0.918
0.524
0.609
fT4
Mean
17.60
16.79
15.11
16.62
15.93
16.37
16.37
16.37
18.52
16.90
14.47
16.69
value
0.044
0.392
0.003
TSH
Mean
2.09
2.60
2.36
2.58
2.17
2.51
2.24
2.47
2.05
2.63
2.42
2.61
value
0.015
0.013
0.022
ATPO
Mean
45.02
56.42
16.16
52.35
50.65
19.55
11.35
18.25
41.89
65.64
18.56
61.6
value
0.577
0.013
0.219
Anti-TG
Mean
151.13
101.35
43.34
95.48
117.88
142.66
18.43
123.04
311.76
91.02
55.80
88.00
value
0.006
0.942
0.004
TG
Mean
151.13
174.90
223.89
179.86
49.30
328.17
43.77
283.26
207.97
136.59
313.95
151.79
value
0.803
0.385
0.714
PTH
Mean
40.56
36.73
37.19
36.78
41.42
38.90
26.78
36.99
40.10
36.18
42.39
36.72
value
0.136
0.224
0.303
Abbreviation: Analysis performed using the Student-T test. Associations that reached statistical significance were highlighted in bold. Abbreviation: ATPO, anti-thyroid peroxidase antibody; fT3, free triiodothyronine; fT4, free thyroxine; T3, triiodothyronine; T4, thyroxine; TG, thyroglobulin; TSH, thyroid stimulating hormone; PTH, parathyroid hormone; PTC, papillary thyroid carcinoma.
Relationship between TSHR rs2288496 and thyroid function in patients with PTC with or without concomitant benign diseases
Thyroid function
PTC without concomitant benign diseases
PTC with concomitant benign diseases
TT
TC
CC
CC TC
TT
TC
CC
CC TC
T3
Mean
1.64
1.60
1.86
1.62
1.59
1.61
1.72
1.63
value
0.824
0.573
T4
Mean
106.24
100.07
119.80
101.58
104.50
97.15
92.66
96.61
value
0.322
0.027
fT3
Mean
4.82
4.71
5.10
4.74
4.67
4.69
5.15
4.75
value
0.575
0.553
fT4
Mean
17.89
17.13
14.92
16.96
17.38
16.52
15.20
17.38
value
0.235
0.096
TSH
Mean
2.06
2.76
3.07
2.78
2.11
2.48
2.00
2.10
value
0.040
0.173
ATPO
Mean
39.92
35.64
12.42
33.86
48.79
73.42
18.03
48.79
value
0.747
0.323
Anti-TG
Mean
219.40
59.81
69.69
60.57
259.89
135.34
30.17
259.89
value
0.021
0.211
TG
Mean
85.58
52.01
33.05
50.55
199.17
275.46
319.31
199.17
value
0.531
0.680
PTH
Mean
39.09
38.06
30.25
37.45
41.64
35.67
40.66
41.64
value
0.565
0.168
, the concomitant benign diseases included Hashimoto’s thyroiditis and nodular goiter. Abbreviation: Analysis performed using the Student-T test. Associations that reached statistical significance are highlighted in bold. Abbreviation: ATPO, anti-thyroid peroxidase antibody; fT3, free triiodothyronine; fT4, free thyroxine; T3, triiodothyronine; T4, thyroxine; TG, thyroglobulin; TSH, thyroid stimulating hormone; PTH, parathyroid hormone; PTC, papillary thyroid carcinoma.
TagSNP selection
We extracted the gene regions of BRAF and TSHR from HapMap genotype data of the Chinese Han Beijing (CHB) population (Release 27, Phase I II III, http://www.HapMap.org) in 2016. There are 104 common SNPs (minor allele frequency (MAF) 0.05) in BRAF gene and 217 common SNPs in the TSHR gene. Haploview software was employed to select tagSNPs [7]. On account of pairwise linkage disequilibrium information to maximally represent ( 0.8) common SNPs (MAF 0.05), tagSNPs were chosen using Haploview 4.2 [7]. We employed bioinformatic searches to prioritize the tagSNPs for genotyping, in view of their predicted functional effects (http://snpinfo.niehs.nih.gov/).
DNA isolation and genotyping of BRAF and TSHR tagSNPs
3 mL blood sample was taken for DNA extracting from each subject. Routine phenol-chloroform method was employed to get genome DNA which was isolated from lymphocytes of peripheral blood, as previously described [7]. For genotyping, we diluted DNA sample to 30 ng/ L. Gene Company Limited (Shanghai, China) performed the assay design and SNP genotyping using the KASPar platform [8]. All specimens were put in 384-well plates at random. Fifty randomly selected specimens received genotyping repeatedly, which showed 100% concordance.
Statistical analysis
To measure the strength of the association between the genotype and the risk and pathological parameters of PTC, odds ratio (OR) and corresponding 95% confidence interval (CI) were calculated. The genetic effect of a single tagSNP was evaluated by using multivariate regression analysis, controlling for sex and age. For the haplotype analysis, we set the other haplotypes pooled together as a reference, and assessed the genetic effect of each haplotype with a frequency of at least more than 0.03 in the healthy controls. Differences in thyroid function parameters between two groups of genotypes were analyzed using Student’s T test. SPSS 17.0 software (IBM Corp., Armonk, NY, USA) was employed for all statistical analyses. Haplotype analysis was performed using the online software SHEsis (http://analysis.bio-x.cn/myAnalysis.php). All values were two sided. value 0.05 was considered statistically significant. The authenticity of this article has been validated by uploading the key raw data onto the Research Data Deposit public platform (www.researchdata.org.cn), with the approval RDD number as RDDA2019001161.
Results
Function prediction of tagSNPs for BRAF and TSHR
Two tagSNPs (rs6464149 and rs7810757) located in the 5’ untranslated region (UTR) of BRAF were selected because they were predicted to alter the binding activity of certain transcription factors. In addition, six tagSNPs (rs2371462, rs2288496, rs2268477, rs7144481, rs17630128, and rs2075179) for TSHR were genotyped for their potential function in altering the binding activity of certain transcription factors and microRNAs, or affecting the splicing process. The potential functions of the eight tagSNPs were summarized in Table 2.
Association between BRAF and TSHR tagSNPs and papillary thyroid cancer risk
First, we analyzed the individual effect of the tagSNPs on PTC risk. There were no differences in the genotype frequencies of the two tagSNPs in BRAF or the six tagSNPs in TSHR between the patients with thyroid cancer and the control subjects (Table 3). The combined effect of multiple tagSNPs was further calculated by performing haplotype analysis; however, the results did not reach statistical significance (all values 0.05; data not shown). We then explored the interaction effect between the genotypes of BRAF and TSHR on PTC risk using the likelihood ratio test of the full regression model. However, the interaction effect was also not statistically significant (all values 0.05; data not shown). These results suggested no contribution of these polymorphisms to susceptibility to PTC.
Association between BRAF and TSHR tagSNPs and the clinicopathologic characteristics of papillary thyroid cancer
The relationship between the genotypes and the clinicopathologic characteristics of PTC was analyzed (Table 4). When compared with the common TT genotype, TC variant and TC CC variants at the rs2288496 site of TSHR were associated with the incidence of lymph node metastasis (LNM). The variant TC and TC CC genotypes conferred increased risks of lymph node metastasis (for TC vs. TT: OR 2.01, 95% CI: 1.07–3.77; 0.030; for TC CC vs. TT: OR 1.87, 95% CI: 1.04–3.39, 0.038). No relationship was observed between the genotypes and T stage, extrathyroid extension, number of cancer lesions, and the incidence of concomitant thyroid benign diseases in PTC (Tables 4 and 5).
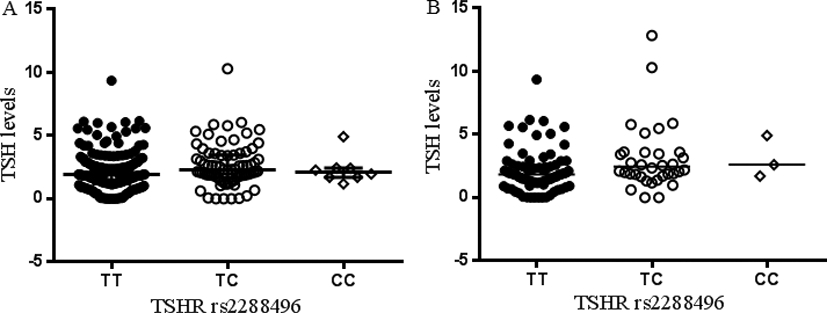
Scatter plot for TSHR rs2288496 and TSH levels in plasma. A, for all patients with thyroid cancer; B, for patients with thyroid cancer without concomitant benign diseases. TSHR, thyroid stimulating hormone receptor.
When we considered the combined effect of TSHR tagSNPs, the TTCCC haplotype of rs17630128-rs2075 179-rs7144481-rs2371462-rs2268477-rs2288496 consisted of the protective allele C at the rs2288496 site, which conferred a decreased risk of the incidence of lymph node metastasis (OR 0.24, 95% CI: 0.09–0.64, 0.002, Table 6). That is to say, the risk of the incidence of lymph node metastasis in patients with PTC carrying the reference haplotype, comprising the other haplotypes pooled together, was 4.17-fold higher than that in patients with the TTCCC haplotype.
Association between TSHR rs2288496 and thyroid function of papillary thyroid cancer
The observed association for TSHR rs2288496 pro- mpted us to further explore whether TSHR rs2288496 variants influence pre-operative thyroid function of PTC patients. Patients carrying TC and CC variants had higher pre-operative TSH levels compared with those of patients carrying the common TT genotype (Fig. 1A and Table 7; for TT, TC and CC: 2.09, 2.60 and 2.36, respectively). In addition, we observed reduced serum levels of thyroxine (T4), free thyroxine (fT4), and Anti-thyroglobulin (TG) in carriers with the TC and CC variants (Table 7).
We further performed stratification analysis because of the observation of an association between rs2288496 genotypes and the occurrence of lymph node metastasis (Table 7). The association of the rs2288496 genotypes with TSH levels was consistent in the subpopulation with or without lymph node metastasis. Meanwhile, decreased levels of T4, fT4, and Anti-TG only existed in the subpopulation with lymph node metastasis. We then asked whether there is a potential confounding effect of the concomitance of benign thyroid diseases (Table 8). Serum levels of TSH were significantly elevated in the patients with PTC without concomitance of benign thyroid diseases (Fig. 1B and Table 8; for TT, TC, and CC: 2.09, 2.60 and 2.36, respectively). Moreover, the levels of Anti-TG decreased dramatically in these patients. In contrast, for the patients with PTC and the concomitance of benign thyroid diseases, including Hashimoto’s thyroiditis and nodular goiter, no statistical association of genotype with TSH was observed; however, gradually decreased levels of T4 and fT4 were observed in these patients.
Discussion
We studied the common polymorphisms of TSHR in thyroid tumors, showing that cases of PTC carrying the TSHR rs2288496 TC and CC variants are prone to develop lymph node metastasis. Moreover, higher TSH levels and lower T4, fT4, and Anti-TG levels were linked to rs2288496 variants, which may partly explain the connection with an increased risk of lymph node metastasis in such populations. However, the selected tagSNPs of BRAF were not associated with the pathogenesis and prognosis of PTC.
The TSHR gene is found on chromosome 14q31. It consists of ten exons in the canonical transcript variant 1. The protein encoded by this gene is a membrane protein and a major controller of thyroid cell metabolism, which exerts specific physiological effects in the thyroid gland. Genetic variations of THSR have been documented in several diseases. TSHR mutations frequently occur in hyperfunction thyroid nodules, but exhibit a relatively low prevalence when these hyperfunction thyroid adenomas transform to thyroid carcinomas [9]. TSHR mutations were also identified in other malignancies, such as hepatocellular carcinoma [10]. For the common polymorphisms, more than 300 SNPs have been proven for TSHR in the NCBI SNP database according to the 1000 Genomes Project. TSHR SNPs have been frequently studied in Graves’ disease [11, 12]. Dechairo et al. investigated 40 SNPs of THSR and found that 10 were associated with the risk of Graves’ disease [11]. However, no study has reported the association of TSHR SNPs with thyroid cancer.
In the present study, we initially revealed an association between TSHR rs2288496 and an increased risk of the incidence of lymph node metastasis. In addition, there was joint effect of TSHR rs17630128-s2075179-rs7144481-rs2371462-rs2268477-rs2288496 loci, de- monstrating a genetic role of the TTCCC haplotype, comprising the protective allele C at the rs2288496 site that reduced the risk of the occurrence of lymph node metastasis. The mechanisms accounting for the requirement of TSHR rs2288496 variants for PTC metastasis are unknown. Polymorphic rs2288496 is located in the 3’ UTR, which is the potential binding site for certain microRNAs (miRNAs). We hypothesized that the allelic transition from T to C at this site of might alter the binding affinity of hsa-miR-628-5p (http://snpinfo.niehs.nih.gov/). MiRNAs generally function as negative gene regulators of targeted genes [13]. Therefore, one possibility is that rs2288496 variant interacts with miRNAs and contributes to regulating the expression of TSHR, which may play a role in thyroid disease and cancer. Our observation that thyroid tumors with rs2288496 variant related to higher TSH and lower T4 levels may indirectly support this speculation.
TSH is a specific ligand of TSHR in the thyroid gland. The repression of THSR expression would increase the secretion of TSH, which might further induce a negative-feedback mechanism on T4 production. These hormones synergistically engage in crosstalk in TSHR signaling. An increase in TSH/ TSHR signaling triggers an increase in the levels of downstream enzymes, such as manganese superoxide dismutase and dual-specific phosphatase 6, which eventually results in the production of oncogenic proteins, such as c-Myc [2]. A simultaneous increase in serum TSH in response to hypothyroidism (common in autoimmune diseases such as Hashimoto’s thyroiditis) would cause senescent tumor cells to overcome oncogene-induced senescence and proceed towards malignancy, thus demonstrating the importance of TSH/TSHR signaling in the development of papillary thyroid cancer [2, 14, 15, 13]. These findings may help to explain the increased risk of thyroid cancer developing lymph node metastasis conferred by the TSHR rs2288496 risky allele.
There were some limitations in this study. Our study sample size of thyroid cancer patients was relatively small, especially for the subjects with distant metastasis; therefore, the influence of TSHR polymorphisms on distant metastasis might be underestimated. In the present study, we only considered the findings for the relationship between TSHR rs2288496 and TSH expression as a preliminary exploration. This was an exploratory study providing some clues relating to a link between TSHR polymorphisms and TSH and phenotypic outcome in papillary thyroid cancer; therefore, further studies in a larger population or in an independent population, and on the biological function of this polymorphism, are warranted to further validate our findings.
Conclusion
Our study strongly suggested that variants of TSHR rs2288496 in thyroid carcinoma are associated with the occurrence of lymph node metastasis. A close link between TSHR rs2288496 and elevated TSH levels and decreased T4 levels was also established. Our findings demonstrated the potential for future research based on the effects of TSHR common polymorphisms on the phenotypic outcomes of thyroid carcinoma. Further functional experiments and independent large-scale studies, especially in other ethnic populations, are needed to confirm these results.
Footnotes
Acknowledgments
This work was funded by the National Natural Science Foundation of China [grant number 81602426 and 81802950]; and the Natural Science Foundation of Guangdong Province, China [grant number 2016A030310198 and 2017A030313865].
Conflict of interest
The authors declare that there is no conflict of interest.
References
1.
KhanM.S.PandithA.A.MasoodiS.R.WaniK.A.Ul HussainM. and MudassarS., Epigenetic silencing of TSHR gene in thyroid cancer patients in relation to their BRAF V600E mutation status, Endocrine47 (2014), 449–455.
2.
MoulanaF.I.PriyaniA.A.H.de SilvaM.V.C. and DassanayakeR.S., BRAF-oncogene-induced senescence and the role of thyroid-stimulating hormone signaling in the progression of papillary thyroid carcinoma, Horm Cancer9 (2018), 1–11.
3.
Integrated genomic characterization of papillary thyroid carcinoma, Cell159 (2014), 676–690.
4.
NikiforovaM.N.WaldA.I.RoyS.DursoM.B. and NikiforovY.E., Targeted next-generation sequencing panel (ThyroSeq) for detection of mutations in thyroid cancer, J Clin Endocrinol Metab98 (2013), E1852–1860.
5.
XingM.WestraW.H.TufanoR.P.CohenY.RosenbaumE.RhodenK.J.CarsonK.A.VaskoV.LarinA.TalliniG.TolaneyS.HoltE.H.HuiP.UmbrichtC.B.BasariaS.EwertzM.TufaroA.P.CalifanoJ.A.RingelM.D.ZeigerM.A.SidranskyD. and LadensonP.W., BRAF mutation predicts a poorer clinical prognosis for papillary thyroid cancer, J Clin Endocrinol Metab90 (2005), 6373–6379.
6.
EliseiR.UgoliniC.ViolaD.LupiC.BiaginiA.GianniniR.RomeiC.MiccoliP.PincheraA. and BasoloF., BRAF (V600E) mutation and outcome of patients with papillary thyroid carcinoma: A 15-year median follow-up study, J Clin Endocrinol Metab93 (2008), 3943–3949.
7.
HeC.TuH.SunL.XuQ.LiP.GongY.DongN. and YuanY., Helicobacter pylori-related host gene polymorphisms associated with susceptibility of gastric carcinogenesis: a two-stage case-control study in Chinese, Carcinogenesis34 (2013), 1450–1457.
8.
WangB.XuQ.YangH.W.SunL.P. and YuanY., The association of six polymorphisms of five genes involved in three steps of nucleotide excision repair pathways with hepatocellular cancer risk, Oncotarget7 (2016), 20357–20367.
9.
MonS.Y.RiedlingerG.AbbottC.E.SeethalaR.OhoriN.P.NikiforovaM.N.NikiforovY.E. and HodakS.P., Cancer risk and clinicopathological characteristics of thyroid nodules harboring thyroid-stimulating hormone receptor gene mutations, Diagn Cytopathol46 (2018), 369–377.
10.
ShihY.L.HuangY.H.LinK.H.ChuY.D. and YehC.T., Identification of functional thyroid stimulating hormone receptor and TSHR gene mutations in hepatocellular carcinoma, Anticancer Res38 (2018), 2793–2802.
11.
DechairoB.M.ZabanehD.CollinsJ.BrandO.DawsonG.J.GreenA.P.MackayI.FranklynJ.A.ConnellJ.M.WassJ.A.WiersingaW.M.HegedusL.BrixT.RobinsonB.G.HuntP.J.WeetmanA.P.CareyA.H. and GoughS.C., Association of the TSHR gene with Graves’ disease: The first disease specific locus, Eur J Hum Genet13 (2005), 1223–1230.
12.
XiongH.WuM.YiH.WangX.WangQ.NadirshinaS.ZhouX. and LiuX., Genetic associations of the thyroid stimulating hormone receptor gene with graves diseases and graves ophthalmopathy: A meta-analysis, Sci Rep6 (2016), 30356.
13.
BartelD.P., MicroRNAs: Genomics, biogenesis, mechanism, and function, Cell116 (2004), 281–297.
14.
BoelaertK.HoracekJ.HolderR.L.WatkinsonJ.C.SheppardM.C. and FranklynJ.A., Serum thyrotropin concentration as a novel predictor of malignancy in thyroid nodules investigated by fine-needle aspiration, J Clin Endocrinol Metab91 (2006), 4295–4301.
15.
HaymartM.R.RepplingerD.J.LeversonG.E.ElsonD.F.SippelR.S.JaumeJ.C. and ChenH., Higher serum thyroid stimulating hormone level in thyroid nodule patients is associated with greater risks of differentiated thyroid cancer and advanced tumor stage, J Clin Endocrinol Metab93 (2008), 809–814.