
Abstract
INTRODUCTION:
To study the relationship between the tumor heterogeneity based on CT and overall survival (OS) in oesophageal squamous cell carcinoma treated with chemotherapy and radiation therapy (CRT).
METHODS:
Fifty-seventh clinical patients who underwent definitive CRT were analyzed. The results were analyzed in terms of whole-tumor texture, with quantification of entropy, mean gray-level intensity for fine to coarse textures (filters 1.0–2.5, respectively). The association between texture parameters and survival time was assessed by Kaplan-Meier analysis and a Cox proportional hazards model.
RESULTS:
The median, 1 and 3 years OS, were 20.2 months, 75.4%, and 32.1%. In the univariate analysis performed using the log-rank test found global entropies (
CONCLUSION:
Pretreatment texture parameters are associated with survival time, and the combination of post volume performed better in survival models.
Introduction
In 2015, an estimated 477.9/100,000 cases of oesophageal cancer (EC) were diagnosed in China, and approximately 375/100,000 people died from this disease [1, 2]. Most patients at diagnosis already have locally advanced oesophageal cancer. Curative chemo-therapy and radiation therapy (CCRT) or preoperative CRT were standard treatment for locally advanced squamous cell carcinoma [3]. The prediction of overall survival before treatment initiation may be of important to the optimization of disease management. Currently, the routine clinical use of imaging in oesophageal cancer risk stratification has been limited to the establishment of the clinical tumor stage. Clinical stage cannot correctly predict patients’ progress with combined modality treatment [3, 4, 5]. Therefore, additional methods of risk-stratification may be useful to stratify clinical management further and enable a more personalized approach to therapy.
Tumor heterogeneity have the relationship with adverse prognosis in oesophageal cancer. To analyze textural qualities in images of tumors is a noninvasive approach to assessing tumor heterogeneity, which would provide some information of tumor microenvironment. Computed tomography (CT) have been used to derive information on tumor texture, which is then analyzed by using structural, model-based, or statistical methods [8, 9, 10]. The textures based on CT have been used to predict the OS in non-small-cell lung cancer, liver cancer, and colorectal cancer [8, 9, 10]. However, a few studies have investigated the importance of texture analysis of CT to predict outcomes in oesophageal squamous cell carcinoma (ESCC) patients with definitive CT. The goal of our study was to assess whether tumor texture in pre- or posttreatment primary tumor contrast CT images can be used as a prognostic marker for overall survival OS and progression free survival PFS in patients with stage III ESCC treated with definitive CRT.
Methods
A waiver of institutional review board approval was obtained for this retrospective analysis. From January 2008 to December 2014, 95 patients underwent concurrent radiotherapy and chemotherapy. Twenty-five patients (organ metastasis) and 13 patients (without pre- and post-treatment simulator-enhanced CT scan) were excluded. At last, this datasets included 57 consecutive patients (mean age, 62 years; range, 35–79 years), with pathologically confirmed ESCC having a measurable primary tumor of 3 cm or larger at Sichuan Cancer Hospital and Institution. For inclusion in the study, patients had to have had pre-therapy and post-therapy (RT 40 Gy) CT scans with consistent imaging parameters (see CT Image Acquisition and Texture Analysis below); beam hardening and metal artifacts were not exclusion parameters. Disease stage was determined according to the 7th (2010) edition of the American Joint Committee on Cancer (AJCC) staging manual [11].
Treatment
Chemotherapy consisting of a Taxol (135 mg/m
CT image acquisition
All patients underwent standard radiotherapy simulator contrast, material-enhanced CT scans of the thorax and abdomen before treatment. All simulator CT studies in our center were performed with a 16–detector row CT scanner (PHILIPS Healthcare) and the same clinical protocol: 120 kV, 180–280 mA with tube current modulation, a matrix of 512, a field of view of 500 mm, and 3 mm reconstructed section thicknesses after intravenous injection of 60–120 ml of 370 mg/ml (1.5 ml/Kg) iodinated contrast agent at 1.8–2 mL/sec. The thoracic images (from the sternal notch to below the hemidiaphragm) were obtained in the arterial phase 0–5 seconds after contrast agent administration. Abdominal images (from above the hemidiaphragm to the iliac crest) were obtained in the portal venous phase 60 seconds after contrast administration. Contrast CT image sets obtained from all 57 patients before treatment and RT 40 Gy were available in institutional archives for analysis.
Texture analysis
Whole-tumor texture was analyzed using IBEX (Imaging Biomarker Explorer) software version 1.0
Conventional enhanced-contrast CT image (before RT and RT 40 Gy) of an upper-site oesophageal cancer with metastasis node and corresponding CT images selectively displaying fine (1B, 1G), medium 1 (1C, 1H), medium 2 (1D, 1M), and coarse (1E, 1N) texture obtained with filter values of 1.0 (width, 4 pixels), 1.5 (width, 6 pixels), 2.0 (width, 8 pixels), and 2.5 (width, 12 pixels).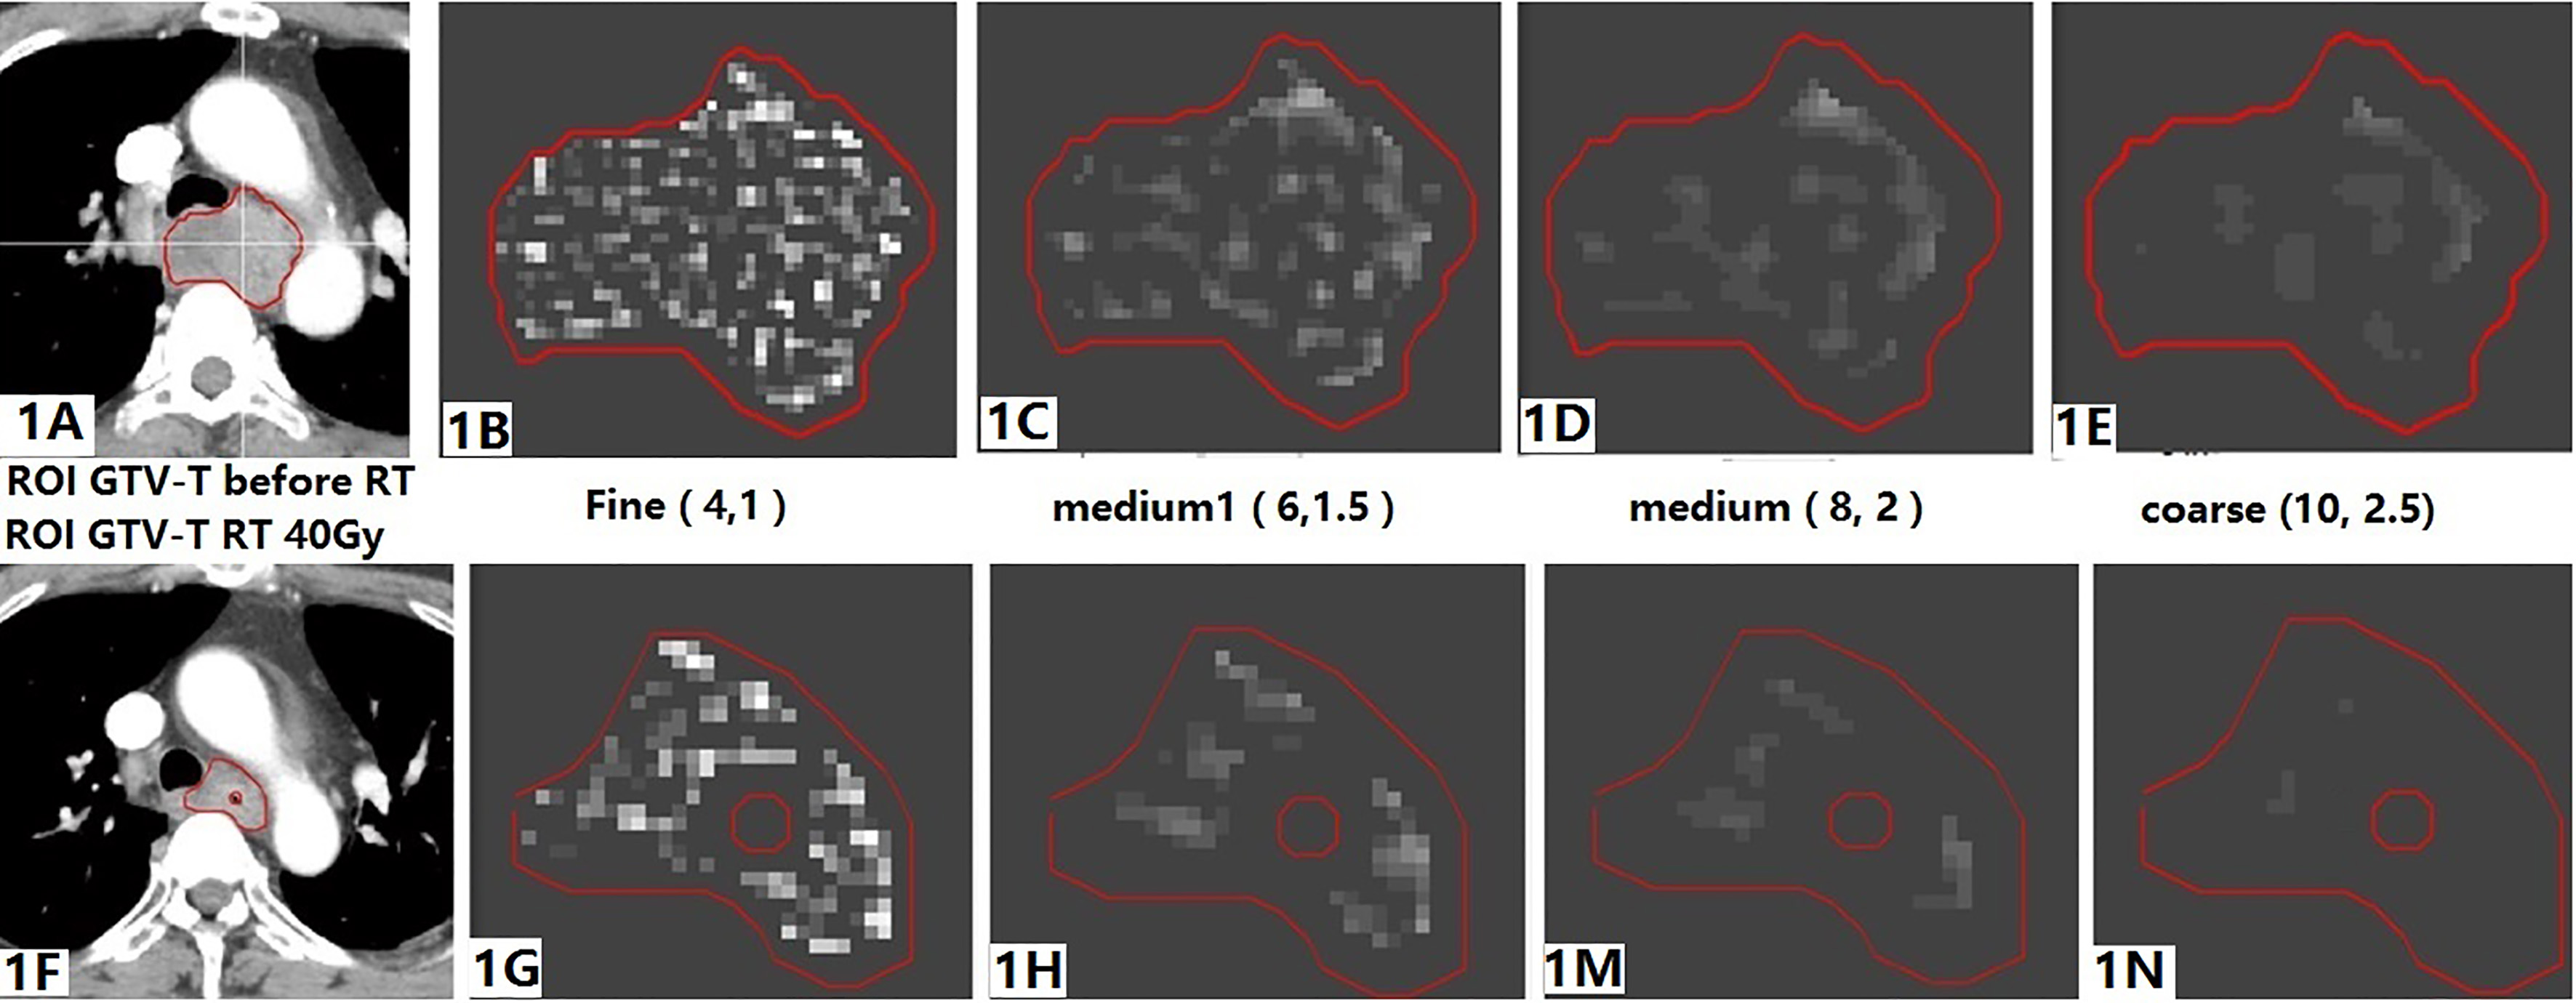
Texture analysis was performed in a two-stage process that involved image filtration (image transformation) followed by statistical quantification of texture (Fig. 1). Image filtration involved using a Laplacian of Gaussian spatial band-pass filter to produce a series of derived images highlighting features at different anatomic spatial scales ranging from fine to coarse texture for the ROI. The different filter values used in this study were 1.0 (highlighting fine textures, which may enhance tissue parenchymal features), 1.5–2.0 (highlighting medium textures), and 2.5 (highlighting coarse textures, which may enhance vascular features). The filter widths represented by fine, medium, and coarse textures were 4, 6–8, and 10 pixels, respectively, with four categories of quantitative image features (Table 2): intensity direct and histogram (global entropy, global maximum, global mean gray-level intensity, global standard deviation of the histogram [Global Std], global uniformity, kurtosis, skewness).
The Kaplan-Meier method was used to construct OS and PFS curves, and the log-rank test was used to determine the statistical significance of differences. PFS was computed from the time of treatment to the time of tumor progression, or death without evidence of disease progression, at which point the data were censored. OS was calculated from the time of treatment to the time of death from any cause, or to the time of last follow-up, at which point the data were censored. The proportional changes in each texture parameter after CRT was calculated as the differences between the texture parameter pre-treatment and that post-treatment (radiation dose 40 Gy) with regard to the baseline texture value. Changes in textures (
where
Patient, tumor and patient characteristics and postoperative result dataset
Patient, tumor and patient characteristics and postoperative result dataset
PDG: Pathological Differentiation GradeOSoverall survivalMST: median Survival time or mOS.
The texture parameters with
Texture of primary tumor and node at univariate analysis performed by using the Cox proportional hazards model and log-rank test
T: primary tumor, N: metastasis lymph node *Log-rank test.
Patients
All patients had stage III ESCC disease. Most patients (48/57, 84.2%) had primary tumors in the upper and middle thirds of the esophagus (Table 1). Most patients (36/57, 63.2%) received concurrent DP chemotherapy at weeks 1 and 5. Other patients received concurrent TP chemotherapy. The median times from the pre-treatment CT study to the start of radiation therapy and from the completion of 40 Gy radiation therapy to the post-treatment CT study were 6 days (range, 3–10 days) and 30 days (range, 28–35 days), respectively. Median follow-up for the entire cohort was 32.0 months (range, 7–60 months). The median 1 and 3 years overall survival (OS) was 20.2 months, 75.4% and 32.1%. For clinical factors, in the univariate analysis performed using the log-rank test (Table 1), chemotherapy regimen (
Primary tumor CT features for survival prediction
For primary tumor, in the univariate analysis performed using the Cox proportional hazards model (Table 2), pre-treatment fine, medium, and coarse texture global entropies, global mean, global Std, and global uniformity as continuous variables were found to be significant prognostic factors. For filter value 1.0, the global Std
Cox regression model in predicting OS of oesophageal cancer patients
Cox regression model in predicting OS of oesophageal cancer patients
Time-independent ROC analysis revealed that the combined model offers a better predictive value for OS in the checkpoint time.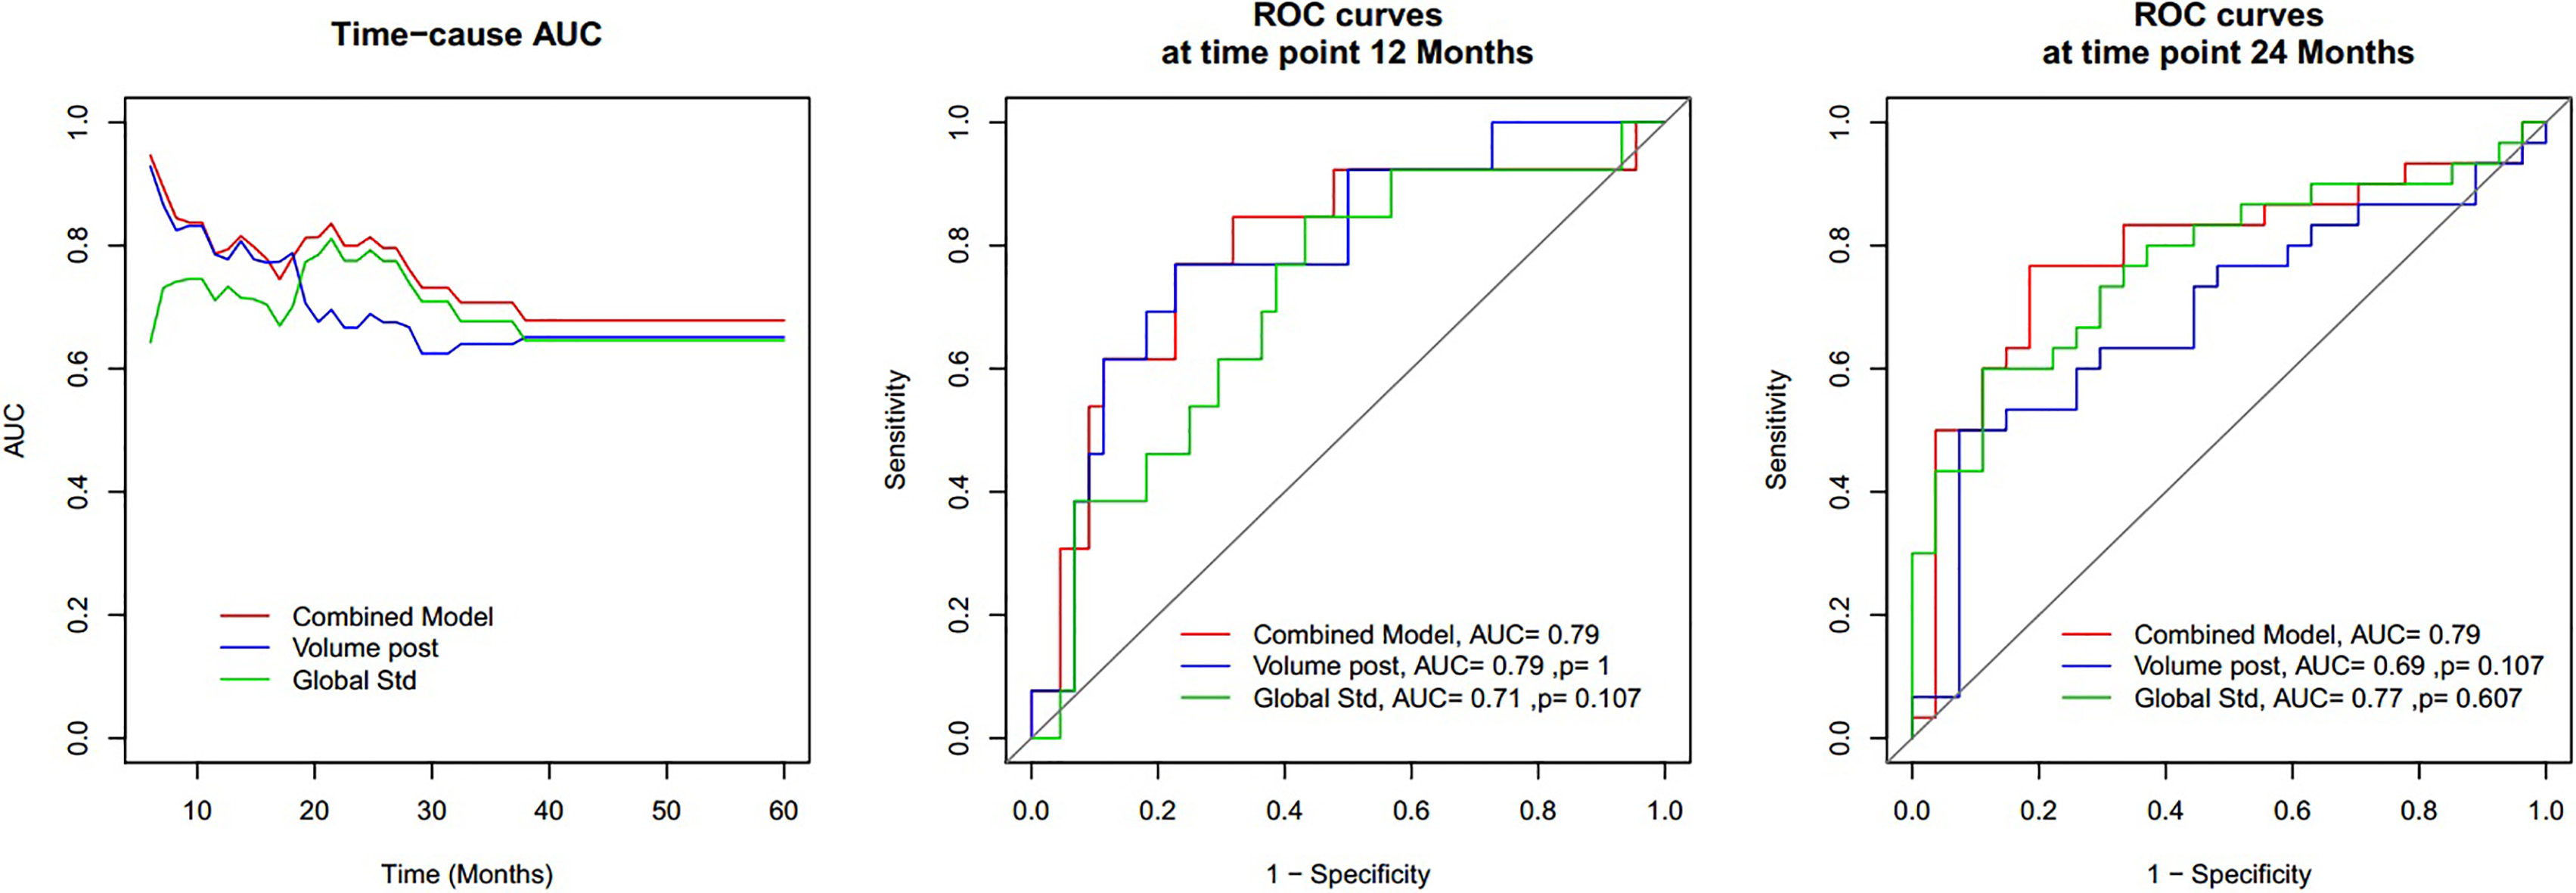
In the univariate analysis performed using the log-rank test (Table 2), the cutoff value median of pretreatment fine, medium 1–2, and coarse texture global entropies, global mean, global Std, and global uniformity were found to be significant prognostic factors for filter value 1.0, global entropies (cutoff
For metastasis lymph nodes, in the univariate analysis performed by using the Cox proportional hazards model (Table 2), pre-treatment fine texture global entropy (HR
Changes in CT textures with CRT and survival prediction
In the univariate analysis performed using the Cox proportional hazards model (Table 2), coarse texture (value 2.5), primary tumor skewness and kurtosis changes as continuous variables were found to be significant prognostic factors: (HR
Survival models
In the whole group, four parameters (post-volume, entropy, mean, global Std) as continuous variables were found to be significantly correlated with OS in univariate Cox analysis, which was consistent with the Kaplan-Meier result (Table 2). A multivariate Cox prediction model was constructed by the four parameters and was optimized in feature selection by a step-wise exclusion and inclusion of variables. The final optimal prediction model was constructed with a combination of two parameters of post-volume (Fig. 3A) and global Std (Fig. 3B, Table 3). Time-independent ROC analysis revealed that the combined model performs a better predictive value for OS than global Std in the time window of 12 months, and then post-volume in the time window of 24 months. Using 12 months as the endpoint, the combined model got an AUC of 0.79, which was higher than that of global Std (AUC
The risk mode includes post-volume and pre-treatment global Std. High-risk group, from a combined model, has significantly lower OS than the low-risk group.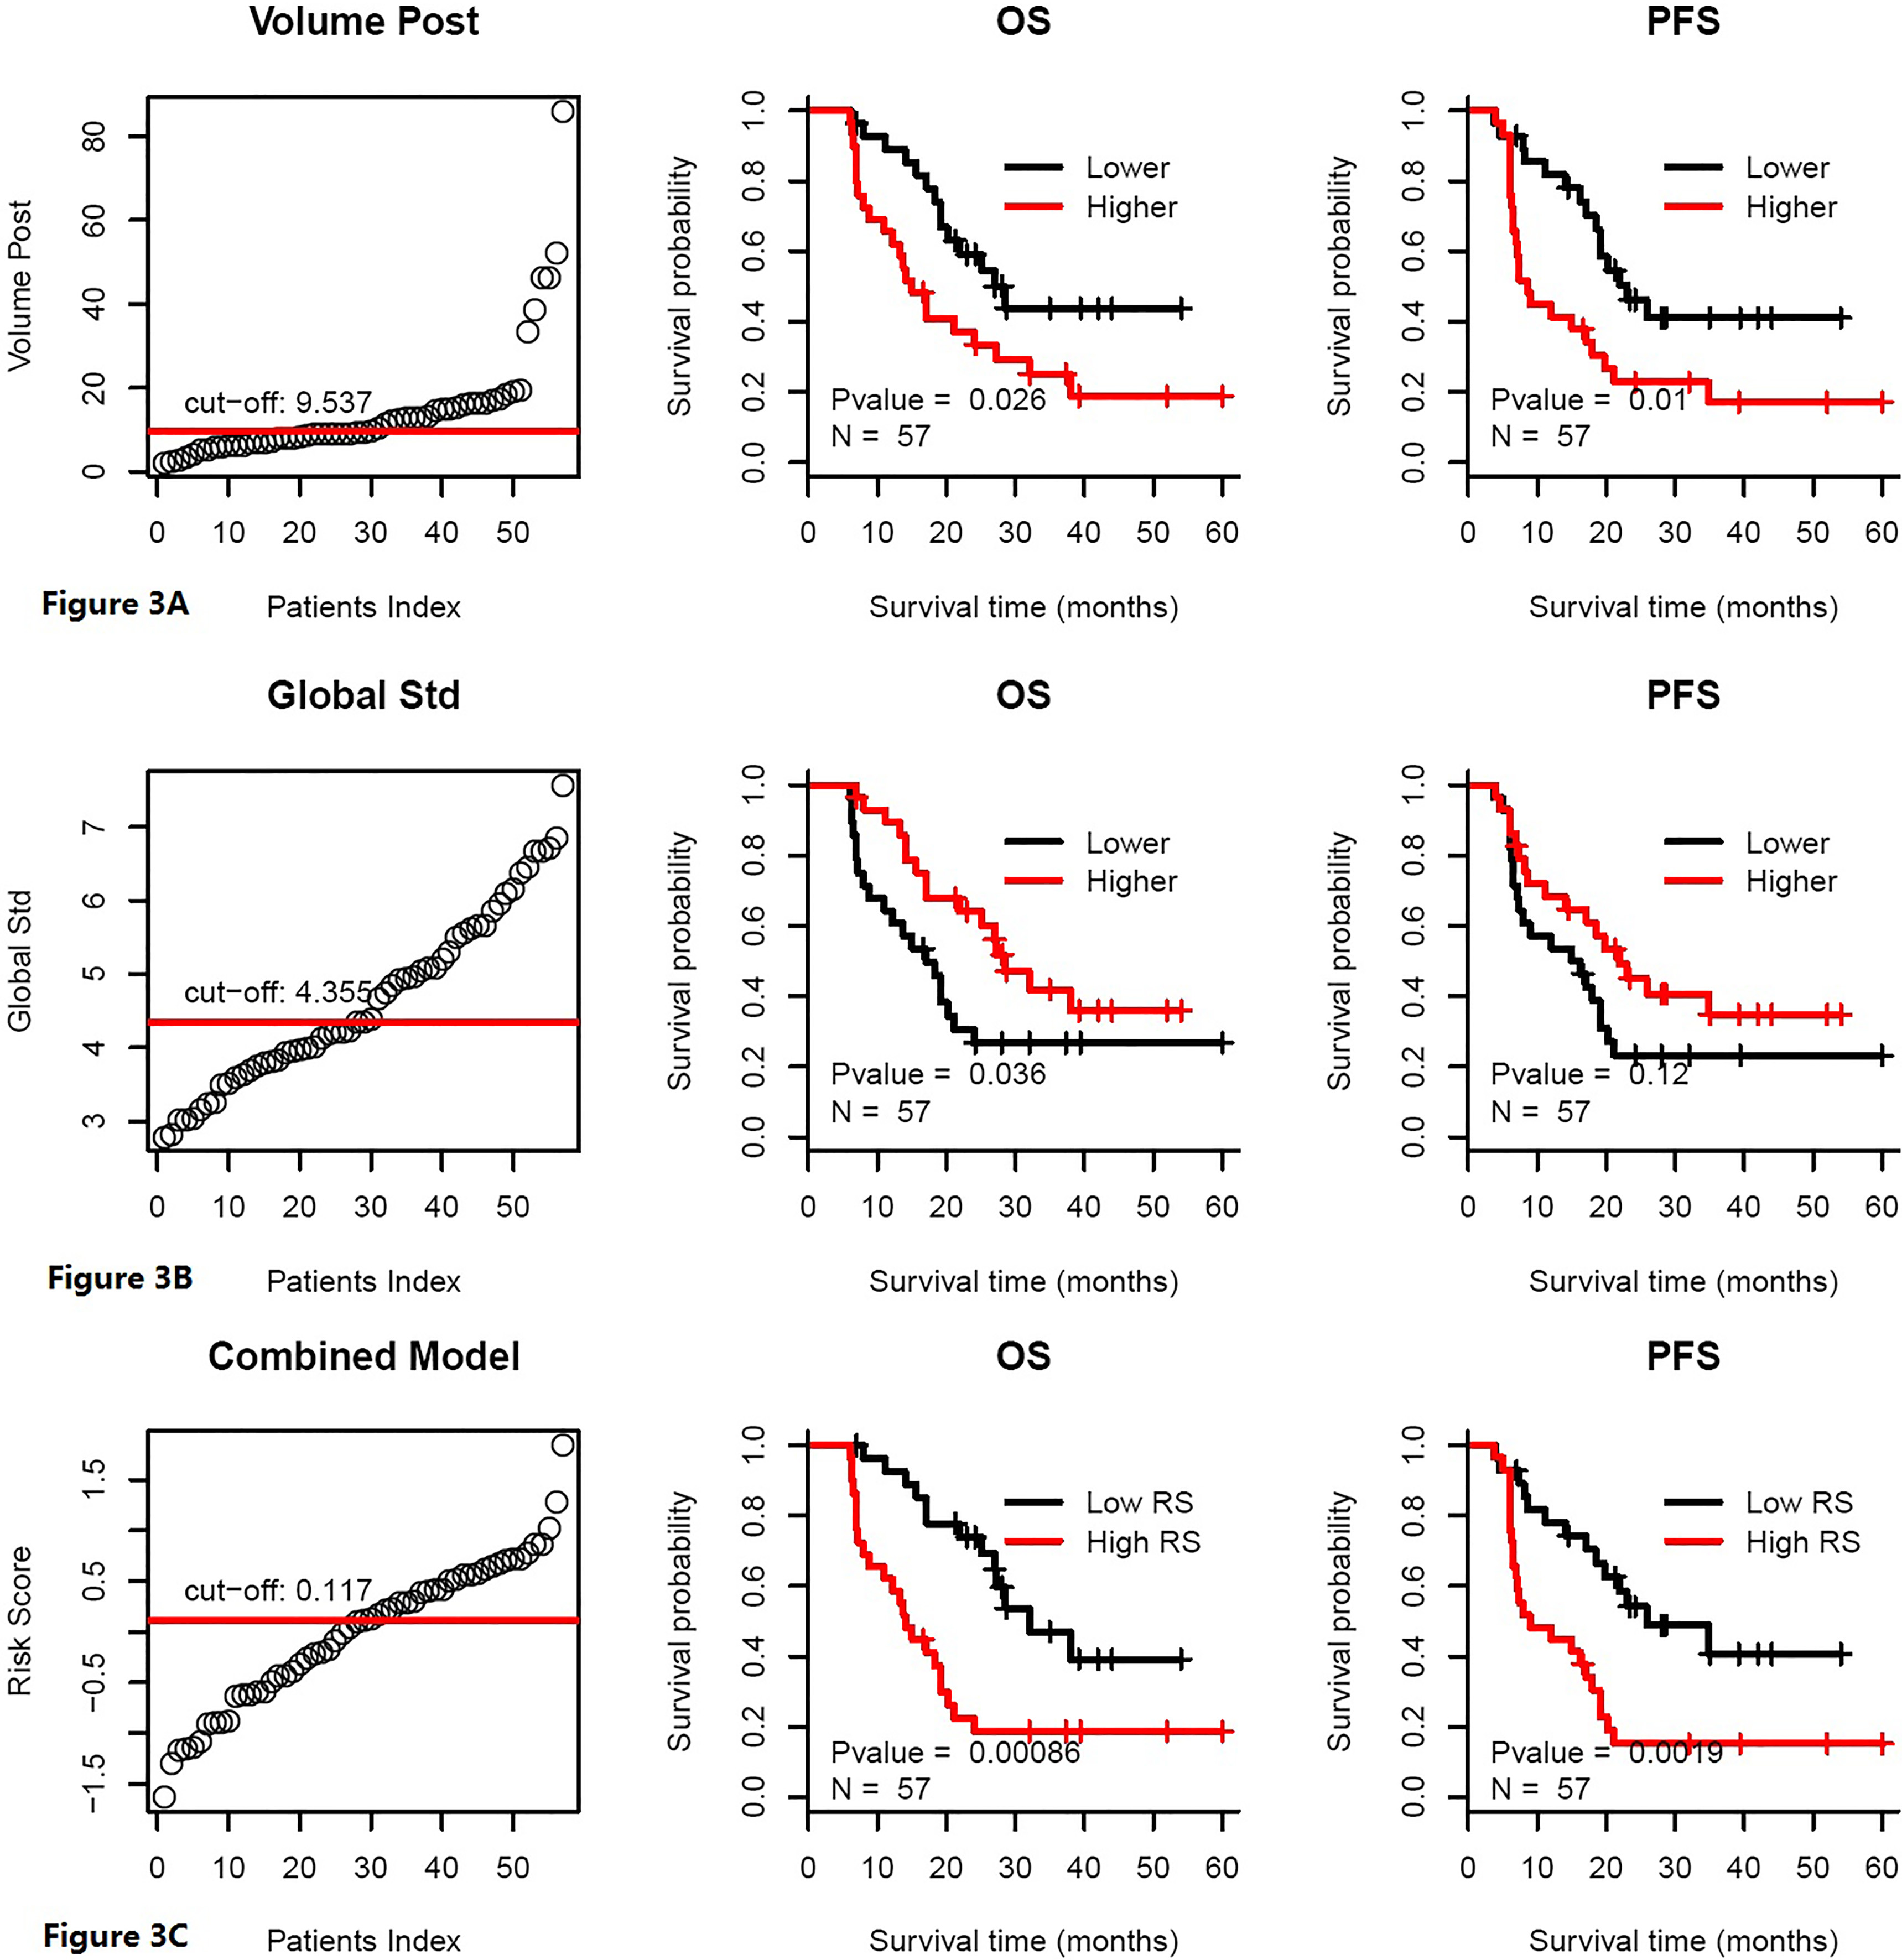
For patients who underwent DP, low risk increased OS over that of high risk (
Discussions
Our findings suggest that textural features extracted from pretreatment primary tumor and metastasis lymph node CT images may serve as an independent predictor of OS in patients with clinical stage III cancer in patients who underwent definitive CRT for primary ESCC. In the current study, we established its ability to predict survival outcomes in ESCC specifically, which not only further validates texture analysis as a prognostic biomarker that warrants prospective evaluation, but also highlights CT texture analysis as a novel method that can be used to risk-stratify and guide management decisions in ESCC. Although textural features have been established to provide predictive data on outcomes in other cancers [8, 9, 10], to date, there have been few studies of texture analysis in oesophageal cancer. There are key differences between this previously published literature and our study. Making a treatment decision mainly on a two-time point for local advanced ESCC, one is pre-treatment, two is RT 40 Gy. The Connie Yip study reported the timing of the pre-treatment at 69 days (range, 19–151 days) and posttreatment at 65 days (range, 18–384 days). CT studies were variable in the investigation and could influence the results [13]. In the current study, we all chose simulator-enhanced CT on two checkpoints, using the same CT equipment to avoid the time interval impact on the results.
In the previously published study, baseline parameters only include primary tumor have not affected the OS, then higher entropy of post treatment has decreased OS [9]. In the current study, we had different results. Higher baseline tumor entropy, mean, and global Std increased OS. One possible reason was that gross tumor volume included normal esophagus tissue. Other results came from non-contrast CT or post-treatment CT. Furthermore, iodine ions can only penetrate tumor tissue or normal tissues that underwent enhanced contrast CT; the concentration of the iodine ion represents the degree of loose tissue. Another important finding was that metastasis lymph node CT textures can be biomarkers for OS. Morphologic CT assessment alone has been shown to correlate poorly with treatment response in oesophageal cancer [14, 15]. Our study found that the survival models using the combination of pretreatment CT textures with tumor volume changes performed better than morphologic response alone. This is in keeping with the findings of a recent retrospective study [16]. Currently, how to choose chemotherapy regimens when patients undergo chemoradiotherapy is a significant challenge. We can use this risk model to guide clinical practice. Other limitations of our study include its retrospective nature. Because our image-derived score was based on a random sample of patients from one institution, the robustness of the cut-point for that score is unclear, and our results may not be generalizable to other centers. Nevertheless, our image-derived score could stratify patients into distinct risk groups and remained an independent predictor of OS even as a continuous variable. Another limitation is the potential for gas to have been present within the delineated tumors, which could influence the values of the extracted quantitative features; in this study, the post-volume is not the real volume after treatment; it is the volume after radiotherapy dose 40 Gy.
Conclusion
The use of texture analysis in clinical practice is still exploratory in nature, but it has the potential to add further diagnostic and prognostic information, with the advantage that it is a post-processing step, using existing CT data sets, without subjecting patients to further radiation exposure or imaging. We showed that tumor heterogeneity is associated with survival and adds additional prognostic information to morphologic tumor response. Hence, texture analysis could be a valuable response assessment tool in oesophageal cancer to select poor responders to CRT and potentially improve patient outcomes. This study adds to the growing evidence base that CT texture analysis may be useful in evaluating treatment response, but this still requires further validation in larger prospective studies before widespread implementation in clinical practice.
Footnotes
Acknowledgments
This work was supported by grants from Sichuan science and technology department key research and development project fund [2019YFS0378, 2018JY02 77], the selected excellent projects for foundation from the science and technology projects of Sichuan Province (2016), Wu Jieping Medical Foundation, Grant/Award Number: 320.6750.17237. Cancer Research Foundation of China Anti-cancer Association for Young Scientists (Grant No. CAYC18A33).
Conflict of interest
The authors declare no actual or potential financial conflicts of interest.