Abstract
PURPOSE:
The need for less invasive procedures for lung cancer probing is critically needed to better understand the disease. The purpose of the current study aims to explore the use of circulating tumor DNA (ctDNA) derived from plasma and urine specimens.
METHODS:
Matched peripheral blood and morning urine specimens were obtained from 160 late stage NSCLC patients. The amount of ctDNA was quantified for each of the patients. Activating and sensitizing EGFR mutations commonly found in NSCLC patients were profiled. Longitudinal analysis was performed to compared DNA variations during disease progression.
RESULTS:
Measurement of EGFR mutations in NSCLC patients using plasma and urinal DNA demonstrated strong concordance to conventional tissue biopsy profiling. Baseline matched tumor samples yielded 82.8% and 84.0% for plasma and urinal DNA respectively. For these measurements, the positive predictive value was 100% for plasma and urinal DNA. In the longitudinal study, we observed strong links to disease severity and survival analysis showed a clear trend with patients having higher DNA concentrations to have worse outcome especially for urinal DNA. HR for patients stratified using plasma and urinal DNA were 1.23 and 2.55 respectively.
CONCLUSION:
Measurements of circulating DNA within body fluids presented potentially new tools for the disease management of NSCLC patients with EGFR mutations. We demonstrated both plasma and urinal DNA correlated well to tissue biopsies and were potentially prognostic to address patients’ survival outcome.
Introduction
Cancer is major contributor of health burden worldwide and projected to cause the US healthcare a staggering 173 billion US dollars in 2020 [1]. It is also one of the major cause of cancer related mortality [2]. Lung cancer has high prevalence with 1.8 million new cases diagnosed annually [3] and early detection is the main challenge to arrest the disease at early stage [4]. Other critical needs in cancer management is to have close monitoring of disease progression [5] and identification of the development of therapy resistance [6]. Lung cancer patients will benefit from better disease probing, and liquid biopsy via circulating tumor DNA (ctDNA) presents viable options to understand the pathogenesis of lung cancer.
Various clinical studies have demonstrated that ctDNA has strong clinical utilities [7]. It is a promising candidate for early detection [8], treatment monitoring [9] and prognosis [10]. Its potential use has been widespread and covers numerous cancer types. In breast cancer for example, the identification of triple negative patients [11] will allow tailoring of treatment regime as these patients are not responsive to hormonal therapy [12]. For colorectal cancer patients, studies have shown this can be a good predictor of disease relapse [13, 14]. Lung cancer detection and monitoring rely heavily on imaging [15] and in recent studies using ctDNA, this has been shown to be useful to identify patients that are refractory to traditional tyrosine kinase inhibitors (TKIs) [16]. The complementary use of ctDNA in lung cancer management has aided traditional imaging methods to better probe the disease.
In the current study, we aim to investigate different sources of ctDNA, namely from peripheral blood and urine specimens in non-small cell lung cancer (NSCLC) patients. Using longitudinal analysis, we hope to capture key changes within these specimens to ascertain the clinical relevance and to establish if these are good biomarkers for NSCLC.
Patient characteristics and associated clinical parameters
Patient characteristics and associated clinical parameters
NSCLC patient characteristics
All patients provided informed consent to be part of the study. Results derived from the trial were not made known to patients and not used to guide treatment. Procedures performed for sample collection and patient recruitment were approved by the institutional review board (IRB). A total of 160 patients participated in the study and they gave informed consent before blood extraction was carried out. Match urine specimens were taken the following morning. A summary of the patient profile is highlighted in Table 1. The inclusion criteria for the study consisted of patients with advance NSCLC as determined using the tumor node metastasis (TNM) classifications and they had to be treatment naïve. In addition, patients with EGFR mutations were recruited. This was determined using the routine molecular profiling results from primary tissue biopsies. As per guidelines, patients detected with sensitizing EGFR mutations from tissue biopsies were placed on EGFR-TKIs while wildtype patients had regular chemotherapy. We recruited 30 EGFR wildtype patients for the trial to ascertain the assay specificity for wildtype EGFR profiles.
Peripheral blood extraction and matched urine collection
A total of 5 ml of peripheral blood was extracted from each patient by a trained phlebotomist and processed within a golden period of 2 hours. Samples were collected in ethylenediaminetetraacetic acid (EDTA) collection vacutainers and the plasma separated by density centrifugation. Briefly, blood samples are centrifuge at 1500 xg for 10 minutes. Following centrifugation, the liquid component is carefully transferred into a separate 10 ml centrifuge tube using a Pasteur pipette. Plasma are maintained on ice during transport and apportioned into 1 ml aliquots and stored at
Spiked control validations of different EGFR mutations including L858R, exon 19 deletions and T790M. Each data point was repeated 5 times and results showed good linearity using serial diluted samples.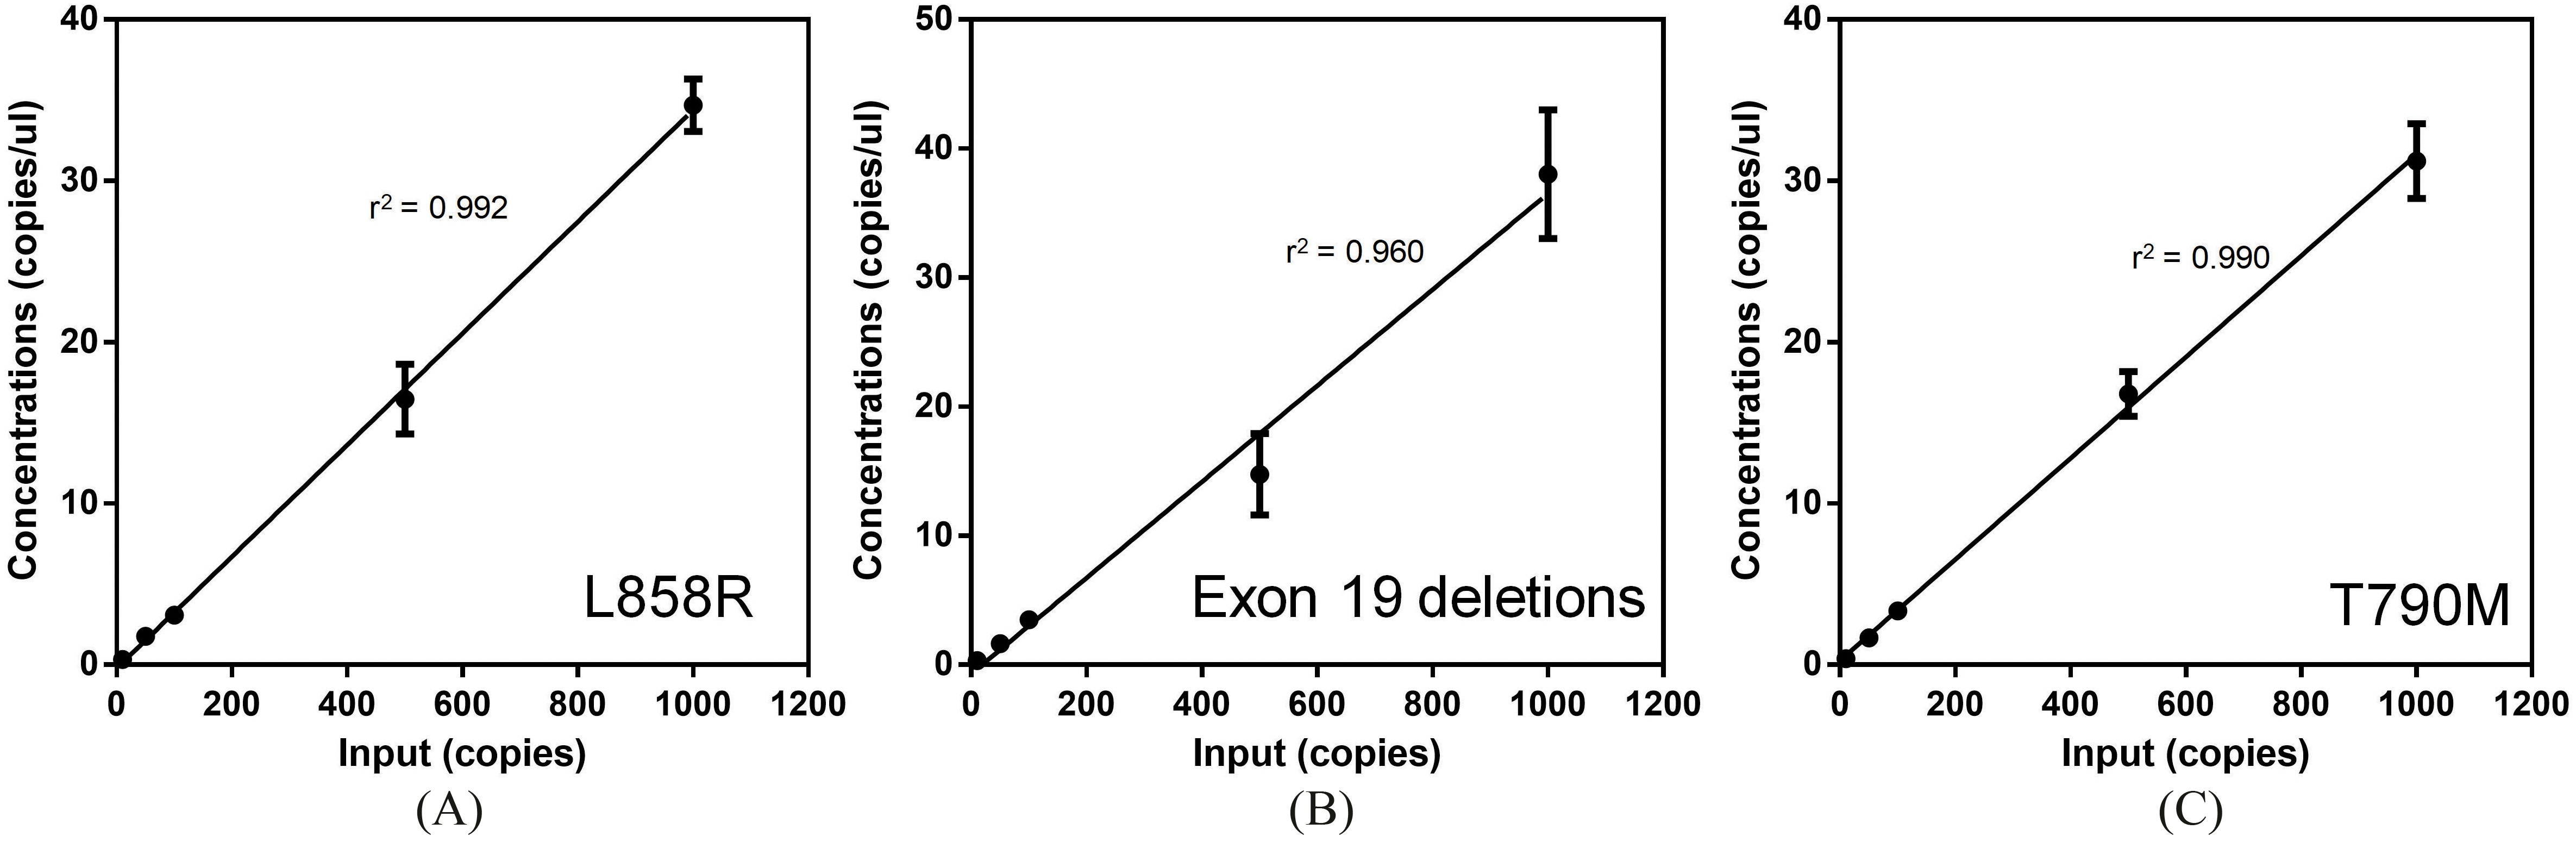
For the extraction of DNA from both urine and plasma samples, we utilized the Qiagen’s QIAmp Circulating Nuclei Acid Kit (QIagen Inc., USA). DNA extraction strictly followed the recommended instructions from the manufacturer’s kit insert. Multiple centrifuge steps using the spin columns was used to purify the DNA materials and finally eluted in 10 ul of TE buffer (10 mM Tris-Cl, 1 mM EDTA, pH 8.0). The DNA amounts were quantified using the Nanodrop 2000 photo-spectrometer (Thermo Fisher Scientific, USA) and EGFR mutations probed using QX100™ Droplet Digital™ PCR System (Bio-Rad, USA). Briefly, primers and probes were procured from the PrimePCR™ ddPCR Mutation Assays (Bio-Rad., USA). Validations runs using spiked controls were performed to ascertain the sensitivity of the assay. For the PCR reactions, the thermocycling conditions were defined as the following: 95
Statistical analysis
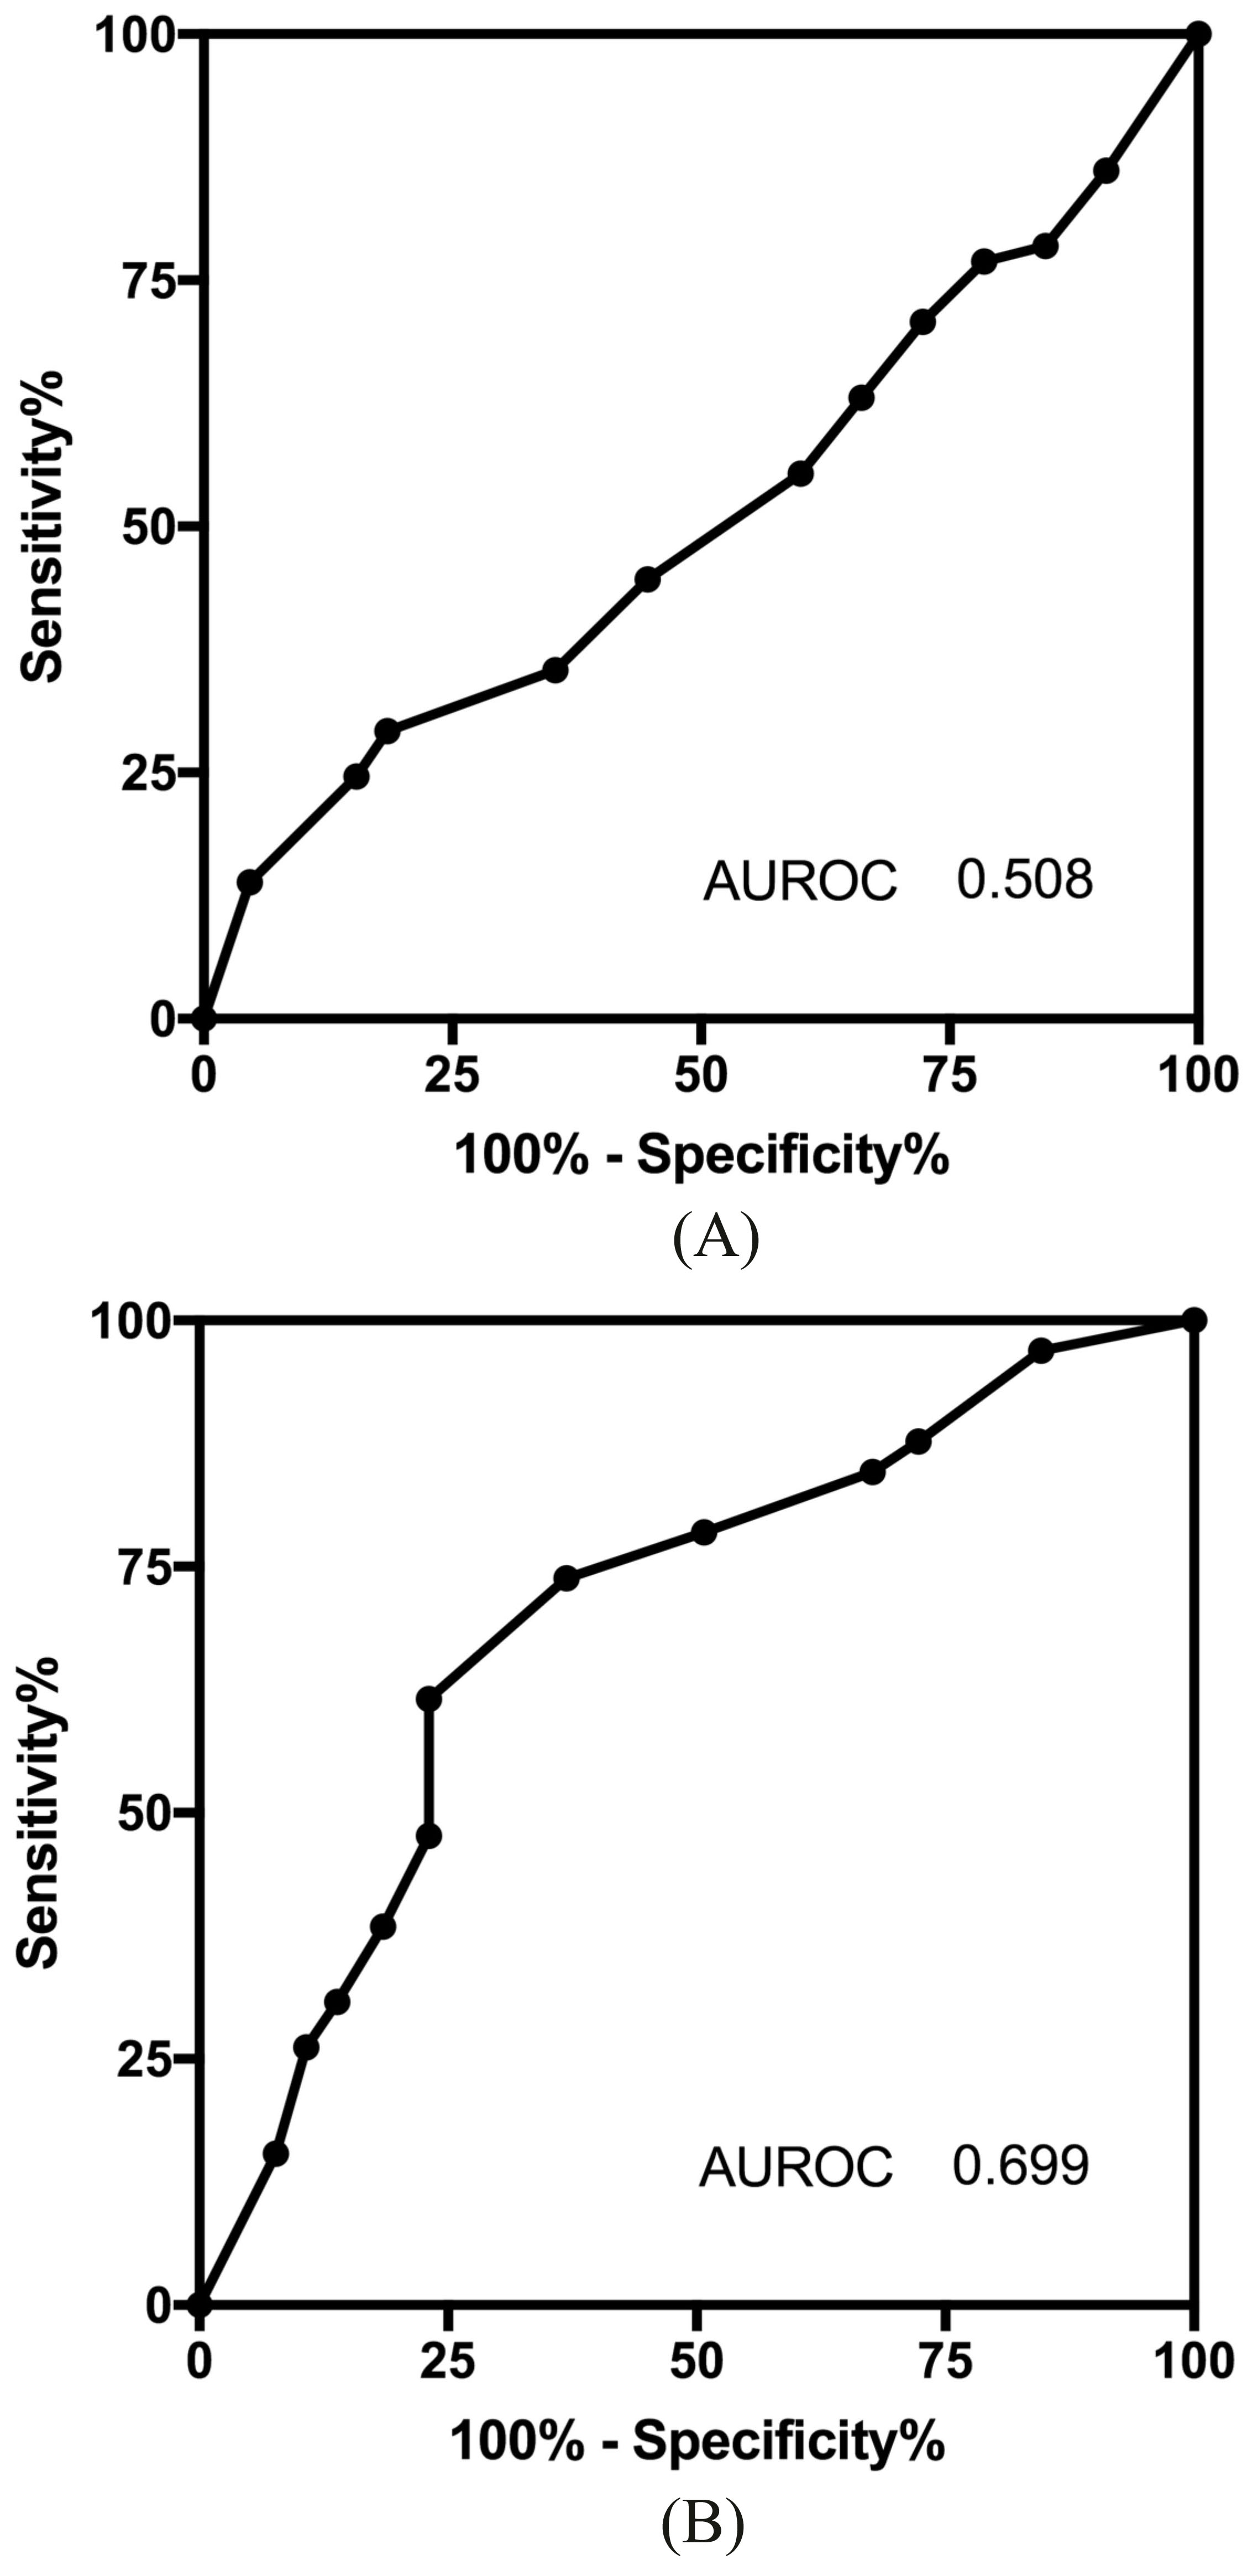
Validation for the ddPCR assay was performed using serially diluted samples and a simple regression model was applied. The agreement between patients with and without EGFR mutations for both the plasma and urine specimens were computed using the Kappa Statistics. Comparison of recovered DNA quantities from urine and plasma was performed by the Student t test. For longitudinal studies, a repeat measure analysis of variance (ANOVA) was established to address the trends in serial samples. For all tests, a p value of less than 0.05 was considered statistically significant. A receiver operating characteristics (ROC) analysis was performed to confirmed the prognostic ability of both media. All statistical analyses were performed using the PRISM 7.0 software (GraphPad Inc, USA).
Results
Assay verification and study design
To ascertain the validity of the assay for detecting and quantifying EGFR mutations, we performed a series of spiked controls. Plasmids containing L858R, exon 19 deletions and T790M mutations were added to plasma extracted from a single healthy donor. These mutations are the most frequent among all NSCLC patients and are the main mutations tested in the current study. Figure 1A shows the results of the spiked controls. Using a simple regression model, we determined that the r-square for L858R, Exon 19 deletions and T790M mutations were 0.992, 0.960 and 0.990 respectively. Spiked controls as little as 10 copies/ul were successfully detected in the trial and affirms the sensitivity for testing.
Concordance measure between tissue biopsy and circulating DNA. (A) Agreement of plasma DNA with different EGFR mutations.(B) Agreement of urinal DNA with different EGFR mutations. (C) Positive and negative predictive value for plasma and urinal DNA with biopsy samples.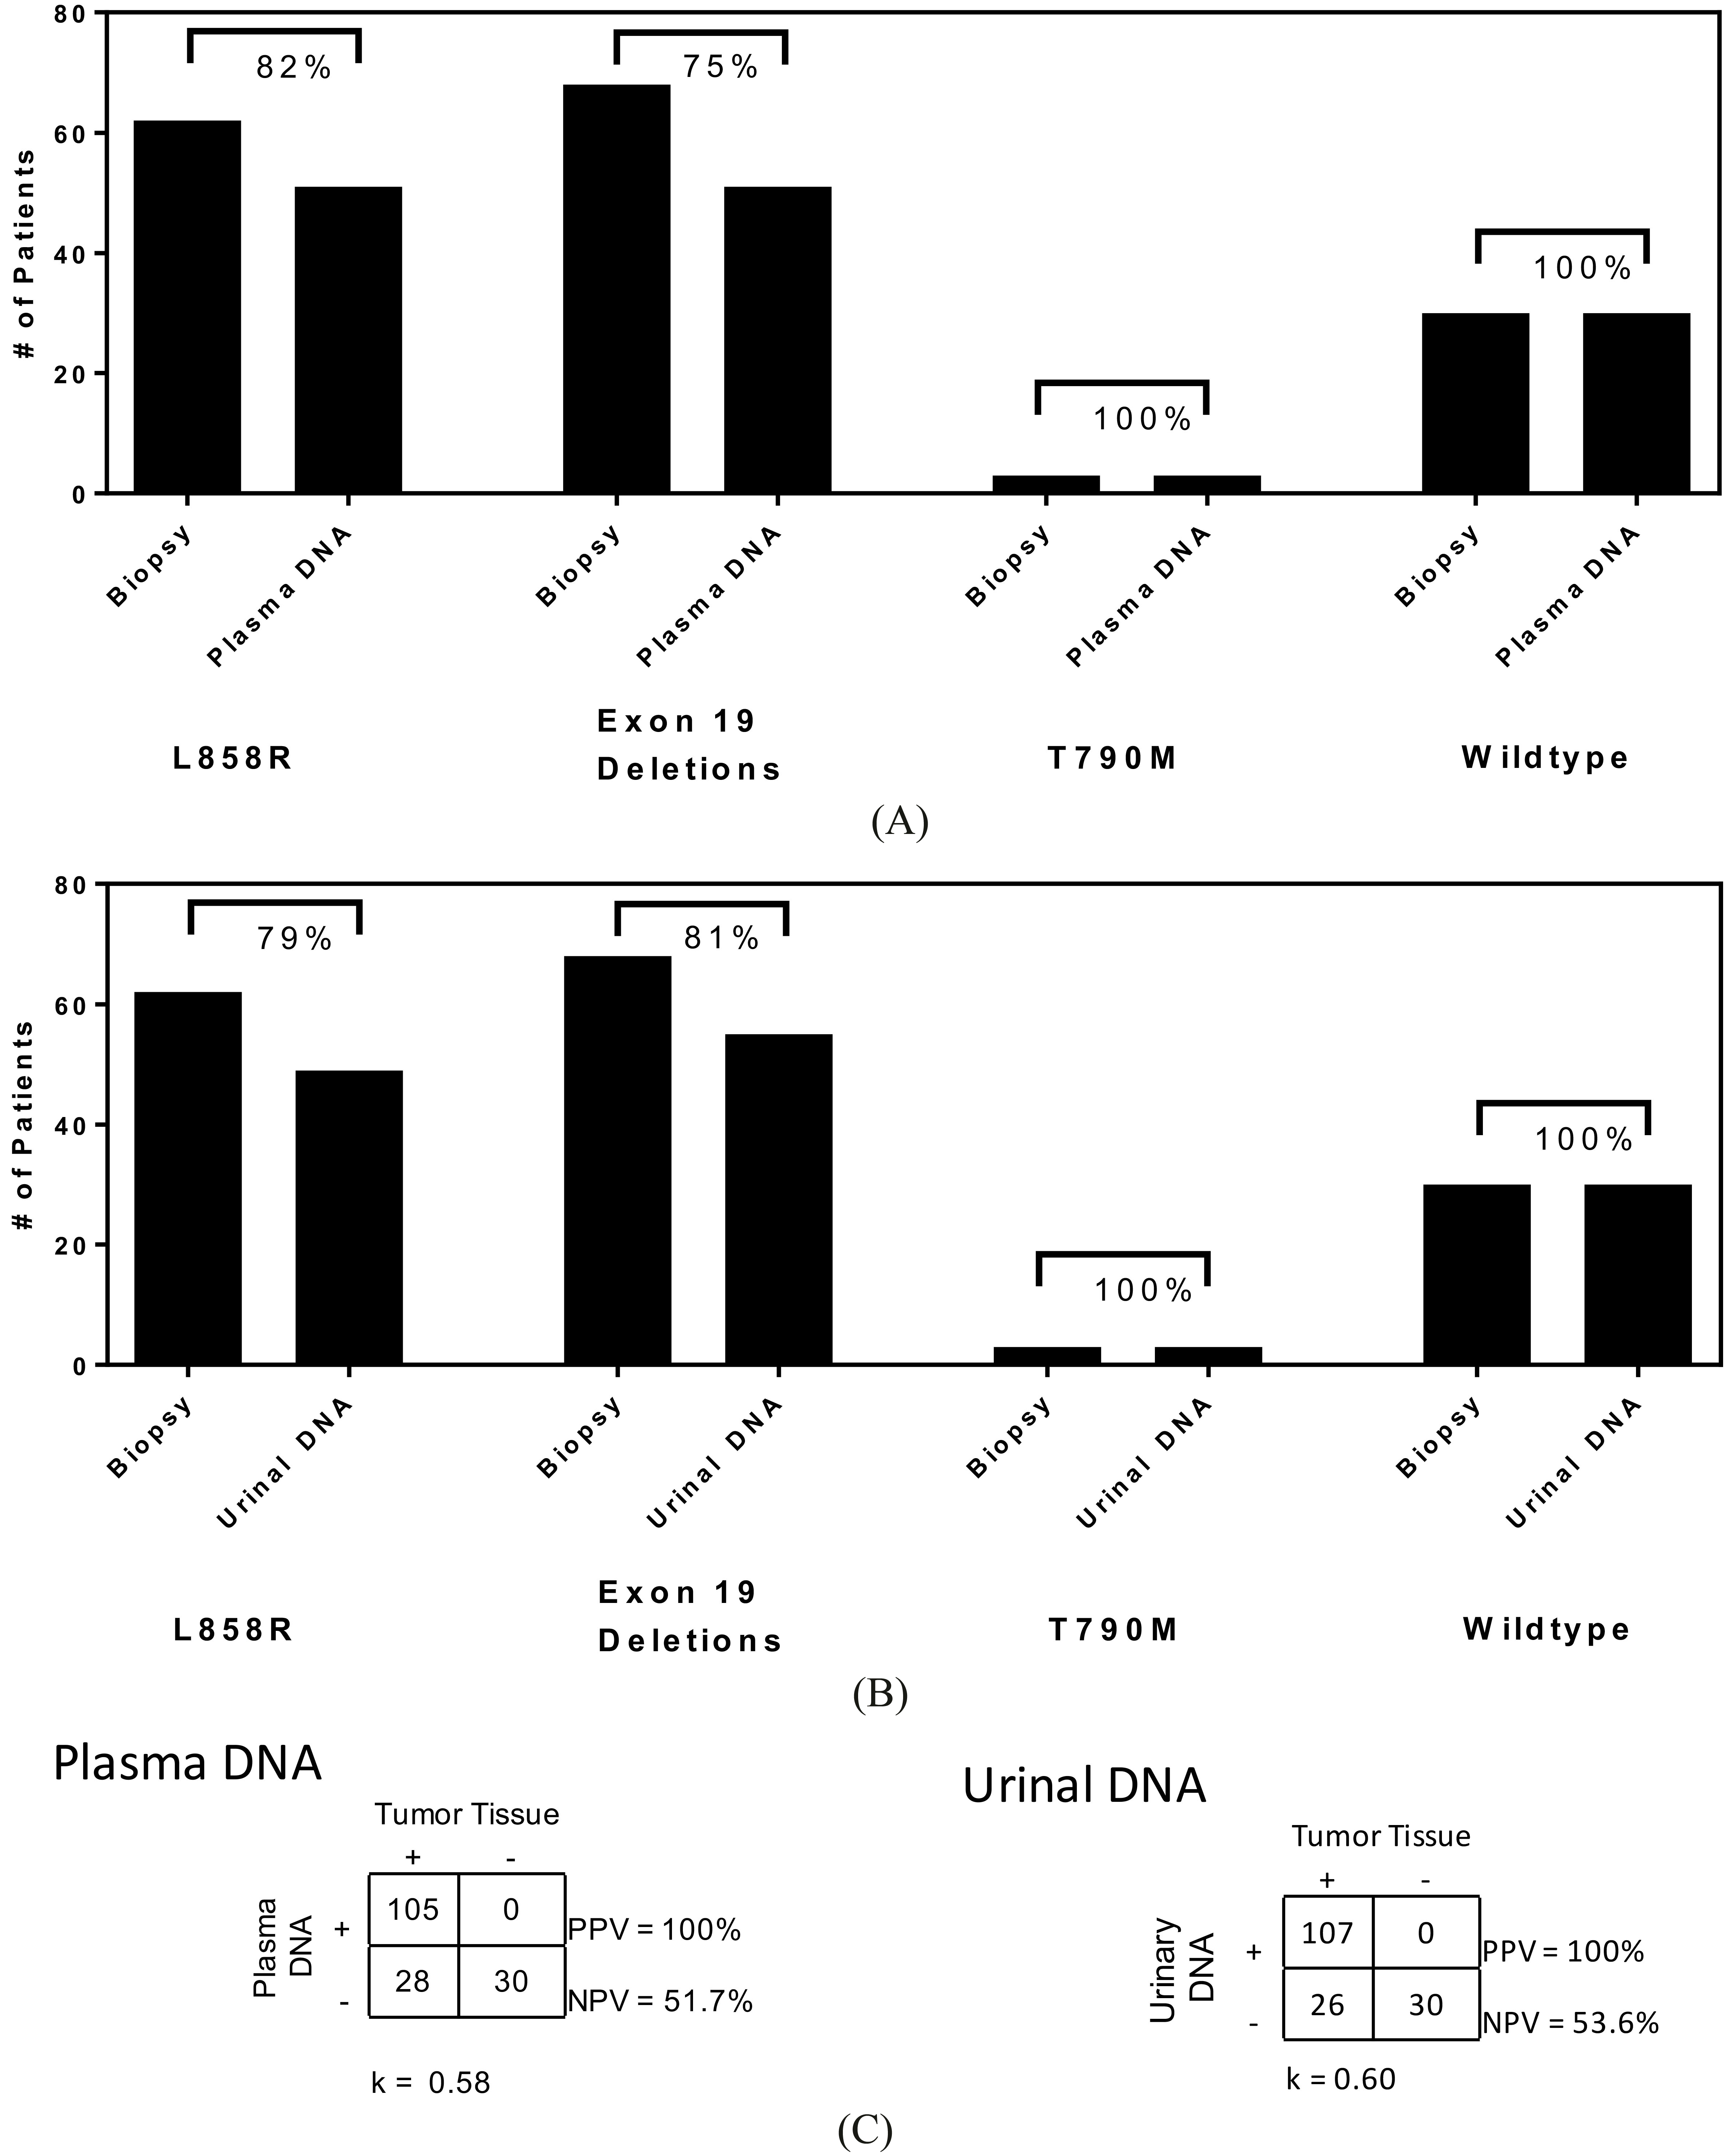
Correlation of plasma and urinal DNA. (A) Recovered nucleic acid at baseline from 130 advance stage NSCLC patients. (B) Distribution of recovered DNA from Plasma DNA with mean of 280 ng/ml and coefficient of variation among patients of 16.1%. (C) Distribution of recovered DNA from urinal DNA with mean value of 202 ng/ml and variation of 9.07%. (D) Recovered DNA from plasma and urinal DNA for NSCLC of different EGFR genetic profiles. A one-way ANOVA shows insignificant differences among the three groups.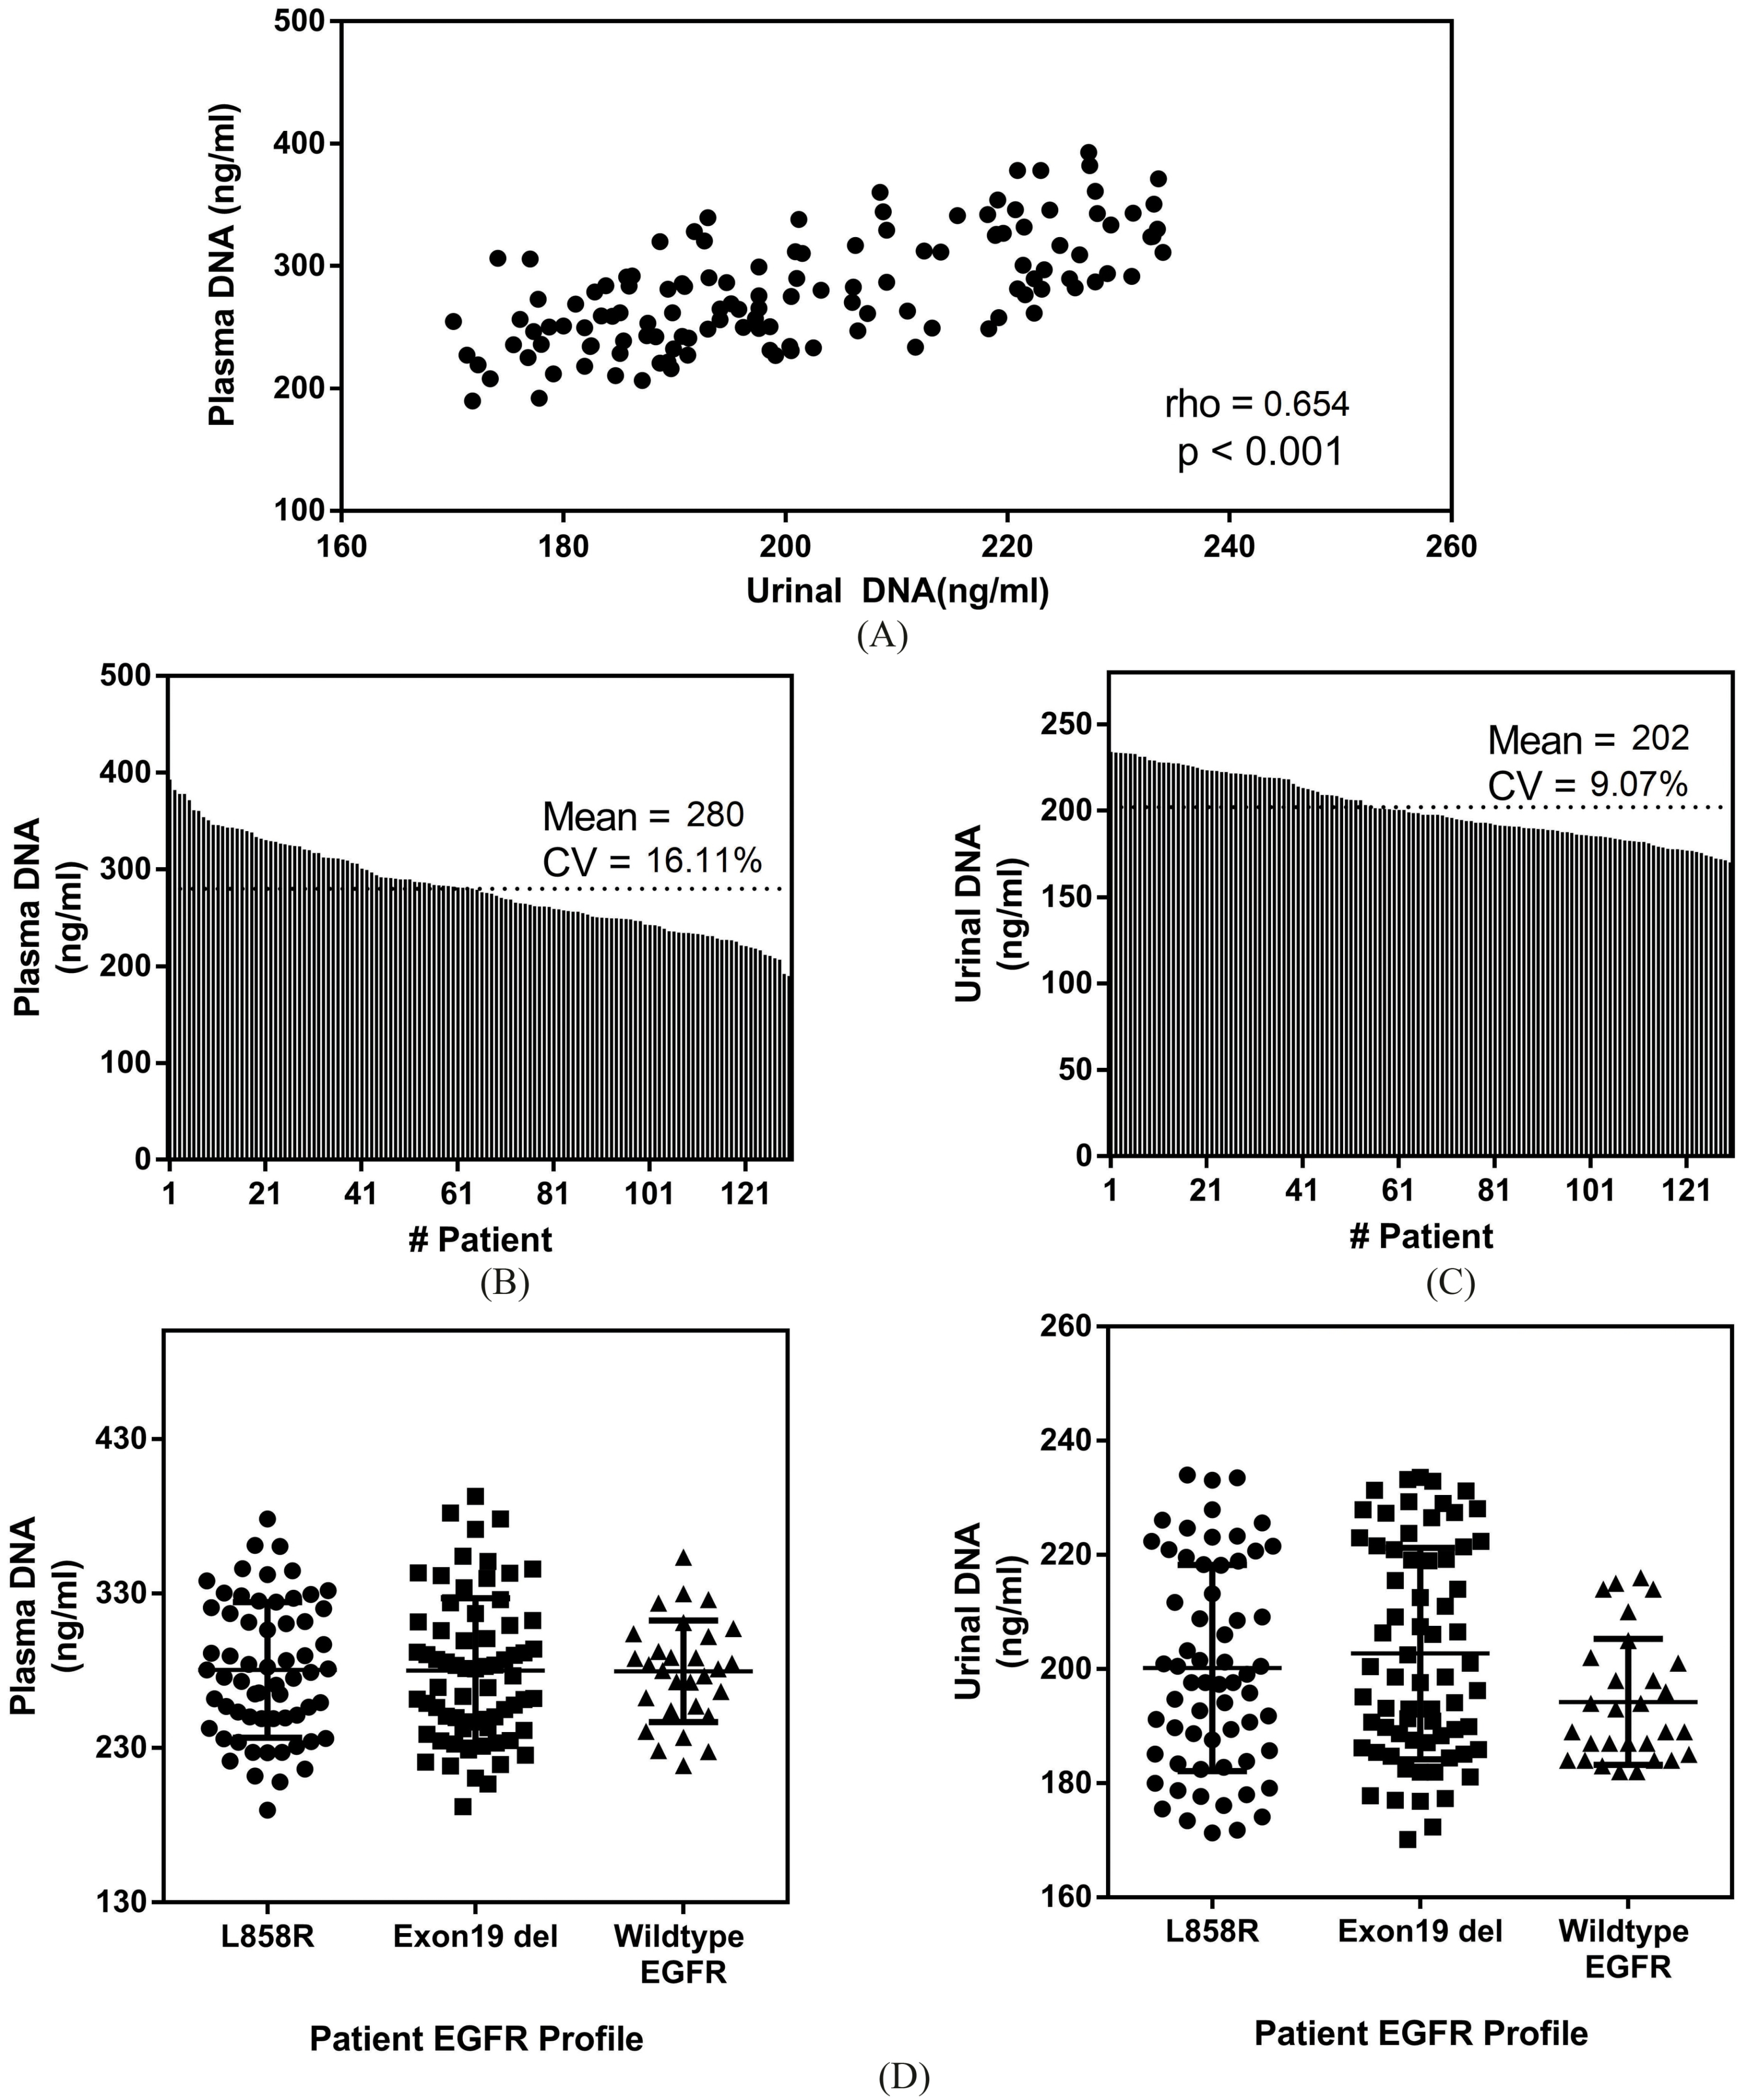
The study addresses late stage NSCLC patients with EGFR mutations. Of the 160 patients enrolled, 30 were of wildtype characteristics. The rest of the patient profiles were positive L858R (48%) and exon 19 deletions (52%). Of the patients with L858R mutation and exon 19 deletions, 3 had concurrent T790M mutation. These results were derived from primary lung tissue biopsies. A summary of the other clinical parameters is listed in Table 1. Among all 160 patients, the mean age was 63 years old and male to female ratio was 1.3. Adenocarcinoma was the predominant histologic type. Baseline plasma and urine DNA was collected and compared with tissue results. Figure 2A shows the results comparing plasma samples and tissue biopsies. For L858R, exon 19 deletions and T790M mutations, the agreements were 82%, 75% and 100% respectively. For urine ctDNA (Fig. 2B), the agreements with tissue biopsy for L858R, exon 19 deletions and T790M were 79%, 81% and 100% respectively. Summarizing the results for all EGFR mutations, the positive predictive value (PPV) and negative predictive value (NPV) for plasma and urine ctDNA were 100% (PPV), 51.7% (NPV) and 100% (PPV), 53.6% (NPV) respectively. The Kappa statistics for plasma and urine ctDNA were 0.58 and 0.60 respectively.
Longitudinal investigations of EGFR mutations profiles and agreement with tissue biopsy. (A) A 10-month monitoring period demonstrates little changes in the mutational profiles among patients for L858R and Exon 19 deletions. (B) Quantification of plasma DNA concentration showing an upward increasing trend in recovered DNA content. (C) Monitoring using urinal DNA for a 10-month period with similarly little changes in the agreement with tumor biopsy. (D) Quantification of recovered DNA from urine specimens showing a increasing trend with time.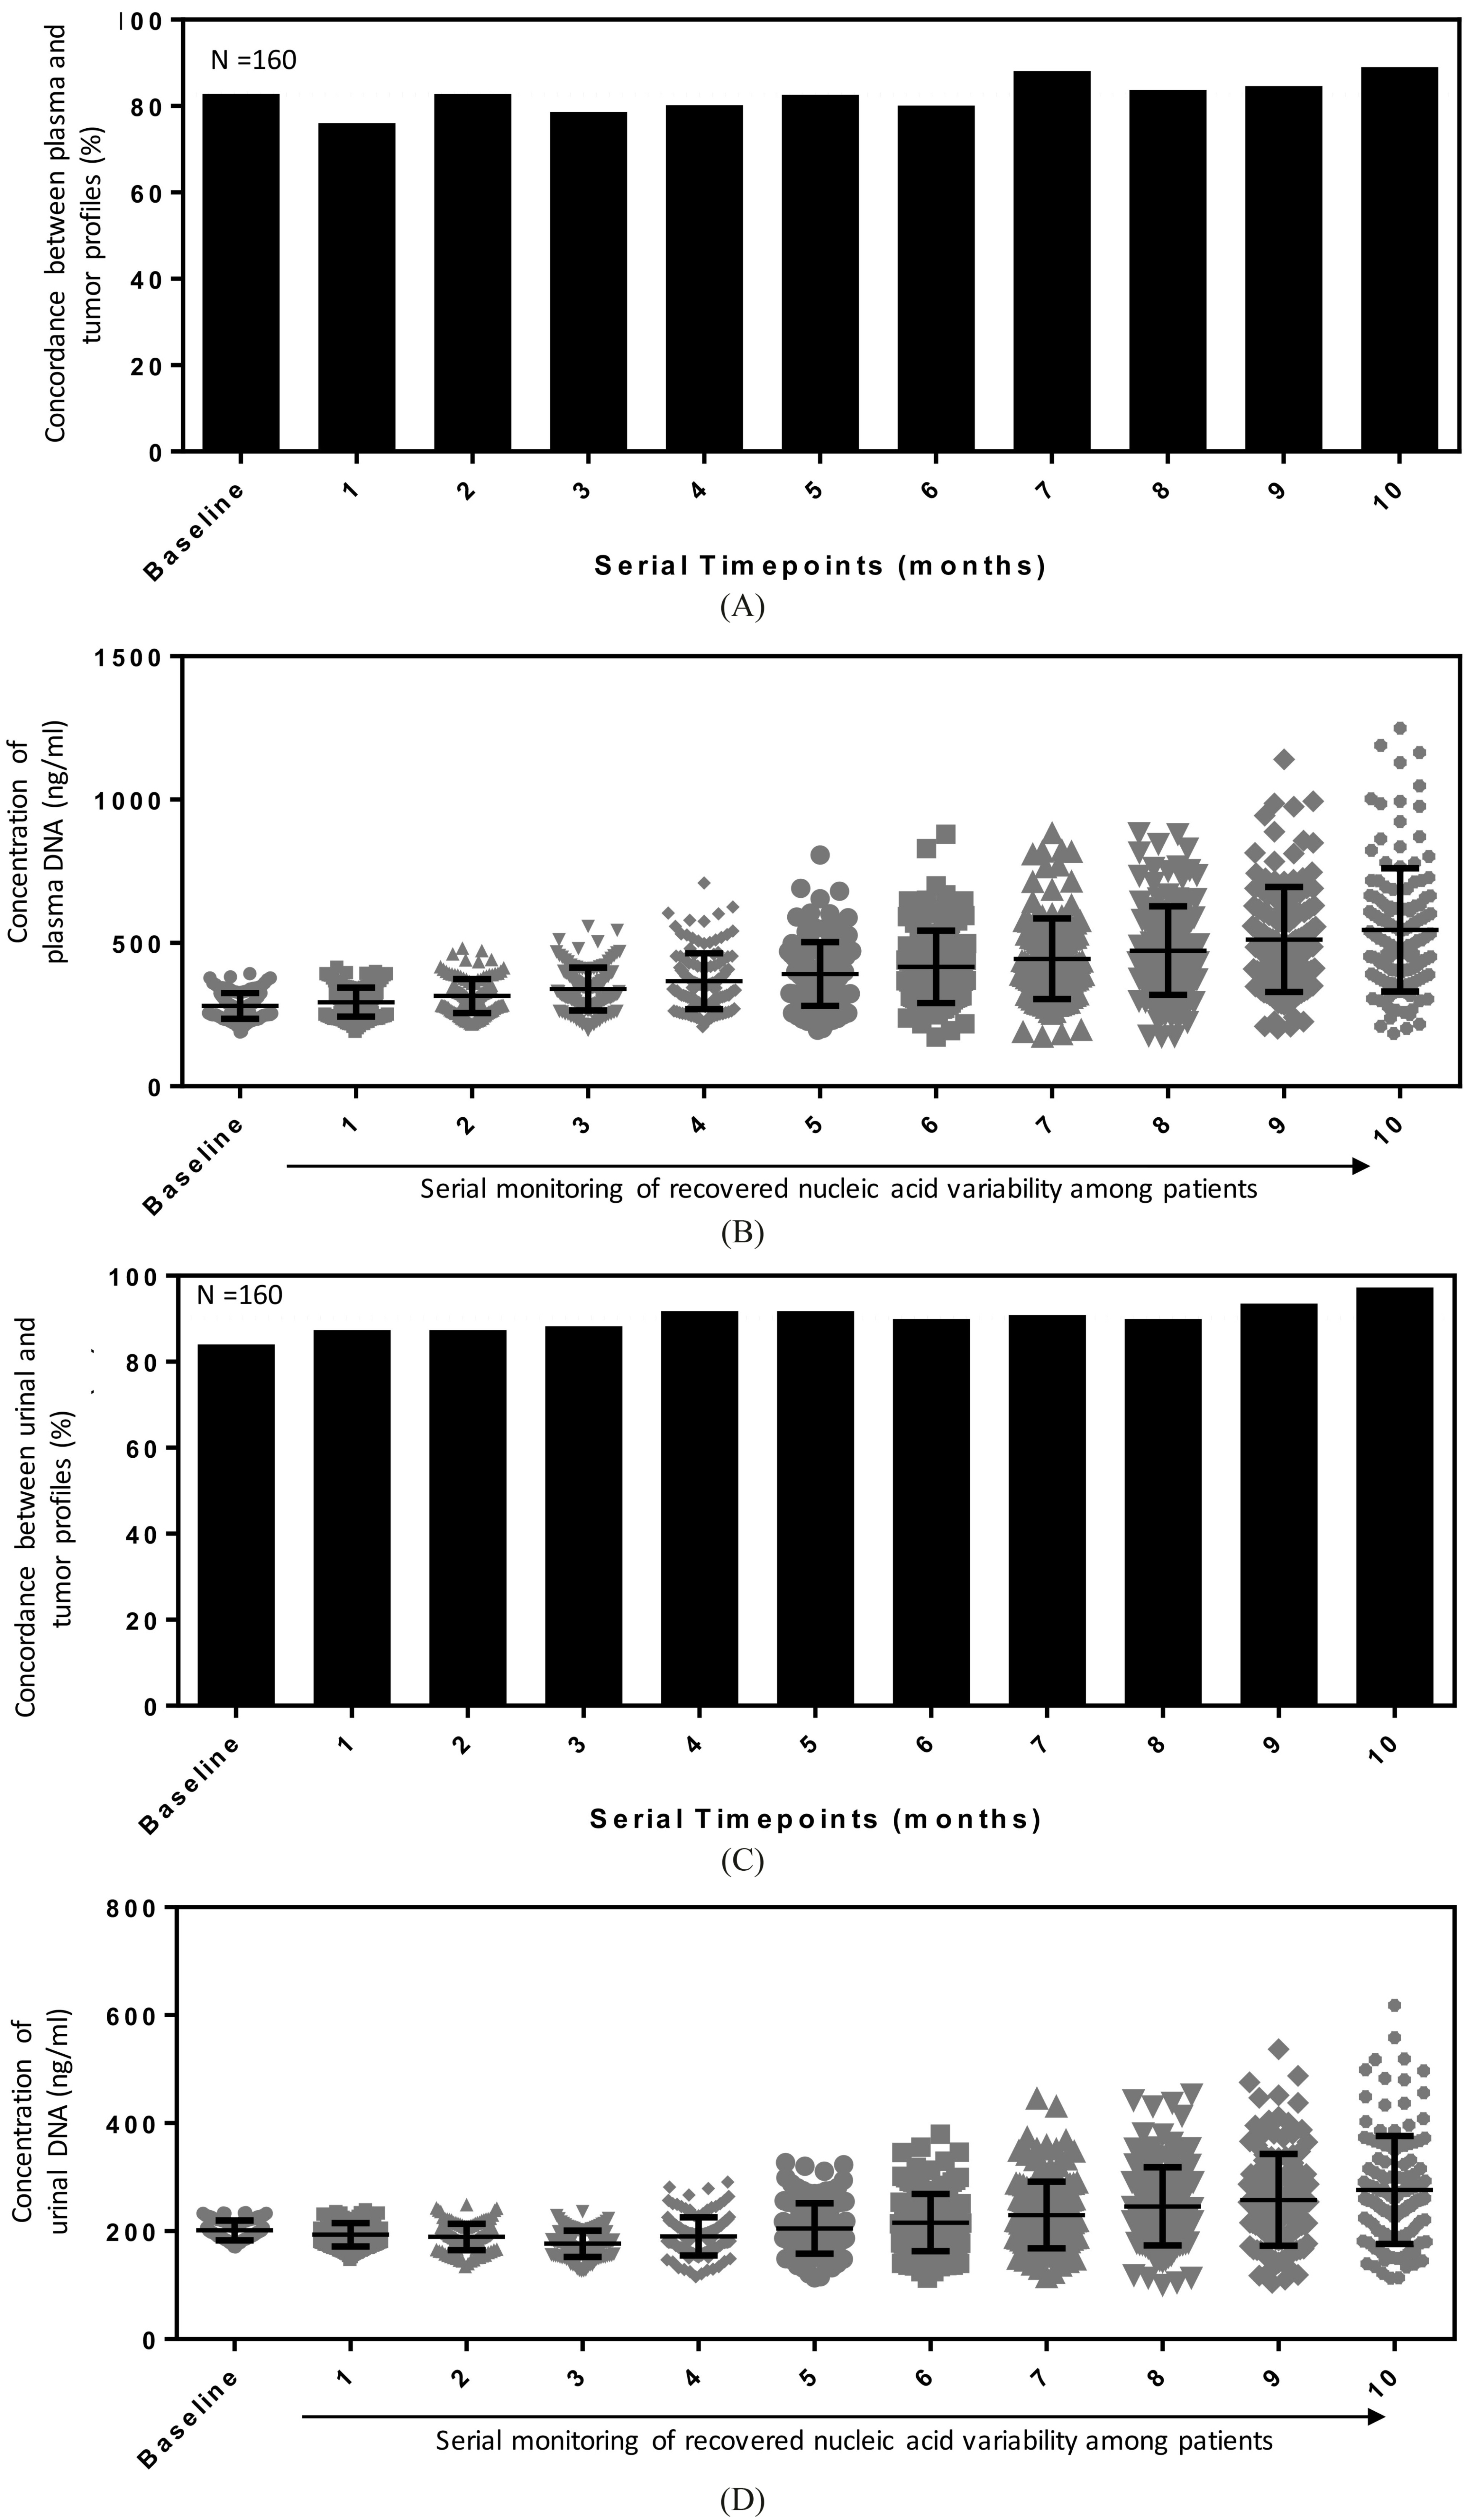
Survival analysis of late stage NSCLC patients and separated using circulating DNA content. (A) An equal split of the patient cohort based on the amount of plasma DNA showed HR of 1.23.(B) Equal split of the patient cohort based on maximum urinal DNA concentration showed an HR of 2.55.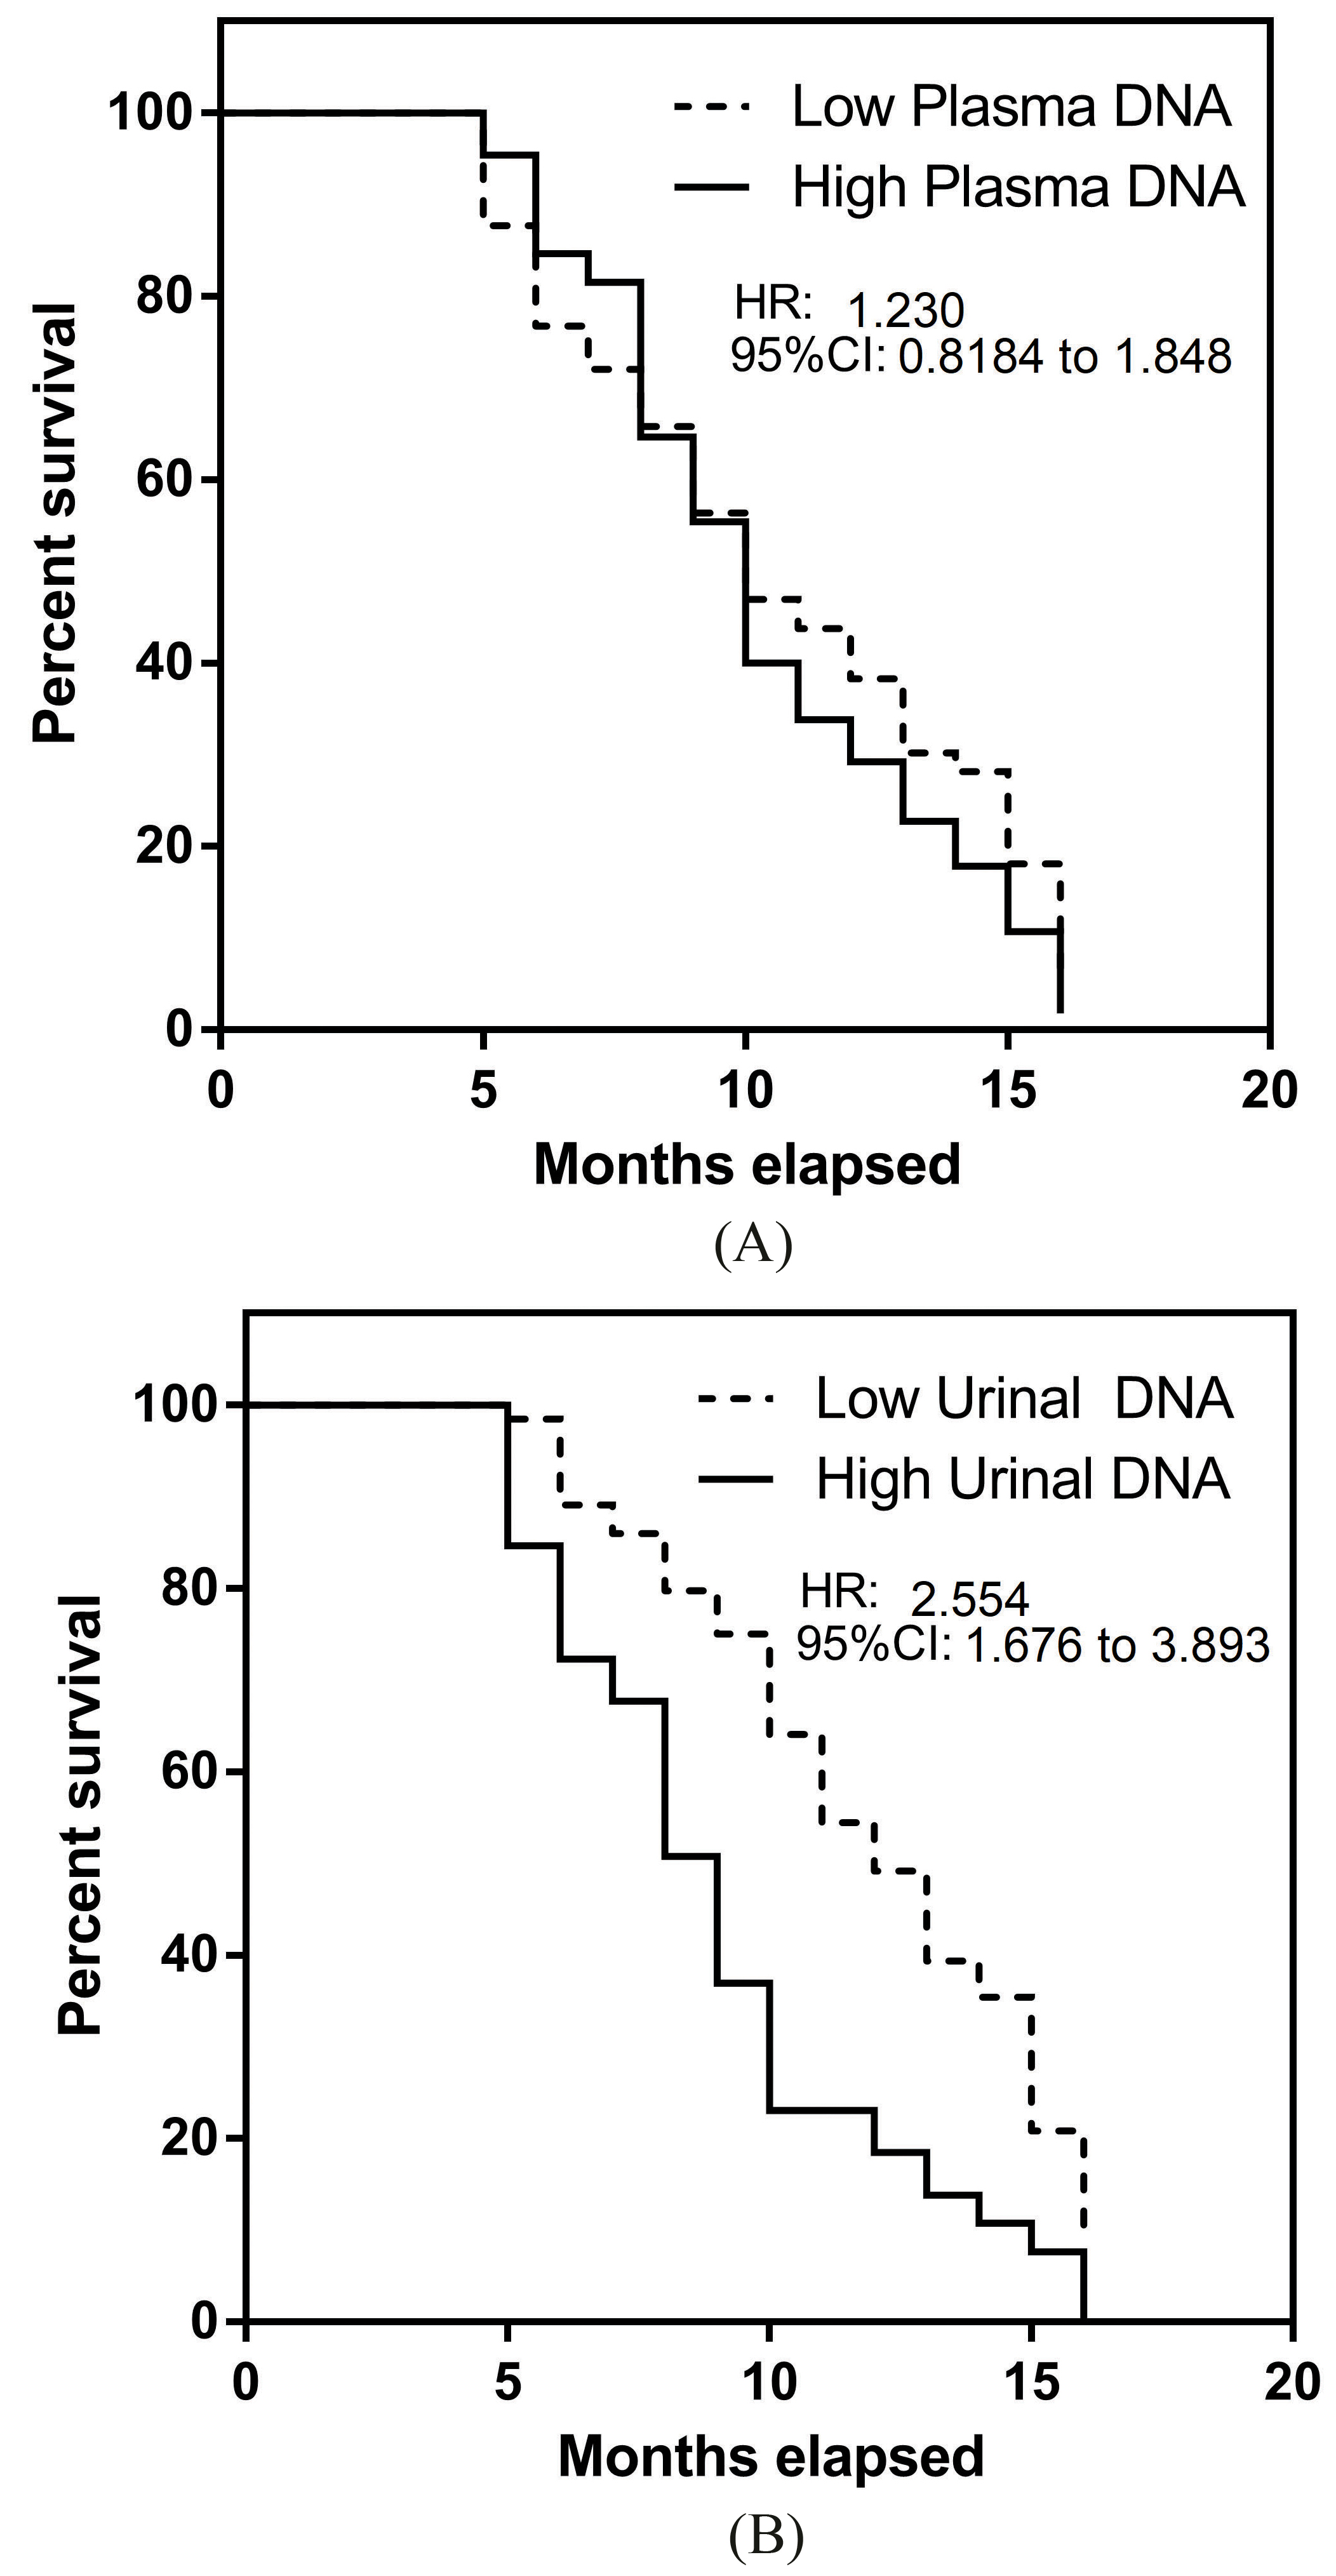
At baseline, we compared the amount of DNA recovered from either the urine or plasma specimens. For all patients, 3 ml of plasma and 5 ml of concentrated urine samples were processed. The recovered DNA concentrations for both media specimens were collated in Fig. 3A. The Spearman’s rank correlation coefficient was 0.654 and indicated statistical significant correlation between both parameters. As noted in Fig. 3B, the mean recovered plasma DNA concentration was 280 ng/ml (95% CI 272 to 288 ng/ml) with coefficient of variation (CV) of 16.1%. With recovered urinal DNA, the mean recovered concentration was 202 ng/ml (95% CI 198 to 205 ng/ml). The corresponding CV was 9.1%. The results demonstrated a smaller sample variation in urinal DNA specimens. We further divided the patient groups based on their EGFR mutation profiles to investigate if there were any possible differences in recovered DNA. As observed in Fig. 3D, there were insignificant differences between all three NSCLC groups using a one-way ANOVA. Mean recovered DNA using plasma DNA for L858R positive NSCLC patients, patients with exon 19 deletions and EGFR wildtype characteristics were 281 ng/ml (95% CI 269 to 292 ng/ml), 280 ng/ml (95% CI 269 to 291 ng/ml) and 280 ng/ml (95% CI 267 to 292 ng/ml) respectively. For urinal DNA, the mean concentrations for L858R, exon 19 deletions and EGFR wildtype patients were 200 ng/ml (95% CI 196 to 205 ng/ml), 203 ng/ml (95% CI 198 to 207 ng/ml) and 194 ng/ml (95% CI 190 to 198 ng/ml) respectively.
Longitudinal analysis of plasma and urinal DNA in NSCLC patients
Serial monitoring of NSCLC patients were conducted at monthly intervals to gauge sample variability. This also provided the specificity measure for both plasma and urinal DNA in EGFR mutation testing. For comparison studies, the molecular profile from each patient was compared with their index tissue sample results. Repeat tumor tissue extraction is challenging and unlikely to be accepted by patients. EGFR driver mutations that exist in patients are likely stable throughout their disease and hence are good parameters to gauge assay validity.
Figure 4A shows the agreement rates for plasma DNA samples at different time points. We observed a mean agreement of 82.6% with variations 4.7% (CV) between different measurement time points. A number of patients died before the 10-month monitoring period and last result collected was assumed to be true in subsequent analysis. Interestingly, these patients had consistent EGFR detection prior to their death. To understand the direct association with DNA quantity changes during monitoring, we also tabulated the recovered DNA concentrations at different time points. A repeat measure ANOVA was performed and it was statistically significant in the measurements at different time points. A monotonic increasing trend was observed from the mean detected plasma DNA concentrations as shown in Fig. 4B. For urinary DNA, the agreement with tissue biopsies were fairly consistent with lower CV (3.9%) measurements (Fig. 4C) compared with plasma DNA. Mean concordance rate was 90.2%. The trending for urinal DNA quantity differed slightly from plasma results. A dip in mean concentrations was observed initially and a monotonic increasing trend was observed after 4 months.
As the quantity of DNA could be linked to tumor burden and hence disease severity, we analyzed the overall survival results of these patients using the Kaplan Meier (KM) estimator. A median split in patient cohort based on recovered DNA quantity was performed to prevent selection bias. Sample sizes were equal in both KM analysis on plasma (Fig. 5A) and urinal (Fig. 5B) DNA. In the case for plasma DNA, a marginal effect was seen for patients with higher plasma DNA (HR
Discussion
Our findings demonstrate that both plasma and urinal DNA in late stage NSCLC patients correlated well to tumor tissue biopsy. The potential utility of these alternative sources of tumor material presents opportunities to better monitor the disease. During disease progression, resistance mechanism may develop, which warrants close supervision. For instance, NSCLC patients with sensitizing EGFR mutations and placed on TKIs may subsequently developed secondary EGFR-T790M mutation. T790M mutation leads to resistance to most clinically available EGFR TKIs [17]. TKIs are the first-line options for late stage NSCLC patients harboring sensitizing EGFR mutations and will benefit from more intense scrutiny for patients on treatment. In agreement with our findings, Thress et al. [18] analyzed multiple platforms for plasma DNA in lung cancer patients with EGFR mutations to support the AZD9291 clinical development program to ascertain new therapy efficacy. The study further showed that digital detection platforms such as ddPCR outperformed all other competing technologies for identifying the T790M EGFR mutation. Analysis of our detection assay demonstrated good sensitivity for L858R, Exon 19 deletions and T790M mutations at very low concentrations of spiked samples and were effective without prozone effect up to 1000 copies/ul. In most cases, the challenge in cell free DNA is the low mutant allelic frequencies in patients [19] and the need for sensitive detection. For patients with higher counts, samples can be diluted if necessary before testing, similar to routine blood and urine chemistry testing. Separately, our urinal DNA testing provided conclusive data as well, consistent with numerous studies [20, 21]. Chen et al. [20] for showed good correlation to treatment efficacy using urinal DNA for EGFR NSCLC patients. In our matched analysis, we observed a strong link between both measurement methods in terms of the concentration of recovered nucleic acid from late stage NSCLC patients. However, we noted that slight discordance in EGFR profiles existed using plasma and urinal DNA for EGFR positive patients. To reduce potentially false negatives, plasma and urinal DNA will be complementary to enhance the detection.
In the baseline measurement, we did not observe any significant differences using either plasma or urinal DNA. The PPV of both assays demonstrated 100% value to utilize the assay for EGFR detection in late stage NSCLC. The attractiveness of the methodology compared with conventional tissue biopsy is that this is relatively non-invasive. Comparing to imaging modalities that measures tumor growth and spread of disease, measuring circulating DNA potentially provides more responsive changes to tumor burden [22]. In our current study, this was not explicitly addressed but we observed a significant increase in DNA quantity with the progress of the disease in these patients. Quantity of DNA with either body fluids also demonstrated good prognostic capabilities in our observed survival analysis. The genetic profile is an important clinical parameter to align treatment for NSCLC patients. However, genetic alterations in NSCLC is dynamic, largely affected by several core factors such as treatment pressure and genetic instability. T790M is one such change [23] that can be induced during the course of TKI therapy and rapid identification will be key to switch treatment to 3
Overall, we observed that the trends associated with both plasma and urinal DNA remain fairly consistent. In serial measurements with patient samples, we observed that the results were fairly similar for 10 months post baseline measurements. CV values showed relatively small variations in both concordance measurements for plasma and urinal DNA profiling of EGFR mutations. This affirms the stable release of tumor materials into the patients’ circulatory system and could potentially be useful as a serial monitoring marker. Interestingly, we observe slightly better agreement with tissue biopsy results for urinal DNA at the end of 10 months comparing with baseline reference profiling. This could be attributed to more tumor materials being released and subsequently picked up in the urine specimens. The rise was seen from 84% at baseline to 97% at the end of the monitoring period. Other trends that was observed was the increasing concentration of nucleic acid recovered from the same volume of samples. In both cases, we observed that both plasma and urinal DNA demonstrated an increasing trend and it will possibly be useful to ascertain its direct correlation to tumor burden for these patients.
Conclusion
The use of circulating biomarkers for disease management of NSCLC patients presents an interesting opportunity to further probe the disease. In the current study, we observed the trends for both plasma and urinal DNA that existed in advance stage NSCLC patients. Using EGFR as a model, we demonstrated that both sources of body fluids contained tumor DNA matched with conventional tumor biopsy. These circulatory markers’ stability was affirmed in longitudinal investigations and the absolute quantity derived from both urine and blood correlated well to the survival outcomes for these patients. We postulate that both markers will be complementary and will further aid to allow better disease probing and monitoring.
Footnotes
Acknowledgments
This study was supported by a research grant provided by the Xiangyang Central Hospital, Hospital Affiliated to Hubei University of Arts and Science.
Conflict of interest
The authors declare that they have no conflict of interest.
Supplementary data
ROC analysis of NSCLC patients using (A) plasma DNA and (B) urinal DNA. The area under the ROC(AUROC) was computed to gauge assay strengths.