
Abstract
BACKGROUND:
Chronic myeloid leukemia (CML) is a clonal myeloproliferative disorder with heterogeneous biological and clinical features. The biomolecular mechanisms of CML response to tyrosine-kinase inhibitors are not fully defined.
OBJECTIVE:
We undertook a gene expression profiling (GEP) study of selected bone marrow (BM) CD34+/lin- cells of chronic-phase CML patients at diagnosis and after 12 months of TKI nilotinib to investigate molecular signatures characterizing both conditions.
Introduction
Chronic myeloid leukemia (CML) is a clonal disorder characterized by the malignant expansion of stem cells of myeloid origin in the bone marrow. CML presents a reciprocal association between chromosomes 9 and 22 yielding the BCR-ABL fusion protein with overactive tyrosine kinase activity [1]. CML is treated with tyrosine kinase inhibitors (TKIs) which have dramatically improved the long-term survival of CML patients to approximately 80% [2]. Among the TKIs, nilotinib is a very effective drug in the treatment of sensitive or imatinib-resistant patients in the clinic [3].
Although successful hematologic and cytogenetic responses have been obtained in the vast majority of nilotinib-treated patients, cases showing resistance to nilotinib have been observed demonstrating the recurrence of the BCR-ABL clone [4]. The incapability of the TKI to eradicate the disease completely is best explained by intrinsic and acquired drug resistance in leukemic stem cells (LSCs) [5, 6]. In literature, it is assumed that only a small subset of leukemic cells displays self-renewal and long-term disease-propagating capacity [7]. According to in vitro studies, LSCs are insensitive to currently available TKIs [8, 9]. Biological studies on the leukemic stem/progenitor cells are focused on the identification of their specific genetic and phenotypic characteristics hampered by the rarity of these cells [10]. There is a growing acceptance that within the total CD34+ stem/progenitor cell population only a small fraction represents the quiescent and functionally primitive CML stem cells [11].
Current research aims to elucidate the genetic and biological mechanisms of TKI-resistance in CML stem cells in order to find LSC-specific targets and novel drugs that are able to eradicate the LSCs [12].
In recent years, several GEP studies have been performed in CML to understand the complex biology of this disorder [13]. Microarray technology represents a unique tool to analyze the transcriptional profile of the CML stem and progenitor cells [14].
Multicenter studies showed that a list of common genes were not found yet [15, 16]. The lack of a robust common predictive molecular signature is probably due to different experimental conditions such as the use of different biological samples (e.g. bone marrow or peripheral blood samples, mononuclear or selected CD34+ cells), different sample size ranging from 20 to 100, and different generations of genechips. In addition, different bioinformatics pipelines were used to analyze data such as univariate statistical methods, e.g. the t-test or the significance analysis of microarray statistic, and multivariate gene selection methods [17]. Several studies used microarray on pretherapeutic samples to determine molecular signatures to predict the response to TKI, but also in this case there was no overlap between the gene lists [18]. Although recent studies have indicated a reliable patient characterization using unsupervised gene expression biomarker identification, they were not able to demonstrate reliability for clinical use [19]. Still, genome-wide differential expressed based biomarkers show stability across heterogeneous studies of clinical samples [20]. Thus, there remains a clear need to identify novel targets specific to the CML LSCs [21].
In the contest of the REL-PhilosoPhi34 study (EudraCT: 2012-005062-34) on behalf of the Rete Ematologica Lombarda (REL), we decided to enroll 87 chronic-phase CML patients treated with first-line nilotinib therapy 300 mg BID. In this study, we selected and counted BM CD34+/lin- cells of 30 CML patients at diagnosis, and during nilotinib treatment (at 3, 6, and 12 months) to determine the effect of nilotinib on the number of cells.
Therefore, we performed GEP on the selected BM CD34+/lin- cells of 30 patients with chronic-phase chronic myeloid leukemia at diagnosis vs. the same patients after 12 months of nilotinib treatment. We used Human Transcriptome Array 2.0 (HTA) GeneChip (Affymetrix, Santa Clara, CA, USA) to investigate the pathways and the transcriptional signatures characterizing CML patients at diagnosis and after 12 months of nilotinib treatment.
Materials and methods
Patients and sample collection
The study analyzed 30 chronic-phase CML patients at diagnosis and at 3, 6 and 12 months of first-line nilotinib treatment. Samples were collected on the behalf of the Rete Ematologica Lombarda (REL) the PhilosoPhi34 study (EudraCT: 2012-005062-34), which included 15 centers from Italy. We investigated 32 patients with CML and bone marrow blood samples were collected at diagnosis and after 3, 6 and 12 months of nilotinib treatment. All BM samples were collected after informed consent was obtained. Patients received first line therapy with nilotinib 300 mg BID. In order to obtain GEP data of 30 patients at diagnosis vs. 12 months of nilotinib, we considered 32 patients in our study, as we discarded 2 patients from the GEP analysis because one patient discontinued treatment for toxicity and another patient withdrew consent.
Automated isolation of bone marrow CD34+/lin- cells using immunomagnetic beads
Mononuclear cells (MNCs) from the bone marrow (BM) blood samples (range, 1–25 ml) of 30 CML patients were isolated using Ficoll density gradient centrifugation at 800 rpm for 20 minutes. Immediately after, we selected the BM CD34+/lin- cells. BM CD34+/lin- cells were isolated by the immunomagnetic separation technology, which included Diamond CD34 Isolation kit and autoMACs Pro separator (Miltenyi Biotec, Bologna, Italy) according to the manufacturer’s instructions. Briefly, BM MNCs were labeled with a mix of biotin-conjugated antibodies against lineage-specific antigens. Immediately after, these cells were labeled with Anti-Biotin Microbeads. We selected the lineage-negative stem and progenitor cells by the depletion of the magnetically labeled cells. BM CD34+/lin- cells were obtained from the lineage-negative stem and progenitor cells using CD34 Microbeads (Miltenyi Biotec). The purity of the isolated BM CD34+/lin- cells was detected by flow cytometry.
FISH
Isolated BM CD34+/lin- cells were tested by standard FISH for the 30 patients at diagnosis and after 12 months of nilotinib treatment. For each patient, a small sample of selected CD34+/lin- cells (containing at least 10
FISH analyses were performed using fluorescence microscope Axioskop 2 (Carl Zeiss Microimaging GmbH, Göttingen, Germany), equipped with a UV 100-W lamp (Osram, Augsburg, Germany), ProgRes MF CCD camera (Jenoptik AG, Jena, Germany), and ISIS System Software (MetaSystems Hard & Software, Althlussheim, Germany).
At least, 200 interphase nuclei were counted from each suitable specimen (optimum: 300 nuclei). Each available interphase nucleus was read even in sub-optimal specimens. Results were described according to the International System for Human Cytogenetic Nomenclature (ISCN) [24].
Counting of BM MNCs, BM CD34+/lin- cells and cell cryopreservation
BM MNCs as well as BM CD34+/lin- cells of all 30 CML patients were counted at diagnosis and during the treatment with nilotinib (at 3, 6, and 12 months, respectively). The cell samples were diluted in Trypan blue, immediately after the cells were counted using hemocytometer and the number of cells for each sample was calculated using the following formula: Total cells counted
Selected BM CD34+/lin- cells of 30 patients at diagnosis were resuspended in 50
We preserved the BM CD34+/lin- cells after 3, 6 and 12 months of nilotinib treatment as follows: BM CD34+/lin- cells were resuspended in 50
RNA extraction
Total RNA was isolated from the BM CD34+/lin- cells of CML patients, which were previously stored in RNAlater. RNA extraction was performed using MagMAX 96 Total RNA Isolation Kit (Thermo Fisher Scientific) according to the manufacturer’s instructions. The quality and the yield of the extracted RNA were measured using Nanodrop (Thermo Fisher Scientific).
RNA extraction of the BM CD34+/lin- cells stored in Prelude direct Lysis module (NuGEN) was not performed because of a too low number of cells and the RNA processing was directly performed starting from the cells.
GEP experiments
Microarray experiments were performed on the BM CD34+/lin- cells of 30 CML patients at diagnosis as well as those after 12 months of nilotinib treatment. We prepared cDNA starting from the previously extracted RNA (50 ng) using Ovation Pico WTA System V2 kit (NuGEN) and Encore Biotin Module Kit (NuGEN) following the manufacturer’s instructions. Ultimately, cDNA was hybridized to Affymetrix HTA 2.0 using the GeneChip platform (Affymetrix) and signals were scanned by Affymetrix GeneChip Scanner 3000 according to the manufacturer’s instructions.
For the BM CD34+/lin- cells stored in Prelude direct Lysis module (NuGEN), we decided to directly prepare cDNA starting from 3
GEP analysis and bioinformatics methods
We analyzed the GEP of BM CD34+/lin- cells of 30 CML patients at diagnosis and the same 30 CML patients after 12 months of nilotinib treatment to investigate the gene expression changes induced by nilotinib treatment.
The processing of microarray raw data was performed using Affymetrix Expression Console 1.3.1. This software was also used for quality control by assuring that all hybridization controls were within bounds. In this step, the measured signal intensities of the 6 million probes were summarized into probe sets specific for a given gene locus, realizing a one-to-one assignment of probe sets and genes. Data was first pre-processed using ComBat to adjust for batch effects and quantile normalization [25]. We investigated differential after expression at 12 months vs. diagnosis, using SAM test [26]. Selection was performed using the R statistical computing software (
We then applied DAVID functional clustering to the selected genes to classify them into functional groups based on their annotation term co-occurrence, limiting the results to those groups that resulted enriched according to a nominal p-value lower than 5% [28, 29].
Results
FISH
FISH analysis detected CD34+/lin- Ph+ cells in 30 CML patients at diagnosis. No positive Ph+ nuclei were detected on CD34+/lin- cells after 12 months of treatment (to categorize a sample as negative, at least 200 nuclei were examined).
Evaluation of the number of BM CD34+/lin- cells at diagnosis and after 3, 6 and 12 months of nilotinib treatment
We noticed a wide variability of the number of BM MNCs as well as the number of the BM CD34+/lin- cells among the 30 CML patients at diagnosis and after 3, 6 and 12 months of nilotinib for each patient. Table 1 showed the range, average and standard deviation of the number of the BM MNCs and the BM CD34+/lin- cells of the 30 CML patients at diagnosis and after 3, 6 and 12 months of nilotinib treatment.
Range, average and standard deviation of the number of BM MNCs as well as the number of the BM CD34+/lin- cells among the 30 CML patients at diagnosis and after 3, 6 and 12 months of nilotinib
Range, average and standard deviation of the number of BM MNCs as well as the number of the BM CD34+/lin- cells among the 30 CML patients at diagnosis and after 3, 6 and 12 months of nilotinib
The number of the BM CD34+/lin- cells of the 30 CML patients was in median (m): m
Figure 1 showed that the number of the BM CD34+/ lin- cells dramatically decreased between the diagnosis and after 3 as well as 6 months of nilotinib treatment. We noticed that the BM CD34+/lin- cells slightly increased between 6 and 12 months of nilotinib treatment.
Boxplot of the number of BM CD34+/lin- cells at diagnosis and after 3, 6 and 12 months of nilotinib of the 30 CML patients.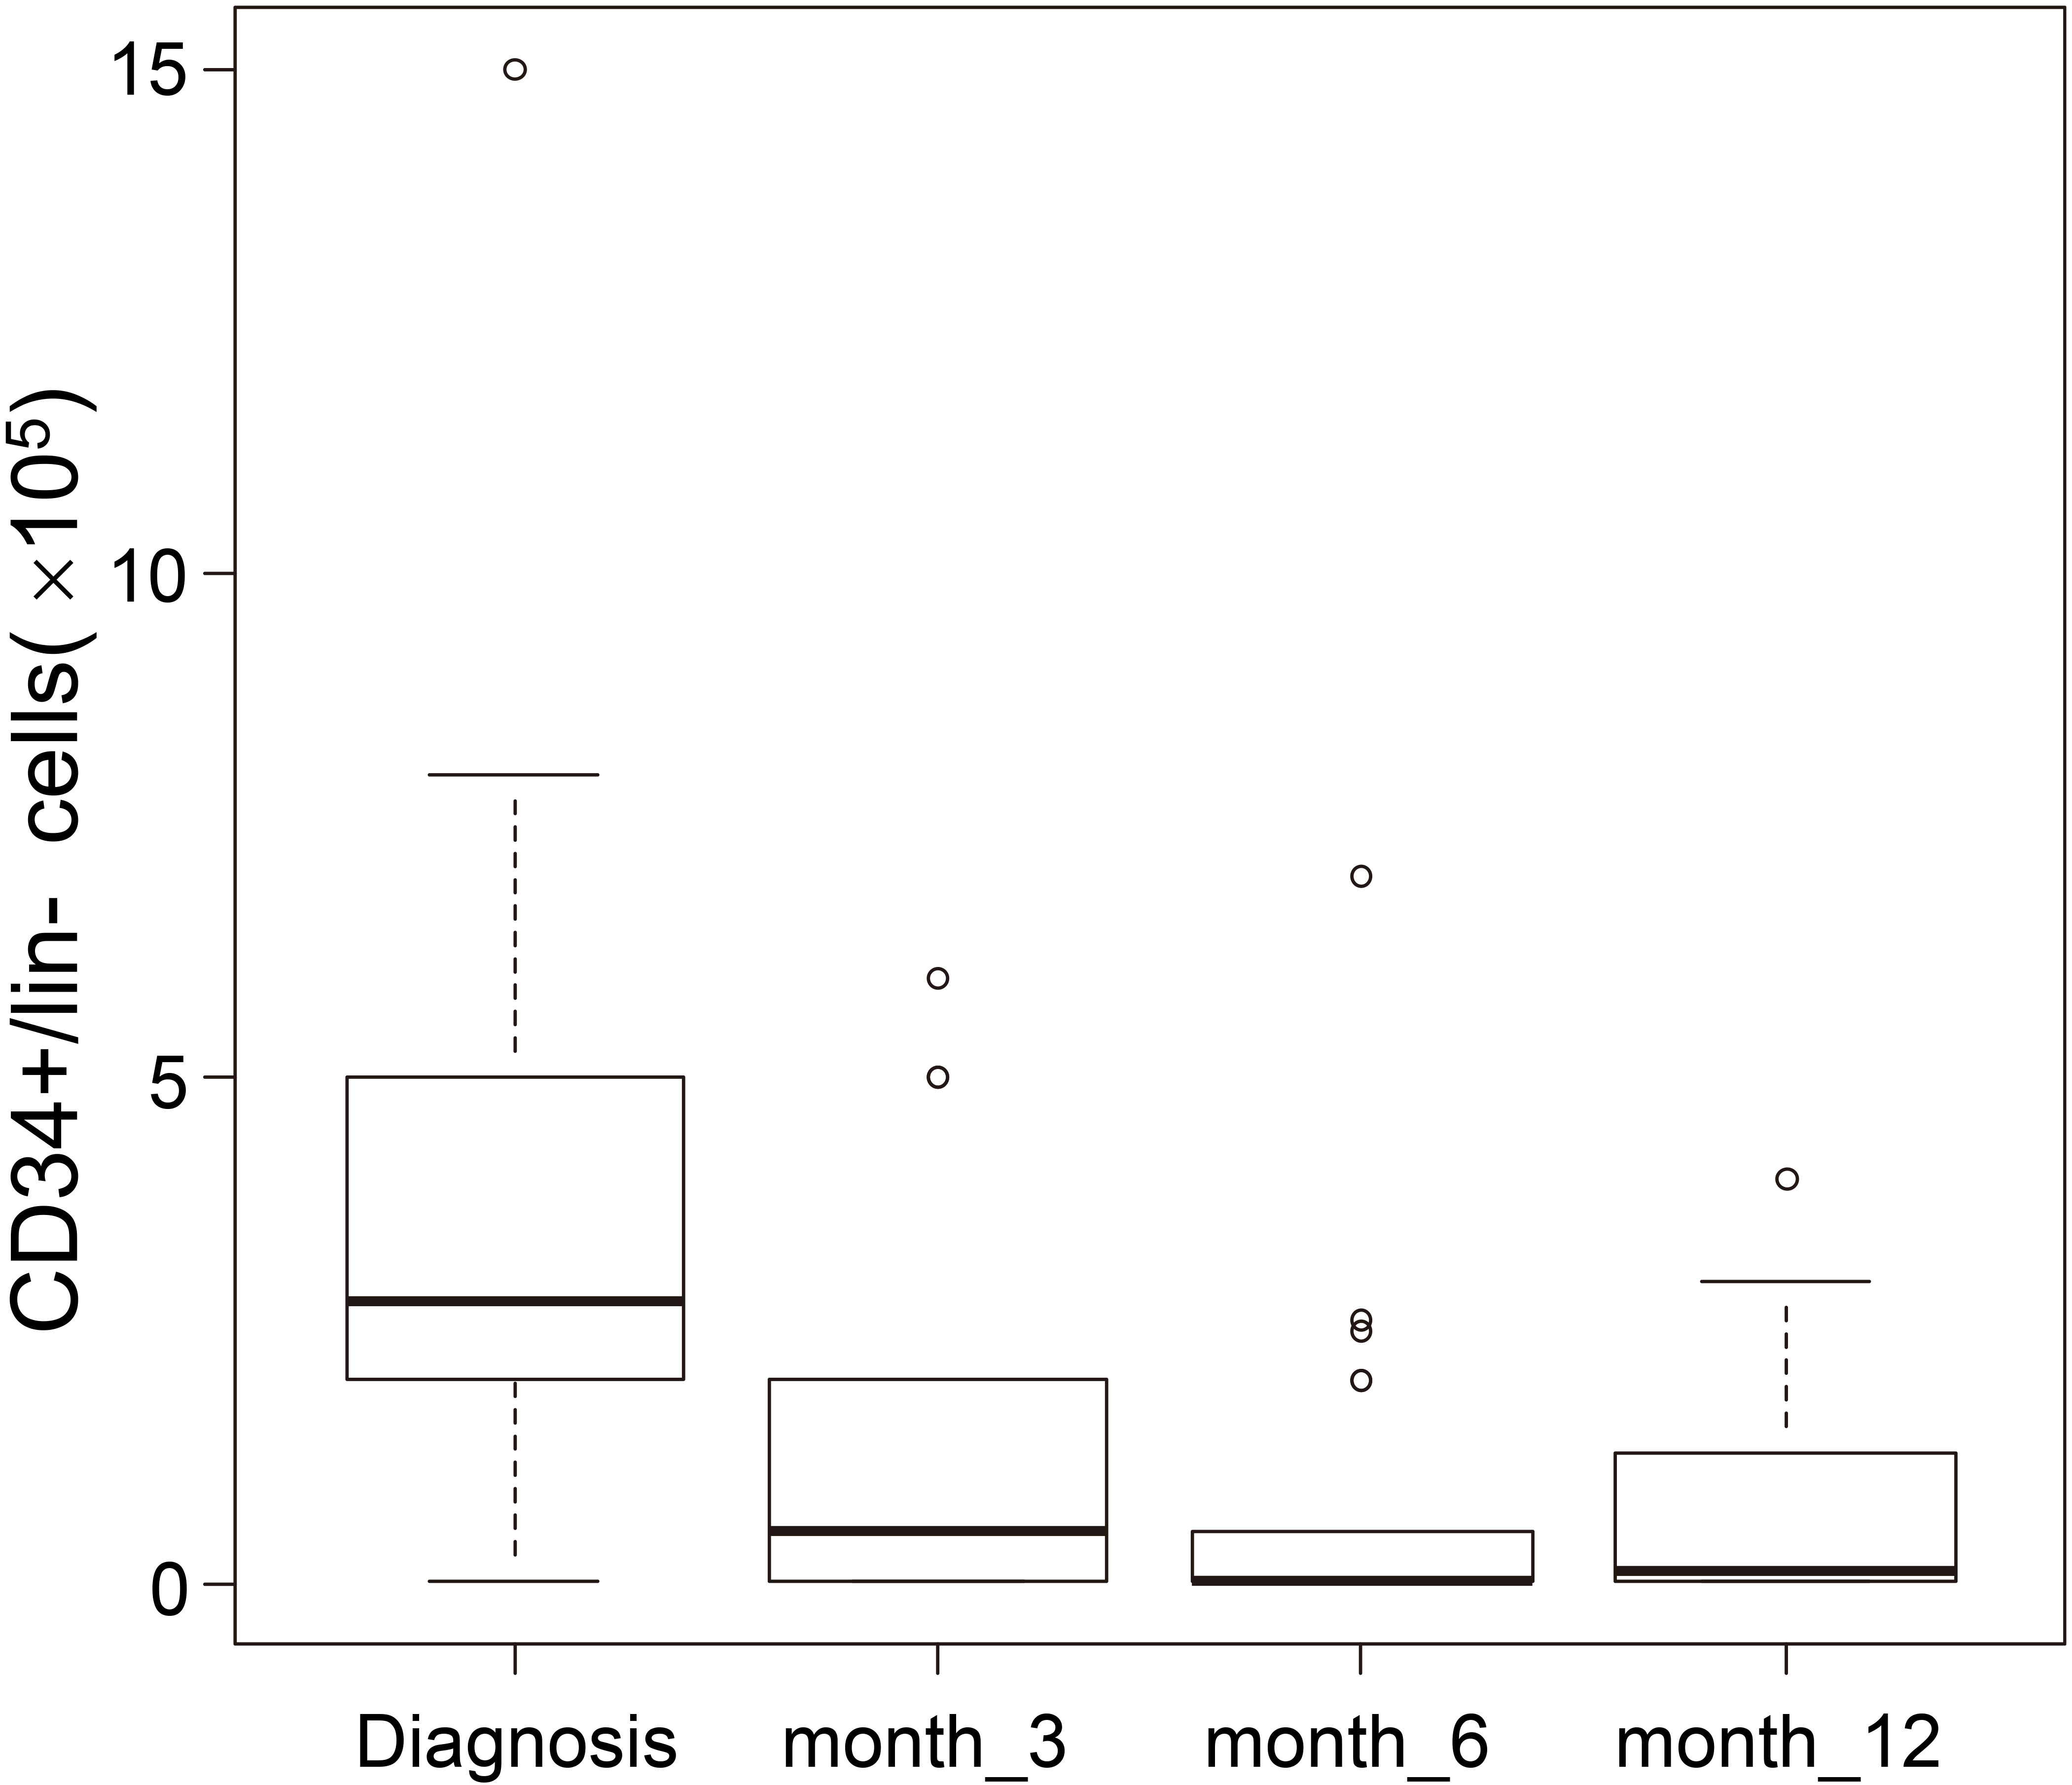
The purity of BM CD34+/lin- cells was
Bioinformatic analysis
Preprocessing of HTA 2.0 array of CD34+/lin- cells of 30 CML patients at diagnosis and after 12 months of nilotinib treatment
After microarray processing, principal component analysis (PCA) and MvA plots, representing gene expression differences between arrays (M) against their average (A) in log scale, were examined. No batch effects or residual systematic differences between all the 30 arrays were observed in the data after ComBat and quantile normalization.
Identification of genes and pathways deregulated between BM CD34+/lin- cells of 30 CML patients at diagnosis vs. 12 months of nilotinib treatment
The differential expression analysis detected 445 probes differently expressed between CML patients at diagnosis compared to 12 months of nilotinib treatment. Of these, 278 were annotated on a total of 264 differentially expressed genes (Supplementary file 1). Functional enrichment clustering revealed a number of interesting functional groups of genes (see Table 2).
Selection of genes with significantly differential expression in BM CD34+/lin- cells from CML patients at diagnosis vs. 12 months of nilotinib treatment
Selection of genes with significantly differential expression in BM CD34+/lin- cells from CML patients at diagnosis vs. 12 months of nilotinib treatment
The following genes regulating lipid metabolism AGPAT4, LPCAT3, MBOAT2, ELOVL6, GDPD1, APOC1, ACSM3 were under expressed whereas PLD4, GLIPR1, SPNS3 were over expressed after 12 months of nilotinib, respectively. Recent studies demonstrated the involvement of lipid metabolism in CML. HDL, LDL and cholesterol levels increased significantly in patients treated with nilotinib [30, 31].
HK1, PDK3, UGGT1 genes belonging to the glucose metabolic processes were down regulated after 12 months of nilotinib. HK1 encodes a hexokinases which catalyze the first essential step of glucose metabolism, the conversion of the substrate glucose into glucose-6-phosphate. PDK3 encodes one of the major enzymes responsible for the regulation of glucose metabolism. It plays a role in glucose homeostasis and in maintaining normal blood glucose levels in function of nutrient levels and under starvation. In previous studies nilotinib showed to influence glycemia and insulin sensitivity in CML patients [30].
PRKAR2A, PRKAR2B, PTPN1, MARCKS, CAB39, RXFP1, SORT1, TBC1D4 regulating insulin metabolic processes were down regulated after 12 months of nilotinib treatment. In particular, MARCKS was up regulated in CML LSCs compared to normal LCSs [32]. The protein encoded by MARCKS is probably involved in cell motility, phagocytosis, membrane trafficking and mitogenesis.
Sphingolipid metabolism
GEP results showed that SGMS2 and SGPP1 were under expressed in CML CD34+/lin- cells after 12 months of nilotinib with respect to diagnosis. Sphingolipid such as ceramide and sphingosine-1-phosphate have been described as bioactive lipids in cell death, proliferation, migration, secretion, autophagy and immunity. The main backbone molecule of sphingolipid network is ceramide, which was firstly reported to induce cell differentiation, and death in human leukemia HL-60 cells [33].
SGMS2 and SGPP1 are both enzymes that regulate biologic processes in sphingolipid metabolism. Previous studies showed that the activity of SGMS2 in chemio-resistant leukemia blasts increased higher as compared to chemosensitive ones, leading to a decrease of ceramide-dependent cell death [33]. A recent in vitro study demonstrated that the inhibition of SGMS2 increased ceramide levels and cell death in human leukemia Jukart cells [33].
Complement and coagulation cascade
CR1, HBB, HBBP1, HBD, HBG2, SERPINE2, KEL genes were down regulated while
A previous study showed that KEL was over expressed in chronic phase CML HSC [35]. Functionally, the gene has been proposed to participate in vasoconstriction and proteolysis.
Platelet activation
GEP data demonstrated that TLN1, FCGR2A, ITGA2B were over expressed at diagnosis compared to 12 months of nilotinib treatment. FCGR2A and ITGA2B were over expressed in CML CD34+ cells compared to healthy CD34+ cells [34, 35, 36]. All of these genes play a crucial role in blood coagulation system by mediating platelet activation. Platelets play a key role for primary hemostasis on the disruption of the integrity of vessel wall. Platelet adhesion and activation at sites of vascular wall injury is initiated by adhesion to adhesive macromolecules. Different receptors are stimulated by various agonists, almost converging in increasing intracellular Ca2+ concentration that stimulate platelet shape change and granule secretion and ultimately induce the “inside-out” signaling process leading to activation of the ligand-binding function of integrin alpha IIb beta 3 protein encoded by ITGA2B gene. Binding of alpha IIb beta 3 to its ligands, mainly fibrinogen, mediates platelet adhesion, aggregation, and triggers “outside-in” signaling, resulting in platelet spreading, additional granule secretion, stabilization of platelet adhesion and aggregation, and clot retraction.
TLN1 is involved in the adhesion of one platelet to other platelets via adhesion molecules. FCGR2A encodes one member of a family of immunoglobulin Fc receptor genes found on the surface of many immune response cells. The protein encoded by this gene is a cell surface receptor found on phagocytic cells such as macrophages and neutrophils, and is involved in the process of phagocytosis and clearing of immune complexes.
Cytoskeleton, cell adhesion molecules and stem cell niche
CDH2, ICAM4, SELL, TEK genes are cellular adhesion molecules involved in the cytoskeleton organization and stem cell niche. Our study showed that ICAM4 and TEK were under expressed whereas CDH2 and SELL were over expressed after 12 months of nilotinib, respectively.
Diaz-Blanco et al. demonstrated that ICAM4 and TEK were under expressed whereas SELL and CDH2 were over expressed in healthy CD34+ cells compared to CML CD34+ cells, respectively [34, 35]. Moreover, ICAM4 and SELL genes encode adhesion molecules that are involved in the interaction of the stem cell and its niche [34, 35]. Krause et al. demonstrated that CML progenitors showed reduced expression of SELL gene but the functional consequences are still unknown [37].
Transport
The following solute carrier family: mitochondrial carriers (SLC25A33, SLC25A37, SLC25A38), carrier involved in insuline resistance (SLC27A2), SLC43A3 and SLC4A4 genes were over expressed at diagnosis compared to 12 months of nilotinib. In particular, recent studies showed that SLC4A4 exhibited a plasma membrane protein and it was up regulated in CML stem cells compared to normal stem cells [35, 38].
ABC transporter multidrug resistance (MDR)
In our study, ABCC5 was under expressed after 12 months of nilotinib compared to diagnosis. ABCC5 is a member of ATP-binding cassette (ABC) transporters that is involved in multi-drug resistance. Recent studies demonstrated that drug transporters (e.g. ABCB1) were involved in TKI export and their over expression was linked to TKI resistance [39]. Interestingly, a study demonstrated that ABC transporters pump out endogenous toxicants and xenobiotics such as antineoplastic drugs from the cells.
Therefore, it was necessary to develop modulators of ABC transporters that could antagonize MDR by the inhibition of the efflux activity of ABC transporters in order to increase the possibility of successful chemotherapy. Modulation of ABC transporters by different types of TKI such as nilotinib, leads to enhanced intracellular accumulation of anticancer drugs which overcome anticancer drug resistance [40].
B cell differentiation
CD40LG was up regulated whereas BLNK was down regulated at diagnosis compared to 12 months of nilotinib treatment, respectively. CD40LG encodes a protein that is expressed on the surface of T cells and regulates B cell function by engaging CD40 on the B cell surface. CD40LG was up regulated in chronic phase CML HSC [35].
BLNK encodes a cytoplasmic linker or adaptor protein that plays a critical role in B cell development. BLNK functions as a central linker protein, downstream of the B-cell receptor (BCR), bridging the SYK kinase to a multitude of signaling pathways and regulating biological outcomes of B-cell function and development. This gene may play an important role in BCR-induced B-cell apoptosis.
Moreover, our results showed that JAK3 was over expressed after 12 months of nilotinib treatment. JAK3 is a protein tyrosine kinase that plays a role in regulating cell survival by phosphorylation/activation of signal transducers and activators of transcription (Stats). These findings identified JAK3 as a potential therapeutic target in CML, particularly in blast phase where patients are more likely to be resistant to imatinib but future studies are needed to assess its role in CML [41]. We need to investigate the gene expression changes of JAK3 highlighted by our GEP data between the time of diagnosis and after 12 months of nilotinib treatment in a larger cohort of CML patients.
Membrane receptors
Our GEP results showed that CD36, LEPR, IL1RL1, KCNK5 were under expressed whereas CD53 was over expressed after 12 months of nilotinib, respectively. CD36 and LEPR are receptors genes that were over expressed in CML CD34+ cells with respect to the same normal cell counterpart whereas CD36 was up regulated in CML HSCs [34, 36].
IL1RL1 has recently been proposed to be up regulated in candidate CML stem cells and it was expressed on the immature CML CD34+CD38
Growth factors and RAS signaling pathway
CSF2RB and CSF1 were down regulated whereas FLT3 was up regulated after 12 months of nilotinib, respectively. FLT3 encodes a tyrosine-protein kinase that acts as cell-surface receptor for the cytokine FLT3LG and regulates differentiation, proliferation and survival of hematopoietic progenitor cells and dendritic cells. In a previous study, FLT3 was down regulated in CML HSC compared to healthy HSC [35]. CSF1 belongs to the RAS signaling pathway playing an essential role in the regulation of survival, proliferation and differentiation of hematopoietic precursor cells. CSF1 as well as CSF2RB were up regulated in CML stem cells compared to normal stem cells [34, 36]. From our GEP results RAB31, RASA3, RRAS2, ANGPT2 were up regulated at diagnosis compared to 12 months of nilotinib. The Ras proteins are GTPases that function as molecular switches for signaling pathways regulating cell proliferation, survival, growth, migration, differentiation and cytoskeleton dynamism. Ras proteins transduce signals from extracellular growth factors by cycling between inactive GDP-bound and active GTP-bound states. The exchange of GTP for GDP on RAS is regulated by guanine nucleotide exchange factors (GEFs) and GTPase-activating proteins (GAPs). Activated RAS (RAS-GTP) regulates multiple cellular functions through effectors including Raf, phosphatidylinositol 3-kinase (PI3K) and Ral guanine nucleotide-dissociation stimulator (RALGDS).
RRAS2 encodes a member of the R-Ras subfamily of Ras-like small GTPases. The encoded protein is associates with the plasma membrane and may function as a signal transducer. This protein may play an important role in activating signal transduction pathways that control cell proliferation. RASA3 encodes a protein that stimulates the GTPase activity of Ras p21. This protein functions as a negative regulator of the Ras signaling pathway and it is localized to the cell membrane.
Angiopoietin-TEK is one of the major signaling systems that regulates development and remodeling of vascular system [43]. The protein encoded by ANGPT2 is an antagonist of angiopoietin 1 (ANGPT1) and endothelial TEK tyrosine kinase (TIE-2, TEK). ANGPT2 binds to TEK/TIE2, competing for the ANGPT1 binding site, and it modulates ANGPT1 signaling. ANGPT2 can induce tyrosine phosphorylation of TEK/TIE2 in the absence of ANGPT1. In concert with VEGF, it may facilitate endothelial cell migration and proliferation, thus serving as a permissive angiogenic signal. TEK is a receptor tyrosine kinase modulated by its ligands, angiopoietins, and regulates the development and remodeling of vascular system. It is also one of the critical pathways associated with tumor angiogenesis. Our study demonstrated that TEK was up regulated at diagnosis compared to 12 months of nilotinib treatment as described above.
Proliferation and apoptosis
Our results showed that CCNG1, GAS2, SPTA1, CDH that are associated with proliferation in CML, were down regulated after 12 months of nilotinib. Previous studies demonstrated that GAS2 was up regulated in CML CD34+ cells [44]. Targeting GAS2 leaded to growth inhibition and sensitized leukemic cells to the treatment of imatinib mesylate [45]. CCNG1 may play a role in growth regulation and it is associated with G2/M phase arrest in response to DNA damage. CCNG1 was up regulated in CML stem cells compared to normal stem cells [34]. CDH1 was previously studied and it might play a role in blast crisis of CML but its role needs further studies [46]. Eight different probe sets, mapping gene PSMB9 were consistently detected as differentially expressed between diagnosis and 12 months of nilotinib treatment. This gene was over expressed after 12 months of nilotinib. PSMB9 encodes a proteasome subunit that is implicated in the G1/S transition of mitotic cell cycle.
Discussion
As far as we know, this is the first study which investigated the effect of nilotinib treatment on selected BM CD34+/lin- cells from CML patients at diagnosis and after 3, 6 and 12 months of nilotinib treatment. We measured the number of BM MNCs as well as BM CD34+/lin- cells of 30 CML patients at the time of diagnosis. The cell counts demonstrated a wide variety for each patient at diagnosis (see Table 1). Patients showed different numbers of BM CD34+/lin- Ph+ cells at diagnosis, probably due to the clinical and biological heterogeneity of the disease. FISH detected CD34+/lin- Ph+ cells in the 30 CML patients at diagnosis whereas after 12 months of nilotinib treatment, no Ph+ nuclei were found.
From our results, we can speculate that nilotinib had a very rapid effect within the first 6 months of its administration, while between 6 and 12 months we observed a slight increase in the number of BM CD34+/lin- cells which might be caused by the gradual repopulation of the normal CD34+/lin- cells in the bone marrow as FISH results suggested.
We performed GEP experiments on the BM CD34+/ lin- cells of 30 patients at diagnosis vs. the same patients after 12 months of nilotinib to investigate gene expression differences and changes in biological pathways due to the nilotinib treatment. This is the first study of GEP on CML BM CD34+/lin- cells using the Affymetrix GeneChip Human Transcriptome Array 2.0. The HTA 2.0 array represents one of the most comprehensive gene models available, which analyzes 44.699 genes since it covers more than 285,000 full-length transcripts including coding, non-coding and exon-exon junctions.
GEP data identified 264 statistically significant differentially expressed genes between diagnosis and 12 months of nilotinib treatment. Functional enrichment analysis showed that 65 genes were assigned to putative significant pathways in CML (see Table 2).
The deregulation of some genes and pathways highlighted by our results was previously described in studies regarding CML and nilotinib side effects in CML patients as previously described.
GEP results showed the deregulation of genes involved in lipid metabolism, glucose and insulin metabolic processes between CD34+/lin- cells at diagnosis and after 12 months of nilotinib. The expression changes of these genes after 12 months of nilotinib treatment were associated with a transcriptional phenotype resembling that of normal CD34+ cells with respect to CML CD34+ cells as described in several studies [30, 31, 32]. PRKAR2A, PRKAR2B, PTPN1, MARCKS, CAB39, RXFP1, SORT1, and TBC1D4 genes regulating insulin resistance were under expressed in CD34+/lin- cells after 12 months of nilotinib treatment.
Zdenek et al. demonstrated fast development of peripheral insulin resistance already during the first 3 months of nilotinib treatment in CML patients as underlying cause of glucose and secondary also lipid metabolism impairment during this treatment [37].
Some studies demonstrated that nilotinib-treated patients might develop rapid increased glucose levels as well as cholesterol levels consistent with the increased risk of developing vascular occluding events [32]. These findings indicate the need for a monitoring of glucose and lipid metabolism during nilotinib treatment.
Monitoring the levels of proteins involved in these metabolisms could reduce the cardiovascular burden associated with hyperglicemia, dyslipidemia that may increase the risk of atherosclerosis with peripheral artery occlusion occurring during nilotinib treatment.
Moreover, we demonstrated alterations of sphingolipid metabolism: SGMS2 and SGPP1 genes were up regulated in CML patients at diagnosis. Both enzymes are involved in the regulation of ceramide levels in the cells and the higher expression of both genes is correlated to decreased levels of ceramide and therefore an increased cell survival [33]. Additional studies showed that ceramide in sphingolipid metabolism is an acquired mechanism that contributes to cellular drug resistance [47].
Altered complement and coagulation cascade were identified from our GEP results. CR1, HBB, HBBP1, HBD, HBG2, SERPINE2 genes were over expressed in CML CD34+ cells at diagnosis. Some previous studies showed the up regulation of the same genes in CML CD34+ cells compared to healthy CD34+ cells [34].
TLN1, FCGR2A, ITGA2B are involved in platelet activation. Our GEP results demonstrated the deregulation of TLN1, FCGR2A, and ITGA2B after 12 months of nilotinib treatment. Recent studies focused on the toxicity of TKI in CML and demonstrated that nilotinib could potentiate platelet and endothelial activation and platelet thrombus formation ex vivo and in vivo [48].
We demonstrated expression changes between CD34+/lin- cells at diagnosis vs. 12 months of nilotinib in several genes belonging to B cell differentiation and membrane receptors. Previous studies showed that some genes regulating these pathways: CD40LG, BLNK, CD36, CD53, LEPR, IL1RL1, and KCNK5 were de regulated in CD34+ cells with respect to the same normal cell counterpart, as previously reported.
Interestingly, our results showed that growth factors and RAS signaling pathway genes CSF1, CSF2RB, RAB31, RASA3, RRAS2, ANGPT2, and TEK were up regulated at diagnosis compared to 12 months of nilotinib. The proteins encoded by these genes play key role in signal transduction pathways that activate cell proliferation [43].
CCNG1, GAS2, SPTA1, and CDH1 that are involved proliferation in CML, were under expressed after 12 months of nilotinib. The expression signature of these genes reflects the results from previous studies in CML [34, 44, 46].
Additionally, our results showed the over expression of genes involved in the mechanisms of transport across extra- and intra-cellular membranes (SLC25A33, SLC25A37, SLC25A38, SLC27A2, SLC43A3, SLC4A4, ABCC5) in CD34+/lin- cells at diagnosis, providing a rationale for investigating this phenomenon in patients undergoing nilotinib treatment. In particular, ABCC5 gene encodes the multidrug resistance-associated protein 5, a plasma membrane transporter that could be involved in the MDR in CML, as previously described.
In conclusion, we showed that CD34+/lin- cells after 12 months of nilotinib treatment showed altered expression of genes involved in metabolic processes: lipid profiles, glycaemia, insulin resistance, coagulation cascade, and platelet activation. From our results we can hypotize that nilotinib might interfere with metabolic mechanisms that are relevant in CML patients as previously determined by several studies in literature. These pathways need further functional investigations to evaluate a possible impact on CML patients treated with nilotinib.
Moreover, we observed the up regulation of several pathways involved in cell proliferation such as growth factors, RAS signaling pathway, drug transporters, cell adhesion and cytoskeleton, B cell differentiation, and the down regulation of sphingolipid metabolism and apoptosis in CML CD34+/lin- cells at diagnosis, respectively.
The alterations of the selected pathways may underlie the increased cell proliferation that is characteristic of CML and may play a significant role in recognizing resistance mechanisms of LSCs, such as stem cell-niche interactions, cell cycle, survival, self-renewal, and metabolism.
Further GEP studies on a larger cohort of CML patients at diagnosis vs. 12 months of nilotinib are ongoing. We believe that BM CD34+/lin- cells from CML patients at diagnosis and after nilotinib treatment harbor differences in certain biologic and genetic properties, that may predict how well they will respond to nilotinib treatment and we will test this hypothesis. Gene expression measurement will enter future diagnostic routine, as has been shown for breast cancer, where gene expression assays provide clinically useful prognostic information [36].
Therefore, the complete elucidation of the molecular pathways involved in the survival and functions of CML stem and progenitor cells needs to be identified in order to determine the therapeutic targets leading to the eradication and/or sensitization to TKI treatment.
Footnotes
Acknowledgments
This study was partially funded by Novartis which also supplied nilotinib to the project. We would like to thank ASST Grande Ospedale Metropolitano Niguarda, which promoted the study with the support from REL. The authors would like to thank Dr John Welch for his English proof reading.
Supplementary data
The supplementary files are available to download from http://dx.doi.org/10.3233/CBM-170209.