
Abstract
OBJECTIVE:
Osteosarcoma (OS) is the most frequent type of bone malignancy, and this disease has a poor prognosis. We aimed to identify the significant genes related with OS by integrating module-identification method and attract approach.
METHODS:
OS-related microarray data E-GEOD-36001 were obtained from ArrayExpress database, and then protein-protein interaction (PPI) networks of normal and OS were re-weighted by means of spearman correlation coefficient (SCC). Next, maximal cliques were detected from the re-weighted PPI networks using clusteringbased on maximal cliques approach. Afterwards, highly overlapped cliques were merged according to the interconnectivity, following by candidate modules and seed modules identification. Attract proposed by Mar et al. who have suggested that this approach can extract and annotate the gene-sets which can distinguish between disease and control samples, and obtained differences of these gene-sets among the expression profile of samples were defined as attractors. Thus, we applied attract method to extract differential modules from the seed modules, and these obtained differential modules were defined as attractors. The genes in attractors were determined as attractor genes.
RESULTS:
After eliminating the maximal cliques with nodes less than 4, there were 1,884 and 528 maximal cliques in normal and OS PPI networks, which were used to conduct module analysis. A total of 60 and 19 candidate modules were obtained in control and OS PPI networks, respectively. By comparing with normal group, 2 seed module pairs with similar gene composition were found. Significantly, based on attract method, we found that these 2 modules were differential. These 2 modules had the same gene size with 4 genes. Of note, genes CCNB1 and KIF11 simultaneously appeared in these two attractors.
CONCLUSIONS:
We successfully identified two attractors via integrating module-identification method and attract approach, and attractor genes, for example, CCNB1 and KIF11 might play pathophysiological roles in OS development and progression.
Keywords
Abbreviations
Introduction
Osteosarcoma (OS), characterized by neoplastic cells that directly generate immature osteoid [1], is a major common primary malignant bone tumor in children and young adolescents. Five-year survival rate is about 60–65% for OS patients without metastasis [2]. Unfortunately, the survival rates have reached a plateau, and further improvements are possibly dependent on novel biology-based therapies. Moreover, mechanisms of OS rapid growth and chemo-resistance are still poorly elucidated. Thus, it is very urgent to reveal the mechanisms of OS growth and progression.
Recently, gene expression biomarkers based on microarray technology have proven available for predicting the risk of OS. Nevertheless, the significant gene changes identified in one study are seldom replicated in another study [3, 4]. More significantly, many of these signatures are not related to OS functionally. With the goal of identifying robust, functionally relevant disease biomarkers, it is crucially important to discover gene biomarkers that are consistent in various data sources. A complex disease, for example, OS, leads to many differentially expressed genes (DEGs), which together can be used to construct a “disease module” network which functions as highly synergetic or coordinated groups [5]. Several of these DEGs directly contributing to the disease phenotype, are called “driver” genes. The expression changes enacted on the driver genes lead to a cascade of changes of other genes: initially to their first-degree interaction neighbors which accumulate in cells yet do not correspond to cancer development are termed as passengers [6, 7]. Of note, it is a challenge to isolate the modules from the passenger genes for a given disease [8]. Thus, identification of core modules is a crucial step in understanding the molecular mechanisms underlying OS, which can further aid in effective diagnosis, treatment and prognosis of OS patients.
Gene module analysis attempts to study combined effects by identifying groups of genes that are coordinately expressed [9, 10]. Excitedly, attract proposed by Mar et al. [11] who have suggested that this approach can extract and annotate the gene-sets which can distinguish disease from control samples, and obtained differences of these gene-sets among the expression profile of samples were defined as attractors. Moreover, another study has also used attract method to detect “core pathway modules” [12]. Famously, attractor can identify well-defined ensembles of networks whose statistical features matched those of real cells and organisms [4]. In the present study, we used module-identification method and attract method to screen attractors within PPI networks to determine the pathogenesis of OS progression. In brief, the gene expression profile E-GEOD-36001 was recruited from the EMBL-EBI database, following by re-weighting the PPI networks of normal and OS groups on the basis of spearman correlation coefficient (SCC). Then, seed module identification was implemented by computing module correlation density (MCD) between any pair of candidate modules which were derived from the re-weighted PPI networks using clique-merging algorithm. Subsequently, attract method was employed to detect differential modules (named as attractor) from the seed modules between OS group and normal group, and the genes in differential modules were defined as attractor genes.
Materials and methods
Gene expression profile, quality control and PPIs data
OS-related gene expression data with accessing number E-GEOD-36001 were recruited from ArrayExpress database. E-GEOD-36001, which presented on the platform of Illumina Human-6 v2 Expression BeadChip, was comprised of 19 OS samples and 6 normal samples. Before analysis, we firstly pretreated the gene profile datasets of E-GEOD-36001. In detail, background correction was implemented relying on RMA [13], followed by normalization through quartile algorithm [14]. Then, PM/MM correction was implemented via MAS [15]. Eventually, we conducted the expression summary by means of medianpolish. Afterwards, we converted the data on probe levels into gene symbols through annotate package [16]. Finally, 19,032 genes were obtained for further exploitation.
All human predicted PPI information was collected from the database of STRING 9 [17]. Proteins without expression value were removed and the repeated IDs for a given gene were reduced to a single one. In order to minimize false positive rate, only protein interactions with combine-score
Identification of modules
Based on the above information, we used clique- merging method to detect potential modules. The identification procedure contained three steps: establishing the conditional-specific PPI networks for normal and OS groups; detecting candidate modules from the OS and normal-specific PPI networks relying on clique-merging algorithm; as well as identifying seed modules from candidate modules based on MCD and module pair match.
Inferring normal and OS PPI networks
The weight values denoted the reliabilities of interactions, and interactions with low weight are likely false-positives [18]. Herein, in our analysis, we used SCC to examine the strength of two interacting proteins. As reported SCC is frequently used to measure the strength of association of two co-expressed variables and the range is from
Detecting modules and refining modules
In the present analysis, the conditional-specific modules were detected using modules-identification algorithm in Genelibs (
Firstly, we discovered all the maximal cliques from the re-weighted PPI networks and the cliques were sorted on the basis of the weighted interaction density (WID). Secondly, many maximal cliques might overlap with each other, thus to decrease the result size, the highly overlapped maximal cliques were eliminated or merged. Weighted inter-connectivity (WIC) between 2 cliques was calculated to determine whether these 2 overlapped cliques were merged or not. The maximal cliques were listed in descending sequence based on the WIC values, named as clique [C
Distribution of weight values of interactions in normal and osteosarcoma (OS) groups
Distribution of weight values of interactions in normal and osteosarcoma (OS) groups
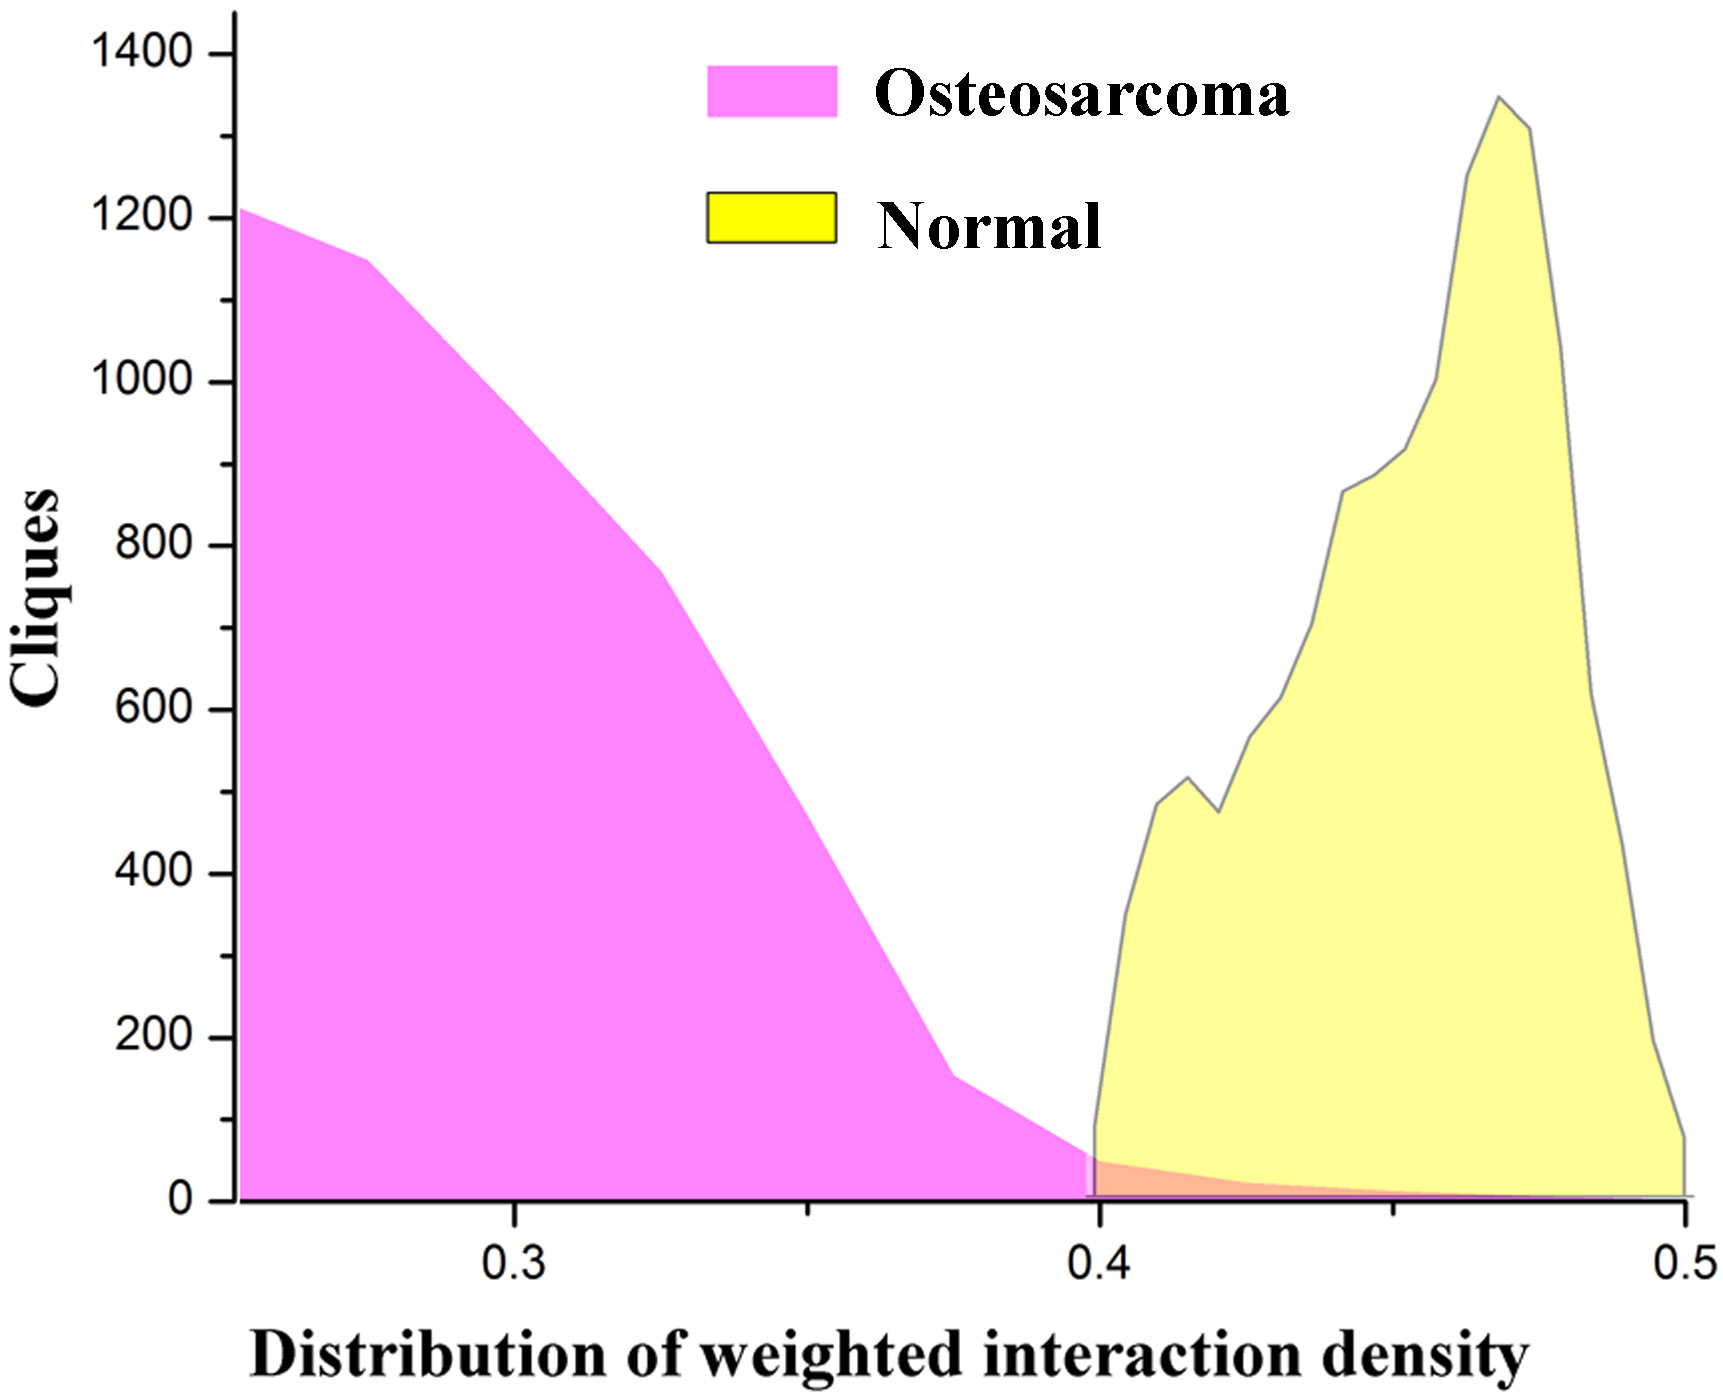
The distribution of weighted interaction density of the maximal cliques in osteosarcoma (OS) and normal groups.
Properties of normal and OS modules
Note: Max, maximum value; min, minimum value; avg, average value.
We supposed that H
Attractor analysis within modules
On the basis of attractor theory developed by Mar et al. [11], attract method was utilized to detect differentially expressed modules related to OS from the above-identified seed modules. To test the module data, GSEA-ANOVA was utilized as a gene set enrichment method, which was different from other methods in multiple classes [11]. Obtained differences among the expression profile of samples were defined as attractors [11]. Using ANOVA model, Fisher’s test was implemented for genes in modules to examine the expression level. After that, we employed T-test to examine the F-statistics values. Next, false discovery rate (FDR) correction was implemented on the P values using Benjamini-Hochberg method [22]. Modules were ranked according to the significance of difference. Remarkably, the modules with FDR

Venn diagram of candidate modules in OS and normal samples.
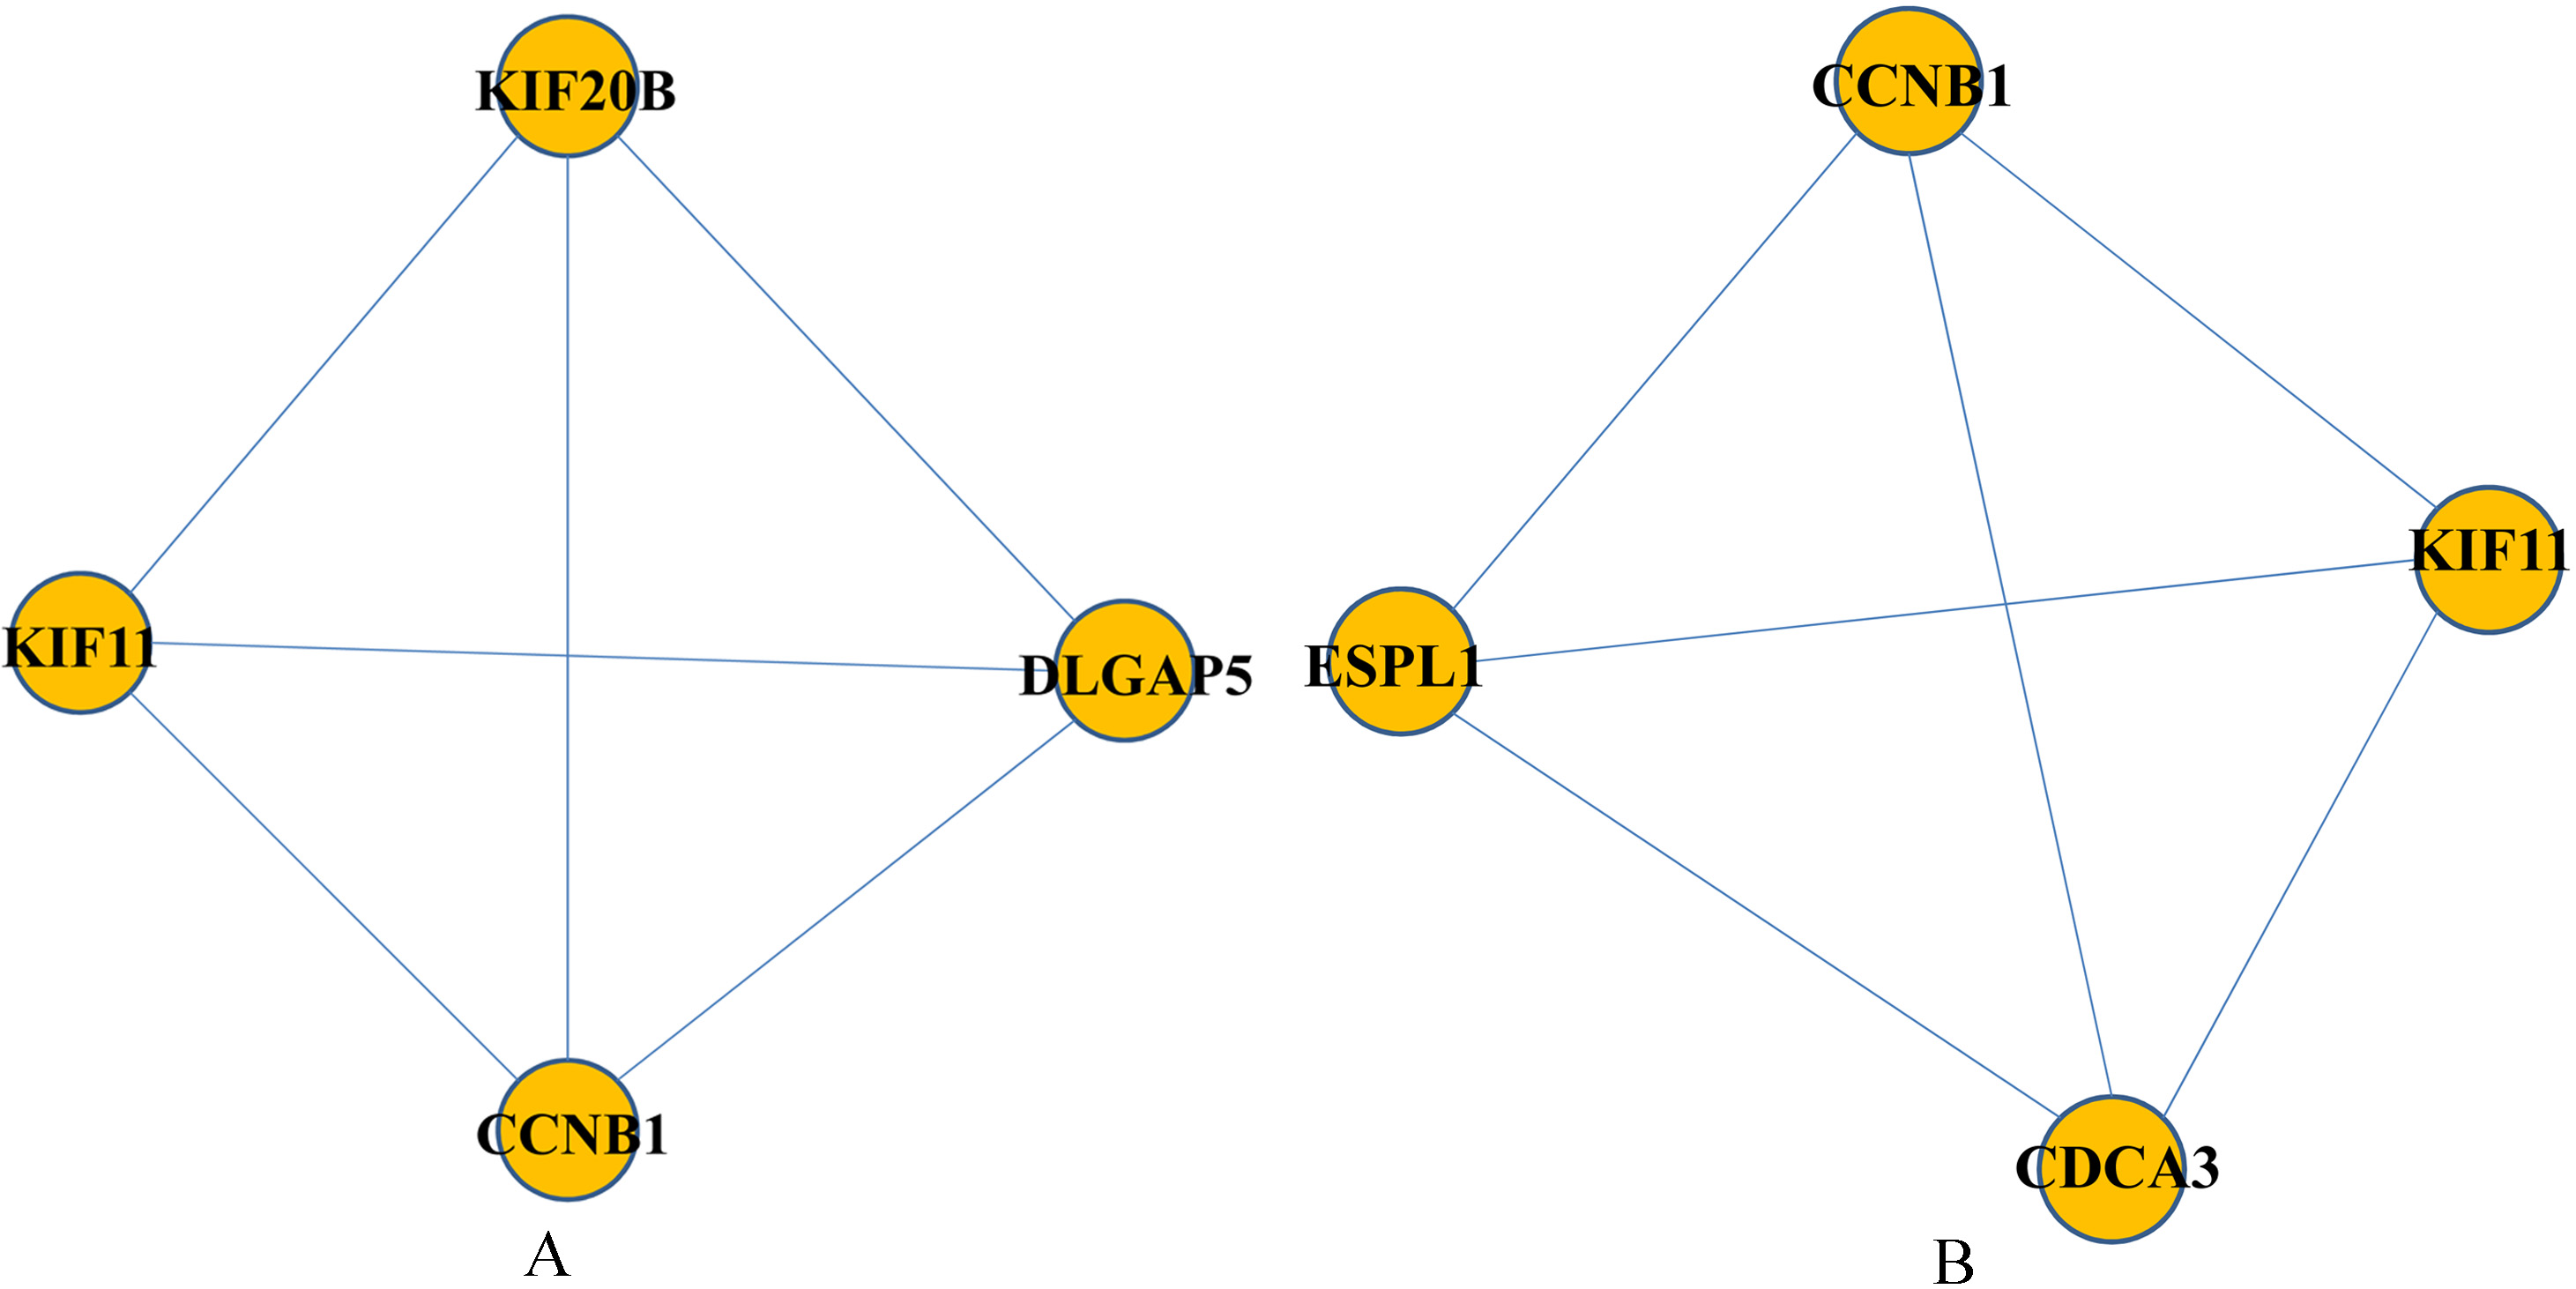
Two attractors involving in 4 nodes and 6 interactions. The circular nodes represented proteins and the grey lines stood for interactions. Nodes CCNB1 and KIF11 simultaneously appeared in these two attractors.
Disruptions analysis in PPI networks
After reweighting the original PPI networks using SCC method, we obtained the conditional-specific PPI networks of normal and OS groups. Significantly, we found there were different number of interactions in these two groups. For normal samples, there were 9648 interactions, and 5819 interactions were kept in OS reweighted PPI network. The mean weight values of normal and OS networks were 0.904 and 0.563, respectively. The distribution of weight values among interactions in normal and OS groups was listed in Table 1. From the distribution of weight values of interactions, we observed that the weight values among interactions in normal PPI network mainly ranged from 0.8 to 1, while the range of weight values of interactions in OS PPI network was from 0.4 to 1. Moreover, in the weight value distribution of 0.8–1, the count of interactions of normal PPI network was highly greater than that in OS group, but the number of interactions of normal PPI network was highly lower than those in OS samples in the weight distribution of 0.4–0.6.
Detection of modules
Using clique-merging method, a total of 6,921 and 4,808 maximal cliques in PPI networks of normal and OS groups. Figure 1 showed the difference in the WID distribution of the maximal cliques in the normal and OS groups. We found that the cliques in normal group mainly distributed the range of 0.4
Attractor analysis
Using the module pairs aforementioned, we applied attract method to extract differential modules, and these obtained differential modules were defined as attractors. Based on the cut-off criteria of FDR
Discussion
OS is the most frequent type of bone malignancy, and this disease has a poor prognosis. Unfortunately, about 15–25% of OS patients present with metastasis detected at diagnosis and approximately 45% patients develop distant metastasis, which is the main cause of death in OS [23]. Hence, it is urgent to detect molecular targets to prevent OS progression, and further to improve the prognosis of OS patients. In the present study, to explore the pathogenesis of OS, we investigated gene expression data E-GEOD-36001 to identify significant genes which might be involved in OS progression via integrating module-identification method with attract method. Significantly, a total of 2 attractors were detected. Moreover, CCNB1, and KIF11 simultaneously appeared in these two attractors.
As we all know, cancer is characterized by unscheduled cell proliferation induced by dys-regulation of the cell-cycle [24]. In our work, our results argued for an important function of cell cycle out of control in the pathogenesis of OS, and several candidate genes were identified, for example, CCNB1. CCNB1, one of the principal mitotic cyclins [25], is believed to be essential for G2-M transition of the cell cycle [26]. Significantly, regulating G2-M transition might be an available target to control the proliferation of cancer cells [27]. More importantly, CCNB1 expression is frequently over-expressed in human cancers and is related with tumor aggressiveness and poor clinical outcome [28, 29]. In addition, Wang et al. [30] have indicated that CCNB1 exerts important roles in the progression of OS via regulating cell cycle. Hence, as demonstrated here, we further highlights the potential use of CCNB1 as a biomarker in the treatment and diagnosis of OS through controlling the cell cycle progression.
KIF11 is a plus end directed kinesin needed for separation of duplicated centrosomes and for the spindle formation in metaphase [31, 32]. Centrosome amplification may result in the formation of aberrant mitotic spindles with multiple spindle poles that lead to abnormal cell divisions and aneuploidy. Cancer cells commonly exhibit genomic instability, and chromosomal instability [33]. As it is known that KIF11 inhibitors result in a collapse of bipolar spindle with a consequent formation of a monopolar spindle causing a block of the cell-cycle [34]. Moreover, KIF11 mRNA expression has been reported to be elevated in many tumor samples derived from breast, colon, lung, ovary, rectum, glioblastoma, and uterus [35, 36]. Thus, we infer that KIF11 might play important roles in the progression of OS, partially through regulation of genomic instability, and chromosomal instability.
In conclusion, the present study performed a comprehensive module analysis and successfully obtained two attractors. Our results provided evidence that candidate genes such as CCNB1 and KIF11 might play important roles in the pathogenesis of OS. We believe that our findings obtained above can provide theoretical guidelines for future works in clinic. Utilization of specific genes in OS will shed new insights for therapeutic and preventive methods. However, our study were obtained based on bioinformatic methods but lacked experimental verifications in vivo or in vitro, future studies will have to validate our obtained preliminary findings.