
Abstract
Typical commercial Raman micro-spectroscopic systems do not offer much flexibility to the end user, thus limiting potential research applications. We present a design of a simple, highly flexible and portable confocal Raman microscope with a detailed list of parts. The system can perform spectral acquisition in different modes: single-point spectroscopy, hyperspectral point mapping or hyperspectral line mapping. Moreover, the microscope can be easily converted between inverted and upright configurations, which can be beneficial for specific situations. Fiber coupling enables to connect various lasers for excitation and spectrometer/CCD combinations for signal detection. The performance of the instrument is demonstrated via Raman spectroscopy at 785 nm excitation wavelength, single point mapping of pancreatic cancer cells placed onto a quartz substrate and line mapping of polystyrene beads.
Keywords
Introduction
Raman spectroscopy, a popular subtype of vibrational spectroscopy, evolved in last decades into a powerful technique for analysis and chemical characterization of specimens. A Raman spectrum results from inelastic light scattering on vibrating molecular bonds (see basic theory in Section 2), therefore the spectrum is specific for each particular substance and contains information about molecular composition of the specimen.
Ability to combine non-destructive chemical characterization with diffraction-limited lateral resolution makes Raman micro-spectroscopy a versatile research tool [45,50]. It is particularly well suited for biological research, because it allows to detect variations in the biomolecular composition and correlate them with the corresponding biological changes due to metabolism or pathology. Absence of lengthy sample preparation, such as staining or labeling, makes Raman spectroscopy a promising tool for rapid clinical diagnosis [7,23,26,29,44,52]. Not only biological tissues [27] and body fluids [18] can be examined by Raman spectroscopy, but even individual living cells [17,32,42]. This is a large research field with a host of promising applications, such as observation of cell metabolism, growth and aging, study of drug resistance or drug uptake [35], chemical mapping of cells [22,36], identification of cell in a mixed population, and many others. This could guide us to the understanding of changes within an individual cell that could lead to a disease development, because many diseases begin at the cellular level.
A range of commercial Raman microscopic systems exists. Usually, these are robust systems with built-in calibration routines and user-friendly software. However, they are often dedicated for a specific purpose and therefore have limited potential for modifications. Nonetheless, it is possible to assemble a confocal Raman microscope from off-the-shelf components. It can be further extended with special Raman detection schemes (e.g. line scanning-mode [21], modulation of the excitation wavelength [15], or dual-polarization [11]) and supplemented with additional detection techniques like fluorescence [25,31], phase contrast [25], dark-field [31] microscopy, and others [53]. Moreover, custom systems can be combined with advanced sample handling techniques, like microfluidics [2,3,14] or optical tweezers [1,24,25,57].
This contribution presents a detailed design of a Raman microscope including a scheme of optical layout and a list of components. We discuss important parameters of excitation laser, camera and spectrometer, as well as implementation of the Raman imaging. Mechanical stability and flexibility of the system, as well as spatial resolution of the microscope are considered as well. A set of hyperspectral confocal Raman images of two cancer cell lines has been acquired to show the performance of the instrument. Finally, we demonstrate fast Raman mapping of polystyrene beads in a line-scanning imaging mode.
Basic theory
Raman effect is the inelastic scattering of photons on vibrational modes of molecular bonds [33,48]. An incident photon with energy
The difference in energy between incoming and scattered photons
There are multiple variations of Raman effect, such as resonance Raman scattering, stimulated Raman scattering or coherent anti-Stokes Raman scattering [33,46], but this contribution deals only with spontaneous Stokes scattering.
Design of the Raman micro-spectroscopic system
A Raman detection system is supposed to collect Stokes-shifted scattered photons and guide them to the entrance slit of a spectrometer. As the inelastically scattered photons are emitted isotropically from the sample, an optical system is required that would collect them and refocus on the spectrometer input slit. An infinity-corrected microscope objective lens with high numerical aperture is particularly suitable for this purpose for several reasons. First, it provides high energy density for excitation in the focal spot, as well as gives a possibility to selectively probe small spots of a heterogeneous sample located at different positions. Second, it collects a large portion of the inelastically scattered photons emitted from the observation point due to its high acceptance angle. Finally, collected light leaves the objective lens as a collimated beam that can be easily focused on the spectrometer entrance slit with a tube lens.
In last decades the industry of optical filters underwent major leap forward, which revolutionized the way Raman systems are built and drastically improved their performance. Compact narrow-band optical filters superseded bulky monochromators used in past systems; dichroic filters, which offer higher transmission, replaced beam splitters/combiners. A notch dichroic beam splitter (NDBS) is a perfect option to couple the excitation laser beam into the optical microscope (see Fig. 1). Placed between the tube and objective lenses, it reflects the excitation light and directs it towards the objective lens. Additionally, it transmits the inelastically scattered light towards the spectrometer while suppressing the Rayleigh-scattered light.
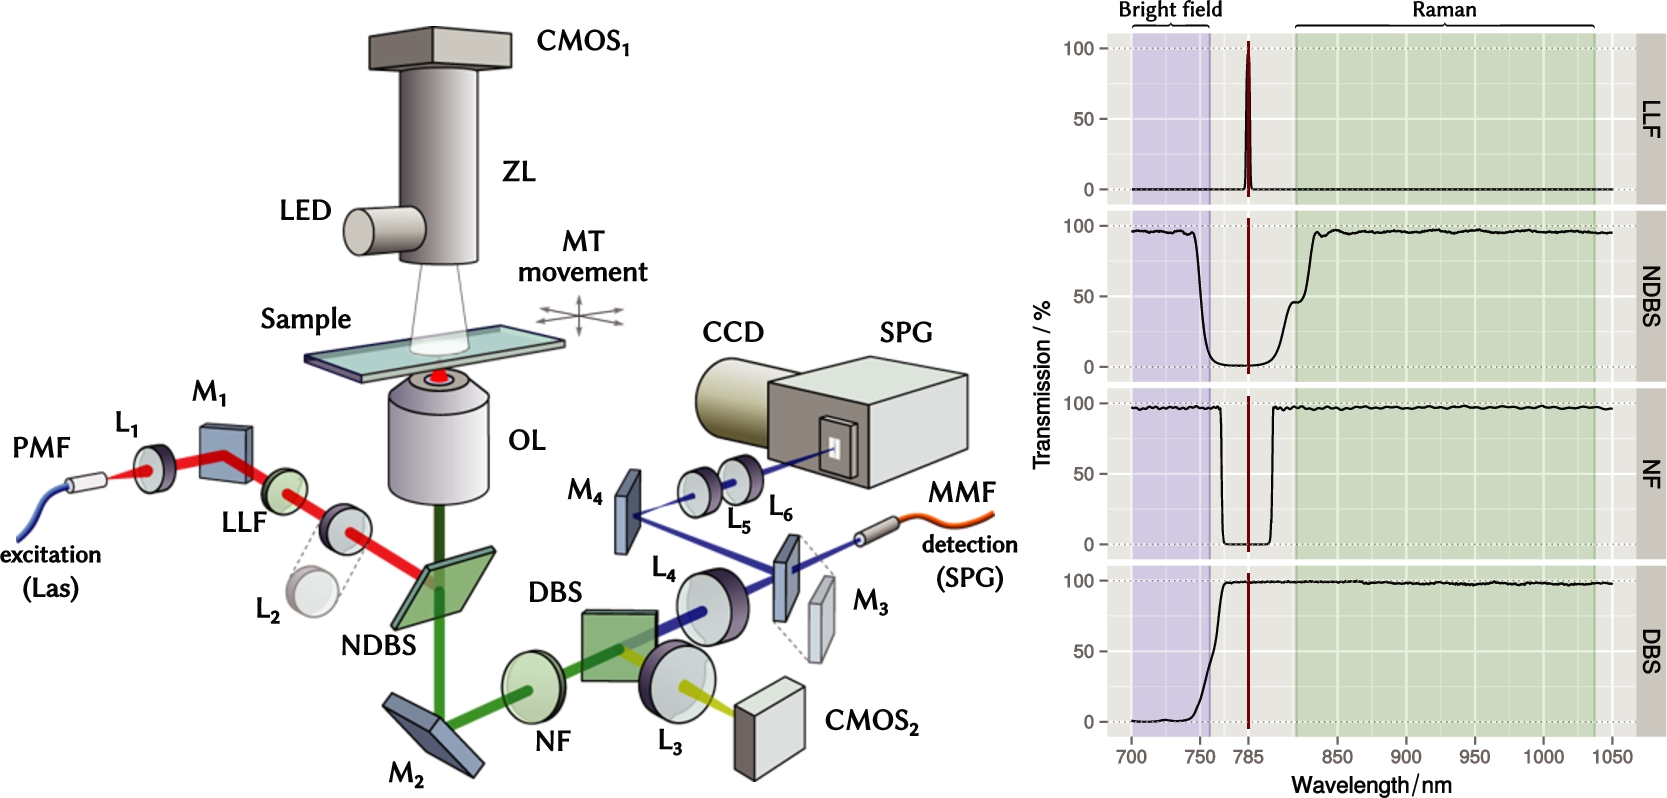
Left – optical layout of the experimental setup. Two Raman detection paths are shown: free-space line-scanning via optical elements
Abbreviations of the equipment depicted in Fig. 1
Many optical microscopes can be upgraded to Raman microscopes by adding several additional components [10]. It is important to note that it is preferable to use an infinity-corrected optical system that features a parallel optical path between the objective lens and the tube lens. All additional components, such as filters, polarizers, prisms, etc., can be placed into this parallel path without introducing additional spherical aberrations [30]. Modern research-grade biomedical and industrial microscopes typically fall into the category of infinity-corrected optical systems.
The spatial resolution of a microscope is determined primarily by the objective lens that focuses light into a diffraction-limited spot. The spatial resolution, especially along the optical axis, can be further enhanced by using a confocal detection approach, i.e. the collected light is focused and transmitted through a pinhole located in front of the detector. The pinhole is optically conjugated with the interrogation volume, from which the Raman spectrum is acquired, such as it accepts only the light originating from the location of the laser spot and rejects the rest [49,55]. It is convenient to guide the signal to the spectrometer using a multimode optical fiber. As the fiber core acts the same way as a pinhole placed in the back focal plane of the microscope, a smaller fiber diameter improves the confocality.
Confocal Raman system allows to “look inside” a semi-transparent sample and probe its chemical composition at a particular depth. The biggest advantage of the confocal detection scheme is the suppression of the unwanted signal originating from the background (i.e. specimen locations adjacent to the interrogation volume). However, since the pinhole rejects the out-of-plane light, less signal is collected by the detector. Therefore, it is necessary to find a reasonable trade-off between the resolution and the sensitivity of the instrument. The confocality of the system is a function of several factors, such as objective lens, tube lens, and the diameter of the detection fiber core. A rigorous assessment of the confocal Raman microscopy can be found elsewhere [19,30,49].
Implementation of hyperspectral imaging
An important design question is the implementation of scanning, which is required for acquisition of hyperspectral Raman images. One of the options considered by us was laser scanning (LS), i.e. steering of the laser beam by a pair of mirror galvanometers [20,34].
Albeit LS system features fast operation, and successful implementations of Raman LS microscope have been reported [47,54], such a system has several inherent drawbacks. The key problem is vignetting, i.e. the deterioration of the Raman collection efficiency when the excitation spot goes off-axis. Other issues are limited field of view, as well as reduced light transmission and complicated alignment due to a high number of optical components.
Other option, which is free from the aforementioned issues, is the movement of the specimen across the fixed laser focus. In our system we use three programmable motorized linear stages, attached orthogonally to each other (see Table 1 for details). They feature 25 mm travel range with resolution down to 100 nm, thus enabling precise and reproducible sample positioning under the microscope objective.
Considerations for the excitation laser
The excitation laser is an essential component of any Raman spectroscopy system. The main relevant laser parameters are power, wavelength, line width and stability.
The Raman spectrum represents the energy difference between excitation photons and modes of molecular vibrations, as such any uncertainty or deviation of the laser wavelength directly affects the wavenumber position and, consequently, the spectral resolution. Therefore, it is important to ensure that the laser has a narrow emission line, and its wavelength is well-defined. Otherwise, the wavelength uncertainty would lead to an additional broadening of the detected spectrum.
Another important factor is the wavelength stability over time. Jumping laser wavelength would render the wavenumber calibration of an instrument invalid and make evaluation of the spectral data cumbersome.
Typically a so-called single frequency laser is used as an excitation source, which has a single longitudinal mode and thus features a very small line width, low phase noise and low intensity variations. Such lasers are very sensitive to optical feedback, so they should be carefully protected from any back-reflections, using for example a Faraday optical isolator and fiber optic connectors with pre-angled ferrules (FC/APC type).
The choice of laser power and wavelength, however, is not straightforward and is dictated by several factors [48]. The intensity of the Raman scattering is linearly proportional to the laser power, but it depends on the fourth power of the excitation light frequency, hence shorter wavelength provides higher Raman signal. However, with a short excitation wavelength a lot of undesired effects can occur. Photons of ultraviolet and visible light are capable of causing electronic excitation within molecules, which may lead to changes in chemical bonds, and consequently, to photo-degradation of a biological specimen. For example, even 5 mW power of green 514 nm laser beam suffice to cause a noticeable damage to a lymphocyte cell within several minutes; the process is accompanied by change of the Raman spectrum [40]. In contrast, it has been shown that bacterial cells can survive a prolonged exposure to 100 mW NIR excitation (790–1064 nm), which is long enough for the acquisition of a Raman spectrum [39]. An additional issue associated with the excitation laser emitting in the visible range is the autofluorescence of most biological samples. It is typically excited by wavelengths below 520 nm, and the emitted light has wavelength in the 450–600 nm range [4].
Too long excitation wavelength would be problematic as well. In addition to the decrease of scattering intensity with the forth power of the excitation frequency according to the Rayleigh law, one has to consider a rapid drop in the quantum efficiency of typical CCD detectors at wavelengths above 900–1000 nm. The sensor should have enough sensitivity to detect Stokes photons corresponding to the spectral features of interest. Since we are dealing with biological materials that typically exhibit complex spectral features used for identification in the so-called “fingerprint region” (approx. 700–1650 cm−1), it is important to ensure high detector sensitivity in the corresponding spectral range. With 785 nm excitation used in our case, the fingerprint region stretches up to 900 nm.
Another common region of interest is 2800–3000 cm−1. Energies of vibrational modes of
Taking all aforementioned factors into account, we can conclude that the optimal excitation wavelength for Raman spectroscopy of biological materials would typically lie in red or NIR region.
Optical layout
The detailed optical layout of the Raman system is shown in Fig. 1 (see Table 1 for specifications of parts and abbreviations used throughout). The single mode excitation laser
The laser line filter
The notch dichroic beam splitter
Detection of the Stokes signal
The scattered light, as well as the white illumination from a
For confocal Raman micro-spectroscopy, the
In an alternative configuration, the Raman signal is coupled to the spectrograph via free-space optical elements. In this case the signal collection is not confocal, so more light is collected, which enables faster spectrum acquisition at cost of decreased spatial resolution. The free-space coupling configuration allows to acquire Raman spectrum by fast laser line scanning. To do this, a non-axisymmetrical optical element
Hyperspectral laser-line imaging makes high demands on the imaging capabilities of the spectrograph (
The
How to design the mechanical part
We used a computer-aided design (CAD) software (Autodesk Inventor) to create a computer model of the Raman system. We chose this approach for a number of reasons:
Many suppliers of optomechanical components provide three-dimensional computer models of their products in the STEP format. These models can be downloaded and virtually assembled in the CAD software.
The generated model clearly shows how the end system should look like. It is also possible to check position of every optical element and to measure any distance between arbitrary elements.
Fast generation of documentation, including drawings, illustrations and bill of materials.
We used the so-called cage system to mount optical components, and we consider it to be the optimal choice for this task. Optical elements are firmly attached to aluminum plates that are connected together by rigid steel rods, which define a common optical axis, thus simplifying the alignment. The cage system enables modular design of the laboratory setup: different modules (e.g. detection module, laser coupling module, etc.) can be assembled and aligned independently of each other, and afterwards combined together. This also allows to quickly change the functionality of the instrument. Since the modules are small, rigid and stable, the setup can be flipped over in order to switch between upright and inverted configurations.
Usually upright and inverted microscopes are dedicated for different purposes and applications. Upright microscope, where the objective lens is located above the specimen, is well-suited for Raman spectroscopy of detached cells. The cells sink down to the substrate surface (e.g. CaF2 or quartz), then it is possible to locate and observe them with a physiological water immersion objective lens.
Inverted microscope configuration allows to examine live specimens in a deep covered container, such as a flask [9]. It is also advantageous for micro-manipulation applications, such as Raman-based flow cytometry [13,14,16,37], because it provides a lot of space to install additional tools. In our case, it enables good direction of the tubings towards a microfluidic chip, thus preventing sedimentation of the cells on tube walls. Additionally, we installed a 12× zoom lens
The mechanical stability is a particularly important parameter of any microscopy system. Since the excitation laser focus and the pinhole in front of the detector are conjugate points, even a small mechanical movement of the optical elements in the laser beam path can lead to the significant deterioration of the Raman system performance. An additional issue is the vibrational resistance: already a minor shock to the motorized table can lead to an unpredictable movement of the specimen under the objective. For this reason, the microscope modules, which are already built using the rigid case system, are attached to a 40 mm thick steel optical breadboard. The breadboard itself is suspended on top of four cushioning isolators filled with compressed air. The air pressure in the isolators is monitored and controlled by an active self-leveling electronics (PWA090, Thorlabs). This configuration mechanically decouples the measurement system from the environment and effectively cushions any external impacts.
We demonstrated performance of the custom-built Raman system by collecting Raman maps of individual fixed cells of two different cell lines: MIA PaCa-2, pancreatic cancer, and Jurkat, T lymphocytes. In total we acquired Raman maps of 10 individual cells of each cell line; each Raman map has size of
The cells were placed onto a 170 µm-thick quartz cover slip, and Raman signal has been collected in the inverted configuration. We used the 100× NA 1.4 oil-immersion objective lens both for Raman excitation and for Raman signal collection in 180° back reflection geometry. All scans were carried out with 100 mW power of the excitation laser (measured in the sample plane), exposure time of 1.0 second,
In total, 8000 Raman spectra have been collected in two batches. The spectra underwent preprocessing, which is a crucial step prior the data interpretation [8]. We used
First of all, we calibrated the wavenumber axis in each of the batches using the standard calibration routine [51]. A spectrum of a Ne–Ar gas discharge lamp has been acquired, and observed peaks (about 45) have been mapped onto the atomic emission lines of Ne and Ar, provided by NIST [28]. The relationship between the
In order to reduce the fixed-pattern noise and to remove the constant ADC offset, we subtracted a dark frame from each spectrum. The dark frame has been collected by reading out the
Each individual Raman map has been separated into cell and background regions using k-means clustering. An average spectrum of the background cluster has been calculated and subtracted from the Raman map. The remainder baseline has been estimated as a convex hull of the bent spectrum. Finally, all spectra have been intensity-corrected using a standardized incandescent lamp as a reference light source with known emission spectrum.
After the preprocessing, only the cell signatures, random noise and some tiny baseline fluctuations were left in the cell cluster. Figure 2 compares raw dataset with the preprocessed one.
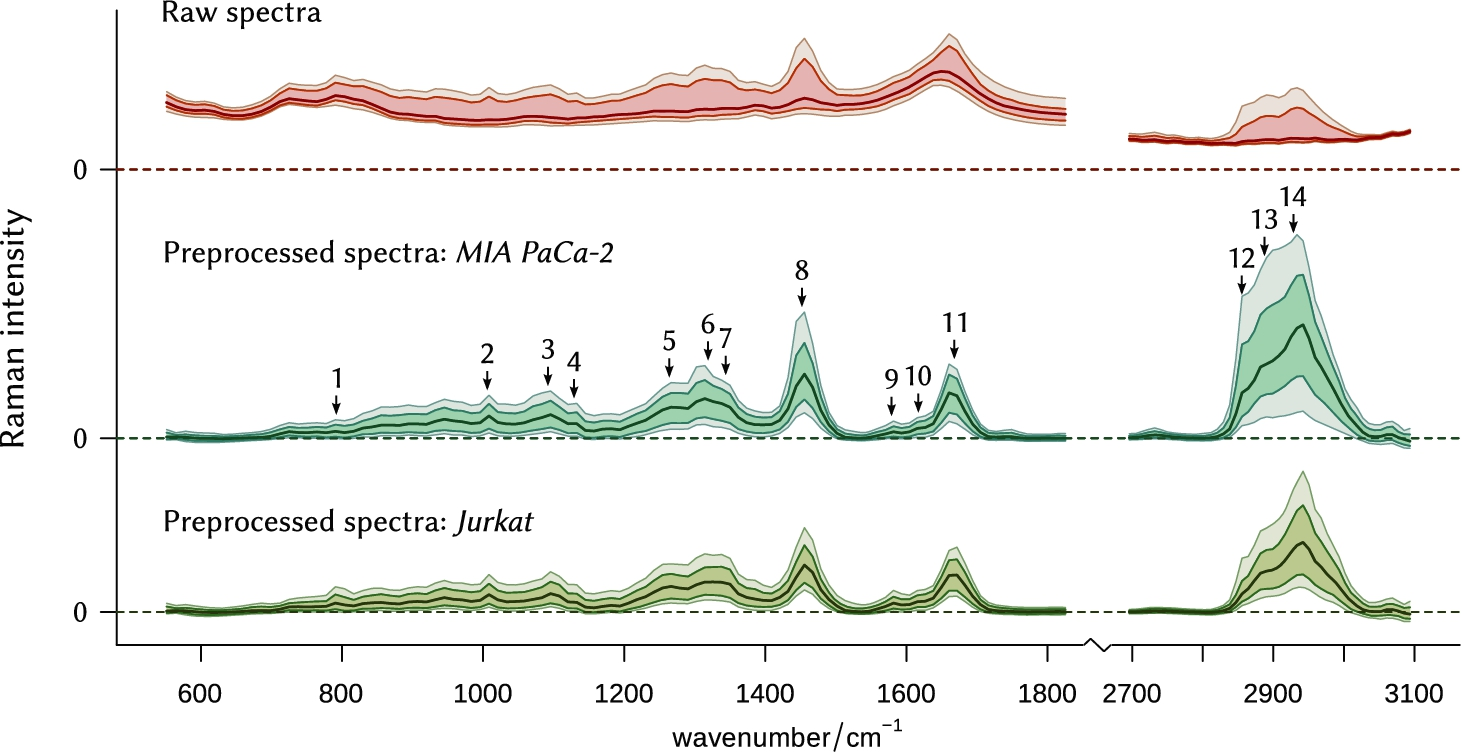
Statistical overview of the collected spectral data. Lines represent, from bottom to top, the 5th, 16th, 50th (median), 84th, and 95th percentiles of the spectral intensity, respectively. The original raw dataset (8000 spectra, top) underwent smoothing interpolation, background removal, baseline subtraction and correction for the instrument response function. Then it was split into two subsets, containing spectra of MIA PaCa-2 and Jurkat cell lines, respectively. Numbers
Abbreviations:
The N-FINDR algorithm [56] has been applied to the whole preprocessed dataset to extract three end-members, or the most different spectra. One of them is the blank background spectrum collected from points around the cell. Two other components, shown in Fig. 3(A), resemble spectra of lipid and DNA/protein mixture, respectively. We calculated concentration maps of these end-members for both cell lines (see Fig. 3(B)).
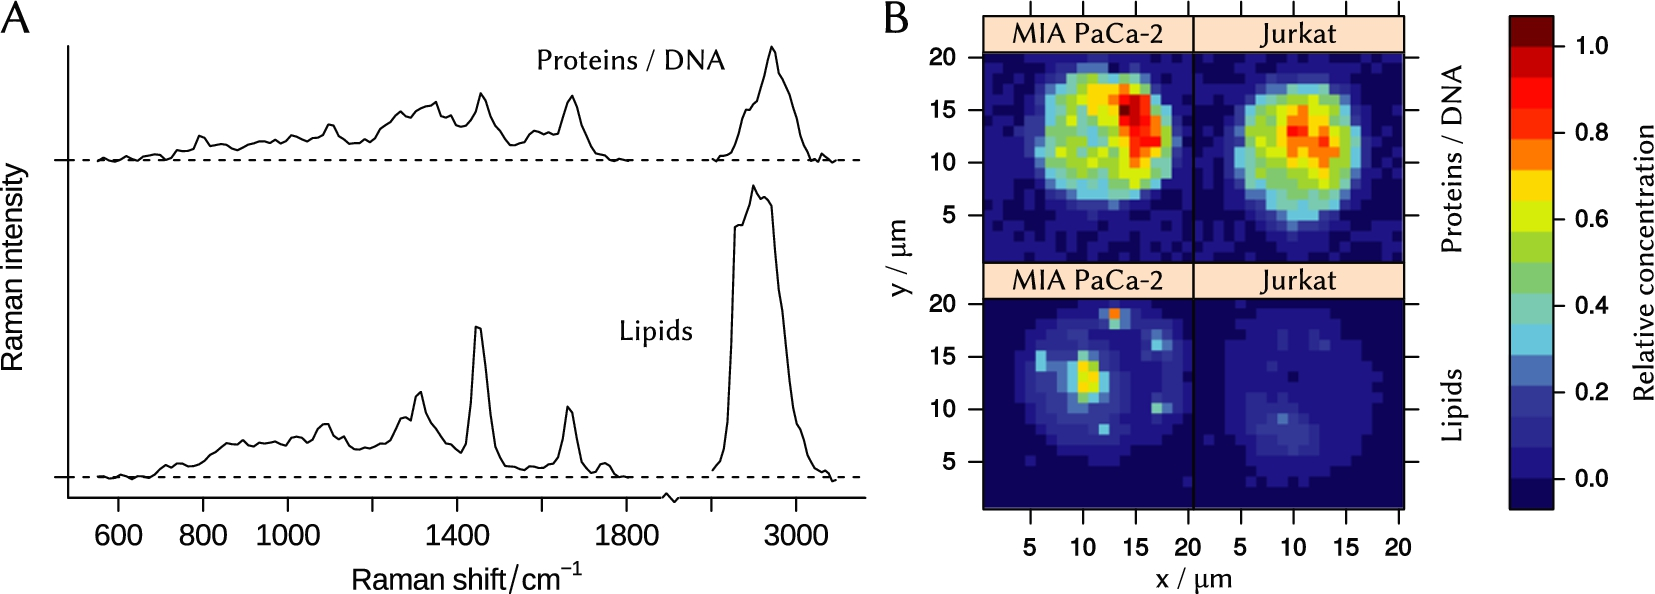
(A) – N-FINDR end-members that represent spectra of lipid and protein/DNA mixture. (B) – concentration maps of the end-members in cells of Jurkat and MIA PaCa-2 cell lines.
Results clearly show, that a typical MIA PaCa-2 cell contains more lipids compared to a typical Jurkat cell. The concentration of proteins differs as well. Obtained data can be used for purposes of cell identification [7,38] or planning of further biospectroscopic experiments [5].
The performance of the Raman system in the hyperspectral laser line imaging mode has been tested on 5 µm polystyrene beads located on a CaF2 slide (see Fig. 4).
We placed a cylindrical lens
Raman signal has been collected from the area illuminated by the line-shaped focused beam in such a way, that each point along the linear focus corresponded to a specific location on the entrance slit of the spectrograph
Use of the 60× objective lens with an
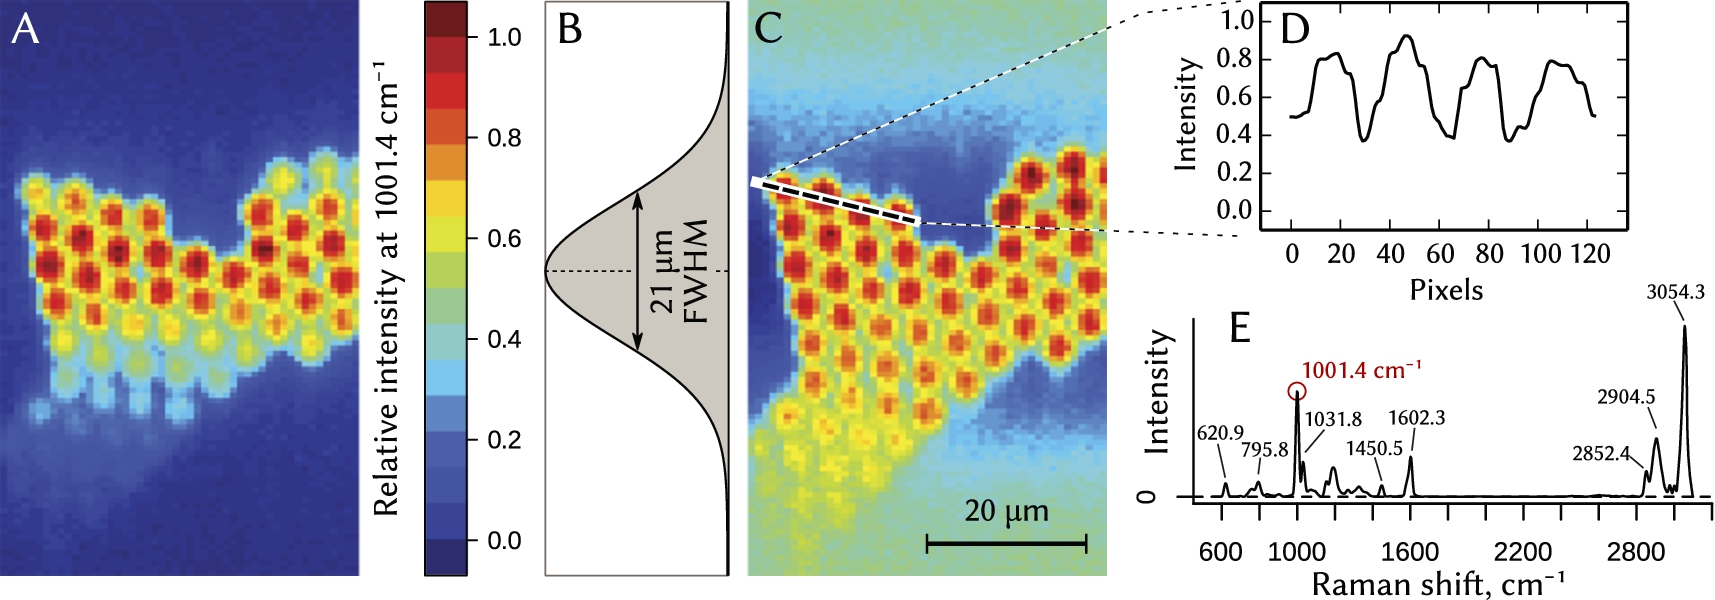
Hyperspectral Raman imaging of polystyrene beads with 5 µm diameter obtained in the line-scanning mode. False-color maps (A) and (C) show relative amplitude of the 1001.4 cm−1 peak in the Raman spectrum of the polystyrene (plot (E)). Raw data from
We demonstrated the construction of a very flexible Raman micro-spectroscopic system for specific needs, in our case for the Raman-assisted cell identification. The described system features several acquisition modalities, in particular bright-field imaging, acquisition of Raman spectra from a single point, Raman mapping and hyperspectral line imaging.
Since the major part of the system consists of separate general purpose optomechanical components, it can be rebuilt, modified or extended. For example, a combination with fluorescence imaging requires an additional light source, a set of optical filters and a suitable camera for detection. Moreover, the whole microscopy attachment can be flipped, so one can switch between upright and inverted configurations.
We demonstrated the performance of the instrument by acquisition of hyperspectral Raman images in two different modes: point-by-point mapping and laser line scanning.
Footnotes
Acknowledgements
This work was supported by the EU within the FP7 collaborative project CanDo (610472), as well as by the Federal Ministry of Education and Research (BMBF) within the project RamanCTC (13N12685). Sonja Aškrabić was supported by a short time scientific mission within the COST action Raman4clinics (BM1401).