
Abstract
There are several methods for strengthening reinforced concrete joints. Due to the unique properties of FRP (Fiber Reinforced Polymer) composites, the use of FRP laminates is one of the most commonly used techniques. The high cost of preparing concrete surfaces and attaching FRP laminates is a restricting factor for its application in reinforced concrete joint retrofit. Therefore, determining proper configurations that reduce the needed FRP material, as well as the surface preparation required for attaching FRP is an important factor in decreasing the strengthening cost. The proper arrangements of FRP strips can improve their performance in the rehabilitation and retrofit of reinforced concrete joints. To determine the proper configuration of FRP strips, finite element modeling was employed. The connection specimens are modeled in ABAQUS general-purpose finite element software and are classified into 10 general groups. To improve the performance of FRP strip configuration, the determined arrangement is investigated for different thicknesses and different widths of the FRP strips, and their results are compared with those of the connection specimen strengthened with full FRP coverage. The analysis results indicated that the load-bearing capacity of the connection retrofitted by the combined configuration of X-shape and orthogonal strips of FRP is close to that of the specimen with full FRP coverage. In this suitable configuration, the required FRP strips are reduced by about 30%, which decreases the cost and construction works needed for concrete joint rehabilitation.
Introduction
Retrofit of reinforced concrete beams and columns, as the main load-carrying members of structures, is of great importance in improving the performance and safety of concrete structures. The failure of concrete connections is among the most important factors in the vulnerability of reinforced concrete frames [1]. Over the past decades, reinforced concrete and steel jacketing have been used to strengthen the joint area in reinforced concrete structures. However, the implementation of these methods is a difficult and costly process that requires a lot of equipment and much effort [2–11].
In the past three decades, many studies have been done on the use of FRP (Fiber Reinforced Polymer) for structural rehabilitation and retrofit [12–17]. Considering the unique properties of FRP composites, their use as internal reinforcements and external sheets is one of the most widely used retrofit methods for concrete members [18–20]. On the other hand, durability and resistance to corrosion of FRP composites are the other advantages of this method [11]. The failure of reinforced beam-column joints usually occurs due to internal shear-tensile stresses in the joint area [21]. The occurrence of this damage in the joints is due to the inadequacy of the stirrups and their failure [22]. One of the most suitable methods to retrofit such connections is to attach FRP laminates or strips on the connection area. FRP at the joint is considered as a shear reinforcement element, and similar to concrete columns, it improves the connection confinement [4, 23–26].
Pseudo-dynamic experiments were carried out by Cosenza et al. (2003) [12], and Balsamo et al. (2005) [14] on a full-scale three-story SPEAR structure model. The three-dimensional structure studied by these researchers was designed solely to withstand gravity loads. This structure was retrofitted by FRP laminates and the members strengthening was carried out with full coverage of columns, beams and joints with FRP laminates. The results of the tests indicated that the method used to improve the seismic performance of the RC frame was effective, and strengthening the frame with CFRP(Carbon Fiber Reinforced Polymer) sheets increased the seismic strength of the structure by 1.5 times.
The behavior of exterior beam-column joints retrofitted by a combination of epoxy resin injection and CFRP sheets was studied by Karayannis et al. (2008) [27]. The tests were conducted on twelve exterior beam-column joint specimens under cyclic loading. The results showed that the retrofitting technique could improve the bearing capacity as well as the ductility of the joints.
The retrofit of reinforced concrete beam-column joints with FRP strips was investigated by Shrestha et al. (2009) [28]. FRP strips were used in two different arrangements. In the first arrangement, three horizontal FRP strips were used in the beam-column connection zone and continued to the adjacent beam faces. In the second arrangement, two vertical strips were used in the beam-column joint and continued to the faces of the adjacent column. The results of experimental studies indicated that instead of FRP laminates, the use of FRP strips could also improve the strength of the concrete joints.
In another study carried out by Trung et al. (2010) [20], the shear capacity of strengthened concrete beam-column joints with strips was investigated. In this study, 8 CFRP specimens were used with wider strips in L-shaped, T-shaped, and X-shaped forms. The results showed that the use of wide CFRP strips significantly improved the ductility and shear capacity of experimental specimens. In particular, the X-shaped arrangement with two layers of the CFRP sheets provided better performance in terms of ductility and shear capacity. The behavior of reinforced concrete beam-column joints retrofitted by FRP was investigated by Realfonzo et al. (2014) [29]. Evaluation of hybrid NSM-CFRP technical bars and FRP sheets for seismic rehabilitation of a concrete bridge pier was investigated by Mohamad Reza Shokrzadeh and F Nateghi-Alahi (2022) [4]. In this study, 10 beam-column joint specimens strengthened with different widths of FRP strips, and wrapping arrangements were used. Some damaged specimens were retrofitted once more with FRP sheets. In retrofitting the specimens, FRP coating and a combination of FRP sheets and steel profiles were employed. The results of these experimental studies showed that the simultaneous use of FRP sheets and steel profiles could effectively increase the load-carrying capacity and ductility of the joints due to the confinement provided by steel profiles.
Research significance
The high price of FRP materials and its implementation cost is one of the important disadvantages of this technique in retrofitting [4]. In this study, the appropriate configuration of FRP strips is investigated in order to reduce the amount of the required FRP material, as well as the implementation costs. Moreover, an attempt is made to determine and propose FRP arrangements that provide the appropriate strength for concrete moment frame joints. For this means, using ABAQUS finite element software [30], un-retrofitted concrete connection and retrofitted connections with various arrangements of FRP strips are modeled.
Model validation
To validate the numerical models, the experimental investigation carried out by Shrestha et al. (2009) [28] is used. The selected concrete joint specimen was retrofitted by vertical CFRP strips. The test setup and retrofitting scheme are shown in Figs. 1 and 2. The connection specimen was loaded at the end of the beam. The concrete used in the connection had a 28-day compression strength of 25.4 MPa. The steel used in longitudinal reinforcements had a yield strength of 532 MPa, and the steel used stirrups had a yield strength of 332 MPa. The FRP used for retrofitting had an elastic modulus of 243 GPa. An overview of the specimen and the FRP arrangement used is shown in Figs. 1 to 3 [28].
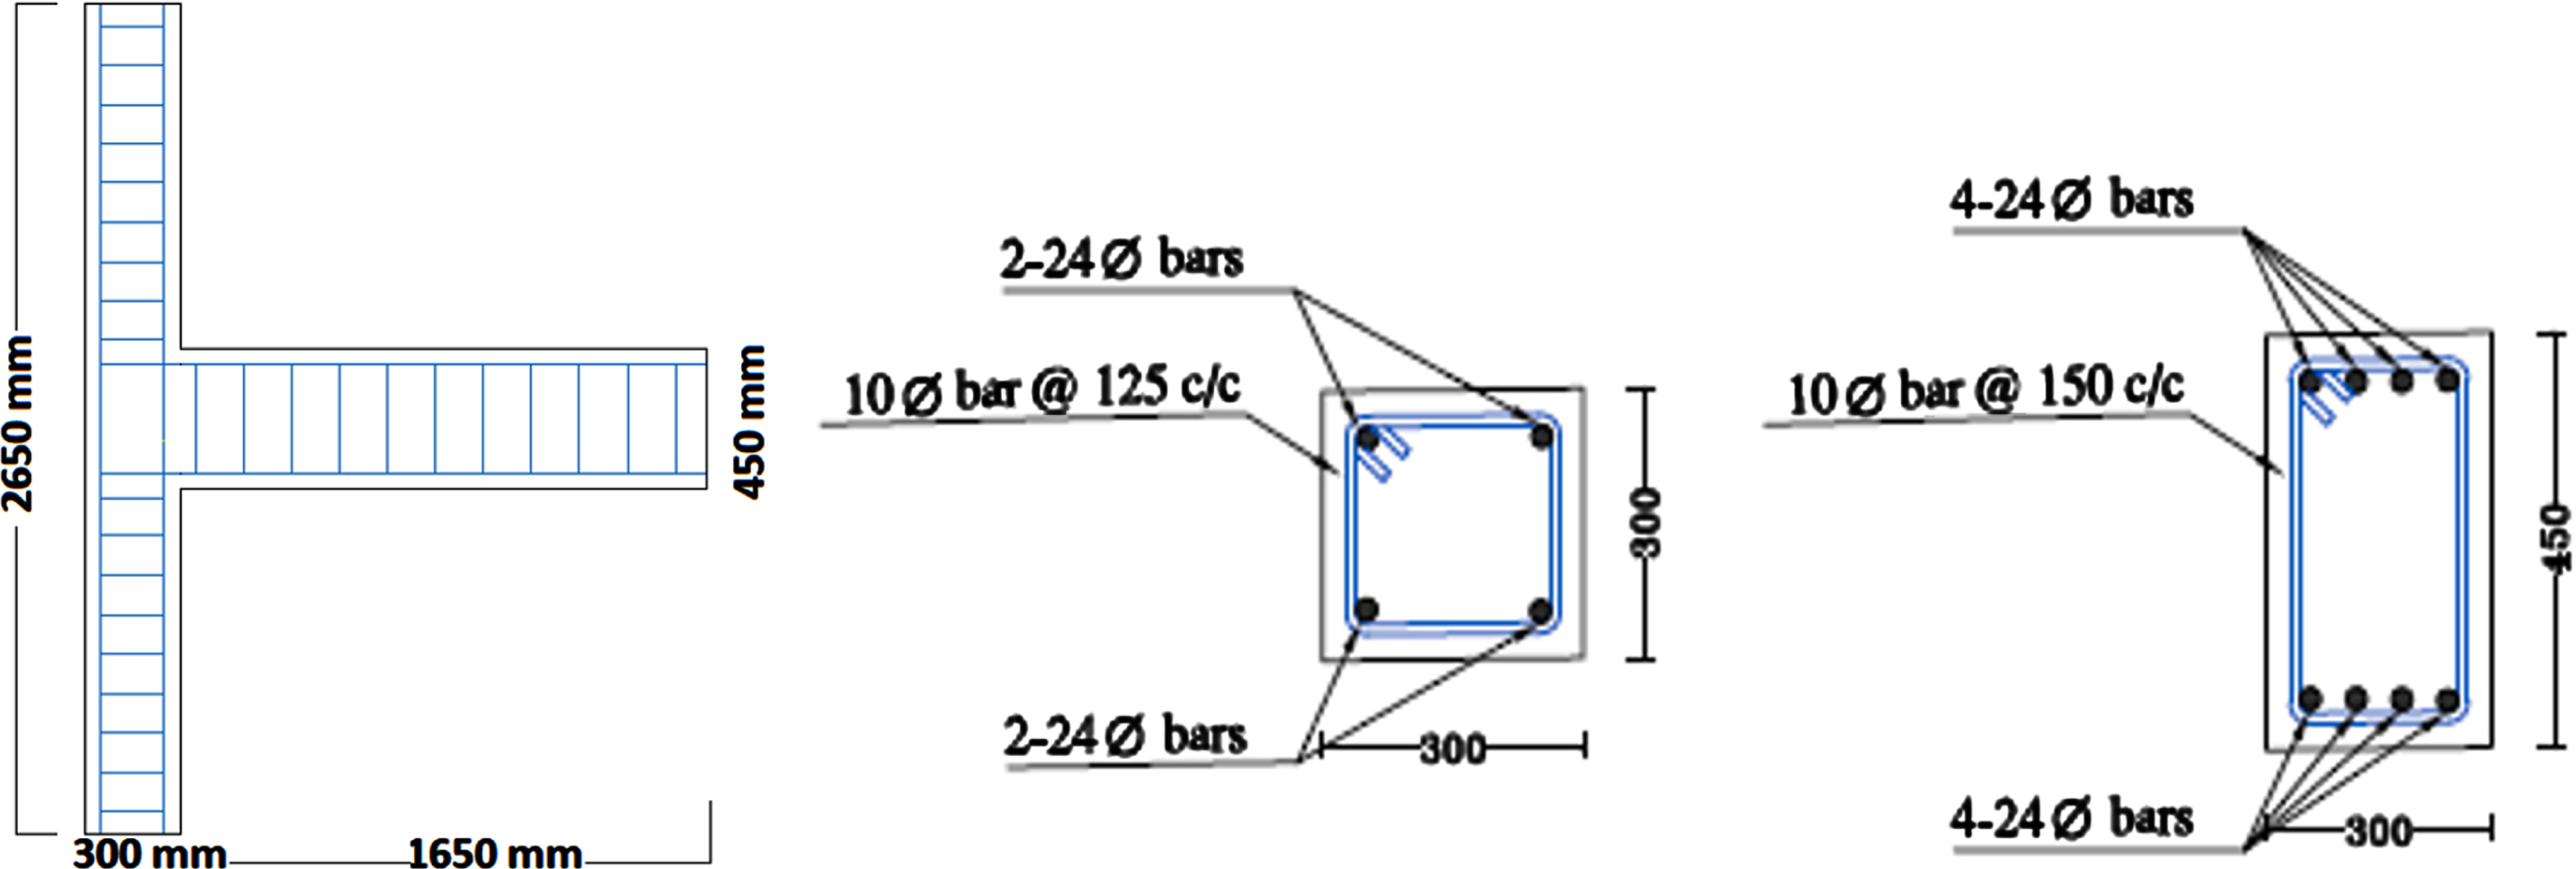
Details of beam and column sections for the verification model [27].
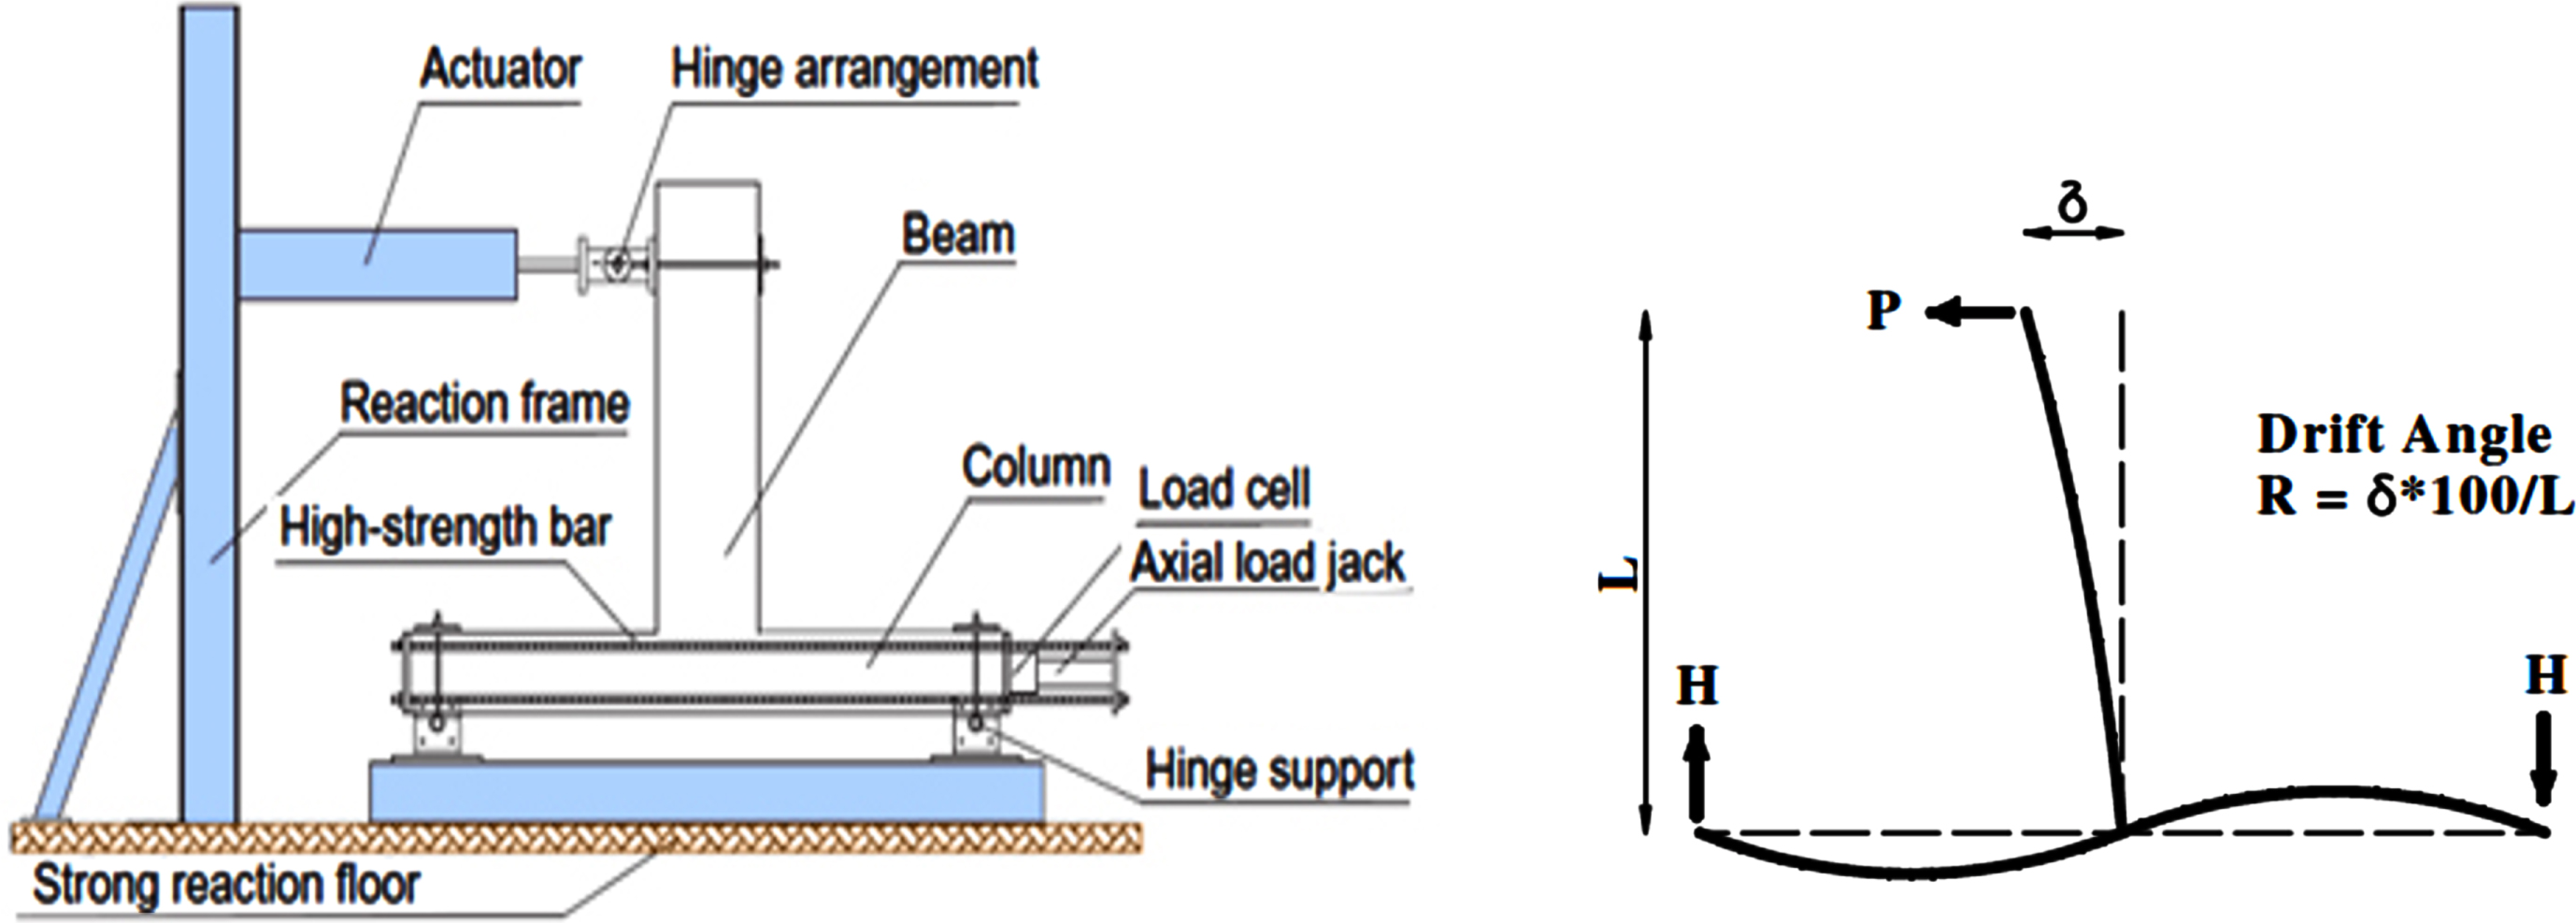
Details of loading and supporting of the experimental specimen [27].
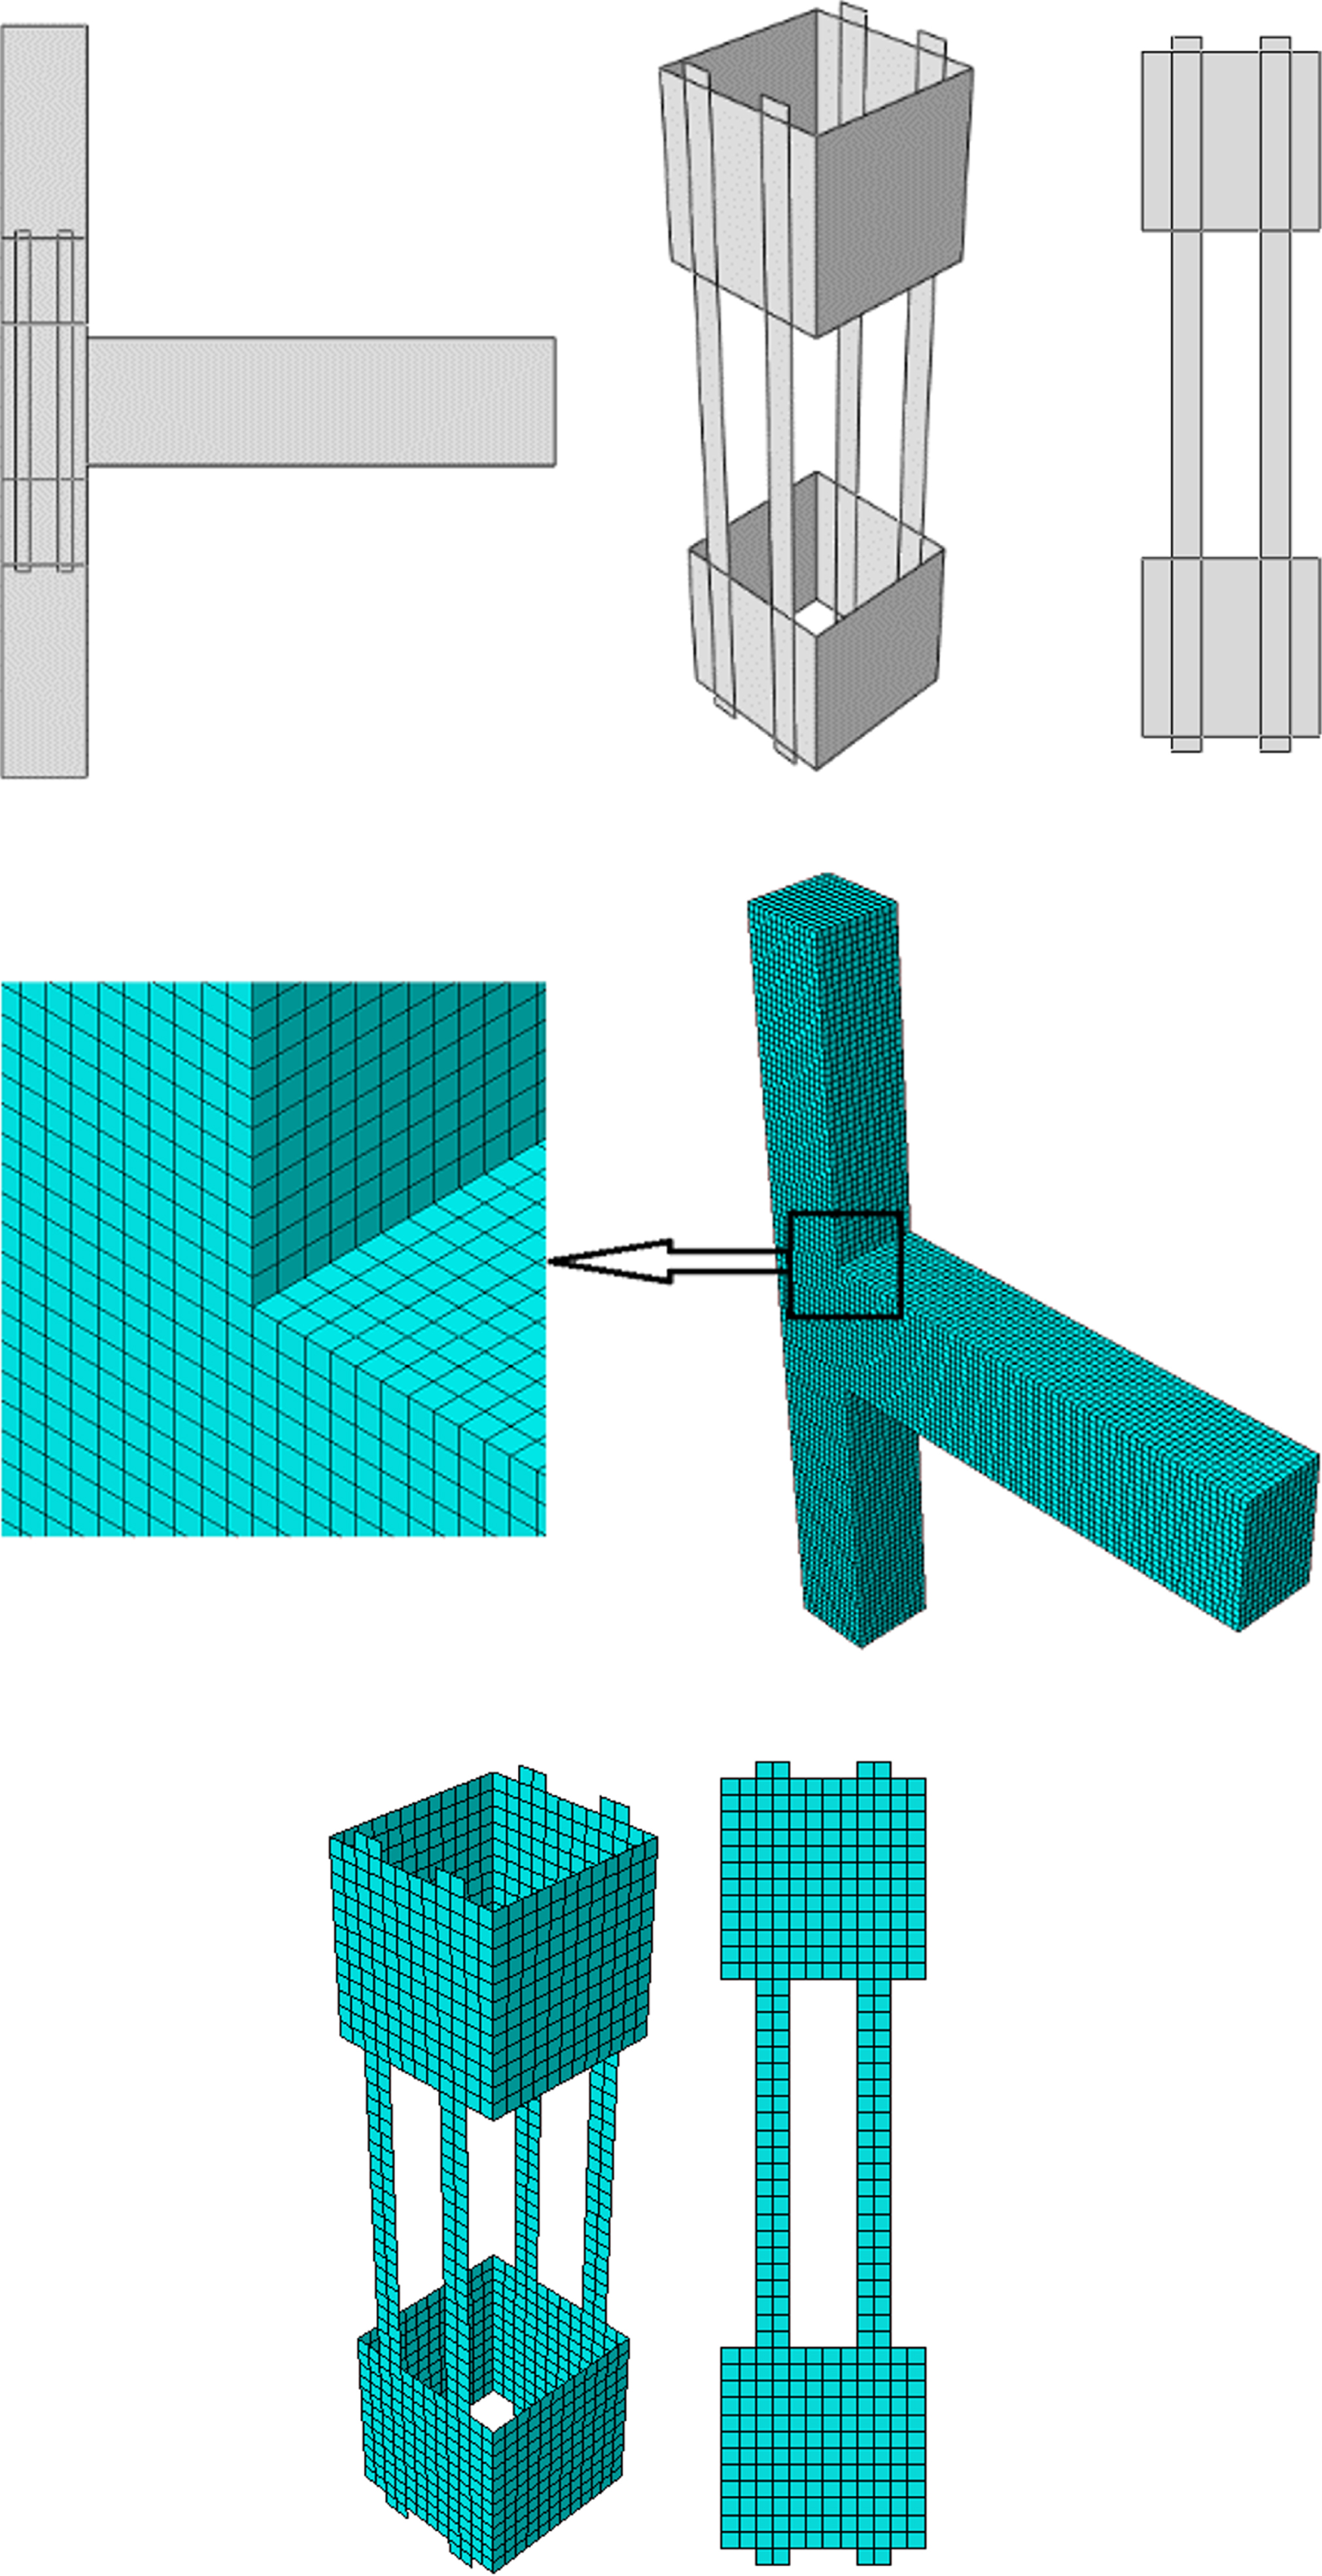
View of the FRP strips arrangement [27] and mesh used in the verification model.
ABAQUS [30] general-purpose finite element software was used for modeling experimental specimen. The Concrete Damage Plasticity (CDP) model was used in the beam-column joint simulation to describe the concrete behavior of FE model. The CDP model was built based on two concrete failure mechanisms: compressive crushing and tensile cracking [4]. It combines isotropic, weakened elasticity with compressive plasticity and isotropic tensile. The two major failure mechanisms are called tensile cracking and compressive crushing of concrete. After a fitting process, the following values for the input parameters were selected as the most suitable ones; 0.15 for the Poisson’s ratio of concrete, 30° degrees for the dilation angle Ψ of the reinforced concrete [4]. Moreover, the modulus of elasticity of concrete, Equation (1), was taken from the ACI 318-19 [31].
For modeling the nonlinear uniaxial behavior of concrete, the Kent and Park models (Figs. 4 and 5) were used [32, 33]. In the Kent and Park model, compressive stress is calculated by Equation (2):
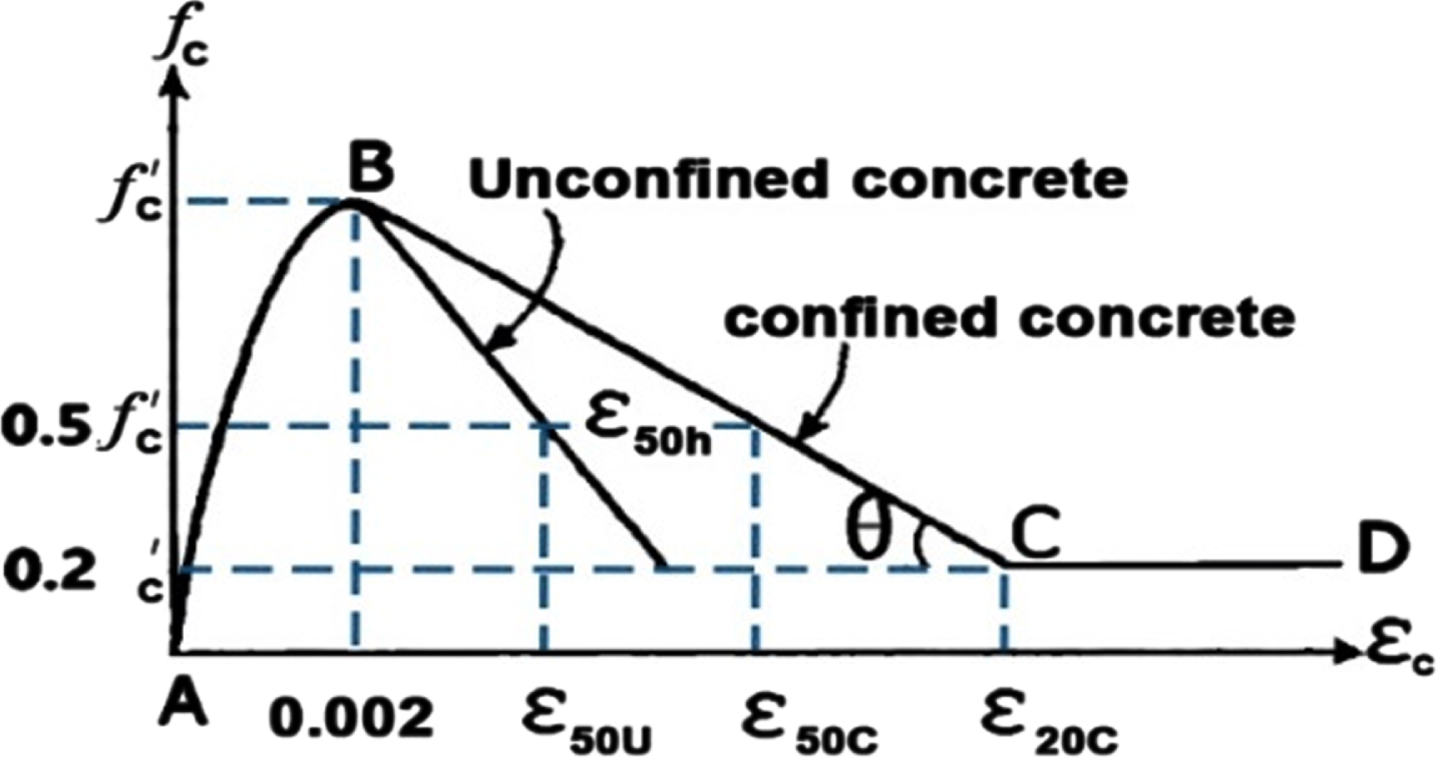
Stress-strain curve of confined and unconfined concrete [37].
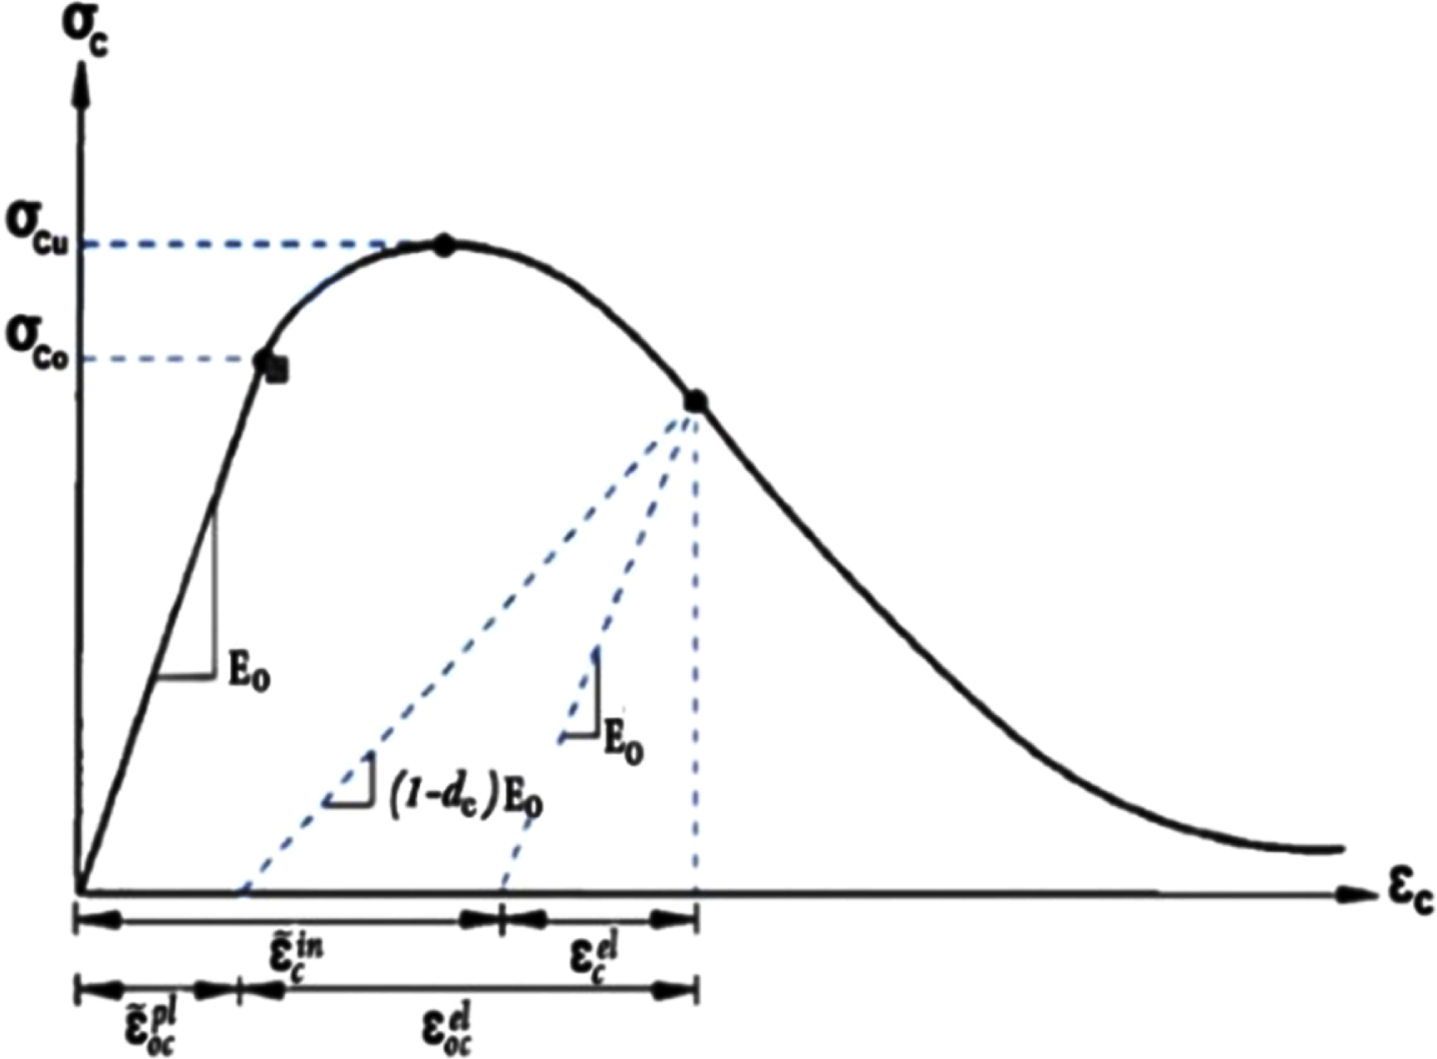
Effect of compressive damage on unloading slope in compression phase [38].
Where ɛ#x025B;
c
is compressive strain, f
co
and
Where ɛ#x025B;
C
∼PL is inelastic strain, ɛ#x025B;
C
is compressive strain, E
o
is elasticity modulus, d
c
is compressive damage, ɛ#x025B;
C
∼in is strain related to damage. Equation 5 is used to calculate the compressive damage value [4]:
Where σ
C
is compressive stress and
The modeling of reinforcement bond in concrete is typically taken into account in structural analysis and design. The bond between the reinforcement and concrete is an important aspect in accurately predicting the behavior of reinforced concrete structures. Various methods and models exist to simulate the bond behavior, such as using interface elements or considering bond-slip relationships. These modeling techniques aim to capture the interaction between the reinforcement and surrounding concrete, taking into account factors such as surface roughness, bar diameter, concrete strength, and development length. By considering reinforcement bond, the structural analysis and design can more accurately predict the behavior and performance of reinforced concrete members [4, 36]. For the simulation of the steel bars, two nodes 3D truss elements (T3D2) were used, while four nodes quadrilateral shell elements (S4 R) were used with FRP sheet, and eight-node solid elements (C3D8 R)for concrete were used [8, 35]. Various mesh sizes were used according to each part’s dimensions (concrete, steel bar, and CFRP sheets). Based on the mesh sensitivity analysis, mesh size of 25 mm was selected (Fig. 3). The bond-slip behavior between FRP (Fiber-Reinforced Polymer) strips and concrete is not considered to be fully rigid. The bond between FRP and concrete is typically characterized by a nonlinear bond-slip relationship. This means that as the applied load increases, the FRP strip experiences slip relative to the concrete surface. The bond-slip behavior is influenced by various factors such as surface roughness, adhesive properties, confinement, and curing conditions. In the initial stages of loading, the bond between FRP and concrete is generally strong, but as the load increases, slip begins to occur, leading to a reduction in the bond strength. This slip allows for redistribution of stresses and deformation along the length of the FRP strip, which contributes to the overall performance and load-carrying capacity of the FRP-strengthened element. To accurately model the bond-slip behavior, various analytical and numerical approaches are used, including empirical models, pull-out tests, and finite element analysis. These methods aim to capture the nonlinear bond-slip relationship and provide a realistic representation of the interaction between the FRP strip and concrete [4, 36]. The contact between CFRP and concrete was in test to be perfectly bonded (tie). For the simulation interactions between CFRP and concrete were also are a tie. The interaction between concrete parts and the reinforcement is modeled as perfectly bonded, and all reinforcements are embedded in concrete parts [32–34]. The tension-stiffening effect plays a significant role in the behavior of a concrete-FRP tie. When the concrete cracks, the tensile strain capacity of the FRP strip is typically much higher than that of the concrete. This difference in tensile strain capacity affects the stiffness of the tie after concrete cracking, and it is influenced by the bond behavior between the FRP and concrete. The tension-stiffening effect refers to the contribution of the surrounding cracked concrete to the overall stiffness of the reinforced member. As the FRP strip begins to bear tensile forces, the cracked concrete surrounding it experiences tension as well. This tension in the cracked concrete induces compressive stresses, which result in a stiffening effect. The stiffness of the concrete-FRP tie depends on the bond behavior between the FRP and concrete. A strong bond between the FRP and concrete will facilitate the transfer of stresses and strains, leading to a more effective tension-stiffening effect. Conversely, a weak bond may result in reduced load transfer and a diminished tension-stiffening effect. To accurately capture the tension-stiffening effect in the analysis and design of concrete-FRP ties, models and methods have been developed. These models consider factors such as the bond strength, slip, and interface behavior between the FRP and concrete. By incorporating the tension-stiffening effect, the stiffness and overall behavior of the concrete-FRP tie can be more accurately predicted [4, 36]. The beam-column joint was supported at the top and bottom of the column, and the displacement was imposed on the end of the beam. The procedure of analysis was done in implicit mode. Regarding quasi-static loading, the static general method was selected for analysis. As well as in this study, considering the main objective of investigating different arrangements of FRP sheets, certain simplifications were made. The debonding between concrete and FRP was neglected, and the use of epoxy adhesive was not included in the modeling. Additionally, the behavior of steel reinforcement within concrete was assumed to be embedded, disregarding any slippage. These simplifications were made to enhance the computational efficiency of the analyses. However, it should be noted that the validation of the results was performed using laboratory models under these specific conditions, and acceptable results were reported. These explanations highlight the limitations of the study and demonstrate that the results obtained are based on specific assumptions and conditions.
Experimental testing of beam-column with an attached carbon fiber strips and plates was used to calibrate the numerical model: The default K, This parameter determines the shape of the width scale of the surrender level and varies in the range 5/0 and up to 1. If k = 1 is entered, the scale of the surrender level will be circular. In this study, according to the software recommendation, k = 2/3 is considered. The dilation angle (Ψ) ranged from 20° to 40°. In this validation, a dilation angle of 30° was considered, and the viscosity parameter for concrete damage measurements had a value of 0.001. Higher dilation angle values produced a ductile response, while lower dilation angle values gave a fragile response. Compression measured damage parameter (dc) has a remarkable effect on the bending response of the hybrid structural elements. The value of the viscosity parameter must be carefully chosen in realistic calculations using the CDP material model. The dilation, viscosity and Kc values equal to 30, 1.16, and 0.667, respectively, are taken for the best fit [38]. According to CEB-FIB, the concrete stress-strain compression and the tensile post cracking behavior of the concrete were defined [4]. The experimental specimen was analyzed by the developed model. As shown in Fig. 6, the analytical results are appropriately consistent with the experimental results. The maximum strength of the specimen based on the force-displacement curve (Fig. 6) of the test is 102.734 kN. This strength is obtained in the numerical analysis as 105.517 kN, representing a numerical error of less than 5% in the estimation of the member strength compared to the experimental results. Therefore, a 5% difference indicates a reasonably close agreement between the numerical and experimental results, and it can be regarded as a satisfactory outcome.
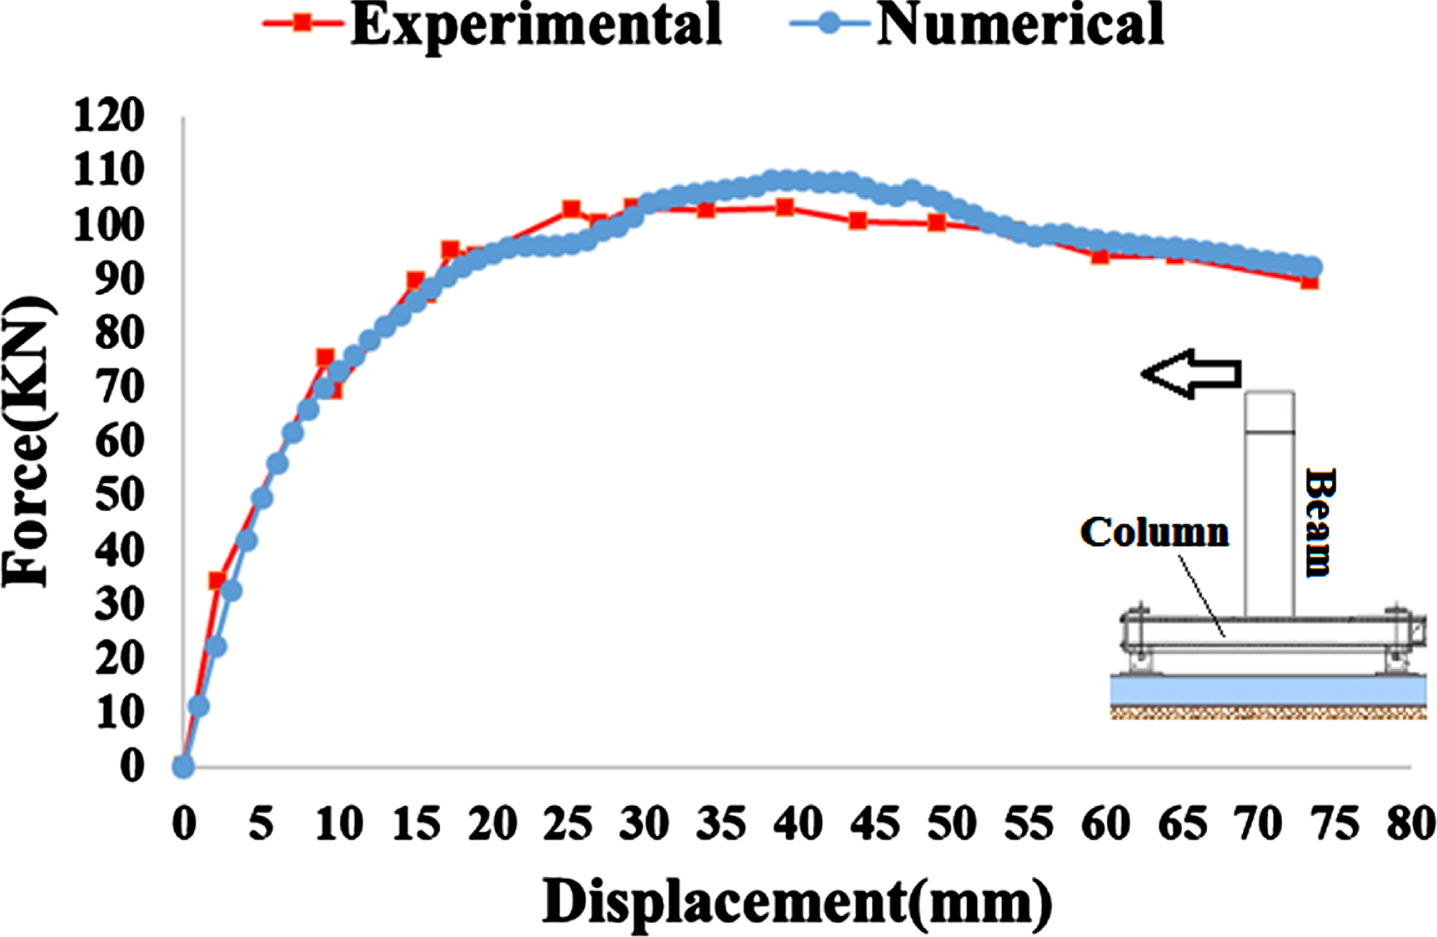
Force-displacement curve obtained by experimental results [27] in compared with the results of numerical analysis.
The first step in examining the proper arrangement of FRP strips in the retrofit of the concrete frame connection area is to find the locations where adding the composite sheet can efficiently improve the strength of the joint. Therefore, it is necessary to identify the types of possible failures in the connections. The types of possible failure in the connection are shown in Fig. 7 [4, 39]. Two modes (a) and (b) represent the damage caused by the formation of the plastic hinges in the beam and column, respectively. State (c) indicates the condition in which the joint area concrete coating encountered intense defects, and column reinforcements are damaged and buckled. State (d) also indicates that the tensile reinforcement of the beam has come out of place due to the absence of sufficient anchorage. In state (e), the core of the connection is crushed by the formation of diagonal shear cracks due to lack of sufficientcient stirrups or concrete strength in the joint area. Previous studies show that failures (c) and (d) are usually less likely to occur. In the case of failure shown in Fig. 7-(e), research also shows that the use of FRP in the retrofit of joints reduces the slip of the reinforcement [39] Shear failure in the connection is one of the most frequent modes of concrete connection failure (e). An appropriate connection retrofit procedure for this failure mode is the use of FRP strips. In most cases, for shear retrofit of joints, FRP material is usually attached on the side surfaces of the beam using U-shaped laminates and the lower surface of the beam, and the beam and column section circumference is completely wrapped. In this form of retrofit, the entire connection area and the beginning of the beams and columns connected to the joint are wrapped by FRP [40, 41].
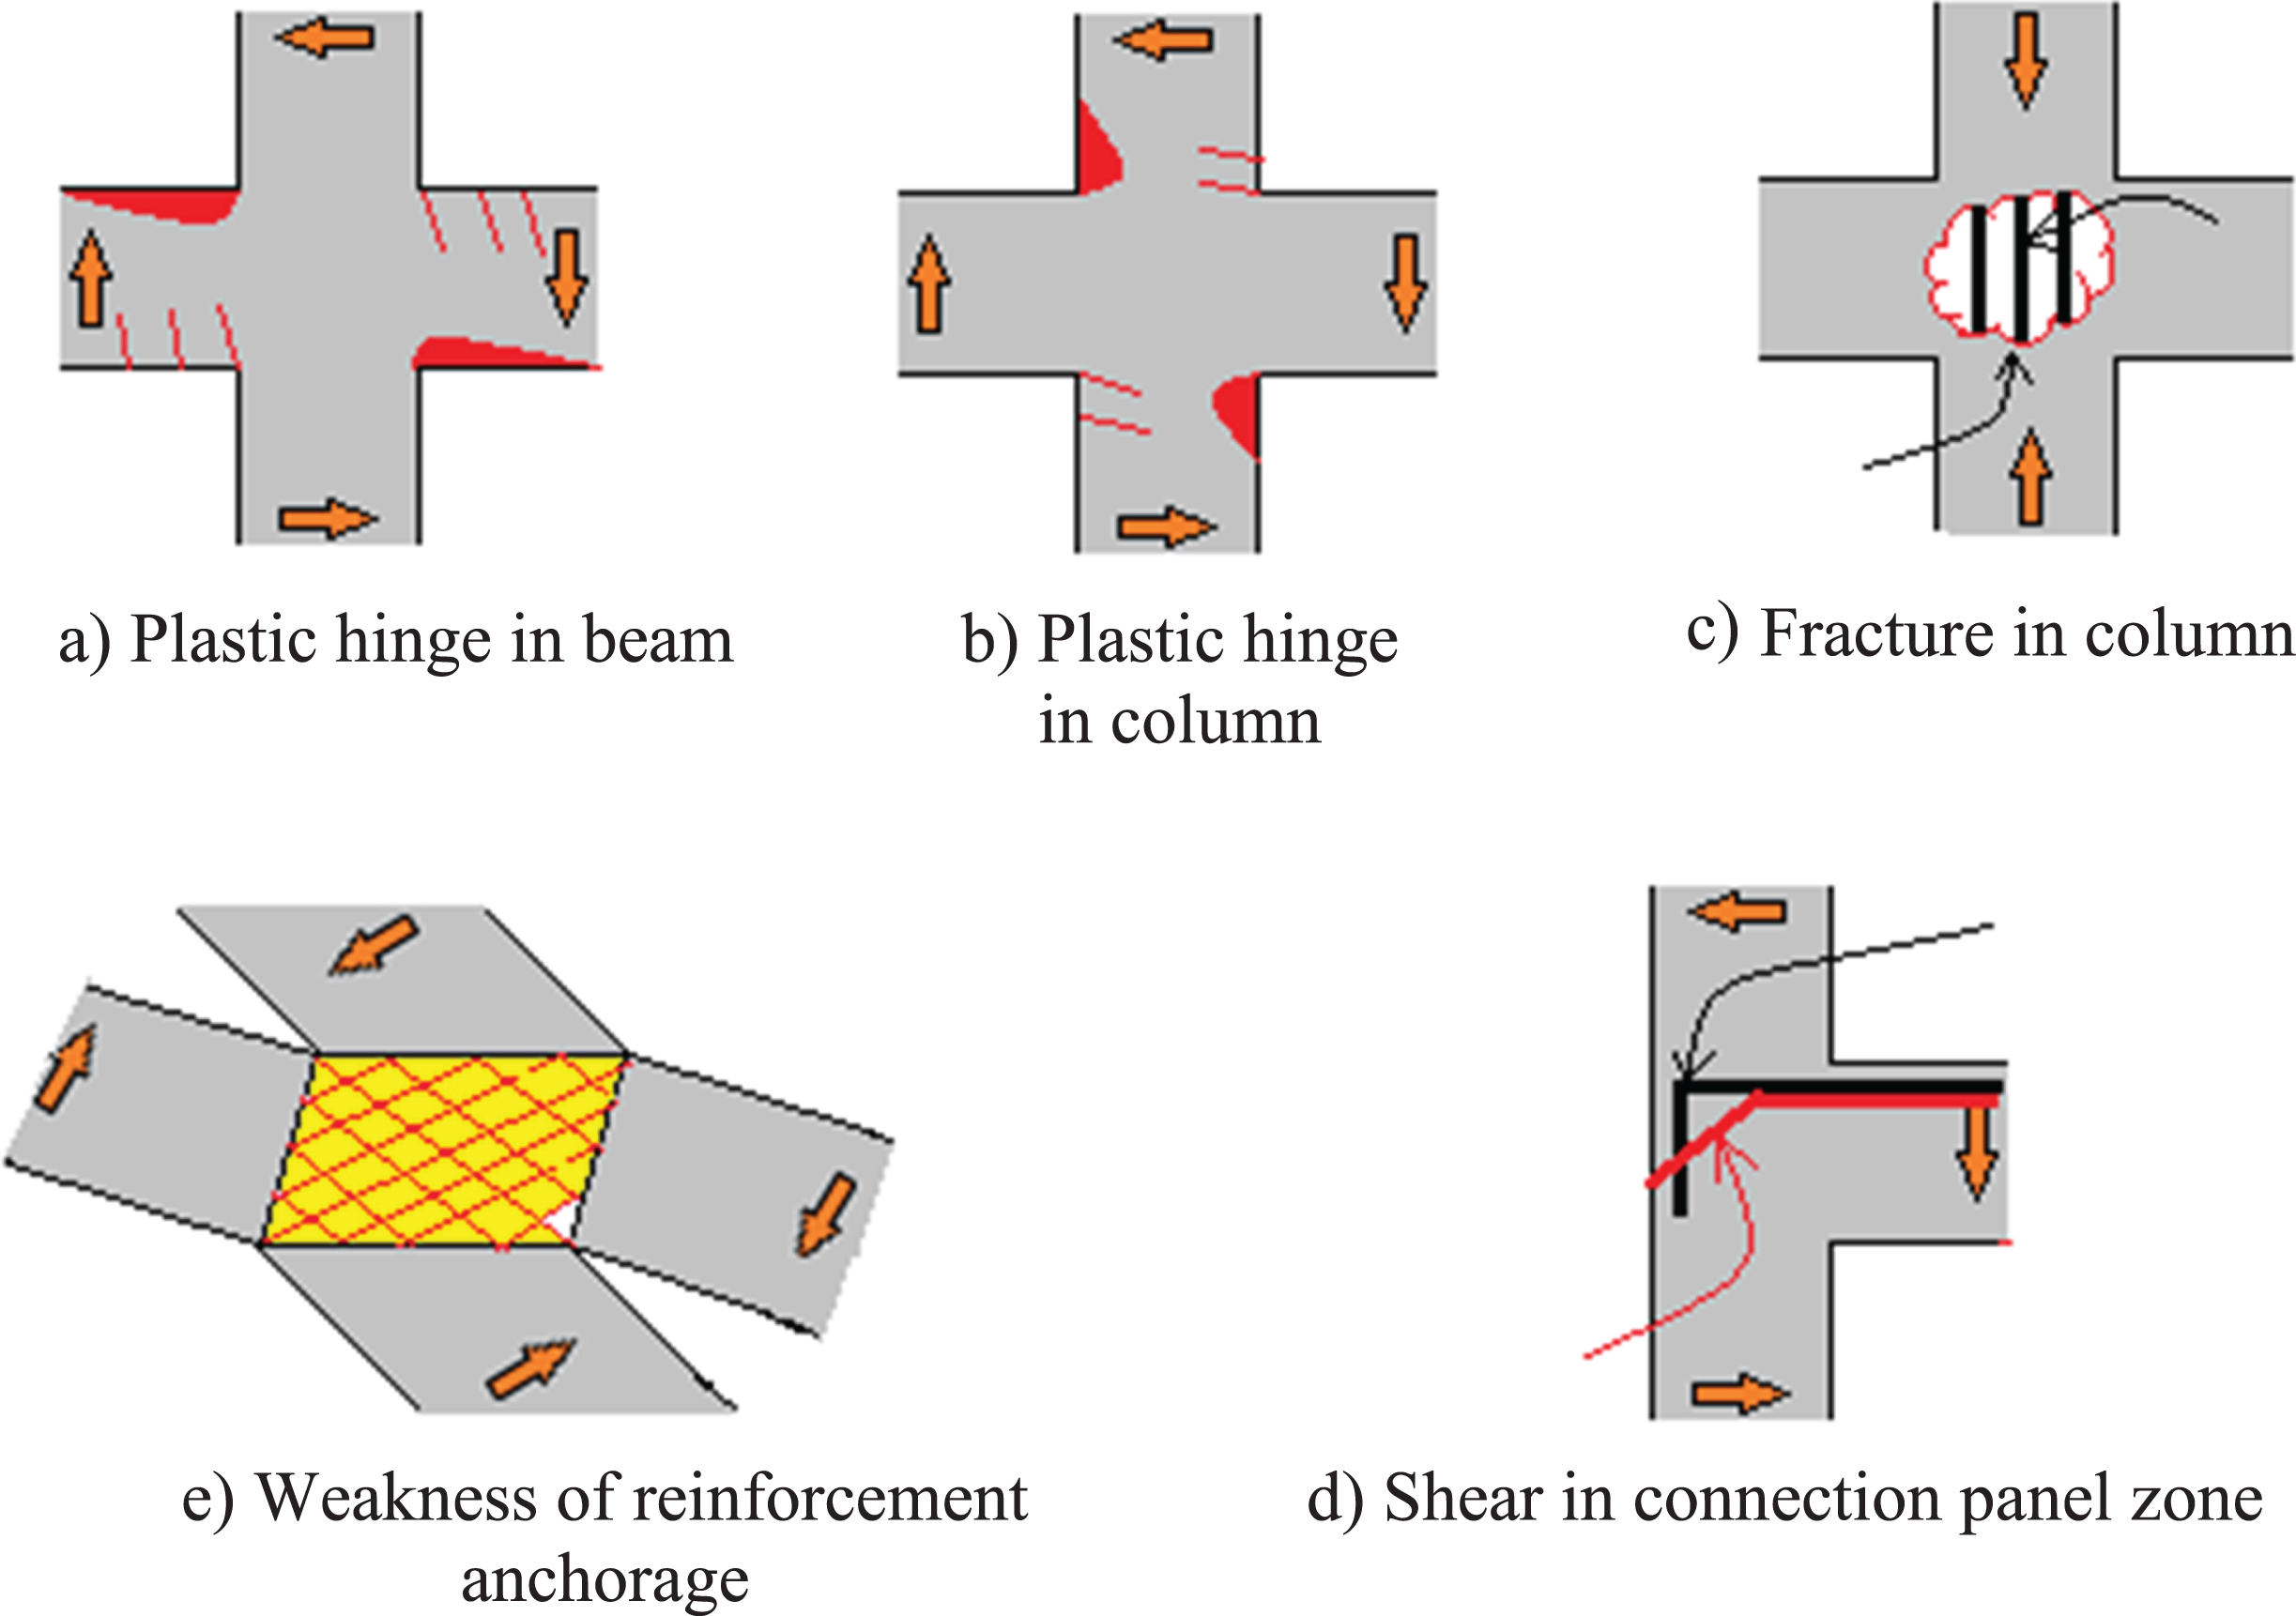
Types of fracture mechanisms in the connection area of concrete frames [39].
In this study, different configurations of FRP strips are used instead of full FRP coverage to reduce the cost of retrofit and surface preparation. These arrangements, while consuming less FRP sheets, reduce the amount of removed cladding, and concrete surface preparation for attaching sheets. In order to investigate the adequacy of these arrangements, the base joint specimen used for verification is re-retrofitted and modeled with various strip configurations.
To evaluate the performance of different FRP strip configurations, various retrofit specimens are examined and compared with specimen number one with complete coverage at the end of the beam and column and the connection panel zone with the maximum FRP consumption. The detailed properties of the specimens are presented below.
A) The base specimen without retrofit
As shown in Fig. 1, this specimen is a weak beam-column connection that does not have stirrups at the joint and does not include any retrofit.
B) Specimen No. 1 with complete wrapping
As shown in Fig. 8 (a), a complete FRP wrapping is used to strengthen the connection in this specimen. The length of the retrofitted area in the column circumference was considered hc (height of the column section), and the length of the retrofit area in the beam is equal to one and a half times the hb (height of the beam section). It should be noted that for a better understanding of the arrangements used in the figures, the RC part is removed.
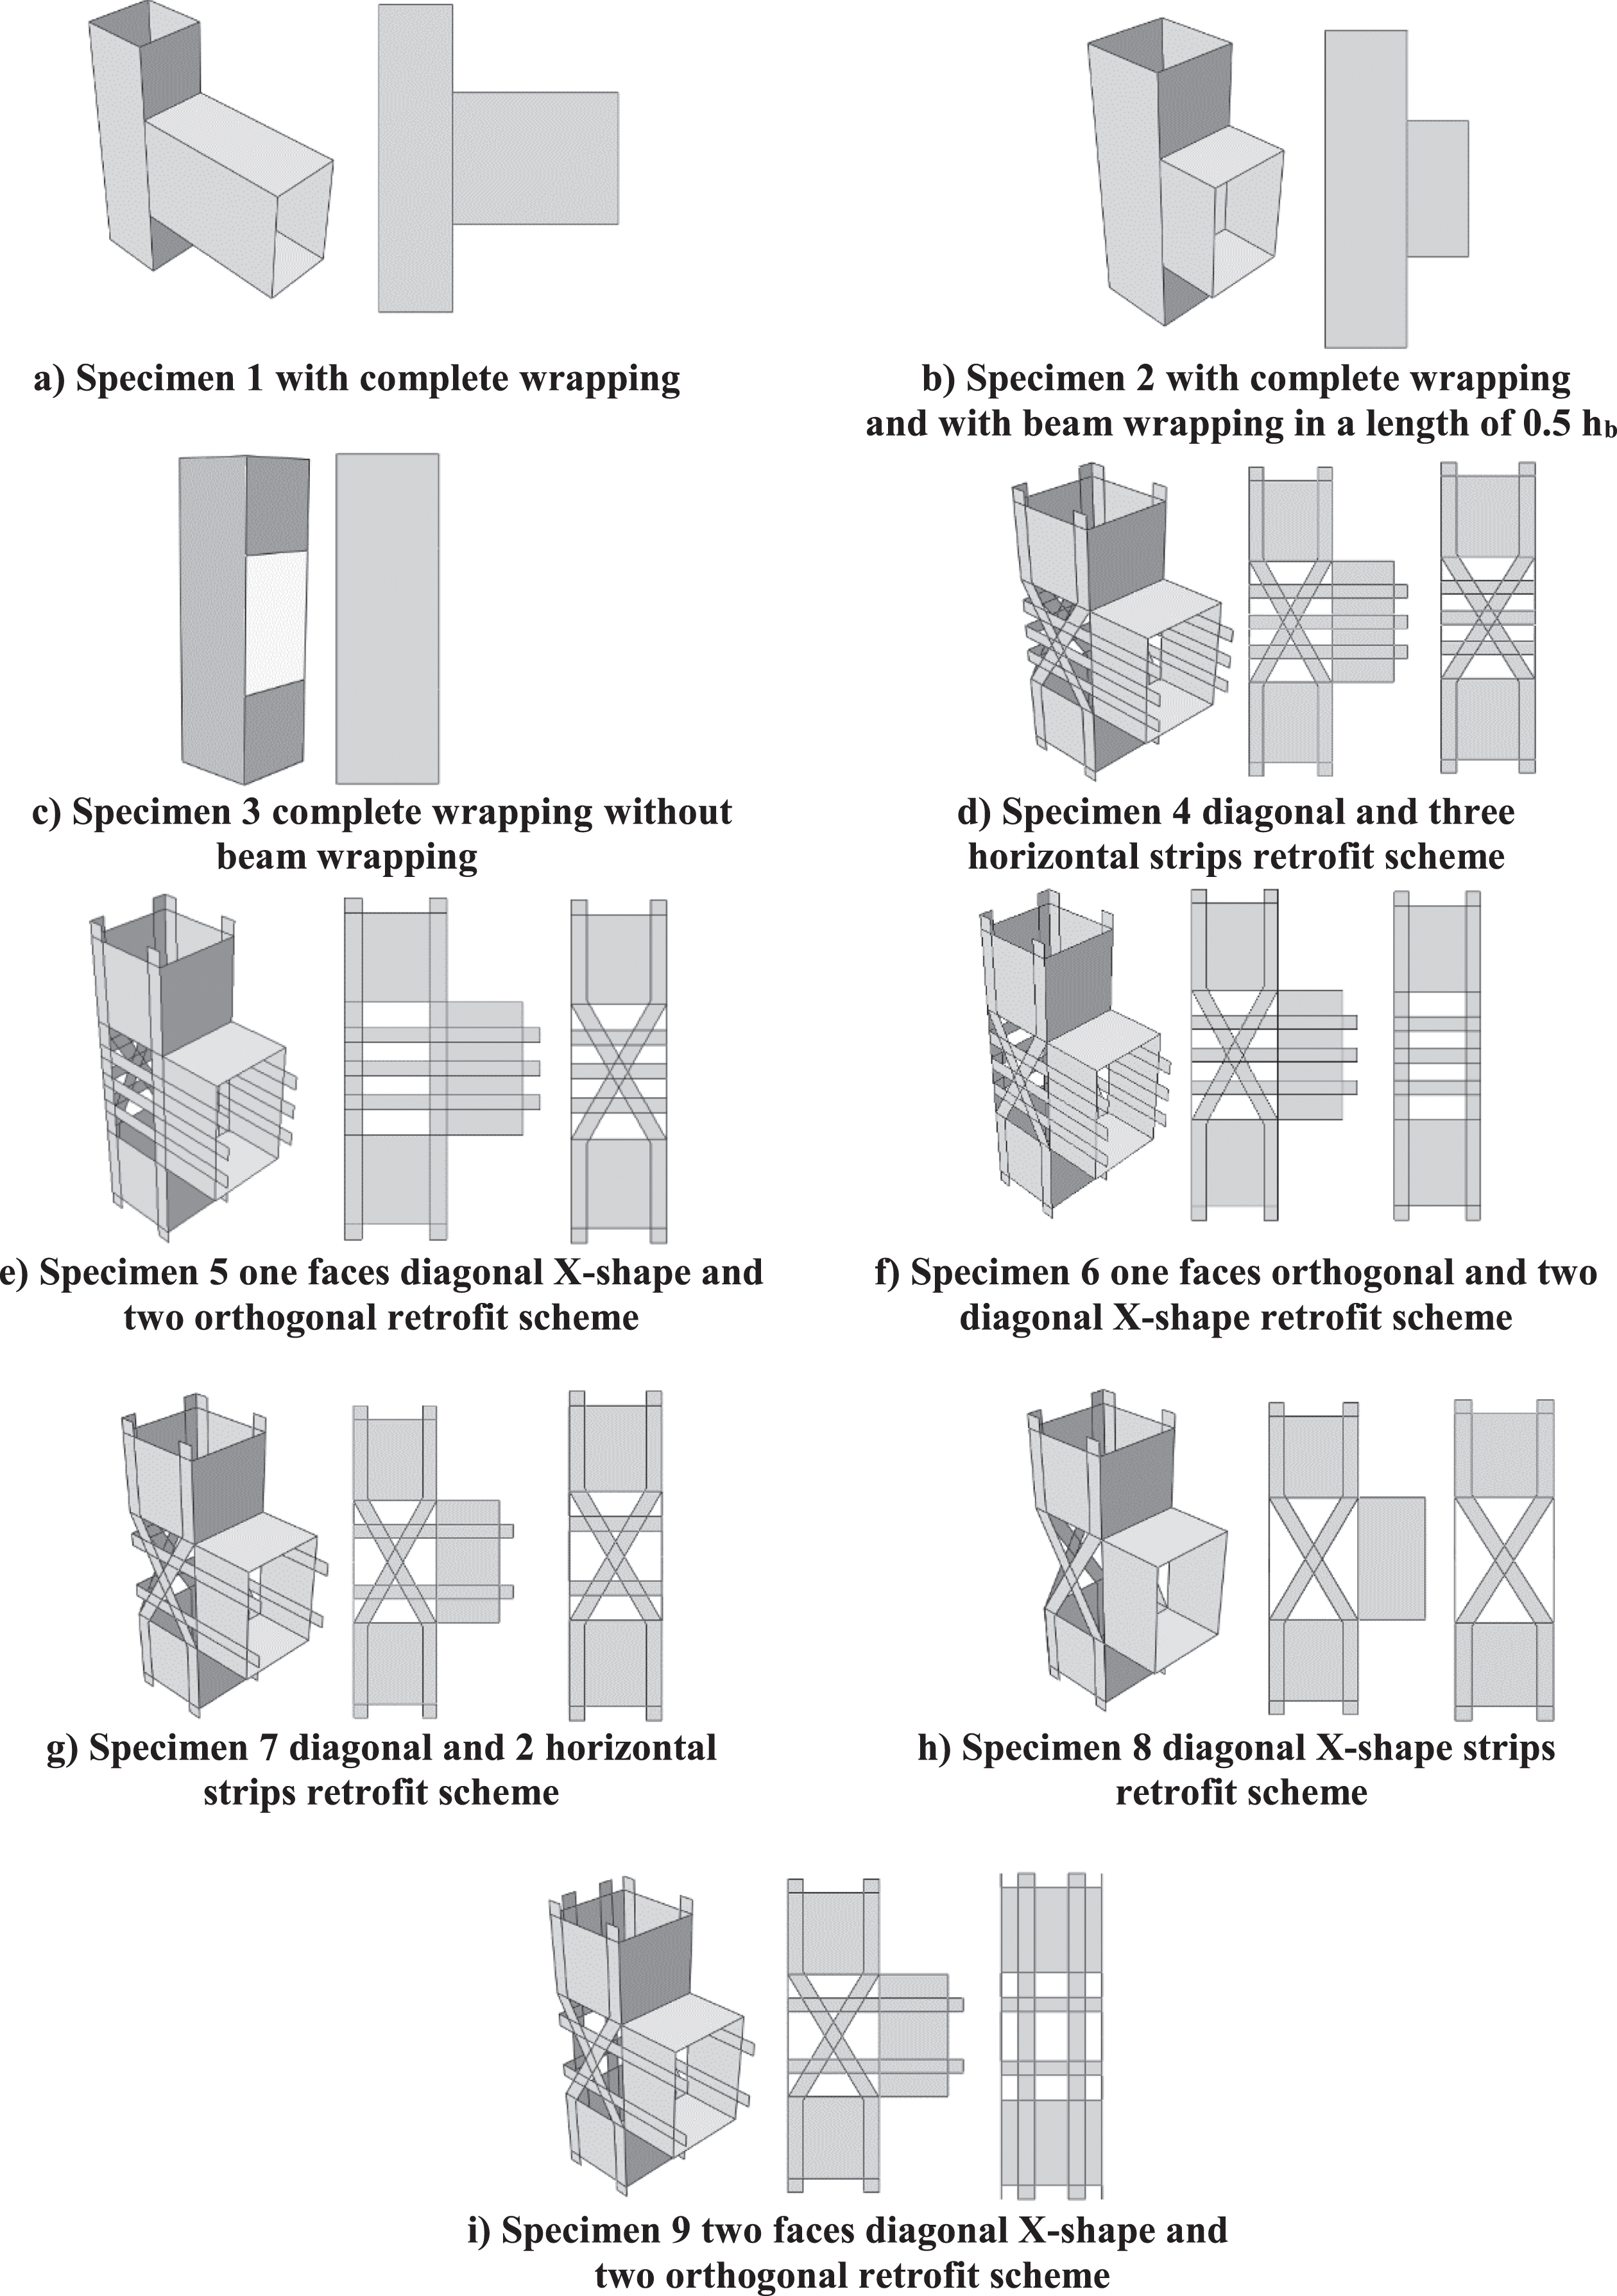
FRP arrangements in the specimens under consideration.
C) Specimen No. 2 with complete wrapping and reduction of beam retrofit
In this specimen, as observed in Fig. 8 (b), the length of the retrofitted area in the column face is hc and the length of the retrofitted area in the beam is equal to half of hb.
D) Specimen No. 3 complete wrapping of joint without beam retrofit
In this specimen, as shown in Fig. 8 (c), the length of the retrofitted area is equal to the height of the column section hc, and the retrofitted area in the beam is omitted.
E) Specimen No. 4 diagonal and three horizontal strips retrofit scheme
In this specimen, as it is observed in Fig. 8 (d), the length of the retrofitted area in the column face is equal to hc, and the length of the retrofitted area in the beam is equal to half, and in the connection area, the sides and back of the joint are retrofitted by a combination of X-shape and three horizontal strips with a width of 0.05 m.
F) Specimen No. 5 one faces diagonal X-shape and two orthogonal retrofit scheme
In this specimen, as shown in Fig. 8 (e), the length of the retrofitted area in the column face is equal to hc, and the length of the retrofitted area in the beam is equal to half. The sides of the column are retrofitted with three strips with a width of 0.05 m, and the back of the joint are retrofitted by a combination of X-shape and three horizontal strips with a width of 0.05 m.
G) Specimen No. 6 one faces orthogonal and two diagonal X-shape retrofit scheme
In this specimen, as it is observed in Fig. 8 (f), the length of the retrofitted area in the column face is equal to hc. The length of the retrofitted area in the beam is equal to half. In the connection area, the back of the joint is retrofitted by three horizontal strips with a width of 0.05 m. The sides of the column are retrofitted with a combination of X-shape and three horizontal strips with a width of 0.05 m.
H) Specimen No. 5 X-shape and two horizontal strips retrofit scheme
In this specimen, as it is observed in Fig. 8 (g), the length of the retrofitted area in the column face is equal to hc, and the length of the retrofitted area in the beam is equal to 0.5 hb, and in the joint area, the sides and back of the joint are retrofitted by a combination of X-shape and three horizontal strips with a width of 0.05 m.
I) Specimen No.6 diagonal X-shape strips retrofit scheme
In this specimen, as it is observed in Fig. 8 (h), the length of the retrofitted area in the column face is equal to hc, and the length of the retrofitted area in the beam is equal to 0.5 hb, and in the joint area, the back and side of the column are retrofitted by X-shape arrangement with a width of 0.05 m. In this case, no horizontal strips are used.
J) Specimen No. 7 two faces diagonal X-shape and two orthogonal strips retrofit scheme
This specimen is shown in Fig. 8 (i). In this specimen, instead of full wrapping, the X-shape arrangement of strips is used. These strips are restrained with a full wrapping at the end of the beam and column. The length of the retrofitted area in the column face is considered to be equal to hc, and the length of the retrofitted area on the side of the beam is equal to 0.5 hb. In the connection area, the sides of the connection are retrofitted by X-shape arranged FRP strips with a width of 0.05 m and at the back of the column as a flat arrangement as two rows with a width of 0.05 m.
It should be noted that in order to obtain the required FRP thickness, the equation provided by Karayannis and Sirkelis (2008) is used [27].
Where K = 0.1 (in the plastic hinge location) and f ‘c the compressive strength of the concrete is 25.4 MPa for the connection without stirrup, and the second part of the Equation (6)
Investigation of monotonic force-displacement curves
In order to study the performance of the specimens, they are exposed to monotonic load at the free end of the beam, and nonlinear analyses are statically carried out. In Fig. 9, the comparison of force-displacement curves of the retrofitted specimens using FRP strips or laminates are compared with those of the base model. These curves are also idealized by the equivalent bilinear curve. In Table 1, the values of ultimate strength, percentage of strength increase in comparison with the base model, and the area beneath the force-displacement curve (dissipated energy) are presented.
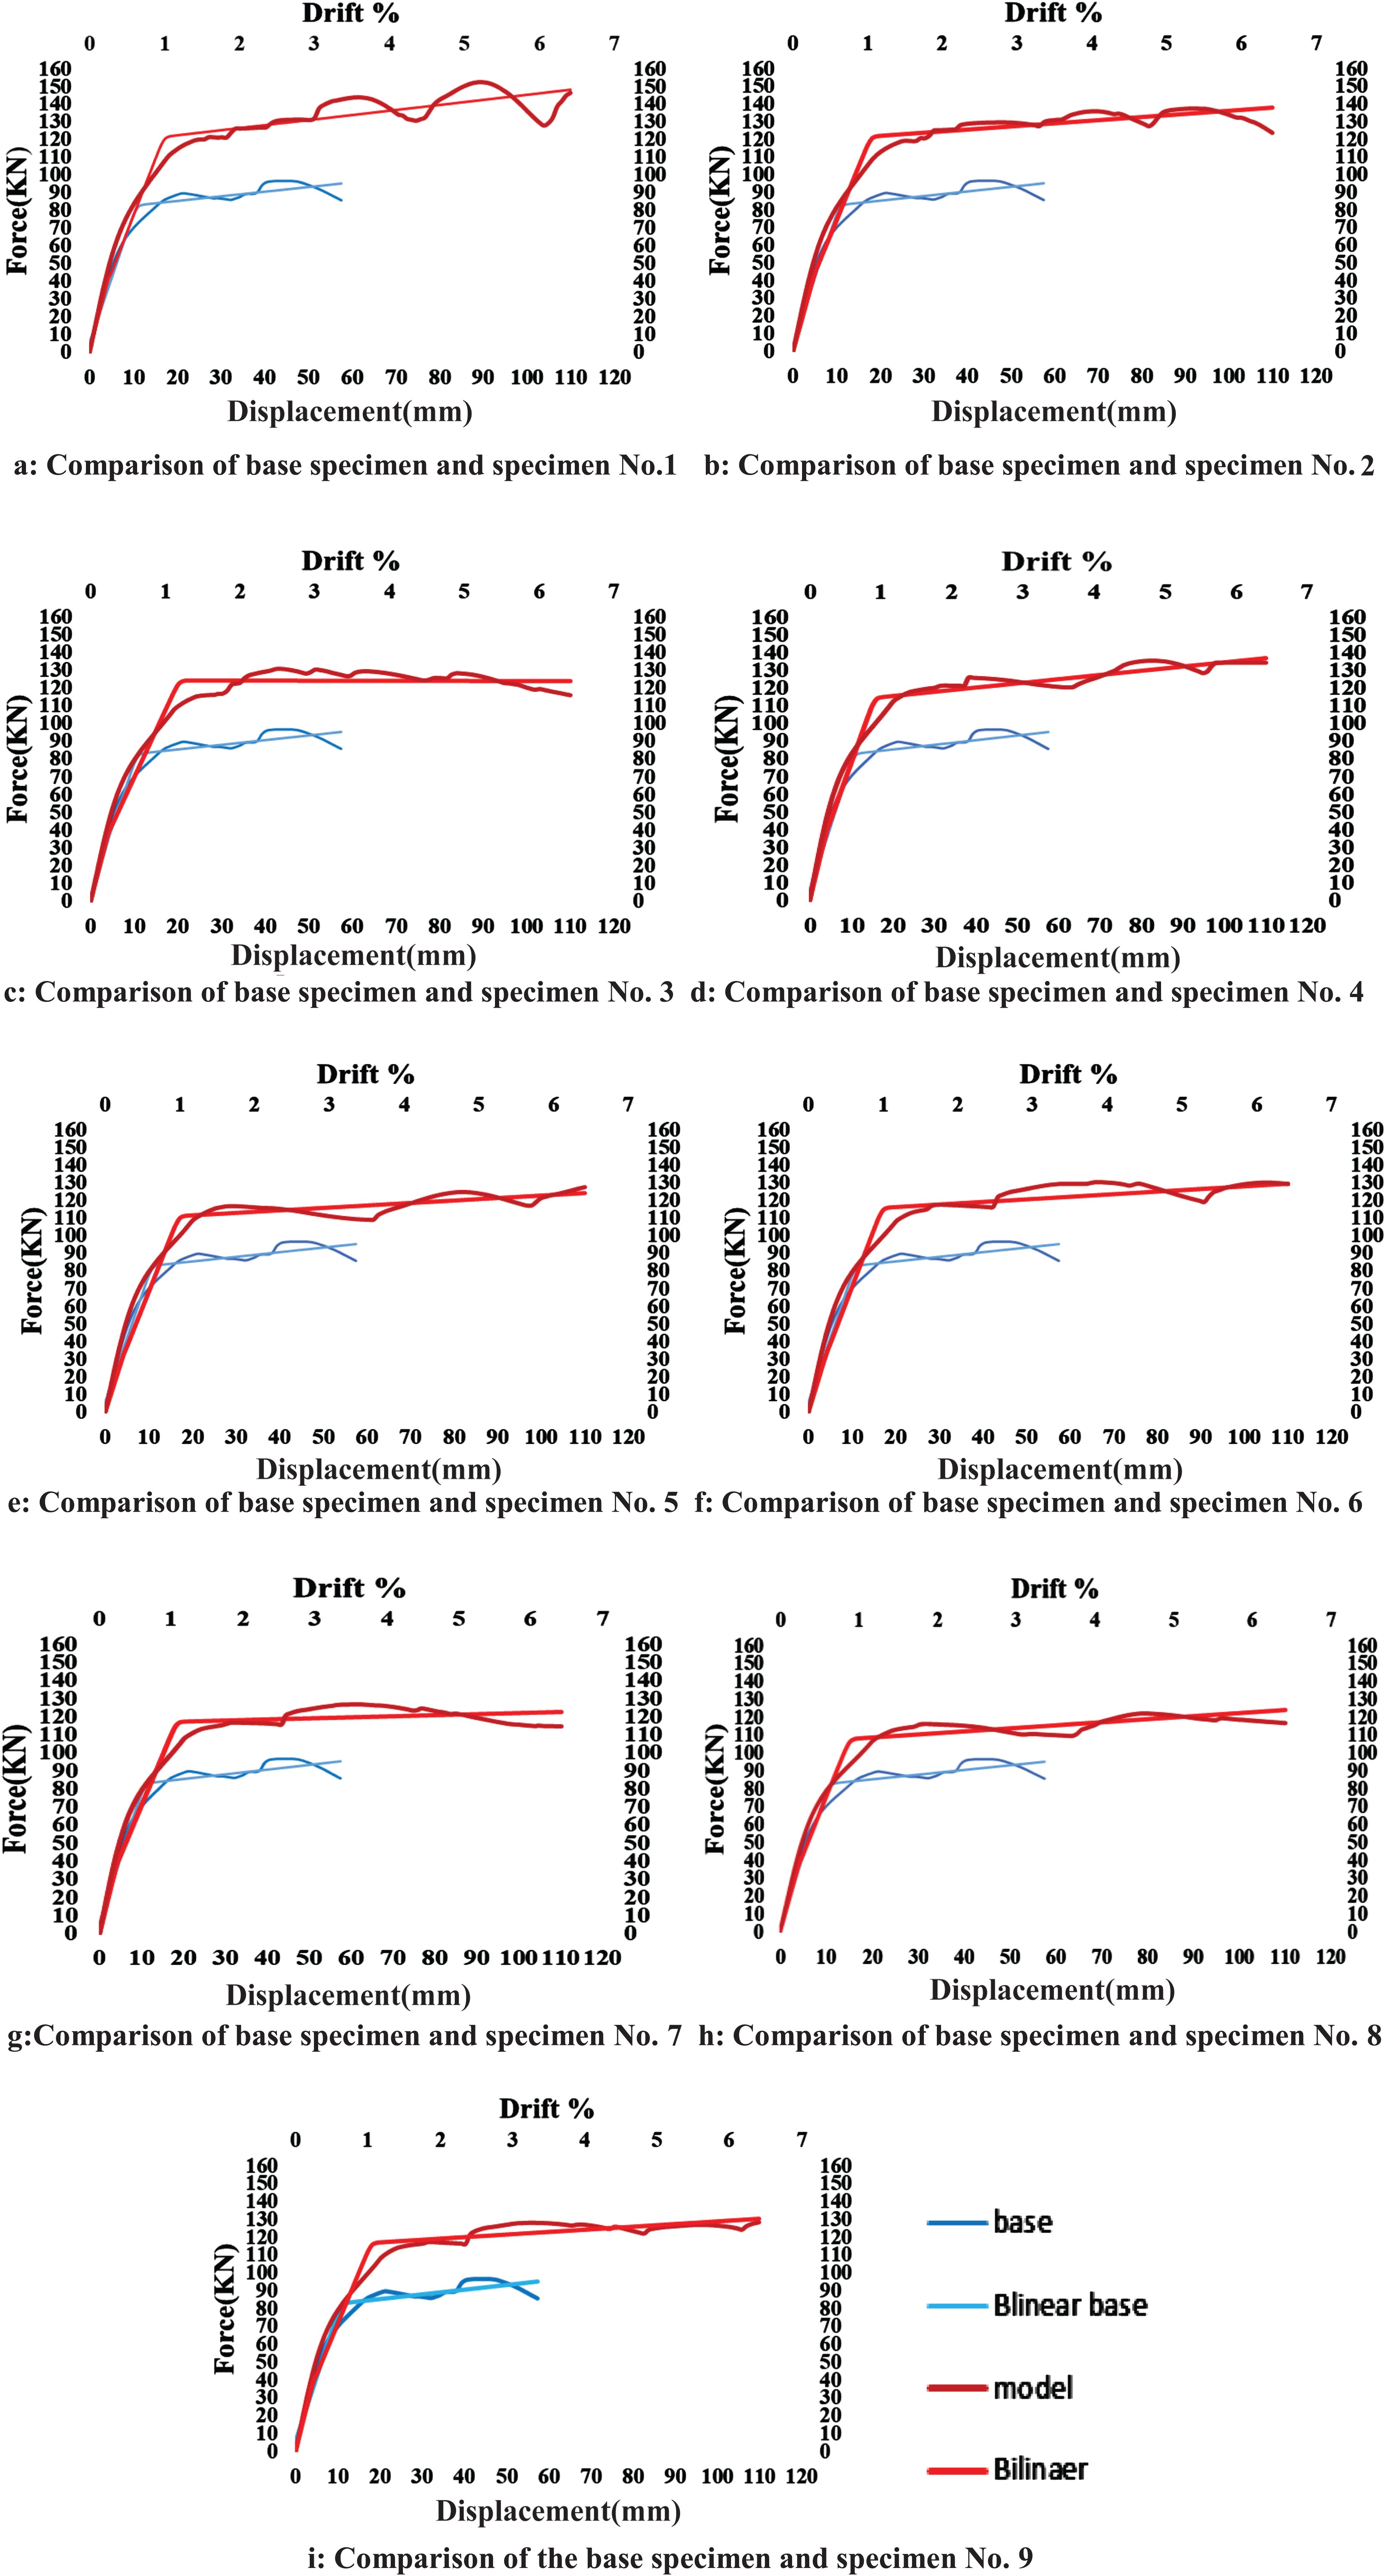
Comparison of Force-displacement and bilinear curves for retrofitted specimens and the base specimen.
The maximum load carrying capacity and the strength increase percentage for the retrofitted specimens and the base specimen
Among the various FRP strip arrangements, the full-coverage arrangement has the highest increase in the studied models’ strength and energy dissipation capacity. Among the models with strip arrangement, model No. 4 with a combination of X-shape and three horizontal strips has the closest strength and energy dissipation compared to this model. This model increased the base model strength by 40%. Strength and energy dissipation are reduced in model No. 5 when orthogonal sheets are used on the sides without X-shaped strips. This model improves the strength of the base model by 37%. However, with the full coverage of the connection, the joint strength increases by 48.9% compared to the base model. This indicates the strip model’s desirable performance compared to the full coverage due to the savings made in the use of materials, reduction in removing covering and cladding materials, and surface preparation. After this model, model 9 with two orthogonal strips has the best performance. The lowest strength increases, and energy dissipation is observed in model 8, the model in which the retrofit is taken only with the diagonal strips in the connection area. This model increased the base model strength by 26%.
Ductility is the ability of a load resisting system to endure large inelastic displacement with only an acceptable reduction in its load capacity. By idealization of the structure’s general performance curve to the equivalent bilinear curves as elastic and perfect plastic, the structure’s general ductility ratio (μ#x03BC;#x03BC;) can be calculated using Equation (7) by dividing the maximum relative lateral displacement (du) to the relative yield lateral displacement (dy) [36, 42]. In specimens under consideration, relative lateral displacement is equal to deflection of beam end.
The ultimate point can be considered the displacement related to a load level that is a fraction of the peak load (Fp). As mentioned in the literature, this ratio has a value between 10% to 20% [39]. In Fig. 10, an equivalent ideal bilinear diagram is drawn for evaluation of the ductility ratio. Both the force-displacement and force-drift graphs are used for the specimens, and the corresponding values are reported in Table 2. In Table 2, represent the deformations or displacements measured in millimeters (mm) for the force-displacement graph, and the drift angles or displacements resulting from drift measured in millimeters (mm) for the force-drift graph. The values enclosed in brackets indicate uncertainties or variations in the measurements. In Table 2, the values of the general ductility ratio (μ#x03BC;) of connections, the maximum relative displacement (du), and the relative yield displacement (dy) of all the specimens obtained from the equivalent bilinear curves are shown, respectively. In the majority of the retrofitted systems, the connection reached the limit drift of 6%. Among the retrofitted connections, the highest ductility ratio in this drift limit is related to specimen 6; however, this specimen entered the strength reduction region, but models 5, 6, and 8, with the retrofit arrangement of the X-shape strip and horizontal strip, X-shape and orthogonal strips, respectively have the most desirable degree of ductility. At the drift of 6%, they have not significantly lost their strength.
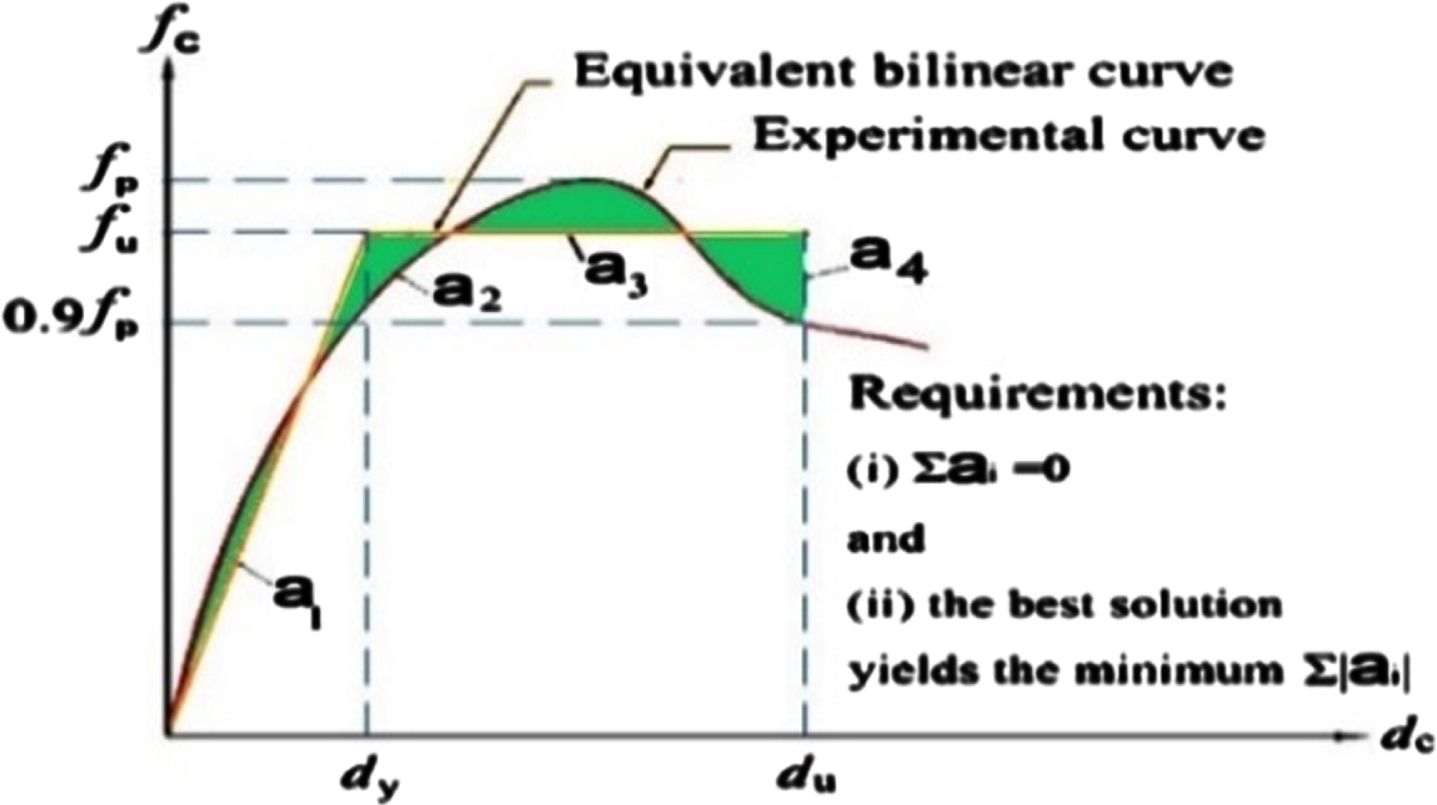
Equivalent bilinear curve definition for ductility ratio evaluation [4].
Ductility ratio and related factors in retrofitted and base specimens
The maximum PE strain criterion is an appropriate parameter in estimating the damage in concrete, which is a suitable criterion for investigating the amount of tensile and compression failures along with their development [4]. Tensile Damage Parameters (DAMAGET), compression damage (DAMAGEC), and stiffness Determination (SDEG) are other parameters that can be used to assess damages. These parameters are also helpful for evaluating the amount of concrete damage, but PE is of great importance in many cases and is extensively used [4].
In the base specimen, the maximum plastic strain value is about 8.9%, which indicates extensive tensile damage in concrete since most of the cracks are formed at the joint, with the highest cracks in this area as anticipated. As it can be observed in Figs. 11 and 12, the FRP laminates and strips can significantly improve the shear capacity of the system and transfer the cracks out of the connection region. However, the maximum amount of plastic strain for specimen No. 1 is due to overlapping with FRP, at about 24.64%, which is a considerable amount, indicating that by increasing the concentration of stress due to the complete overlapping of the FRP, much tensile damage is concentrated in the concrete column. Specimen No. 3 also has a maximum principal plastic strain of 8.6%, but due to the lack of cover in the connection of the beam and the alignment of the created cracks, it is possible to create a plastic hinge [43] on the connection face. In specimen No. 9, as expected, by decreasing the overlapping of the FRP, the maximum principal plastic strain is reduced to about 12.84%, and there has been significant improvement in the shear capacity of the specimen. As expected, specimens 1 and 2 exhibit the highest strength increase due to the overlap, but by a concentration of the plastic strain in the column, damage in this critical section is increased, and specimen No. 3 has the least strength increase due to the least overlapping, and its maximum plastic strain is decreased as well. Specimen 9 has relatively better performance among the strip-retrofitted specimens. In this specimen, while increasing the strength is desirable, the ductility ratio is also relatively adequate. Plastic strains have also been reduced in this specimen and transferred to the concrete beam. Thus, by removing the plastic hinge from the joint to the beam, the specimen is more suitable among the specimens with strip retrofit.
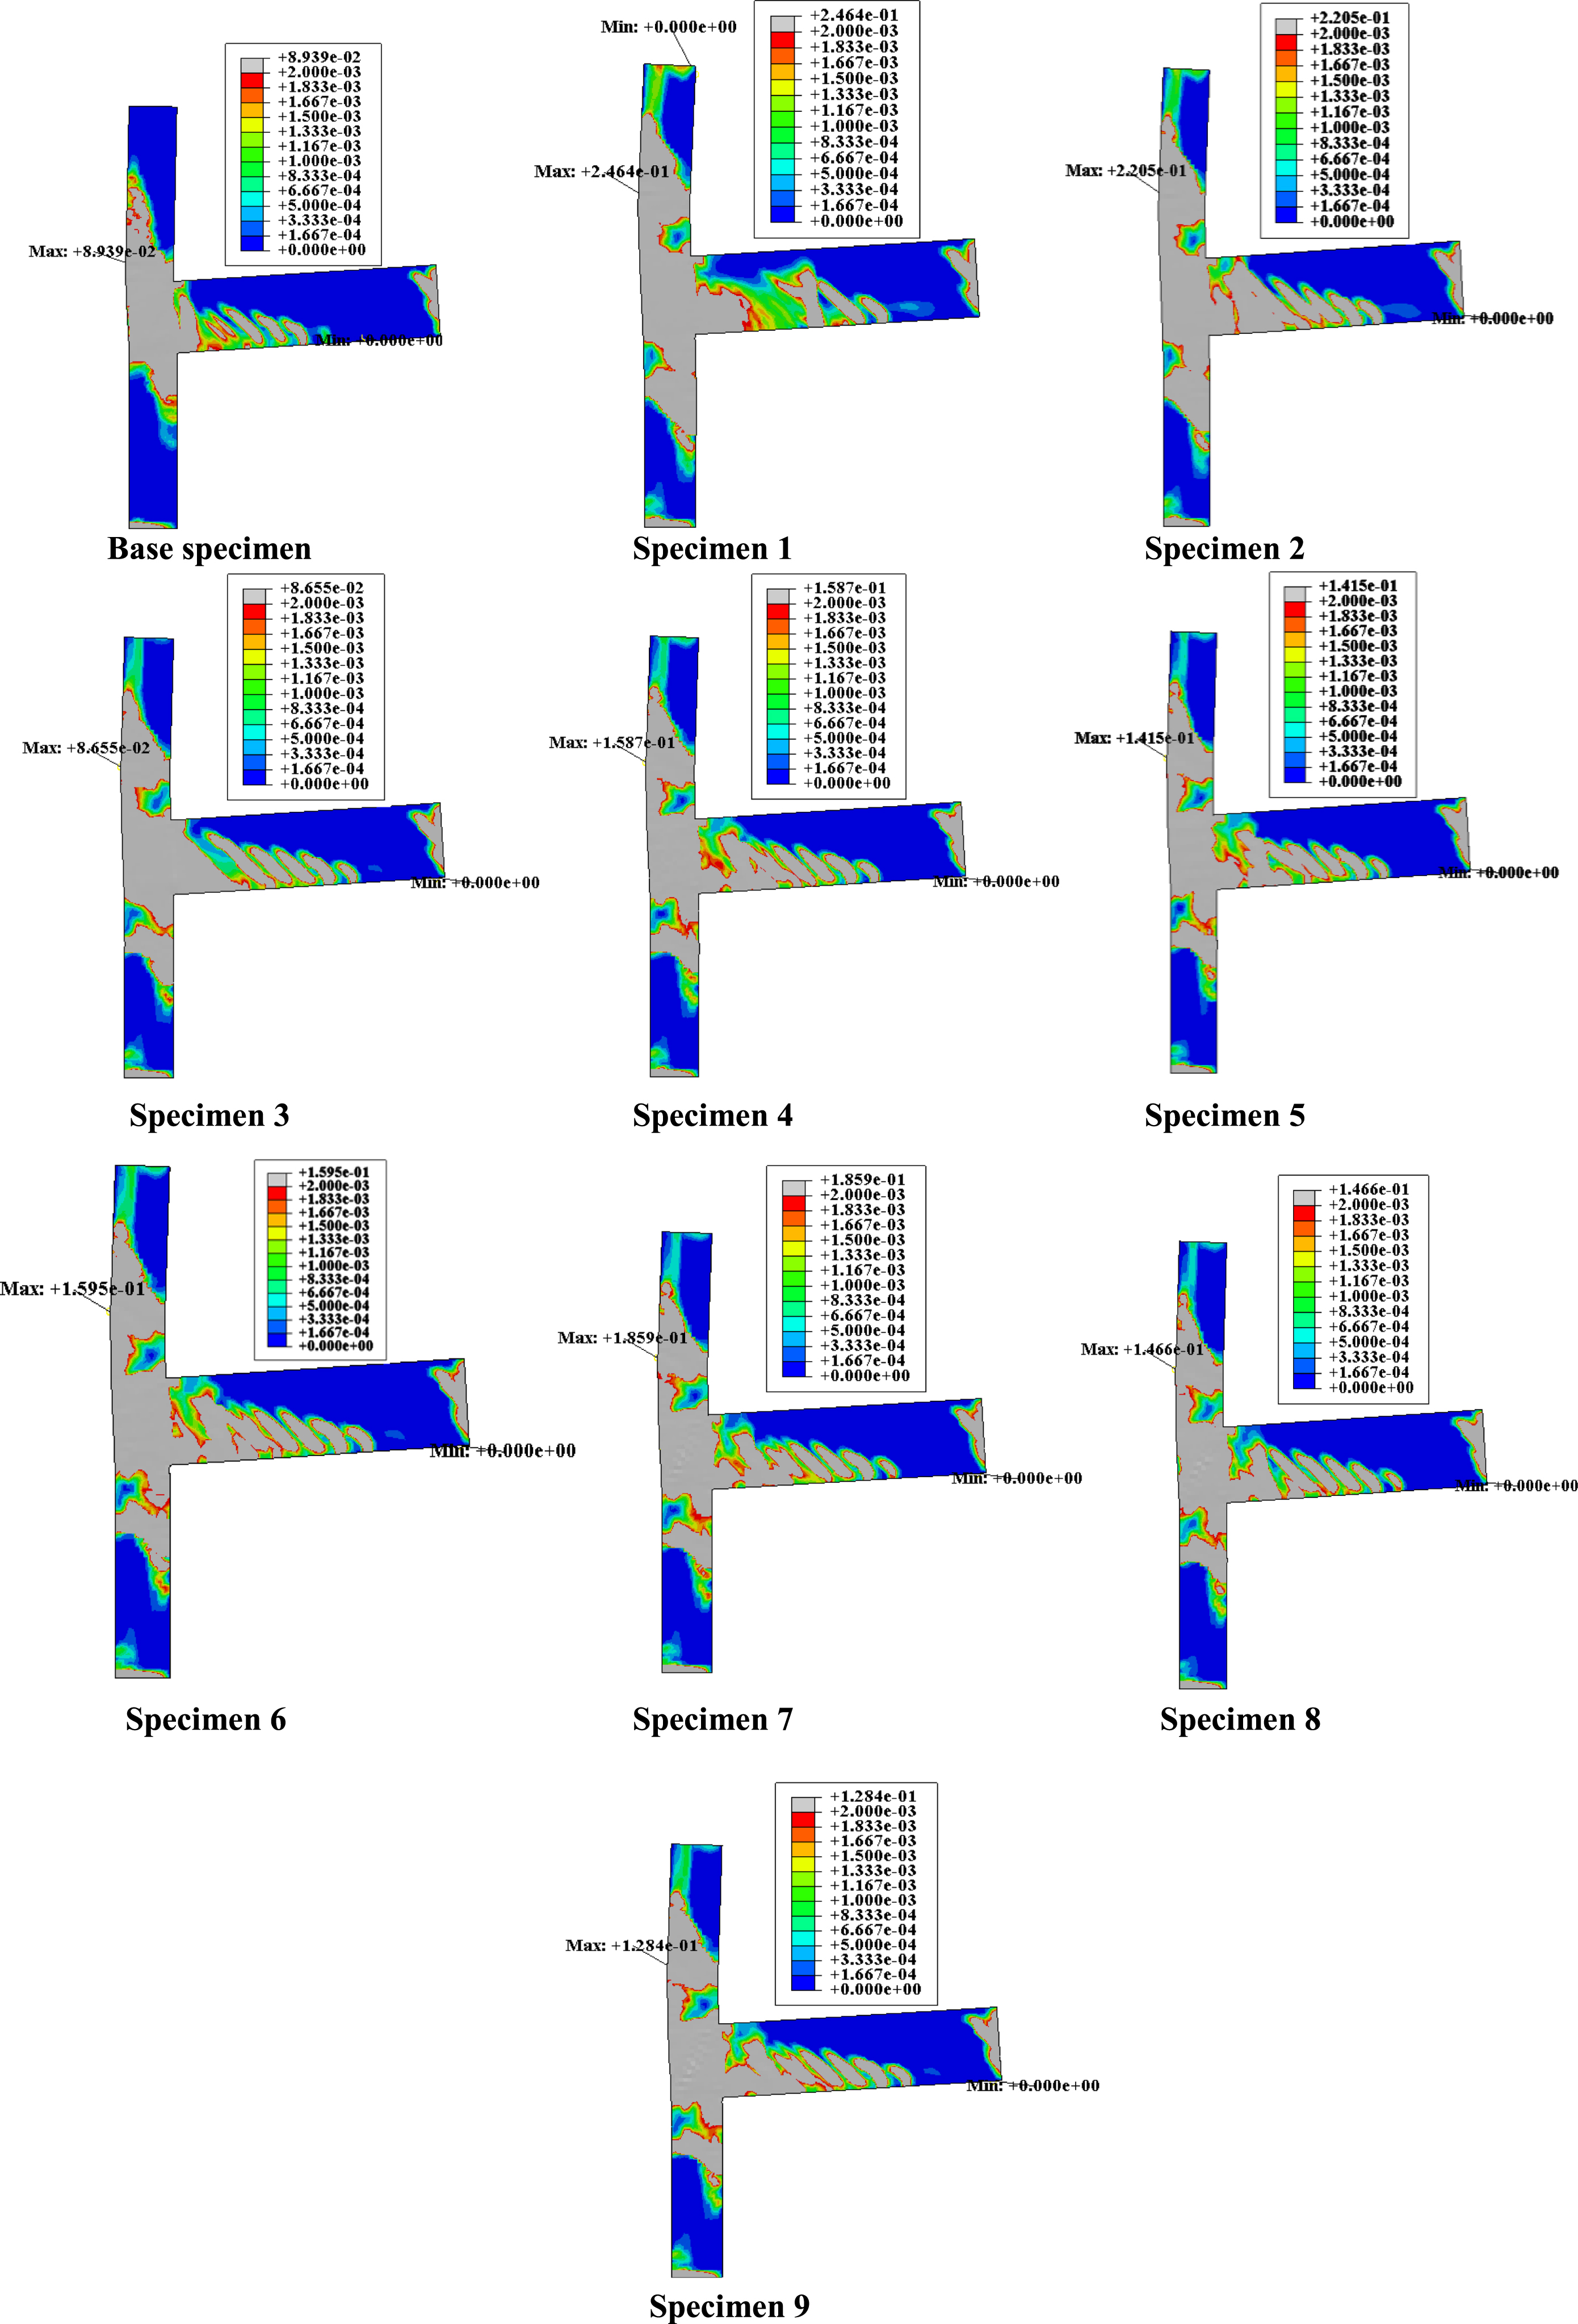
Maximum principal plastic strain in the base and proposed specimens.
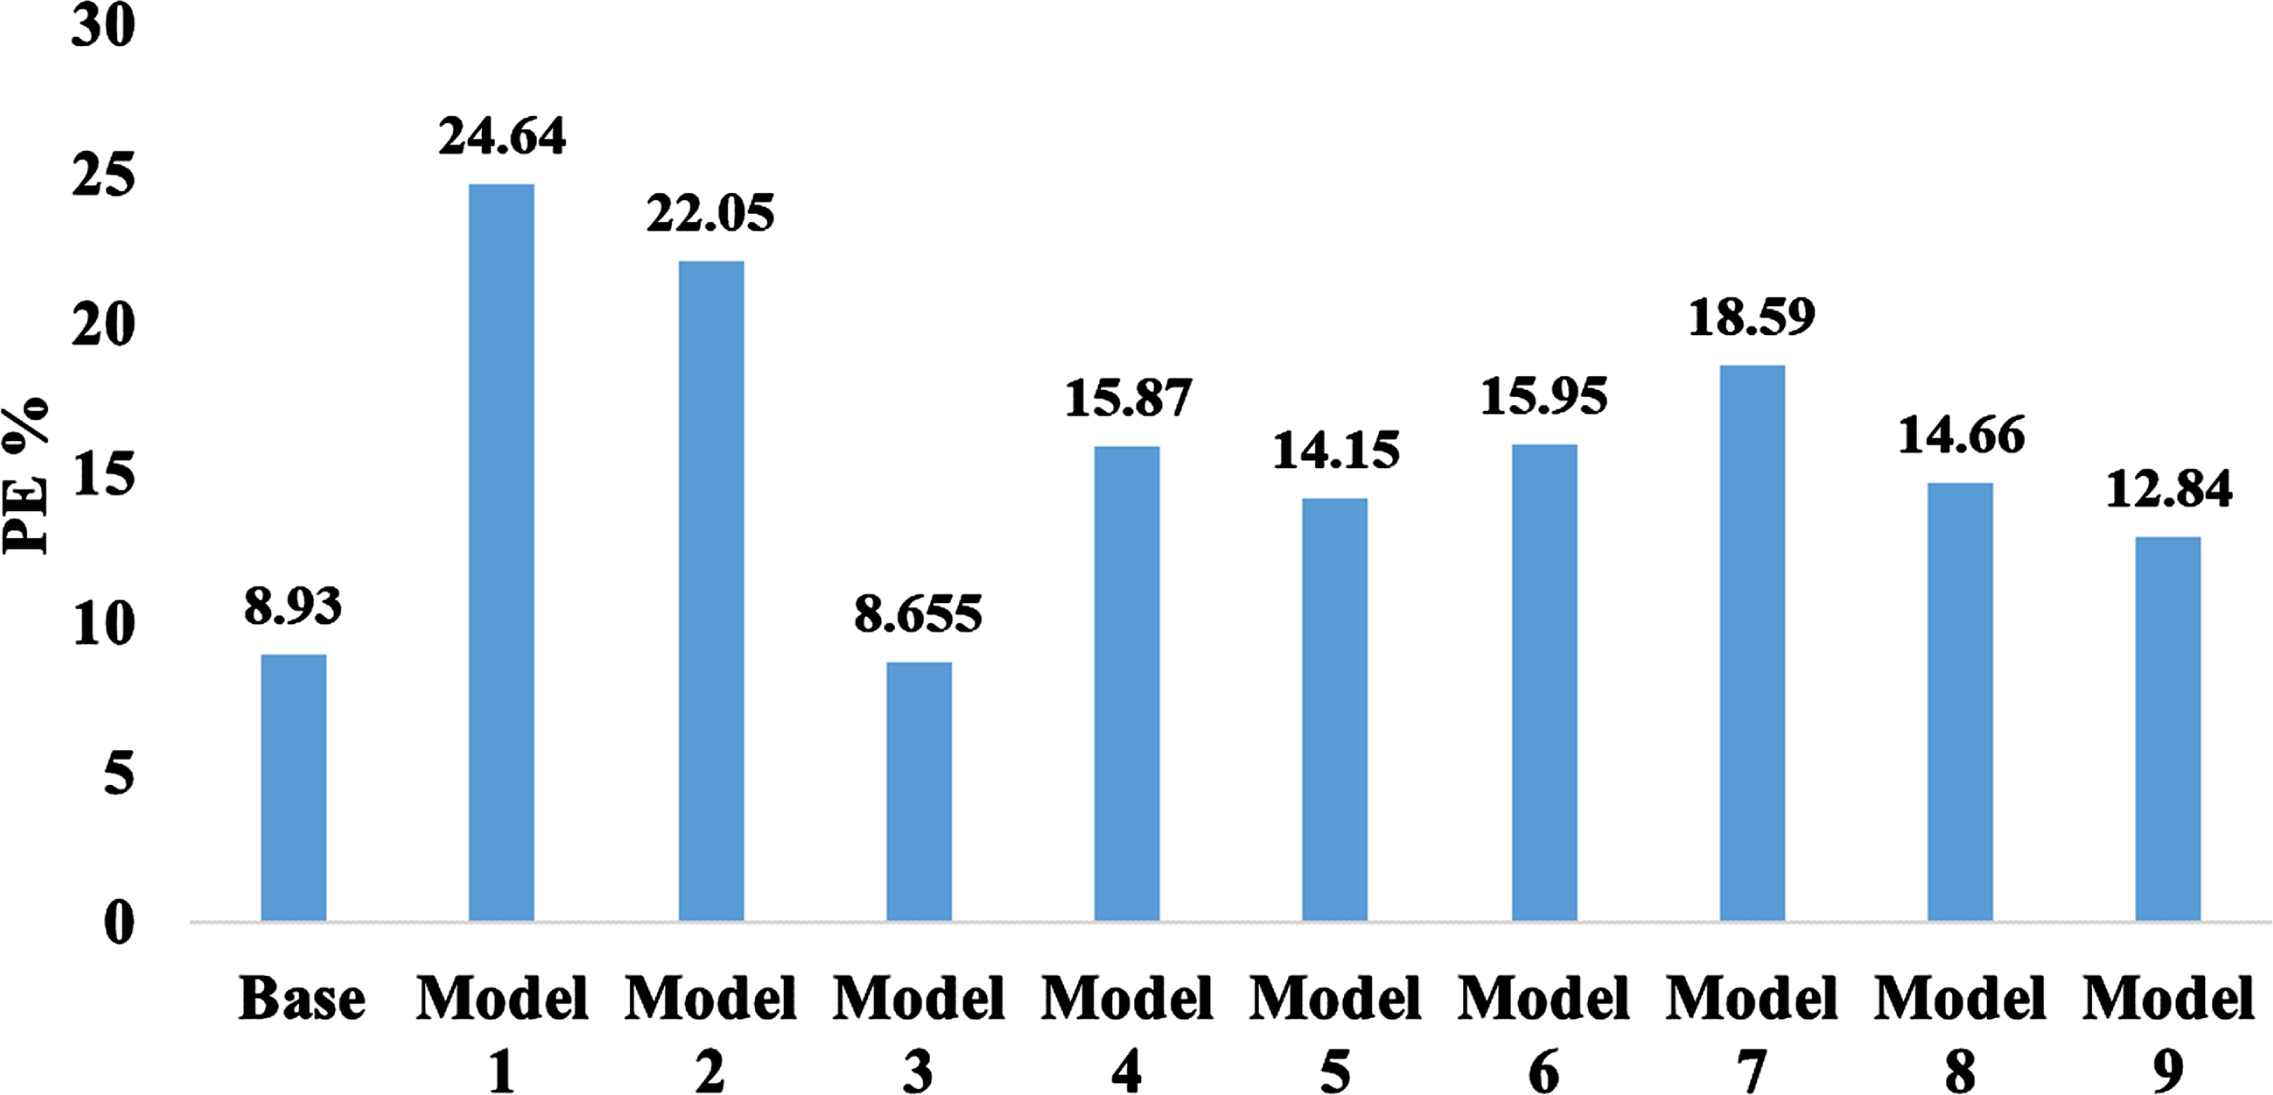
Maximum principal plastic strain of the specimen under consideration.
The difficulty of using the FRP system includes two important parts:
Figures 13 and 14 show the amount of FRP material used and the required area for FRP preparation. As can be seen in Fig. 13, the amount of consumed FRP volume for specimen 1 with full coverage it is 0.01075 cubic meters. For specimens 4 to 9 with a strip retrofit pattern, it is between 0.00625 and 0.0075 cubic meters, which shows a decrease of 30.2% to 41.9% of the amount of consumed FRP compared to that in the specimen with full coverage. In most cases, the cost of surface preparation to paste FRP plates is higher than the price of the FRP sheet itself. As it is observed in Fig. 14, the required area to install the FRP in the specimens is as follows: For specimen 1 it is equal to 2.15 square meters, for specimen 2 it is equal to 1.5 square meters, for specimen 3 it is equal to 1.15 square meters, for specimen 4 it is equal to 1.35 square meters, for specimen 5 it is equal to 1.335 square meters, for specimen 6 it is equal to 1.34 square meters and, for specimen 7 it is equal to 1.3 square meters and, for specimen 8 it is equal to 1.15 square meters and for specimen 9 it is equal to 1.2 square meters, which represents an almost 50% reduction in the required area in strip retrofitted specimens compared to the full FRP covered specimen. The required preparation area in the strip models is approximately the same, and the maximum cost in these models will be required in models 4 and 9.
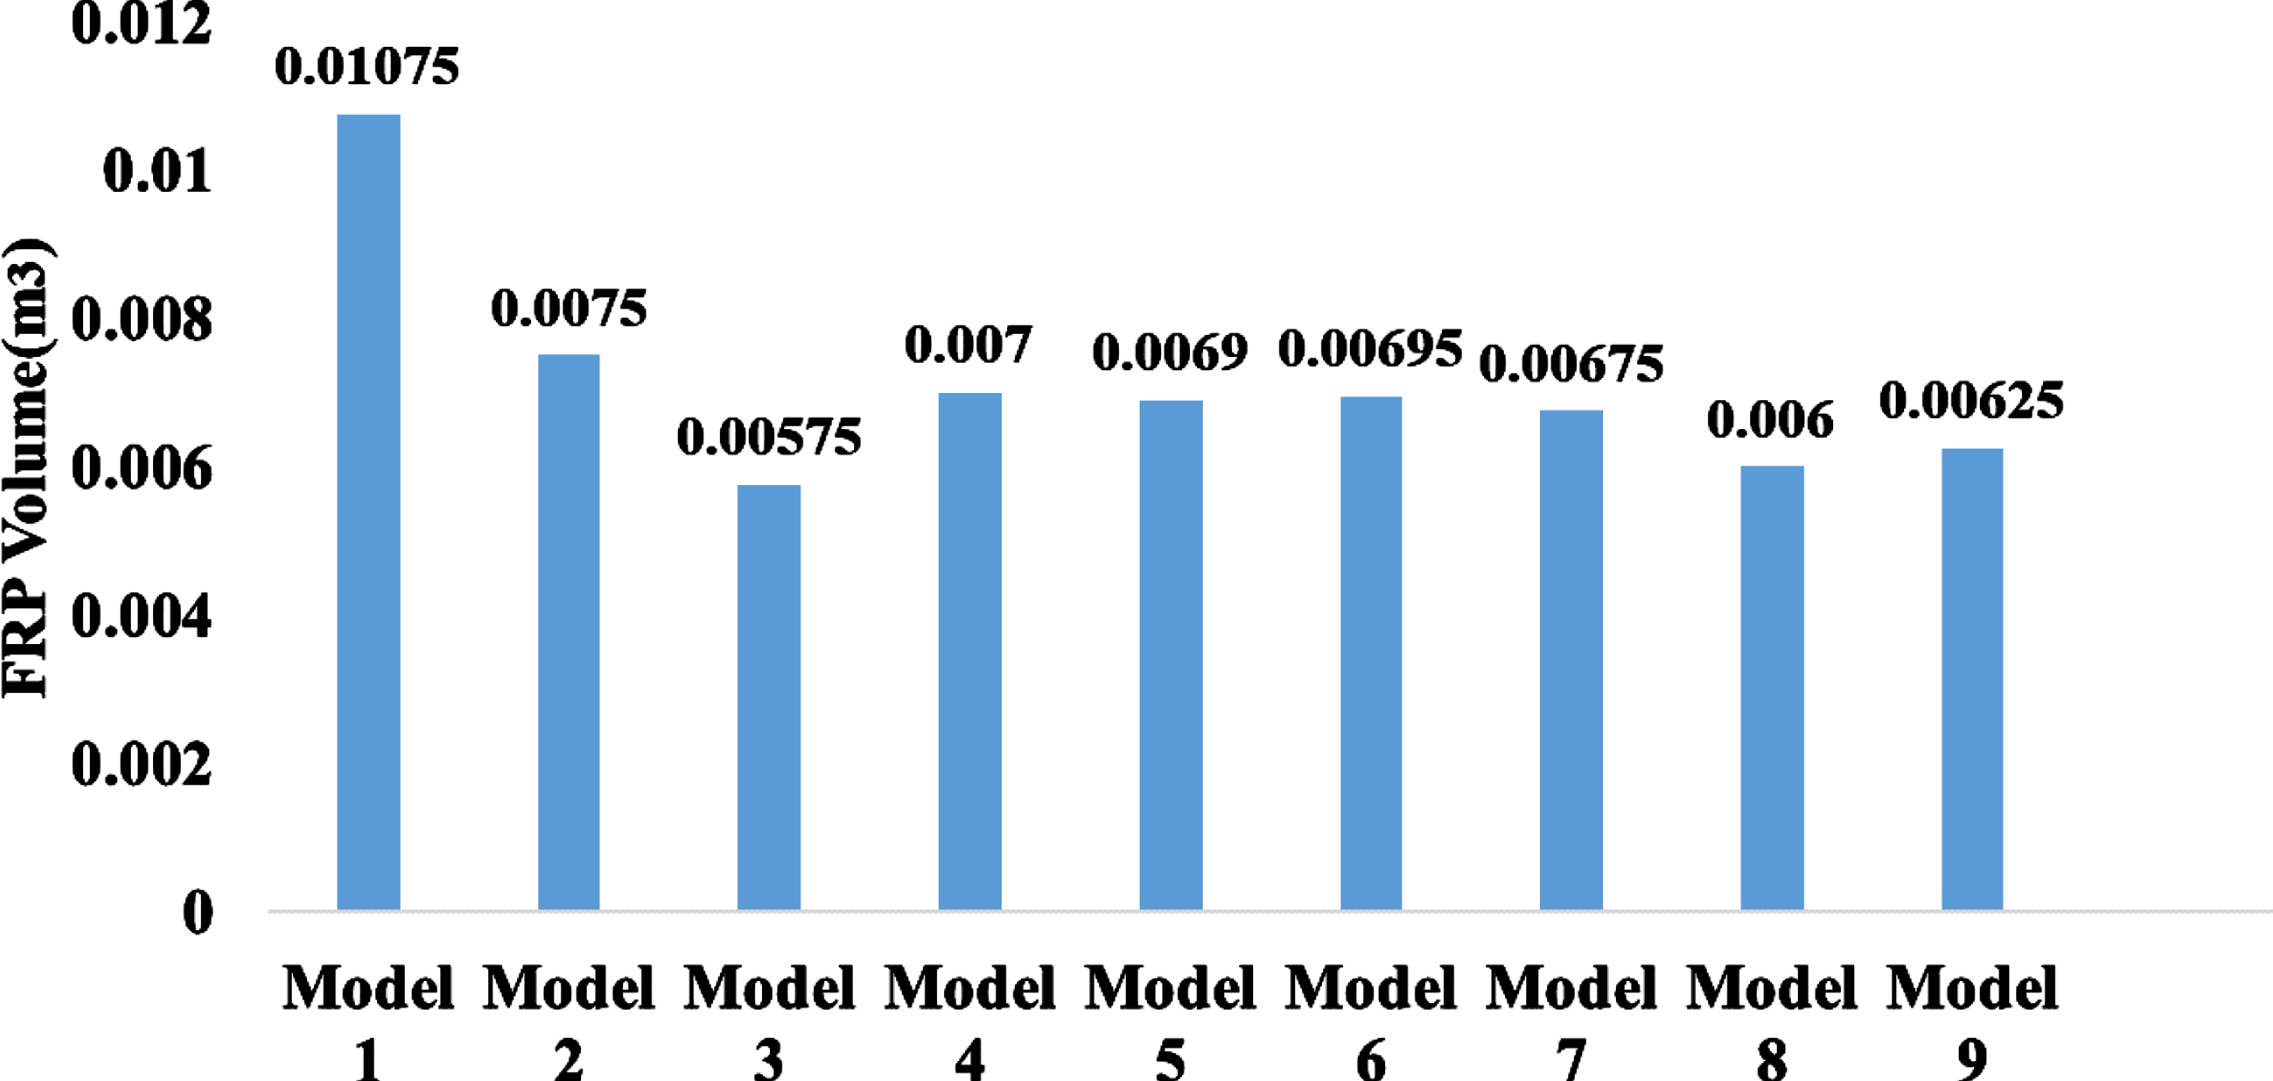
The volume of FRP material consumed for the specimens.
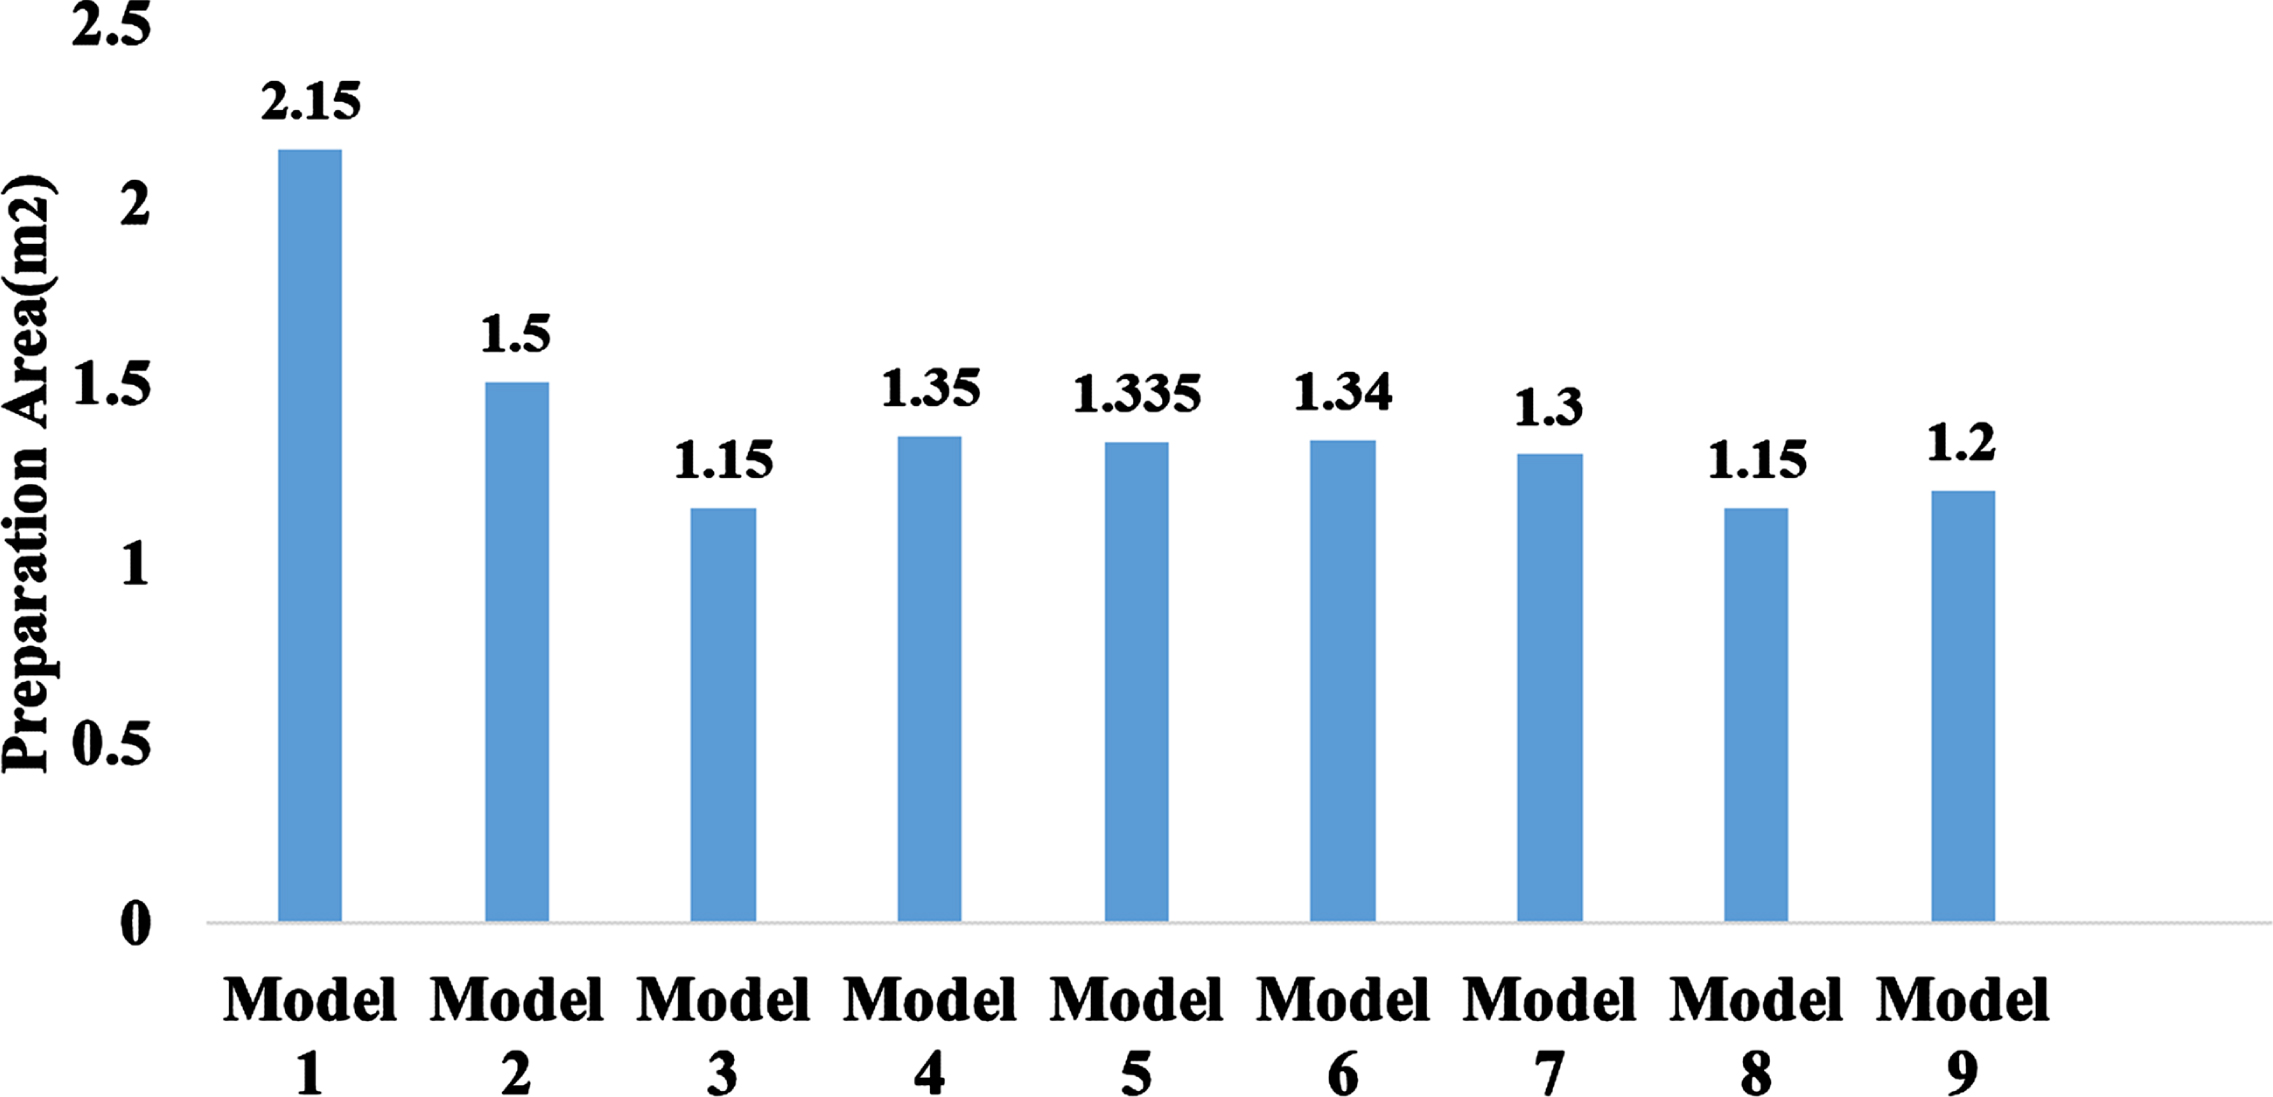
The required area of preparation and attachment of FRP for specimens.
In order to investigate the effect of the geometric factors of strips (the thickness and width) on the behavior of the joints in the retrofit scheme of model 9 with combined X-shape and orthogonal strip arrangements, the following set of specimens is prepared. These models are investigated to evaluate the changes in the retrofitting performance of reinforced concrete joints retrofitted by FRP strips by reducing the cost of rehabilitation.
To study the effect of strip geometry on the retrofitted joint behavior, specimen 9 is considered in three groups A, B, C with different widths of FRP sheets at the beam-column joint and is investigated in each group with 3 different thicknesses of FRP. Specifications of these specimens are considered as follows.
Group A: Includes 3 specimens with a width of 50 mm for FRP sheets at beam-column joint (for all of the three specimens) thickness of 0.5 mm FRP for specimen A-1 and 0.75 mm FRP thickness for specimen A-2 and FRP thickness of 1 mm is specified for specimen A-3.
Group B: Includes 3 specimens with a width of 75 mm for FRP sheets at the beam-column joint (for all 3 specimens) and a thickness of 0.5 mm FRP for specimen B-1 and 0.75 mm FRP for specimen B-2 and a thickness of 1 mm FRP is specified for specimen B-3.
Group C: Includes 3 specimens with a width of 100 mm for FRP sheets at the beam-column joint (for all 3 specimens) and a thickness of 0.5 mm FRP for specimen C-1, 0.75 mm FRP thickness for specimen C-2, and a thickness of 1 mm FRP is specified for specimen C-3.
The notable point about the area required to be prepared in this specimen scheme is that this area does not change much, and most of this area includes the FRP wrapping needed to anchor the strips (Fig. 15). In Fig. 16, the displacement-force diagrams of these models are shown. The effect of increasing the width in this region is greater than the increase in thickness, and in this case, the possibility of separating FRP strips from concrete is also reduced. Although the effect of an increase in width on the force-displacement curve of strip specimens is greater than the complete overlapping specimen, the influence of thickness on the connection maximum strength is significantly greater than that of the width effect and is observed to be increased up to 8% (Fig. 17). The ascending trend of the increase by thickness is linear in all widths of the strips. By increasing the thickness of the FRP sheets and maintaining the width of the FRP sheets in each group, with an increase of every 10 percent of the consumed FRP, a one percent increase in the maximum load-carrying capacity is observed the required bed area remains constant for each group. However, by increasing the width of the FRP sheets and maintaining the thickness of the FRP sheets in each group, a 0.5% increase in the maximum load-bearing capacity is observed with an increase of 10% of the consumed FRP in each group.
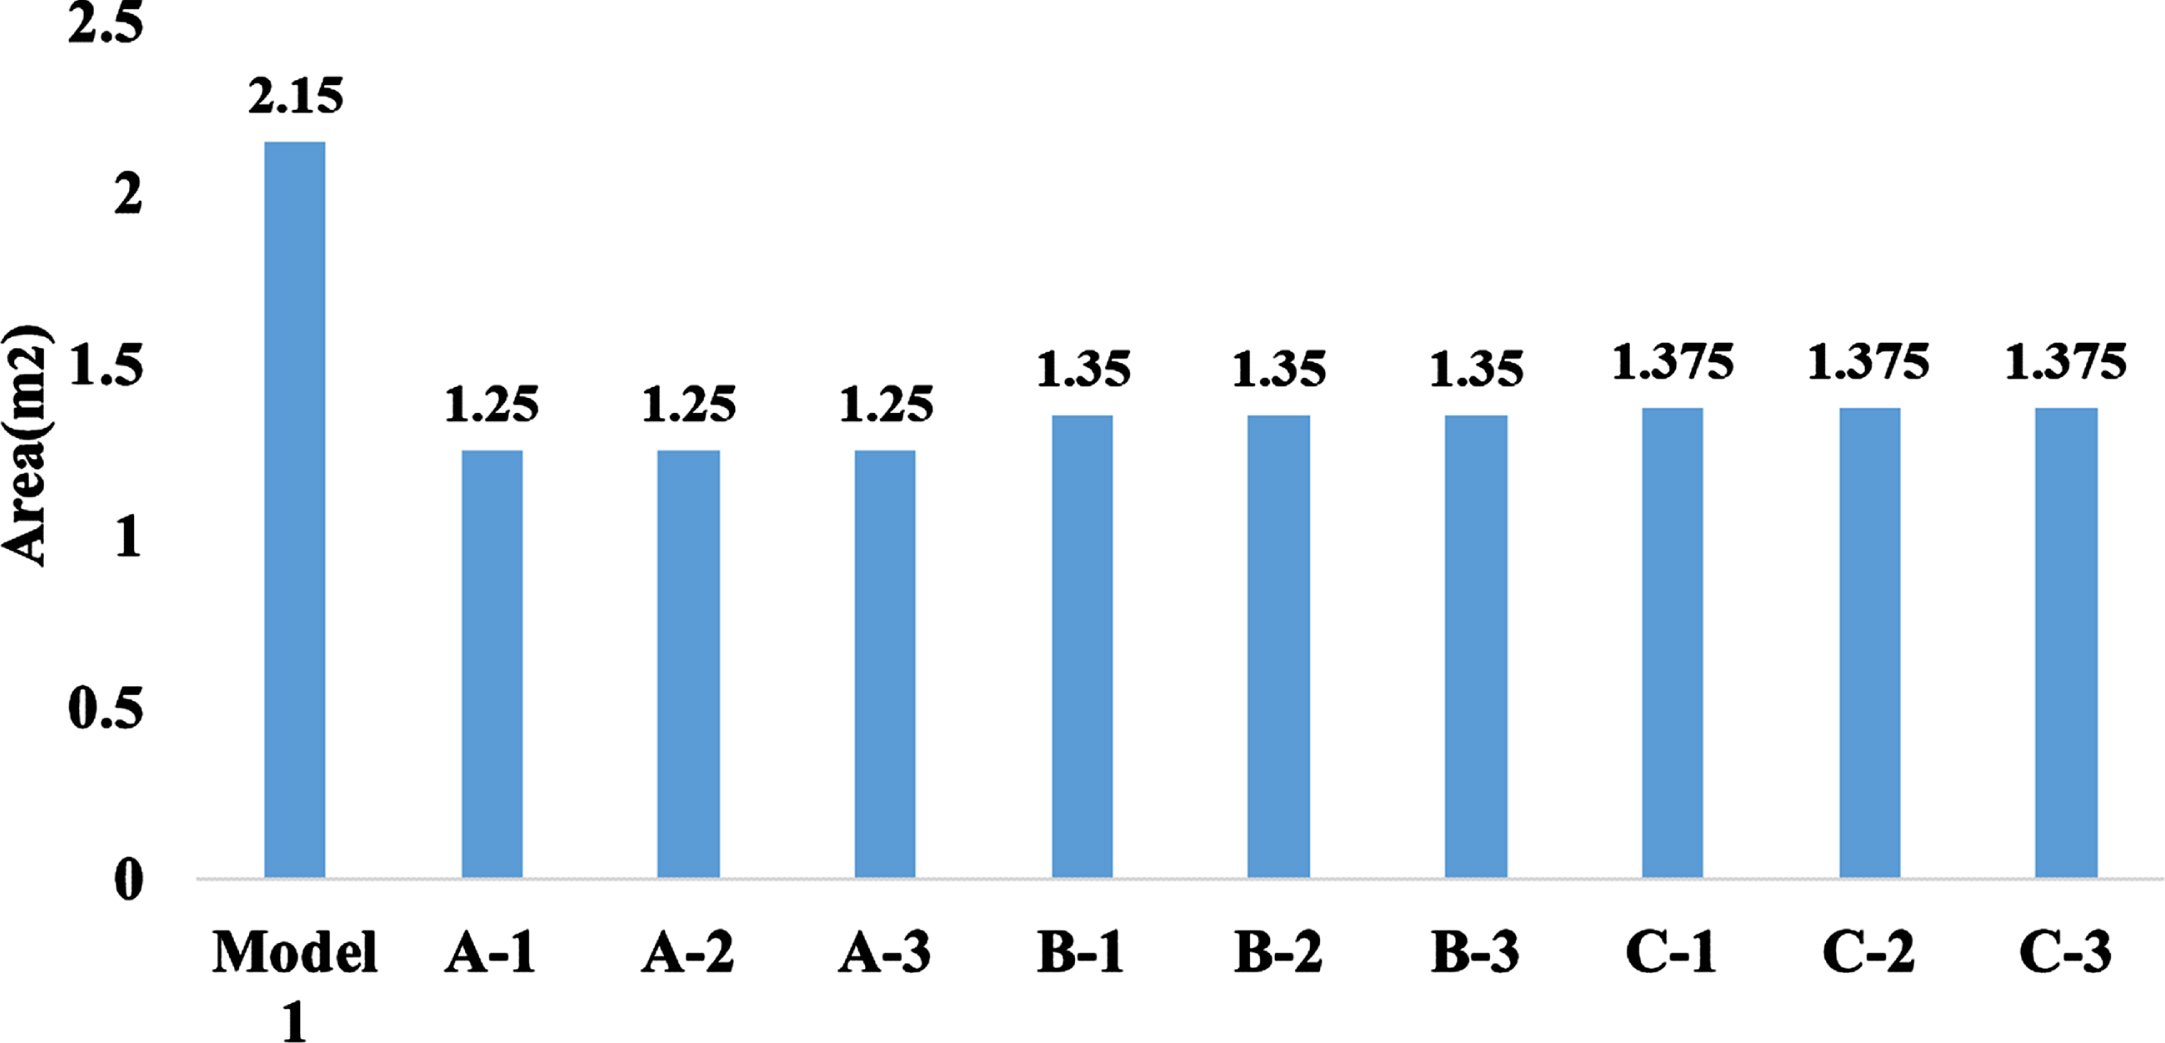
The required area for preparation and attachment of FRP for the specimens.
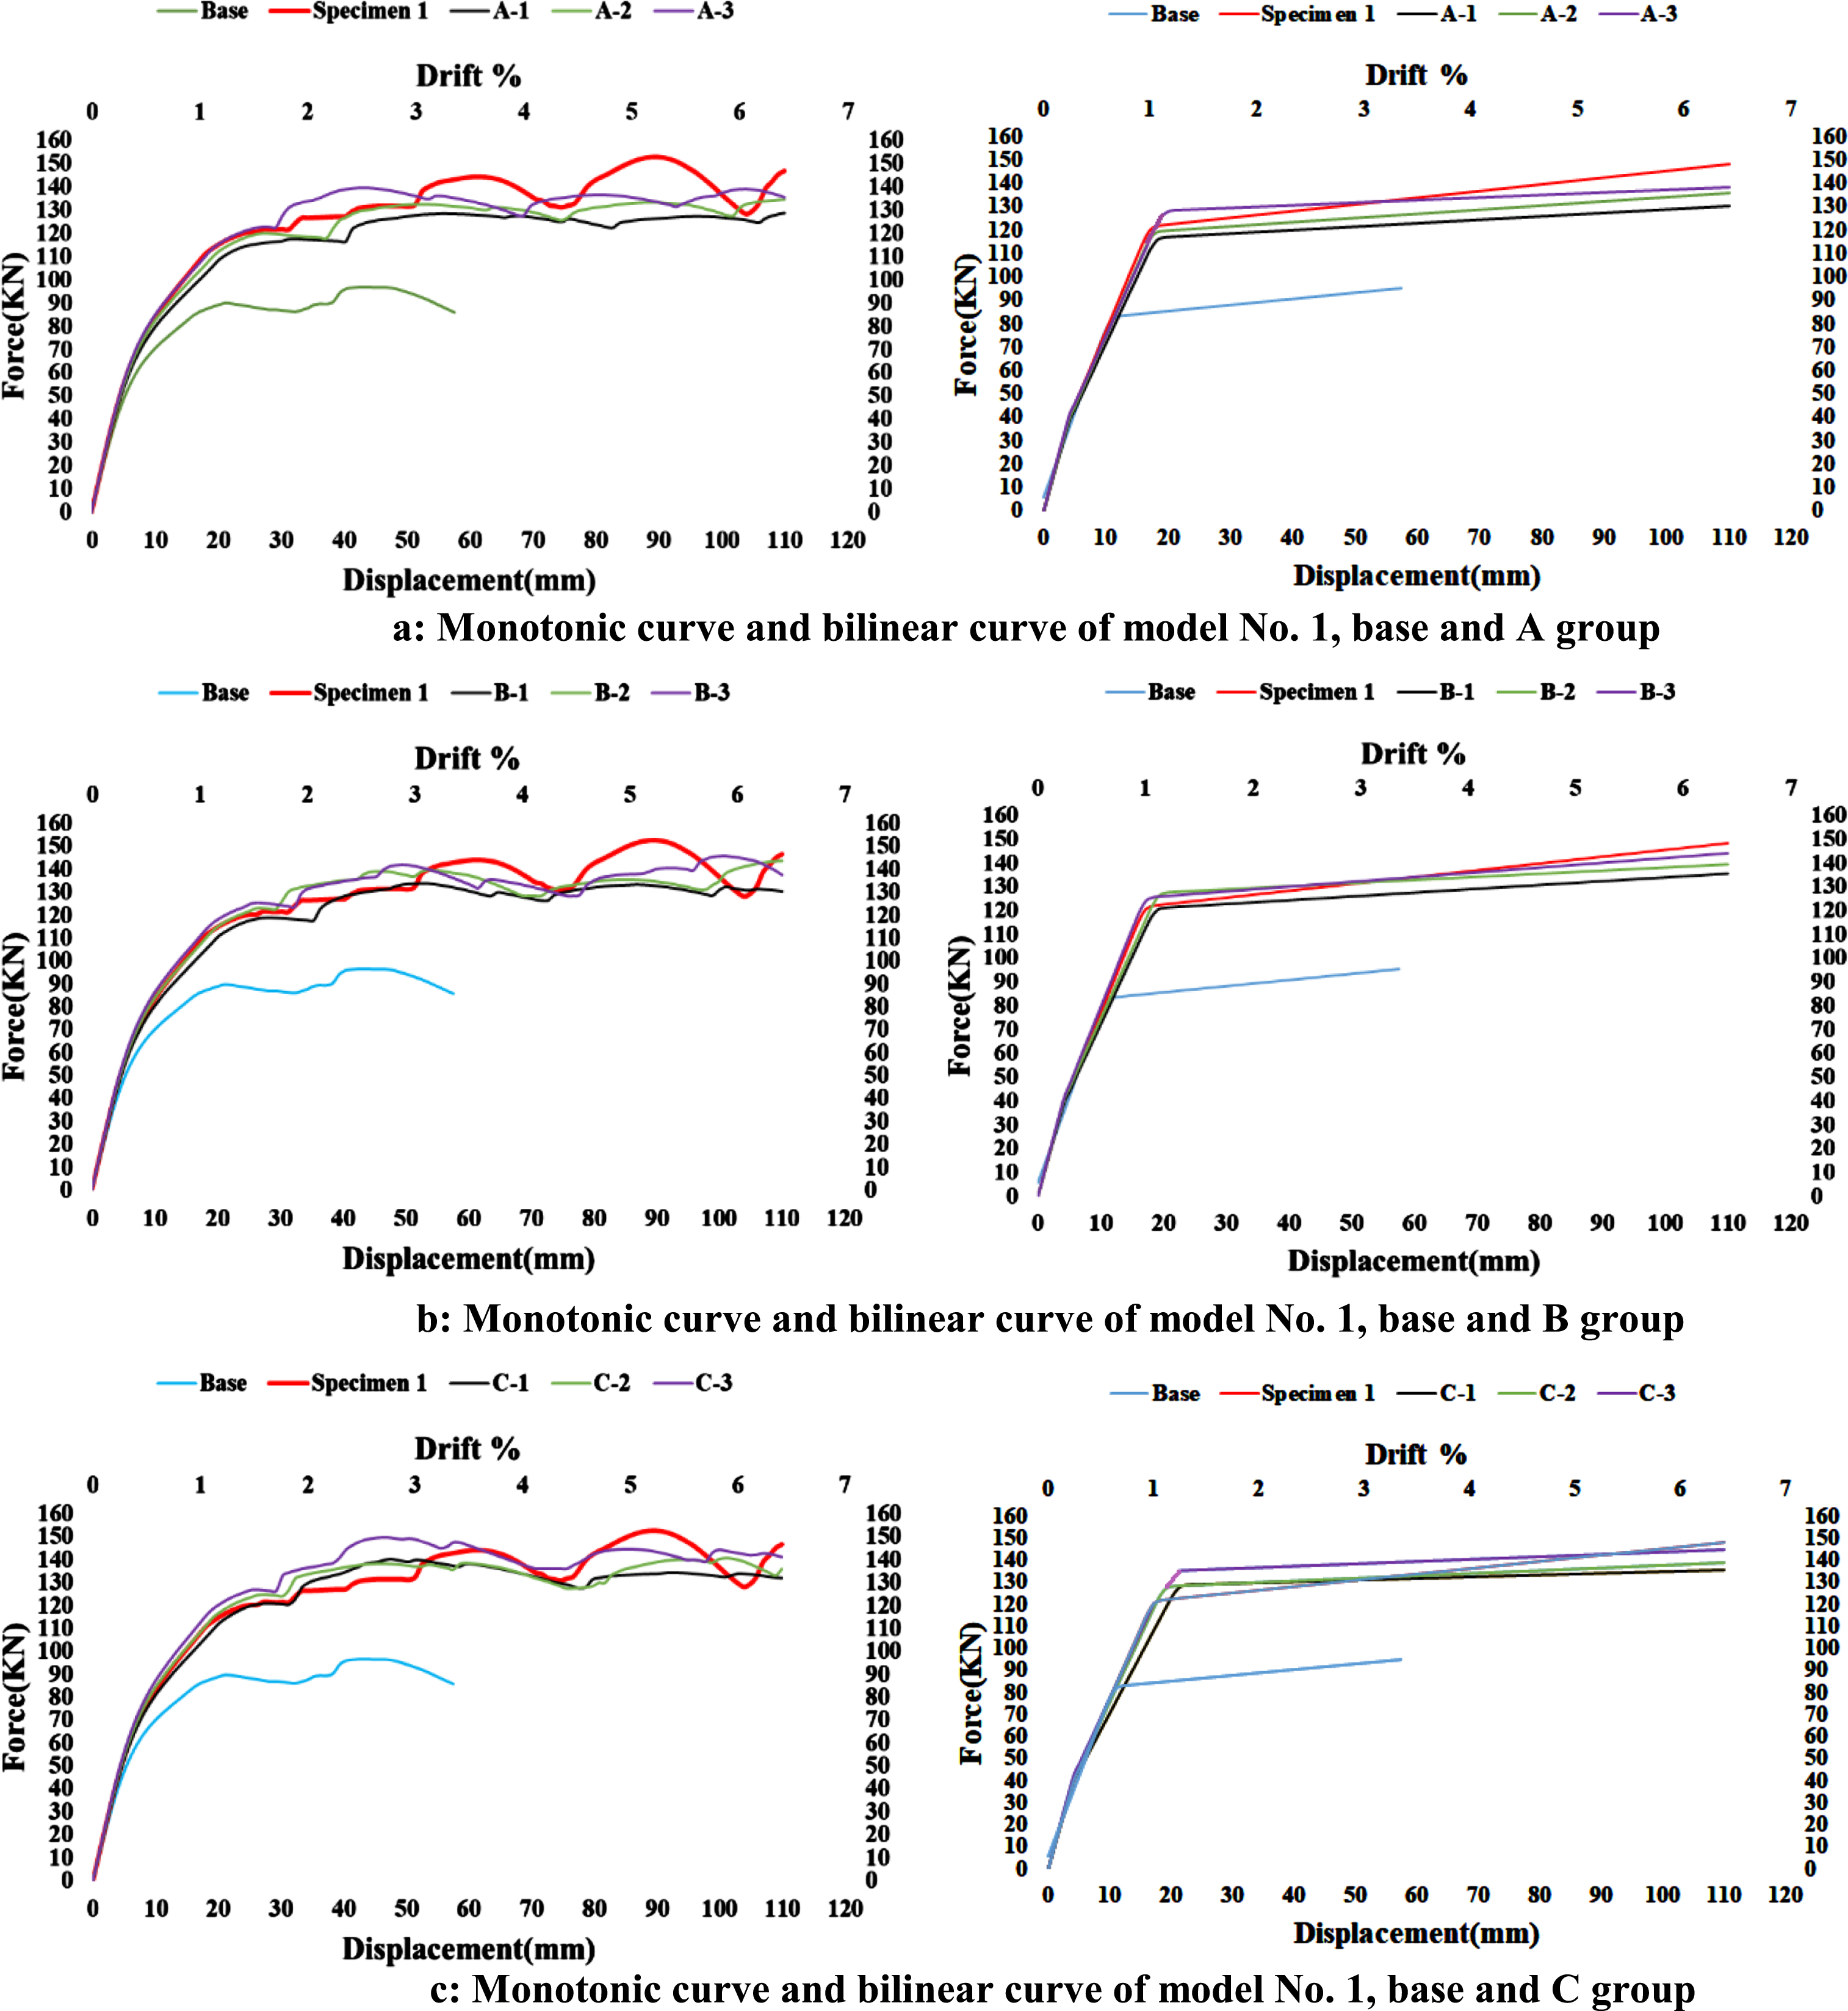
Comparison between force-displacement curve of the specimens with specimens A, B and C.
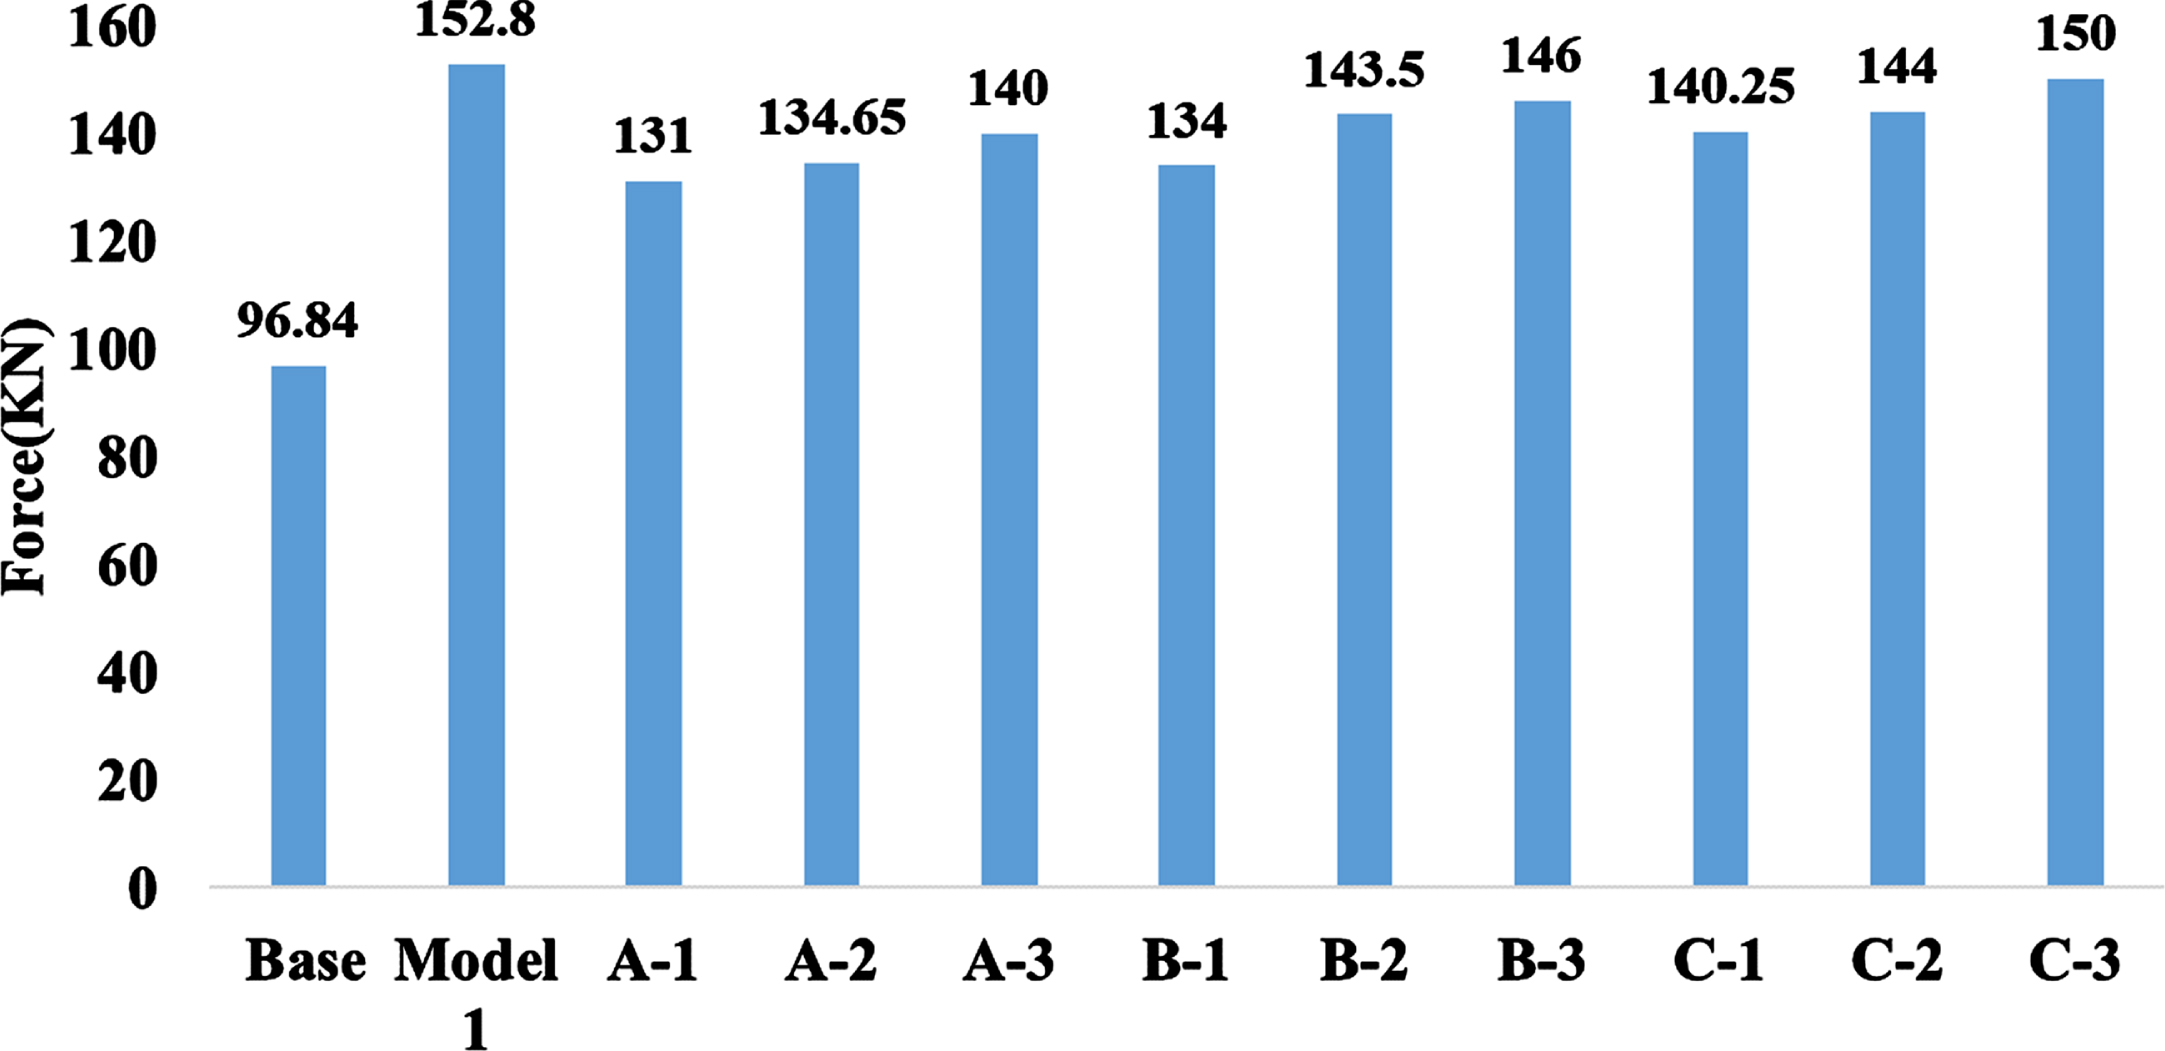
Maximum shear forces of the specimens and the base specimen.
It should be noted that increasing the thickness of the sheet increases the stress on the FRP connection to the concrete surface, which, if exceeding the surface concrete strength, leads to FRP separation. However, the anchoring of strips in the beam and column wrappings can efficiently protect the strip performance. The same trend is observed in the area beneath the force-deformation diagrams. With increasing the width and thickness of the specimens, this surface reaches that of the specimen with complete overlap (Fig. 18). The ductility ratio in specimens with a width of (group B) has reached the best conditions. However, with a greater increase in the specimens’ width in group C, this coefficient is reduced. In most cases, this factor increases with increasing sheet thickness (Fig. 18). The value of maximum plastic strain as a damage criterion shows that increasing the thickness of the layers has a negative effect on the amount of this parameter. High FRP thickness can cause a greater concentration of damage at specific points, especially in the critical members such as columns (Figs. 19 and 20).
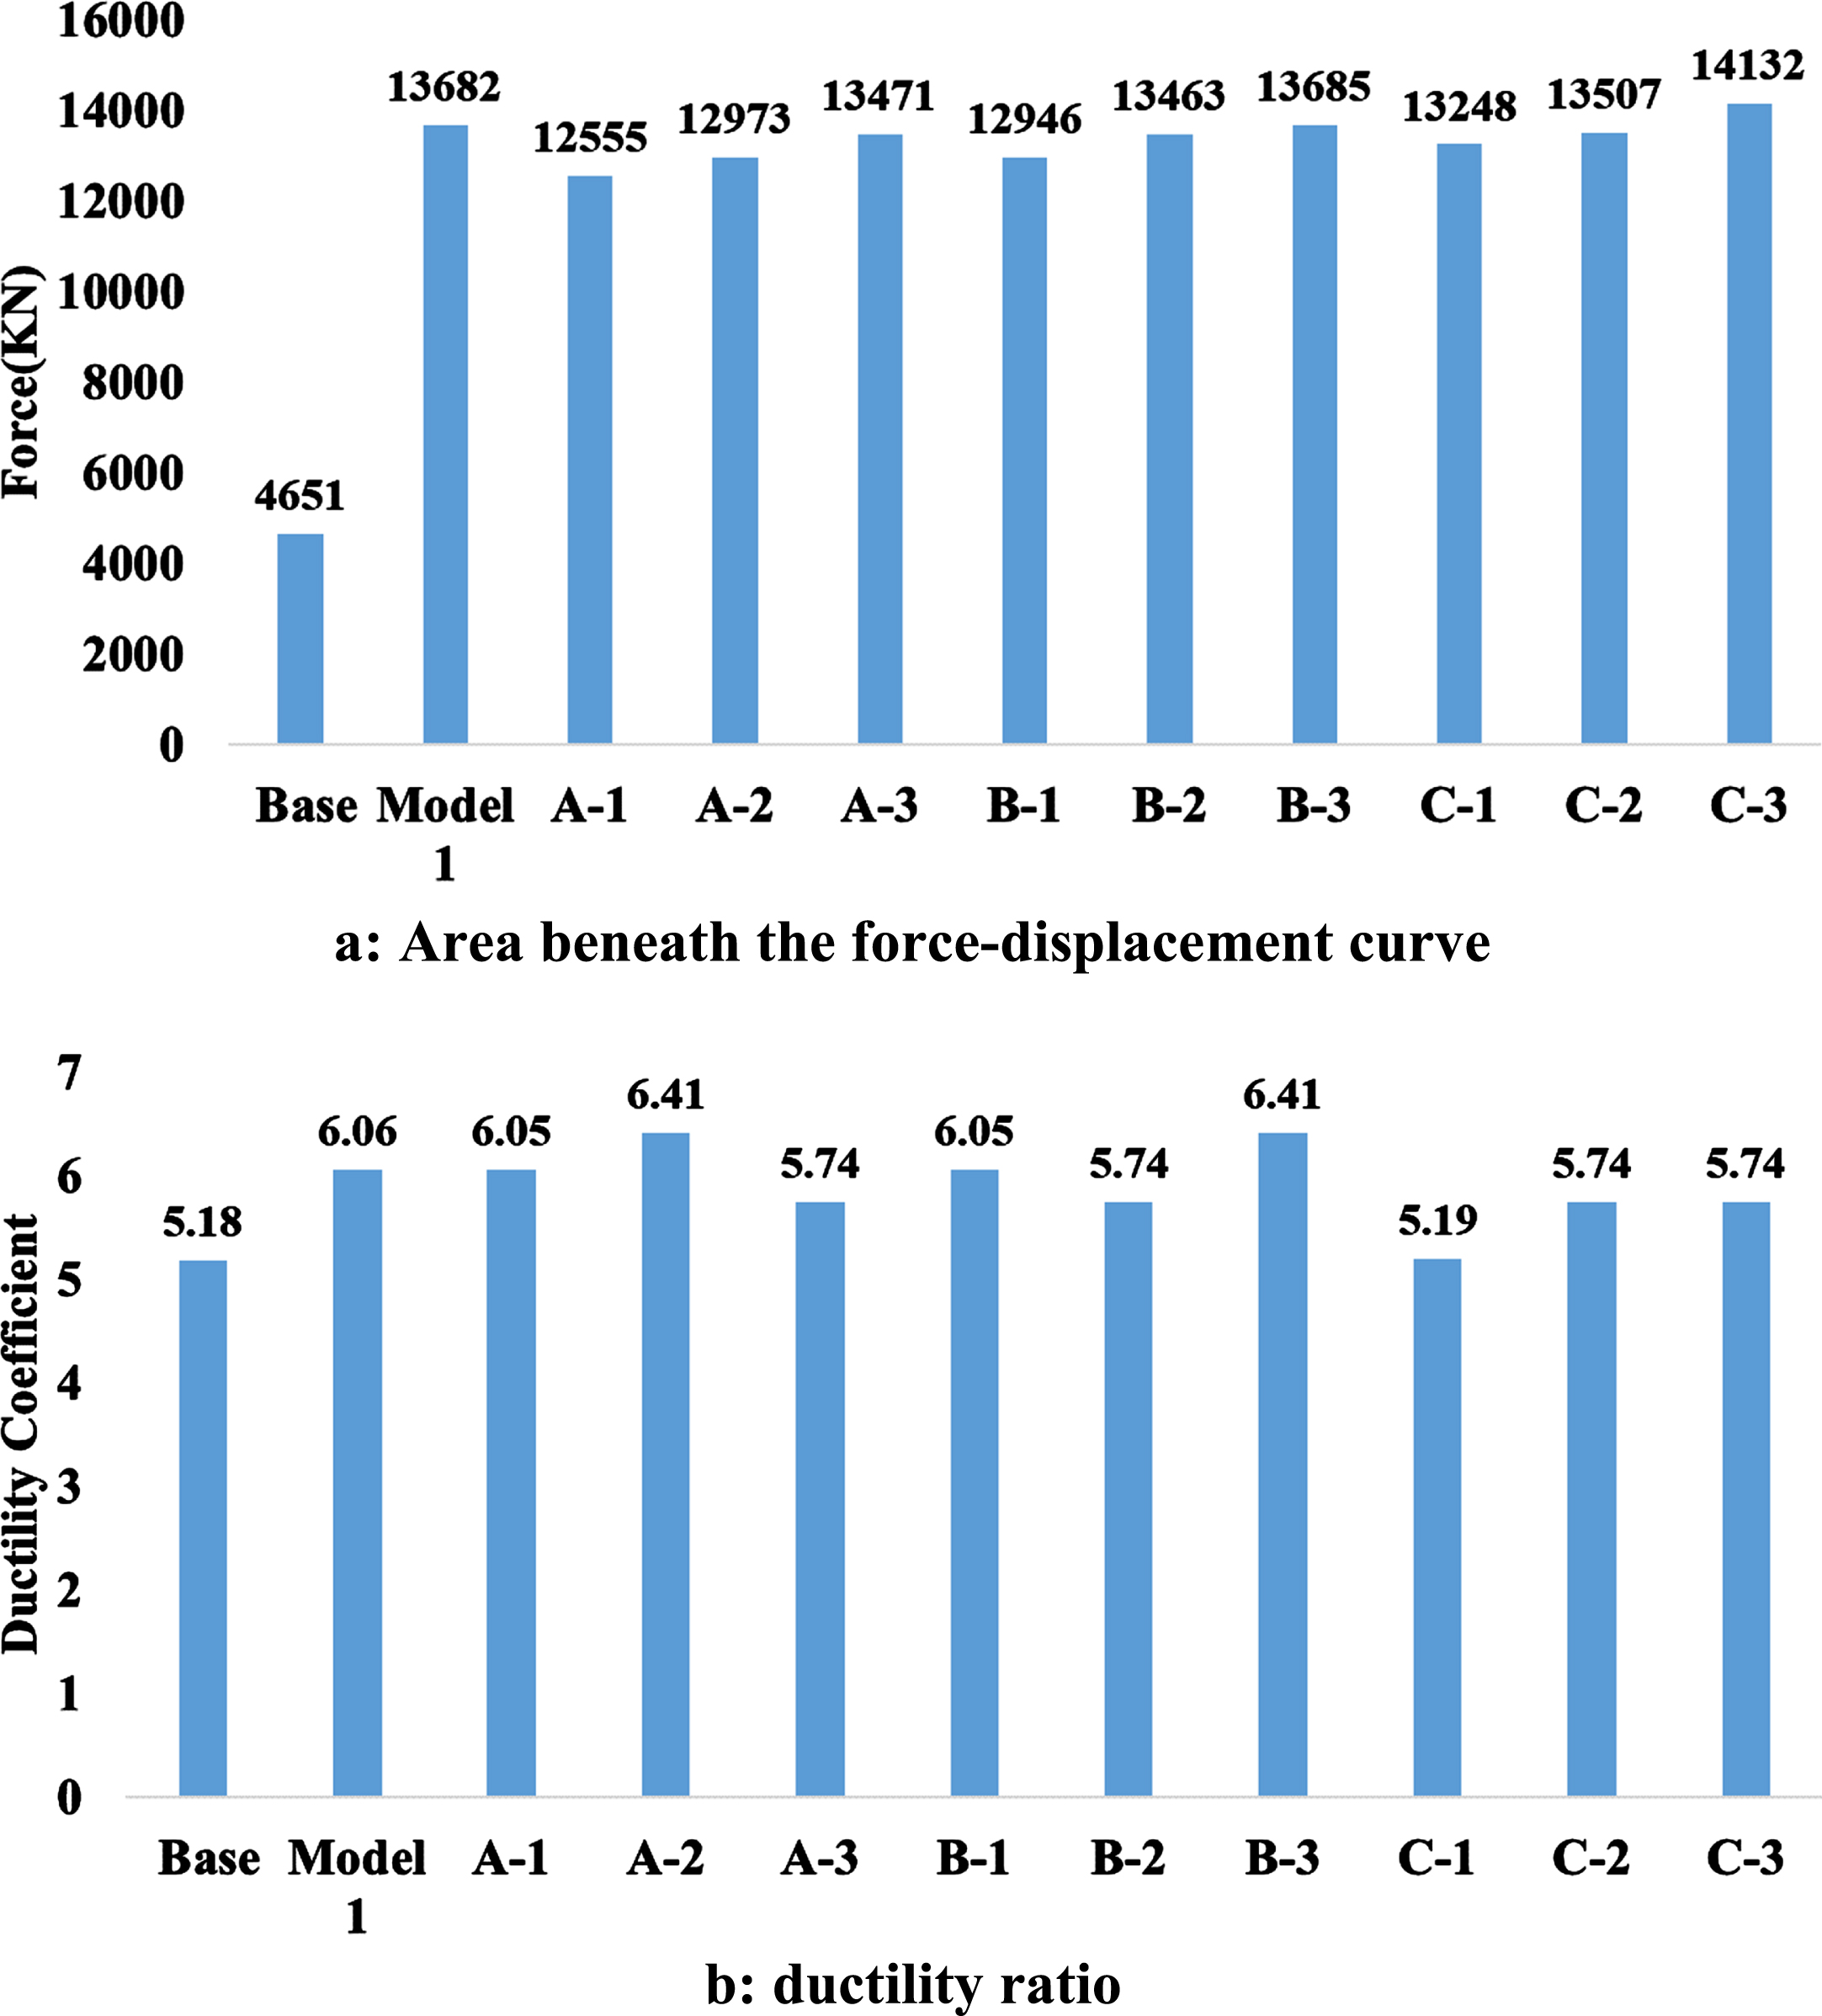
Area beneath the force-displacement curve and ductility ratio of the studied specimens.
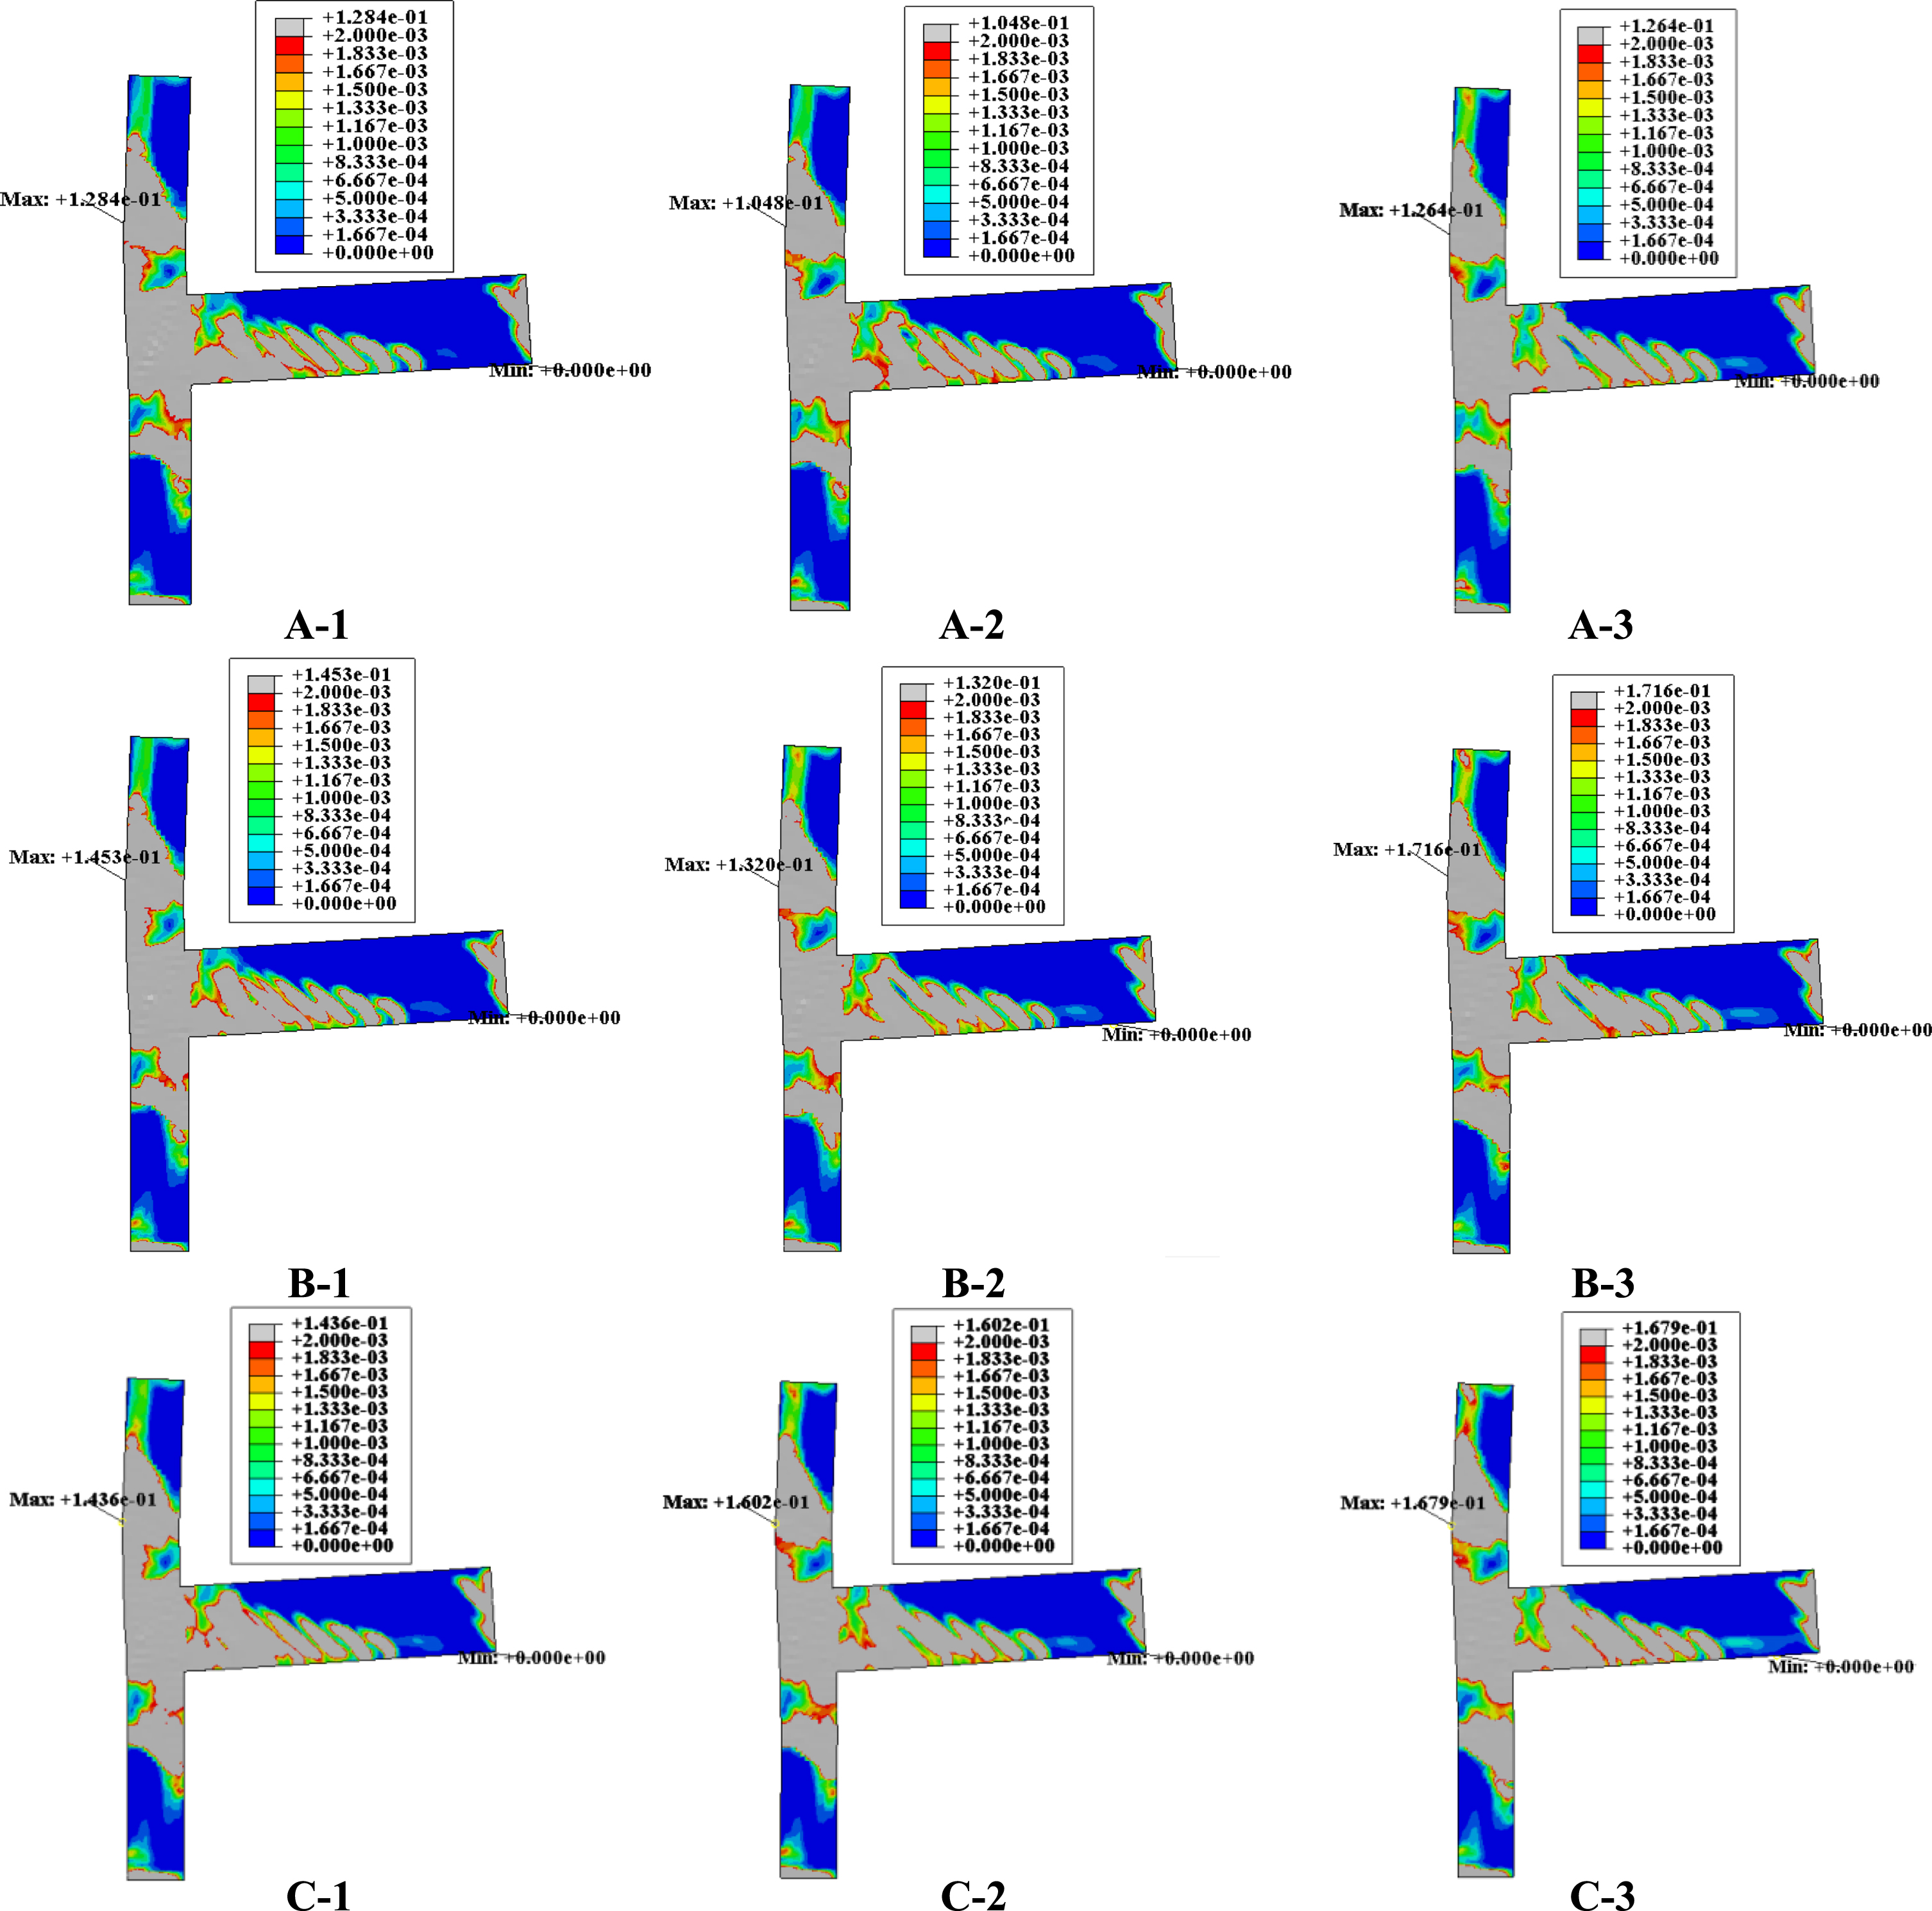
Distribution of maximum principal plastic strain in specimens with different geometrical properties of FRP strips.
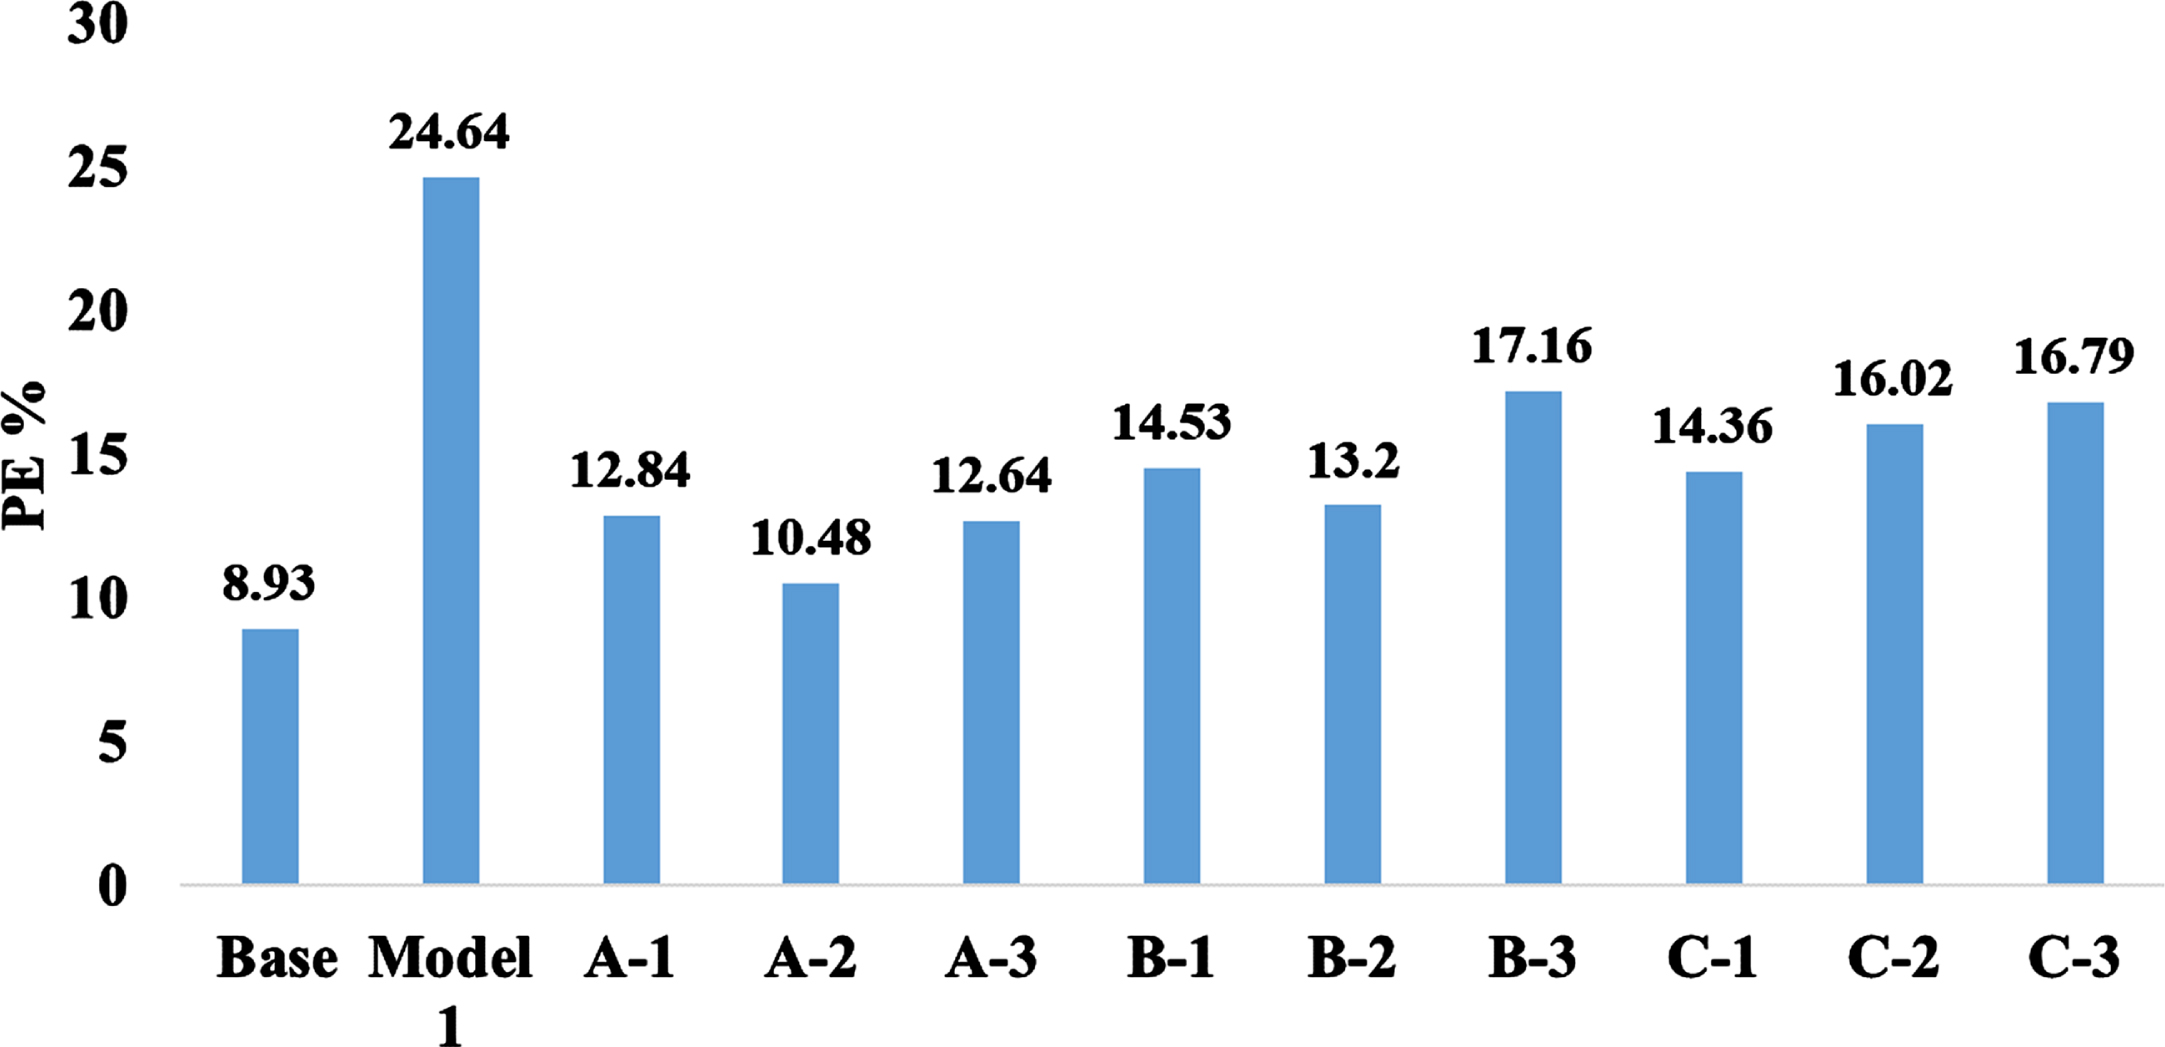
Maximum principal plastic strain values for the specimens.
In this study, a comprehensive analytical study was carried out to investigate the performance of exterior concrete connection retrofitted by FRP strips as a more practical and economical solution in comparison to the full FRP coverage of the entire connection zone. Based on the results obtained from numerical models, different behavioral and performance indices such as shear strength, ductility ratio, connection secant stiffness, and plastic strain are studied. According to the subjects proposed and within the limited scope of this study, the following results can be put forth: The use of strip arrangement with a proper anchorage in the wrappings around the circumference of the connection in the beam and column can be a suitable method for retrofitting FRP connections and can replace the joint retrofit scheme of full coverage of the connection area by FRP laminates. Among the retrofitted specimens with FRP strip arrangements, the specimen retrofitted by the combined arrangement of diagonal and orthogonal strips has the most appropriate performance. This retrofit scheme reduces the damages in the joint area and the column and transfers the damages into the beam. The use of strip arrangements increases the strength to a desirable level, results in a better distribution of damage in the connection and the beam and column assembly, and reduces the damage in the column. Retrofit of the connection with FRP strips increases the surface area below the force-displacement curves. It improves its ductility ratio, causing the maximum plastic strain to be induced outside the joint and increasing the joint’s energy dissipation capacity. Increasing the thickness of the strips is economically and practically feasible compared to the increase of strip widths and improves the maximum strength. However, in order to achieve this result, the quality and surface strength of the concrete should be suitable, and the strips should be well anchored in the wrapping of the beams and columns to minimize the possibility of strip separation. By increasing the width of the strips, the strength of the specimen with nonlinear behavior is improved throughout the region. However, when the width of the retrofit strips exceeds a certain amount, the effect of the FRP plate width on the overall shape of the load-displacement curve is insignificant. In this case, it has a negligible effect on connection performance.
Footnotes
Acknowledgements
The authors would like to thank the logistical support by IIEES (International Institute of Earthquake Engineering and Seismology in Tehran, Iran).