
Abstract
BACKGROUND:
Transjugular intrahepatic portosystemic shunt (TIPS), which artificially creates a portocaval shunt to reduce portal venous pressure, has gradually become the primary treatment for portal hypertension (PH). However, there is no prefect shunting scheme in TIPS to balance the occurrence of postoperative complications and effective haemostasis.
OBJECTIVE:
To construct cirrhotic PH models and compare different shunting schemes in TIPS.
METHODS:
Three cases of cirrhotic PH with different liver volumes were selected for enhanced computed tomography scanning. The models for different shunting schemes were created using Mimics software, and following FLUENT calculation, all the models were imported into the software computational fluid dynamic-post for processing. In each shunting scheme, the differences in portal vein pressure, hepatic blood perfusion and blood flow from the superior mesenteric vein in the shunt tract were compared. The coefficient G was adapted to evaluate the advantages and disadvantages.
RESULTS:
(1) Concerning the precise location of the shunt tract, the wider the diameter of the shunt tract, the lower the pressure of the portal vein and the lesser the hepatic blood perfusion. Meanwhile, the pressure drop objective was not achieved with the 6 mm-diameter shunting scheme. (2) The 8 mm-diameter shunting scheme through the left portal vein (LPV) had the highest coefficient G.
CONCLUSION:
The 8 mm-diameter shunting scheme through the LPV may demonstrate a superior effect and prognosis in TIPS procedures.
Keywords
Introduction
Portal hypertension (PH) is a syndrome characterised by increased portal venous system pressure caused by various aetiologies, primarily manifested as esophagogastric varices, ascites, hepatic encephalopathy (HE) and hepatorenal syndrome [1]. Among these, esophagogastric variceal bleeding (EGVB), which has an incidence rate of 12.5–30% [2,3] and a 6-week mortality rate of 20–22.6% [4,5], is one of the most severe complications.
Currently, the main treatment options for PH include drug therapy [6], portocaval shunt (surgical or interventional) [7] and liver transplantation. Since 1982, the transjugular intrahepatic portosystemic shunt (TIPS), which artificially creates a portocaval shunt to reduce portal venous pressure, has been used in clinical practice [8] and has gradually become the primary treatment for PH. However, owing to the alteration of the hemodynamics of the original portocaval system, TIPS has directly or indirectly caused complications such as HE, liver failure and shunting dysfunction [9]. Particularly, delivering more blood ammonia from the portal vein (PV) into the vena cava via the shunt without being detoxified by the liver is the leading cause of postoperative HE in TIPS [10].
Conventional hemodynamic measurements of the portal venous system, including ultrasound [11,12] and phase contrast magnetic resonance imaging [13], are unable to illustrate three-dimensional intravascular blood flow and to obtain parameters such as local wall shear stress, compressive pressure, and flow velocity. In contrast, the computational fluid dynamic (CFD) technique performs fluid domain modelling based on physical principles (law of conservation of mass and law of conservation of momentum). It can directly measure hemodynamic parameters those conventional methods cannot [14]. Additionally, CFD combined with imaging data can provide more information about individual portal system flow patterns [15,16], which can aid in predicting complications following TIPS.
To our knowledge, there are no studies on how to reduce the occurrence of postoperative complications by optimising TIPS surgical protocols based on effective haemostasis. In this study, we employed CFD to model the portal venous system in patients with cirrhotic PH. We also designed different TIPS schemes, including stent diameters and locations, to compare the shunting effects. Moreover, to understand the influence of liver volume on the conclusions, we selected three cases with significant liver volume differences for comparison.
Materials and methods
General data
Patients diagnosed with liver cirrhosis and EGVB who were admitted to Suzhou Municipal Hospital from January to December 2021 were selected using strict inclusion and exclusion criteria.
Inclusion criteria: (1) EGVB was diagnosed by the combination of imaging, laboratory tests and clinical signs; (2) Abdominal enhanced computed tomography (CT) imaging was tolerated and completed; (3) Conservative and endoscopic treatment outcomes were unsatisfactory; and (4) Normal mental status, understanding and signing of the informed consent form.
Exclusion criteria: (1) Patients with severe cardiac, pulmonary, renal and other significant organ dysfunction that cannot tolerate surgery; (2) Imaging confirmed thrombus or cancer embolus in PV; (3) Previous surgery history of the portal venous system which changed the morphological structure of PV; and (4) Any portal vein with a diameter measured by CT that is less than 10 mm in the main portal vein (MPV), the left portal vein (LPV) and the right portal vein (RPV).
For this study, three cases with significant differences in liver volume determined by the imaging system workstation were selected, as described in Table 1. Cases I and II underwent remedial TIPS for recurrent bleeding following medical treatment, while case III underwent early TIPS for acute gastrointestinal bleeding and haemorrhagic shock.
General clinical date of patient I, II and III
General clinical date of patient I, II and III
CT scan method
Patients were scanned in the supine position with a 128-layer spiral CT scanner (Optima CT660, GE Healthcare, USA), and the contrast agent was iopromide (Ultravist 370, Bayer Schering Pharma, Germany) at a dose of 1.0 mL/kg and a rate of 3.0 mL/s. SmartPrep (GE Medical Systems, USA) software was used to measure the ventral trunk level of the abdominal aortic. The arterial phase start threshold was set at 120 HU with a delay of 8 s to trigger the scan, and the portal phase was separated from the arterial phase by 16 s. The portal phase was separated from the hepatic vein phase by 20–30 s.
Three-dmensional models
The CT images, which adhered to the Digital Imaging and Communications in Medicine (DICOM) standard, were imported into Mimics software (Materialise, Leuven, Belgium) to reconstruct three-dimensional models of the PV system. Subsequently, 3-Matic (Materialise, Leuven, Belgium) software simplified the geometry of the PV system models for CFD simulation (Fig. 1). To facilitate the hemodynamic calculations, some small parts of the three-dimensional reconstruction of the PV system were pruned, retaining only the PV and its main branch vessels, which include the MPV, LPV, RPV, superior mesenteric vein (SMV) and splenic vein (SV). Supplementary Fig. S1 presents the three patient-specific livers and simplified PV models. The geometric models were meshed by the Mimics finite element analysis module and imported into FLUENT (ANSYS Inc, Canonsburg, USA) for meshing. The findings were then post-processed and analysed using CFD-Post (ANSYS Inc, Canonsburg, USA).
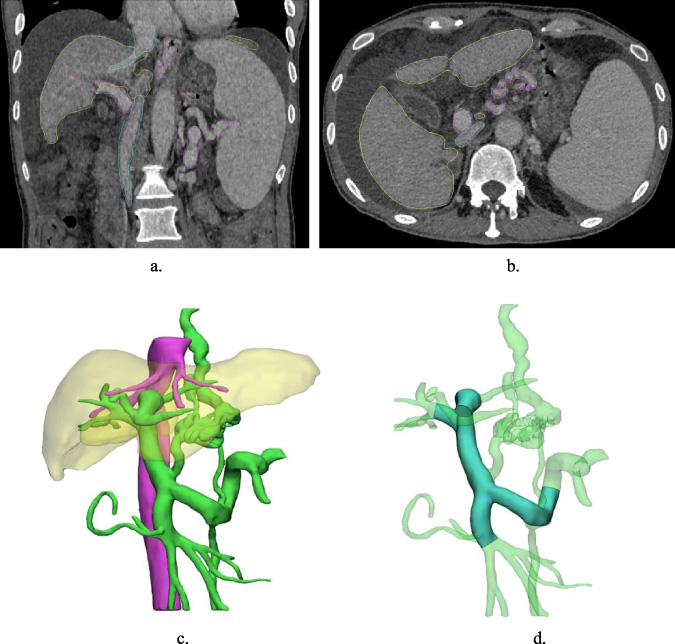
(a, b) Coronal and axial view of the 3-D CT image. (c) 3-D reconstruction of the liver, the inferior vena cava and the PV system. (d) Simplified model of the PV system.
To ensure the accuracy of the calculation, the boundary layer was encrypted with six layers, the mesh type was set as tetrahedral mesh, and the mesh independence was verified to match the accuracy requirements. The meshing process is presented in Supplementary Fig. S2, and the cell numbers of the reconstructed models ranged from 50,000 to 100,000. The blood type was defined as an adiabatic, homogeneous and incompressible Newtonian mechanical fluid, with a density and viscosity coefficient of 1060 kg/m3, and 0.0035 Pa⋅s, respectively [17]. The flow mode was defined as laminar flow due to the low intravascular pressure, and the calculated Reynolds number was RE < 2300 [18]. The mass and momentum conservation equations for three-dimensional incompressible laminar flow are written as follows:
The models were set to flow in a steady state with a rigid vessel wall to simplify calculations, and the effect of gravity was not considered. The inlet boundary conditions used in all models were measured by ultrasound in the SMV and SV, and the outlet boundary condition was set as the free outflow outlet. Meanwhile, we calculated the rate of blood flow components in each outlet using the multiple components flow hemodynamic model. In FLUENT, the coupled algorithm was selected, the iterations were set to 1000, the time step to 0.002 s and the residual to 10−4.
To compare the effects of diameter and position of shunting schemes, we set the shunting diameters as 6 mm, 8 mm, and 10 mm. We set the shunting positions as the left branch of the PV (LPV shunt), the right branch of the PV (RPV shunt) and the main branch of the PV (MPV shunt).
Additionally, the shunt was simulated using the Cylinder module in 3-Matic and combined with the PV system model by Boolean operations to obtain a total of nine shunting scheme models (Supplementary Fig. S3).
Evaluation indicator
To delay liver failure and limit the proportion of SMV-derived blood in the shunt tract, effective shunting schemes should reduce portal venous pressure sufficiently to ensure haemostatic efficacy while maintaining portal venous perfusion in the liver to a great extent.
The leading evaluation indicators of this study include:
Changes in PV pressure, the ratio of the decrease in portal venous pressure (ΔP) compared with the preoperative portal venous pressure (P
2). Changes in hepatic blood perfusion, the ratio of portal venous flow into the liver (R
1) to total portal venous blood flow (R Total). Changes in blood flow from the SMV in the shunt tract, the blood flow rate from the SMV in the shunt tract (Q
1) to total blood flow in the shunt tract (Q Total).
Similarly, we established the evaluation coefficient G and the correlation equation to compare the advantages and disadvantages of different shunt schemes more effectively and quantitatively. The larger the value of G, the better the overall effectiveness of the shunting scheme.
Changes in PV pressure
The average pressure value perpendicular to the MPV’s centerline and closest to the cross-section of the MPV was used to calculate the PV pressure (Fig. 2). The specific data is presented in Fig. 4(a).
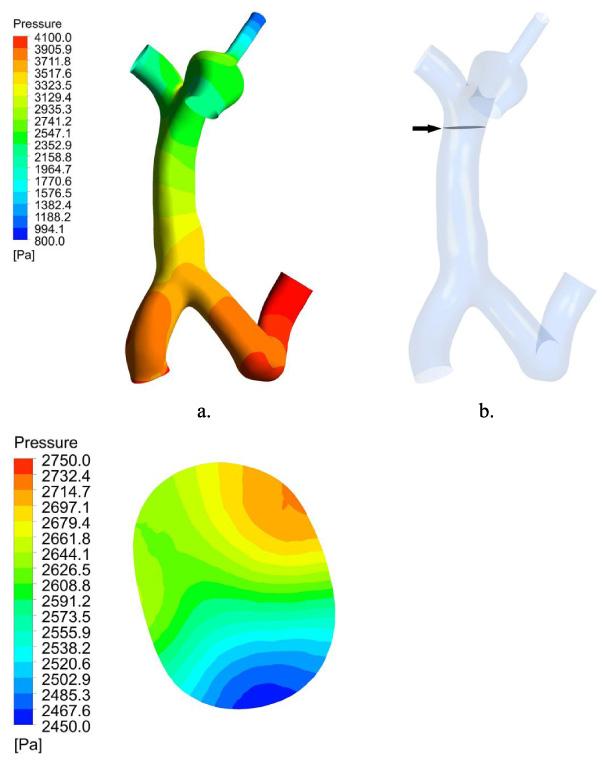
(a) Pressure of PV model. (b) The piezometric plane of MPV (black arrow). (c) Pressure of the piezometric plane.
When the shunting diameter was the same, it was observed that the decrease in PV pressure was the greatest when the shunting scheme used was MPV shunt. When the shunting position was the same, the larger the shunting diameter was, the more significant the decrease of PV pressure.
The hepatic blood perfusion and the blood flow from the SMV in the shunt tract were measured by observing the streamlines of blood flow in unit time and calculating the mass fraction of blood flow from the two inlets in each outlet (Fig. 3). The specific data is presented in Figs 4(b) and 4(c).
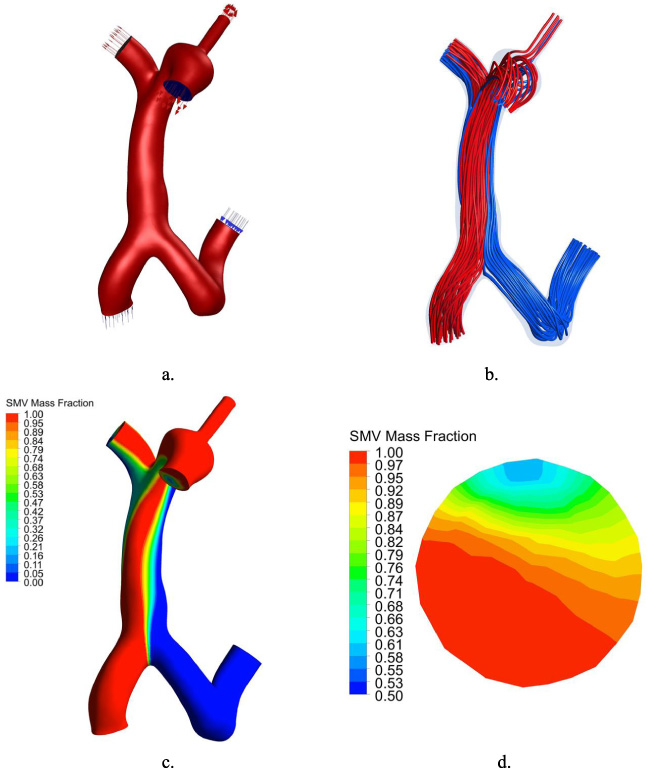
(a) Blood flow direction in PV model. (b) Streamline of PV model. (c) Distribution of blood flow from SMV in PV. (d) Distribution of blood flow from SMV in the shunt.
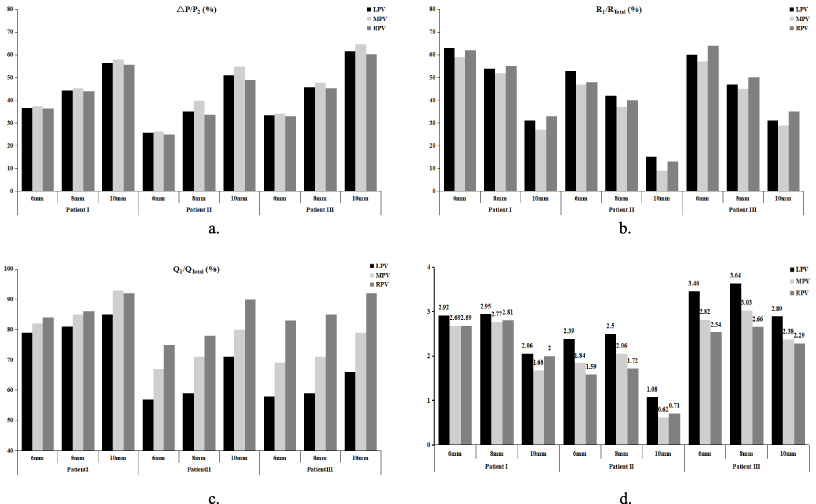
(a) Ratio of postoperative PV pressure drop. (b) Ratio of blood flow from PV to liver. (c) Ratio of blood flow from SMV in the shunt. (d) Evaluation coefficient G value.
The MPV shunting scheme was demonstrated to produce the lowest hepatic perfusion when the shunting diameter was the same. Additionally, there was no significant regular difference between LPV and RPV shunts. When the shunting position was the same, the larger the shunting diameter, the lower the hepatic perfusion, and the higher the blood flow rate from the SMV in the shunt tract. When the shunting diameter was the same, the blood flow rate from SMV in the shunt tract was LPV shunt < MPV shunt < RPV shunt.
Figure 4(d) presents the variation of the evaluation coefficient G in three patients. It was revealed that when the shunting diameter was the same, the evaluation coefficient G was the largest in the LPV shunt. There were no significant differences between the MPV and the RPV shunts. When the shunting position was the same, the value of G was 6 mm shunt >8 mm shunt >10 mm shunt. In general, the shunting scheme with the 8 mm diameter through the LPV had the highest value of G.
Discussion
The analysis of physiological data combined with medical imaging using CFD techniques is very beneficial in visualising the pathophysiological mechanisms underlying the occurrence and development of the disease [19]. There are many intricate and complex mechanisms involved in treating PH, and occasionally conflicting decisions must be made to achieve the best therapeutic interests. Although TIPS is effective in reducing portal venous pressure and lowering the risk of EGVB, it also transfers portal blood directly into the circulatory system without liver detoxification, which frequently results in HE [20,21]. Therefore, it is essential to maintain adequate hepatic perfusion to prevent liver failure and HE while sufficiently reducing PV pressure and ensuring haemostasis, which is also the theoretical basis of our study.
How can these factors be combined to quantitatively assess the general merits of the portosystemic shunt schemes? We considered the following factors: (1) PH is the leading cause of upper gastrointestinal bleeding in patients with cirrhosis. The principle of TIPS is to provide effective haemostasis by reducing the pressure gradient in the portocaval system; the more significant the reduction in pressure gradient, the lower the risk of rebleeding [22]; (2) Excessive reduction in hepatic perfusion following TIPS is the underlying cause of liver failure and HE, and the more hepatic perfusion is preserved, the lower the incidence of liver failure and HE [23]; (3) Blood in the shunting tract is rich in ammonia, which cannot be purified by the liver and is the main cause of HE [24]. Additionally, portal venous blood flow has a laminar effect, with the LPV receiving mainly splenic venous blood that contains less blood ammonia and the RPV receiving superior mesenteric venous blood that contains more blood ammonia [13,25]. Therefore, we believe that the shunt effect is positively correlated with the value of PV pressure drop and liver perfusion and negatively associated with the content of SMV blood flow in the shunting tract. Thus, we performed numerous computer simulations and validated the results against clinical experience and literature findings, and finally quantified and created the evaluation coefficient G by specific parameters such as pressure and blood flow mass fraction in CFD, with a higher G value representing a better-expected shunt effect.
The efficacy of TIPS is closely related to the operator’s skilled ability, stent selection and surgical philosophy. Many researchers have conducted numerous clinical trials to select the appropriate shunting scheme, and currently, the mainstream shunting schemes with 8 mm stents in the LPV are dominant [26–28].
Since no study has yet elaborated on the mechanism, we designed shunting schemes with different diameters and positions to explain the aforementioned conclusion from the hemodynamic perspective. The magnitude of the pressure drop in the portal vein is the underlying factor, and only sufficient pressure drop can effectively prevent rebleeding. Although, a decrease in portal pressure of more than 25% or a hepatic venous pressure gradient <12 mmHg is effective in treating and preventing recurrent gastrointestinal bleeding [29–31], the results of this study suggest that the 8 mm and 10 mm diameter shunting schemes were effective in reducing pressure in all three cases. However, the 6 mm diameter shunting scheme could not ensure the threshold value for preventing bleeding in case II. Therefore, to achieve this threshold, factors that were optimised to reduce postoperative complications included intrahepatic perfusion and the percentage of SMV blood flow in the shunt tract. Every model was established on the premise that the spleen was not resected. Otherwise, blood flow stratification in the shunting track would not exist. We hypothesized that the 8 mm-diameter shunting scheme through the LPV may demonstrate a superior effect and prognosis in TIPS since, in this CFD simulation, the G values were maximal while adopting the 8 mm-diameter shunting scheme through the LPV in all three cases.
It should be noted that some assumptions were made when we simulated the flow. First, when constructing the three-dimensional models, we set the portal vein model and the shunt tract model as fixed modules without considering the extensibility of the stent and the elasticity of the vessel wall. Second, to eliminate the influence of blood compressibility and blood vessel vortex on calculation, we define blood as incompressible Newtonian mechanical fluid and blood vessel flow as unidirectional laminar flow, which may affect the natural blood system morphology. Third, liver hemodynamics should change significantly with time (from several hours to several months) after TIPS. The computer models introduced in this study were only suitable for the stage following surgery. However, the specific parameter values should be adjusted according to the actual situation and time. Finally, the evaluation coefficient G and the weight proportion of each factor in its equation remained unconvincing, necessitating further verification of its result.
Conclusion
We successfully constructed cirrhotic PH models and compared different shunting schemes in TIPS by CFD simulation with CT images. The differences in PV pressure, hepatic blood perfusion and blood flow from the SMV in the shunt tract were compared. The 8 mm-diameter shunting scheme through the LPV may demonstrate a superior effect and prognosis in TIPS procedures, as initially confirmed by the evaluation coefficient G. To further support these findings, we will optimise the model, include more samples, and conduct clinical follow-up.
Footnotes
Conflict of interest
The researchers claim no conflicts of interest.