
Abstract
INTRODUCTION:
Breast cancer is the most common cancer in women worldwide. It is responsible for about 23% of cancer in females in both developed and developing countries. This study aimed to compare the diagnostic performance of contrast-enhanced mammography (CEM) and contrast-enhanced magnetic resonance imaging (CEMRI) in preoperative evaluations of breast lesions.
METHODS:
We searched for published literature in the English language in MEDLINE via PubMed and EMBASETM via Ovid, The Cochrane Library, and Trip database. For literature published in other languages, we searched national databases (Magiran and SID), KoreaMed, and LILACS. Metadisc1.4 software was used for statistical analysis
RESULTS:
A total of 1225 patients were included. The pooled sensitivity of CEM and CEMRI was 0.946 (95% CI, 0.931–0.958) and 0.935 (95% CI, 0.920–0.949), respectively. The pooled specificity of CEM and CEMRI was 0.783 (95% CI, 0.758–0.807) and 0.715 (95% CI, 0.688–0.741), respectively. The sensitivity of CEM was the most in the United States (97%) and the specificity of CEM was the most in Brazil (88%). MRI sensitivity was the most in USA and Egypt (99%) and China had the most MRI specificity (81%) in diagnosis of breast lesions.
CONCLUSION:
Contrast-enhanced mammography, a combination of high energy image and low energy image, can well display breast lesions and has the diagnostic efficacy equivalent to MRI. Importantly, CEM imaging shows higher specificity, positive predictive value, and diagnostic conformance rate than MRI. Despite some drawbacks such as higher irradiation and iodine usage, CEM has such advantages as convenient and fast examination, strong applicability, and low costs; thus, it can be popularized as a useful tool in breast disease.
Keywords
Introduction
Breast cancer is the most common malignancy in women worldwide and the first choice for treatment is surgery. It accounts for about 23% of all cancers in women in developed and developing countries [1]. In the past few years, the incidence of breast cancer and its subsequent mortality have increased by approximately 20% and 14%, respectively [2]. The most important goal is to diagnose breast cancer early and in a cost-effective way in every woman, regardless of age, race, economic status, risk level, and geographic environment [2]. The fact that early diagnosis of breast cancer by X-ray mammography reduces mortality has been shown in several studies. However, this method has a low sensitivity and specificity in young patients and women with radiographically dense breasts because of the reduced contrast between a possible tumor and surrounding breast tissue [3–6]. Currently, MRI is the most sensitive imaging technique to diagnose breast cancer and evaluate the extent of the disease in preoperative planning [7–11]. Especially in women with invasive lobular carcinoma (ILC), preoperative MRI can reduce the need for re-excision [12] and is more accurate than mammography and than ultrasound in estimating size [13]. However, because of the high costs and limited availability, preoperative breast MRI may be performed only in a very small number of cases. In addition, there may be many false-positive findings in preoperative MRI, which must be rejected preoperatively, resulting in additional biopsies that may delay treatment [14]. The introduction of full-field digital mammography has led to the development of other techniques that are cheaper and more accessible than MRI. One of these techniques is Contrast-enhanced spectral mammography (CESM). CESM is a new imaging tool using a dual energy technique that has more sensitivity for the detection of breast cancer than conventional two-dimensional (2D) digital mammography [15–19] in the diagnostic setting. Also, it has equal sensitivity with improved specificity compared to contrast-enhanced magnetic resonance imaging (CEMRI) [20–26]. The tool was approved in 2011 by the Food and Drug Administration (FDA) for diagnostic imaging, and is currently being used clinically [27]. Compared to MRI, CESM is faster because it does not require more time except for IV-line placement and contrast administration. CESM is also similar in cost to a diagnostic mammogram and much cheaper than MRI. It is easier to implement than MRI, since it only requires a software and firmware update to match conventional digital mammography equipment (as long as the mammography unit is capable of performing contrast mammography). Breast Magnetic Resonance Imaging (MRI) is the most accurate imaging tool to detect breast cancer because of its high sensitivity to soft tissue. Currently, breast MRI can provide more comprehensive information for the diagnosis of benign and malignant breast lesions that are not definitely diagnosed by mammography or ultrasonography. Current studies have confirmed that the sensitivity of MRI is 80% to 97.8%, but its specificity in the diagnosis of breast cancer is only 46% to 93.3%, thereby leading to a high incorrect diagnosis rate [28]. Other studies in this area suggest that 5.5% of cases underwent extensive surgery due to false positive MRI results [29]. Using CESM may be a solution to diagnose breast cancer. In addition, access to MRI is limited to large space, it is very expensive and time consuming, and contraindicated in patients with certain metal implants and pacemakers [30,31]. Since CESM is in the early stages of development and clinical use, this study aimed to evaluate and compare the diagnostic efficacy of CESM with MRI and pathologic results. To discuss the accuracy of CESM in the diagnosis of breast diseases, some indicators, including sensitivity, specificity, and so on were calculated.
Materials and methods
Search strategy
The researchers searched for articles published in English in MEDLINE via PubMed, in EMBASETM via Ovid, as well as in the Cochrane Library and the Trip Database. For articles published in other languages, the national databases of Magiran and SID, KoreaMed and LILACS were searched. We used a combination of medical subject headings (MeSH) terms and keyword searches. the keywords used in the searching process were “Breast cancer” and “Contrast enhanced MRI” and “Contrast-enhanced mammography” and CEMRI and CEM. A variety of specific articles, such as “review articles”, “letters”, “comments”, “conference summaries” and “case reports” were removed.
Search terms for meta-analysis
“diagnostic imaging” [Subheading] OR “mammography” [MeSH Terms] OR “mammogram” [MeSH Terms] OR contrast-enhanced mammography [Text Word] OR CEM [Text Word] OR “magnetic resonance imaging” [MeSH Terms] OR “MRI” [MeSH Terms] OR “contrast enhance MRI” [MeSH Terms] OR CEMRI [Text Word] AND “breast cancer” [MeSH Terms] OR breast tumor [Text Word] OR breast lesion [Text Word] OR “pre-operative” [MeSH Terms] OR pre-operative evaluation [Text Word] OR tumor staging [Text Word] OR diagnostic performance [MeSH Terms] OR diagnostic accuracy [MeSH Terms] OR diagnostic performance [Text Word].
In addition, the references listed in the retrieved articles were also searched, and these related studies were manually reviewed in order to identify other articles relevant to our article topics. Languages were not restricted when retrieving documents. To prevent loss of articles, manual and online retrievals were performed. Two reviewers retrieved and evaluated the articles independently. If there was a disagreement, there would be a discussion until consensus was reached. All the evaluators had professional medical imaging knowledge, and regularly reviewed articles on breast lesion imaging.
Study selection
The criteria for data collection were:
CEM and CEMRI were used as reference for the diagnosis of breast lesions; The patients included in the study had at least one breast lesion that was previously diagnosed and classified with a breast imaging report and data system. More than 30 patients participated in the study. The gold standard (histological results) was confirmed by percutaneous biopsy, needle biopsy, core biopsy or surgery resection through clinical follow-up; The Information was sufficient to calculate the true- positive (TP), false-positive (FP), true-negative (TN), and false-negative (FN) values using the raw data.
Duplicated or overlapping articles and articles that did not meet the inclusion criteria listed above were removed.
Data extraction and quality assessment
Two reviewers independently extracted data from the full text of each study. The Data were as follows: the first author, country of study, year of publication, total number of patients, mean age of participants, type of study (retrospective or prospective), techniques and method of diagnosis. For each study, TP, FP, TN, FN, sensitivity (SEN), specificity (SPE), positive predictive value (PPV), negative predictive value (NPV), positive likelihood ratio (LR+) and negative likelihood ratio (LR−) were extracted at one time.
Two reviewers (OO, XX) assessed the methodological quality scores of the selected studies from the Quality Assessment of Diagnostic Accuracy Studies (QUADAS-2) tools containing 11 Standard Items using a review manager software program (RevMan, version 5.0.2, Nordic Cochrane Centre, Copenhagen, Denmark) [32]. The answers ‘yes’, ‘no’ or ‘unclear’ to the 11 standard questions respectively indicate that the risk of bias can be judged to be low, bias is likely, or insufficient data have been reported, which does not make a judgment [33].
Statistical analysis
Metadisc1.4 software was used for statistical analysis. The statistical significance was set at P < 0.05. In the first step, the heterogeneity between each study that resulted from the threshold effects had to be eliminated. If there was a threshold effect, the sensitivity and specificity were negatively correlated, thereby resulting in a typical “shoulder-arm shape” SROC curve [34]. Second, for other heterogeneity, the heterogeneity analysis in each study to assess the degree of heterogeneity was performed using the chi-squared value test and the inconsistency index (I2) of the diagnostic odds ratio (DOR) [35,36]. In summary, high heterogeneity was considered to be if P < 0.05 or I2 > 50%. If I2 ≤ 25% and 25% < I2 ≤ 50%, the heterogeneity between the results of studies was considered to be small and medium, respectively [37,38].
If the selected studies were consistent enough (I2 < 50%), the fixed effect model carried on the analysis or the heterogeneity existed, their sources were analyzed and a subgroup analysis of the factors likely to cause heterogeneity was performed. But if the statistical heterogeneity between the studies showed no clinical heterogeneity or significance, the random effects model was used. If the heterogeneity analysis could not find the data sources, then descriptive analysis among the groups was performed, or the sensitivity analysis was conducted to prove the consistency of the results [35].
For each study, sensitivity (SEN), specificity (SPE), positive likelihood ratio (LR+), negative likelihood ratio (LR−) and diagnostic odds ratio (DOR) were calculated with a 95% confidence interval (CI). High sensitivity and specificity showed the screening and detection accuracy. The higher the LR+ and the lower the LR− showed the lower the rate of misdiagnosis and the lower the rate of missed diagnosis in the diagnostic test. The DOR represented the “discrimination” ability of the diagnostic test. The greater the DOR is, the stronger the discriminative ability of CEMRI and CEM [39].
The summary receiver-operating characteristic curve (SROC), the area under the curve (AUC), and the Q∗ index (the Q∗ index is the best statistical method for reflecting diagnostic performance, the point on the SROC where sensitivity and specificity are equal) were calculated. The researchers could analyze, evaluate and compare the CEM and CEMRI diagnostic test values through the SROC AUC value.
AUC values below 50% indicated that the diagnostic test was meaningless. AUC values from 51% to 70% meant that the diagnostic accuracy was lower. AUC values ranging from 71% to 90% showed moderate diagnostic accuracy. The AUC over 90% showed high diagnostic accuracy, which was closer to the higher accuracy of the diagnostic tests for the top left corner of the coordinate axes [39]. The risk of publication bias was assessed across studies with a funnel plot of the logarithmic ratio of the diagnostic odds ratio of studies to standard error when more than nine studies were included [40,41].
Results
Study selection
Systematic search yielded a total of 1266 studies from the databases of PubMed, EMBASE, and Springer. After reviewing the titles and abstracts, 428 articles were considered as potential eligible candidates for inclusion. After in-depth reading, we excluded 406 articles since they have not met our eligibility criteria. Of the remaining 22 eligible studies, there were 8 data duplications. Thus, we have included 14 articles in our current meta-analysis (42–45). A diagram schematizing the selection process is presented in Fig. 1.
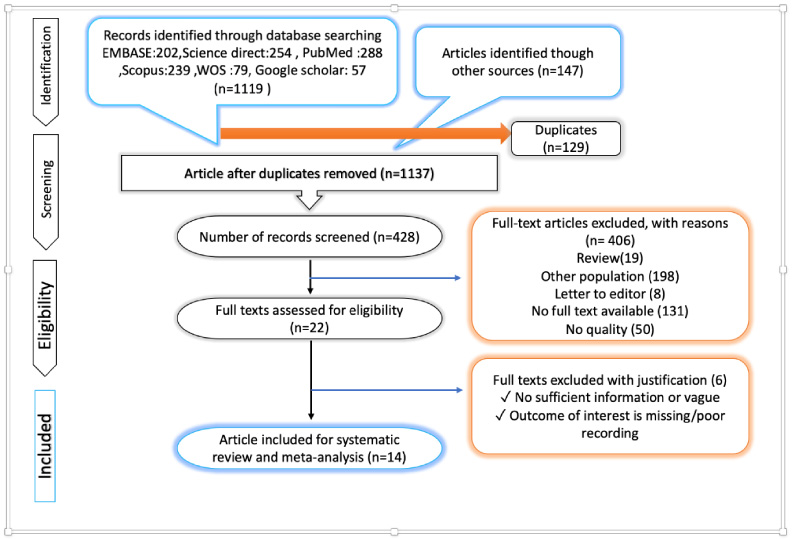
PRISMA flow diagram.
Table 1 shows that a total of 1225 patients were included. Within all studies included, there were two from the USA, three from Germany, two from China, two from Egypt, and one from Brazil, Poland and Italy. Of the 14 articles, ten were prospective studies and the rest of them were retrospective. The measuring parameters of CEM and CEMRI were varied. All the 14 articles used histopathologic results as the golden standard. Details of the 14 studies were shown in Table 2.
Characteristics of the included studies
Characteristics of the included studies
Diagnostic performance of CEM and CEMRI in diagnosis of Breast lesions
In general, the results of QUADAS-2 tool showed that the qualities of included studies were satisfying and eligible (Fig. 6).
Performance of CEM and CEMRI in diagnosis of breast lesions
The pooled sensitivity of CEM and CEMRI was 0.946 (95% CI, 0.931–0.958) and 0.935 (95% CI, 0.920–0.949), respectively. The sensitivity of CEM was higher than that of CEMRI (P < 0.05). And the specificity of CEM and CEMRI was 0.783 (95% CI, 0.758–0.807) and 0.715 (95% CI, 0.688–0.741), respectively. The specificity of CEM was higher than that of CEMRI (P < 0.05). For CEM, positive likelihood ratio, negative likelihood ratio, and diagnostic odds ratio were 5.031 (95% CI, 2.702–9.367), 0.081 (95% CI, 0.049–0.133), and 74.074 (95% CI, 33.809–162.29), respectively. While for CEMRI, positive likelihood ratio, negative likelihood ratio, and diagnostic odds ratio were 3.754 (95% CI, 1.750–8.054), 0.102 (95% CI, 0.068–0.152), and 38.609 (95% CI, 18.433–80.869), respectively (Figs 2, 3, 4). SROC curves showed that the AUC of CEM and CEMRI were 0.96 and 0.84, respectively (Table 2). The Youden index (∗Q) estimates for CEM and CEMRI were 0.91 and 0.89, respectively. And the ∗Q index of CEM was higher than that of CEMRI (P < 0.05).
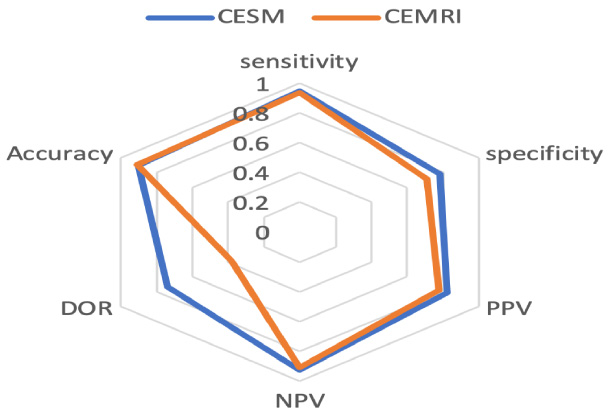
Radar chart of diagnostic performances of the different type of radiological examinations.
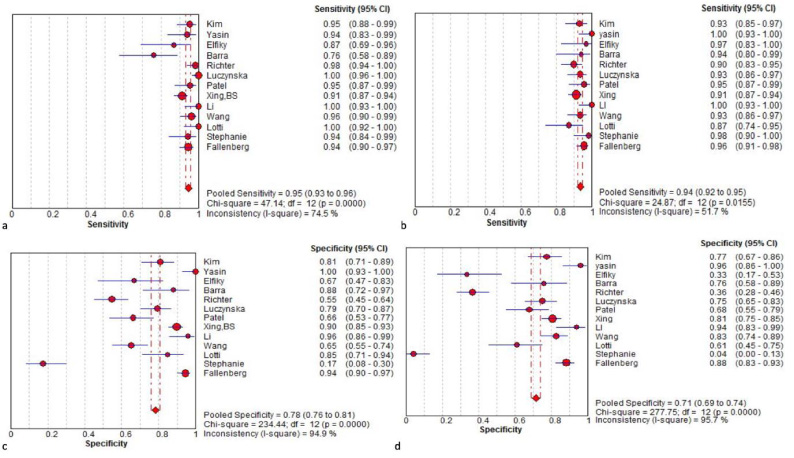
Sensitivity and specificity of CESM (a, c) and CEMRI (b, d) in diagnosis of breast lesions. Forest plot of sensitivity reported in each study. Each study is identified by name of first author and year of publication, with circles representing individual study point estimates, size of each circle indicating relative contribution to data pooling (inverse variance weighting), horizontal lines indicating 95% CIs, and dashed vertical lines representing 95% CIs for pooled sensitivity and specificity (a).
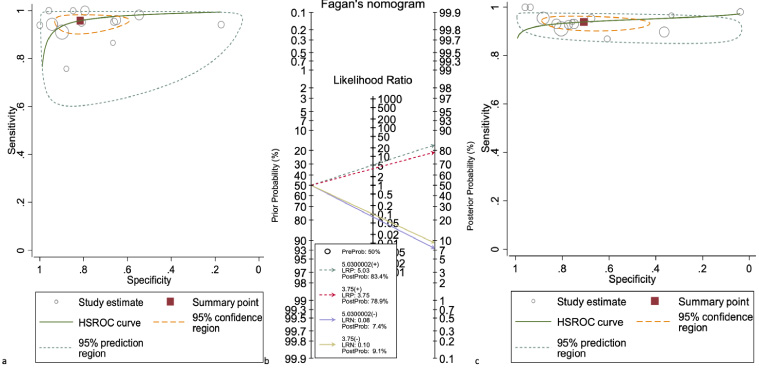
Hierarchical summary receiver (HSROC) curve for CESM (b) and CEMRI (c), for diagnosis of breast lesions. Fagan’s nomogram for the calculation of post-test probabilities. A pre-test probability of 50% diagnostic tool was fixed, which was estimated by the number of symptomatic cases in selected studies. CESM (a) and CEMRI (b) had a post-test probability of 97.6% and 80%, respectively. The results were obtained by the following calculations: pretest odds = prevalence/1-prevalence; post-test odds = pretest odds × LR− (LR+); post-test.
The results showed that there was statistical heterogeneity of CEM (sensitivity, Q value = 47.14, I2 = 74. 5%; specificity, Q value = 234.44, I2 = 95%) and CEMRI (sensitivity, Q value = 24.87, I2 = 52%; specificity, Q value = 277.75, I2 = 96%) (Figs 3 and 4). Considering the heterogeneity indicated by I2, bivariate mixed effects model was chosen to synthesize the ROC curves (Table 2). The Spearman correlation coefficient and P value of CESM and CEMRI were 0.057 (P = 0.63, P > 0.05) and 0.41 (P = 0.62, P > 0.05), respectively. These results showed that there were no threshold effects in this meta-analysis.
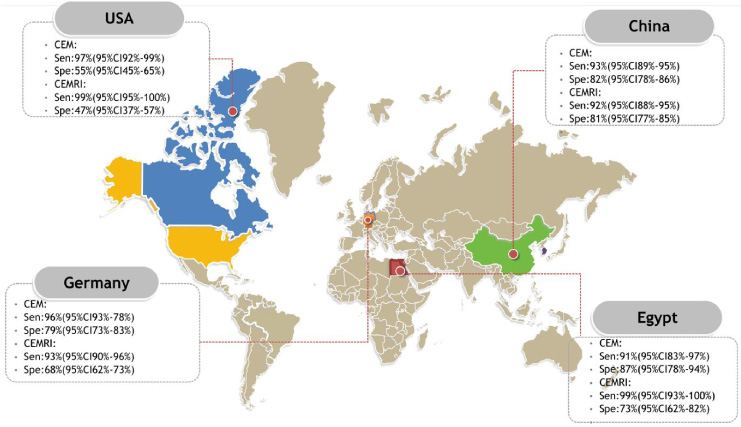
Pooled sensitivity, specificity and accuracy of CEM and CEMRI based on country.
Country
The sensitivity of contrast-enhanced mammography was the most in United States with a sensitivity of 97% and the specificity of CEM was the most in Brazil with a specificity of 88%. MRI sensitivity was the highest in the USA and Egypt owing a sensitivity of 99% and China had the most MRI specificity (81%) in diagnosis of breast lesions. Brazil and USA had the least sensitivity and specificity for CEM in diagnosis of breast lesions respectively, and Italy had the least sensitivity and specificity for MRI in diagnosis of breast lesions (Fig. 5).
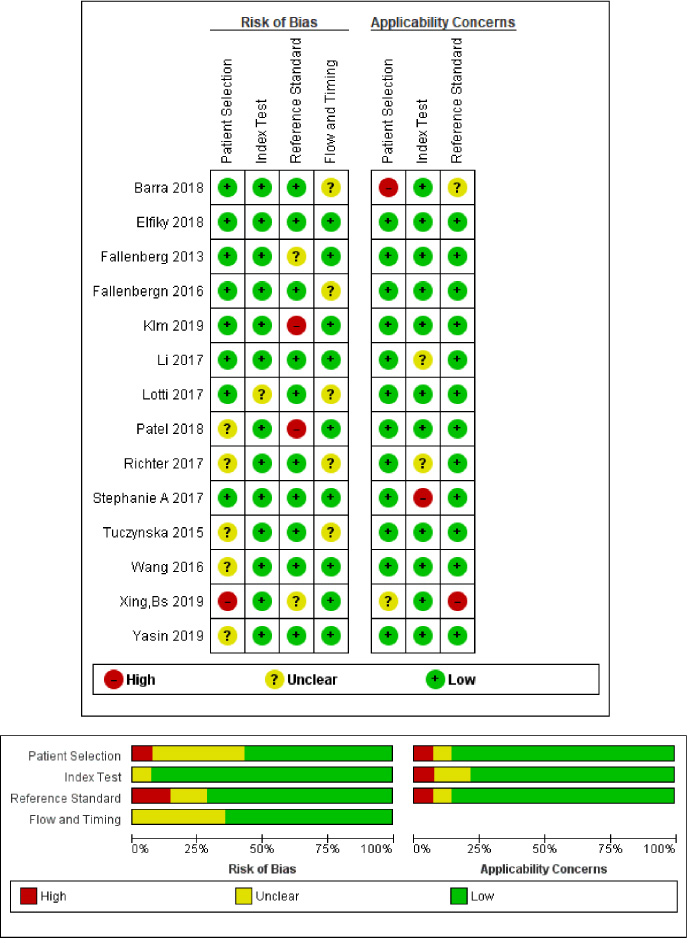
QUADS-2 diagram for publication bias.
In total, ten studies were prospective and four studies were retrospective. For CEM and CEMRI, the combined sensitivities for the prospective studies were 0.94 (93–96) and 0.93 (91–95) with a 95% confidence interval) and for the retrospective ones were 0.96 (0.93–0.0.98) and 0.94 (0.91–0.97) with a 95% confidence interval), respectively, but there was no significant difference between the subgroups and it was equal to p = 0.64. However, for CEM and CEMRI the combined specificities for the prospective studies were 0.85 (0.83–0.88) and 0.80 (77–83) with a 95% confidence interval) and for the retrospective ones were 0.56 (0.50–0.62) and 0.40 (0.34–0.47) with a 95% confidence interval) and the difference between the subgroups was equal to p = 0.48.
Discussion
CEM is similar to MRI because it uses contrast enhancement to detect malignancies. This involves achieving two images of each view at different energies, one low-energy image and one high-energy image, both after the intravenous (IV) administration of iodinated contrast. Low-energy images use an X-ray spectrum below the k-edge of iodine and the resulting images provide a standard mammogram, with no evidence of contrast enhancement. High-energy images use X-rays almost above the k-edge of iodine, showing areas that take up the iodinated contrast. Subtracting these two images then creates an image that shows only contrast-enhanced structures. The total radiation dose of the CESM test is approximately 20–80% higher than a standard mammogram [56–58]. One of the major advantages of CESM over MRI is that the radiologist can directly associate enhancement areas with findings observed in mammography such as masses, asymmetries, or architectural distortion. This, along with encouraging clinical performance, low cost, rapid access and easy integration into the operation, as well as no need to schedule according to the menstrual cycle, and with no risk for claustrophobia may make CESM a useful alternative for breast cancer screening, especially in women with dense breast tissue and at moderate to high risk of breast cancer, who due to contraindications for testing, lack of insurance coverage or lack of access to MR, cannot get a breast MRI [59,60]. Meanwhile, it must be considered that CESM has some disadvantages such as more irradiation (which can be a problem for high-risk women), and iodine injection (which can be a problem for allergic reactions and/or in case of renal insufficiency). On the other hand some lesions are not accessible to mammography, as the axillary area which is not correctly explored, or the lesions are very peripheral. The total radiation dose of the CESM test is approximately 20–80% higher than a standard mammogram [56,57]. The overall sensitivity and specificity of CESM in diagnosis of breast lesions in the present study were 95% and 78%, respectively, with higher sensitivity and lower specificity for retrospective studies (96% versus 94%) and (56% versus 85%), respectively. In their meta-analysis, Zhang et al reported a 75% sensitivity and a 71% specificity for mammography without using contrast in the diagnosis of breast cancer [61]. Another recent meta-analysis performed by Zhou et al. showed an 89% sensitivity and an 84% specificity for CESM in the diagnosis of breast cancer [62]. CESM demonstrates the angiogenesis of breast cancer by tracking the iodine-based contrast agent uptake in breast tissues, similar to CEMRI, which detects angiogenesis by uptake of gadolinium contrast agent in breast tissues [63]. Both CESM and CEMRI can enhance and diagnose occult cancer caused by tumor angiogenesis [64]. Both imaging methods are based on the enhancement of malignant lesions after intravenous contrast agent administration due to the presence of more and larger vessels with greater permeability to the vascular space [65]. However, neo-angiogenesis varies according to the type of malignancy and is more important in IDC, and is not always present in DCIS and lobular carcinoma [66]. Therefore, the additional benefits of CESM and CEMRI in detecting DCIS or suspicious micro-calcifications are unclear. There are only a few studies that have reported an increase in DCIS in CESM or CEMRI [67]. The overall sensitivity and specificity of CEMRI in the present study were 94%, 71% with the higher sensitivity and lower specificity for retrospective studies (94% versus 93%) and (40% versus 80%), respectively. In their meta-analysis, Zhang et al reported a 92% sensitivity and a 70% specificity for MRI in the diagnosis of breast cancer [61]. Much of the sensitivity of MRI has been related to enhanced tumor gadolinium contrast due to increased blood supply from pathologic neo-angiogenesis. This increase in tumor vasculature may even be visible on MRI before the detectable mass can be detected in mammography, and allows MRI to detect cancer at an early stage compared to mammography, when used as an annual screening tool in high-risk women [68]. Despite its high sensitivity, MRI has drawbacks. MRI is an expensive and time-consuming imaging study that is much less accessible than mammography. In addition, many patients, including patients with claustrophobia, pacemakers or some metal implants, may be excluded from MRI imaging. Although shortened breast MRI has been the focus of attention due to the short duration of its acquisition with non- inferior performance in breast MRI, the complete MRI protocol still has challenges that include false positives, access and implementation [69–71]. CEM overcomes many limitations of MRI. The cost of a CEM is much lower than an MRI. Studies show that CEM has shorter test time than MRI, so more study slots can be offered to patients. CEM does not require a pre-certification process, especially before a cancer is diagnosed, thus increasing access to CEM. CEM can be recommended to patients who have MRI contraindications (with pacemakers, claustrophobia, etc.). Overall, CEM appears to be a more affordable, efficient, and accessible alternative to MRI. CEM can be easily entered as a next step for diagnosis and when conventional digital mammography and ultrasound are inconclusive for suspicious findings. The limitation of this review is that the researchers included a combination of retrospective and prospective studies, and that these studies were heterogeneous for eligibility of included patients.
Conclusion
Contrast-enhanced spectral mammography, a combination of high energy image and low energy image, can well display breast lesions and has the diagnostic efficacy equivalent to MRI. Importantly, CEM imaging shows higher specificity, positive predictive value, and diagnostic conformance rate than MRI. Despite some drawbacks such as higher irradiation and iodine usage, CEM has such advantages as convenient and fast examination, strong applicability, and low costs; thus, it can be popularized as a useful tool in breast disease.
Footnotes
Acknowledgements
Not applicable.
Conflict of interests
None of the authors has any conflict of interest to disclose.
Abbreviations
Contrast-enhanced mammography (CEM), Contrast-enhanced magnetic resonance imaging (CEMRI), sensitivity (SEN), specificity (SPE), positive likelihood ratio (LR+) and negative likelihood ratio (LR−), Positive predictive value (PPV), Negative predictive value (NPV).