
Abstract
BACKGROUND:
Hormone-receptor-negative breast carcinoma (HRNBC), including triple-negative and HER-2 amplified tumors, can overexpress P16INK4a with substantial contribution to tumor progression. In nonneoplastic cells, P16INK4a mediates growth arrest and senescence secondary to cytotoxic compounds.
OBJECTIVE:
We assessed the impact of neoadjuvant chemotherapy (NAC) on P16INK4a expression in breast specimens.
METHODS:
P16INK4a and CD-44 were evaluated by immunohistochemistry in biopsies and subsequent post-NAC excision in a cohort of 27 women with HRNBC. Positivity was estimated on hotspots of tissue available by calculating cellular densities in nonneoplastic tissues with a low proliferation rate (Ki-67 < 1%) and tumor percentage using ImageJ 1.51t (National Institutes of Health, USA).
RESULTS:
Pre-NAC P16INK4a and CD-44 tumor expression were similar between the complete (n = 15) and incomplete (n = 12) response groups. Residual HRNBCs exhibited decreased immunoreactivity for P16INK4a, while the expression of CD-44 increased (n = 10, P < 0.05). The magnitude of change correlated with the baseline expression (r = 0.37, P16; r = −0.85, CD-44). Post-NAC nonneoplastic mammary duct and lobular epithelia, perilobular stroma, and adipose tissue, but not peritumoral stroma, accumulated P16INK4a(+) cells. The post-NAC cellular density change was more significant in epithelia of patients with high P16INK4a(+) baseline (r = 0.86, P < 0.0001) and those with a complete pathologic response (n = 14, P < 0.05). All tumors beds with complete treatment effect showed diffuse P16INK4a positivity.
CONCLUSION:
NAC induced the accumulation of P16INK4a(+)cells in nonneoplastic breast tissues more pronounced in patients with a complete pathologic response. Therapy-induced senescence is a potential marker of bystander damage due to NAC. P16INK4a loss and CD-44 gain may represent a phenotype of chemoresistance in residual HRNBCs.
Introduction
The tumor suppressor protein p16INK4a, also known as P16, is a key regulator of the cell cycle that blocks the transition from G1 phase to S phase by suppressing the cyclin-dependent kinase (Cdk)-4 activity. The expression of P16 is triggered by cell injury, including DNA damage, oncogene activation, mitochondrial dysfunction, and reactive oxidative species [1]. Persistent elevation of P16 levels and activation of its downstream effectors, including the retinoblastoma (Rb) protein, can induce cellular senescence, which is now considered an essential mechanism to prevent carcinogenesis [2]. Thus, cytotoxic compounds and radiation therapy can lead to the accumulation of nonneoplastic P16-expressing cells, a phenomenon named therapy-induced senescence (TIS). Despite that the expression of P16 in the context of cellular senescence serves as an evolutionary mechanism for protecting against the development of cancer by means of irreversible growth arrest of cells harboring pro-oncogenic mutations, TIS in bystander healthy tissues may not be beneficial as it is thought to promote tumor relapse, secondary tumors, and tissue degeneration by the development of an inflammatory microenvironment [2,3].
On the other end of the spectrum, downregulation of P16 by homozygous gene deletion, mutations leading to block of transcription or early protein degradation, promoter hypermethylation, or translational suppression, can lead to the development of malignancies by allowing the replication of cells with oncogenic mutations [4]. However, the role of P16 expression in the biology of some tumors has not been fully elucidated. For instance, cancers with Rb loss or inactivation exhibit a compensatory upregulation of P16 while they still maintain a high proliferative capacity [4]. These abnormalities of the P16/Rb pathway have been implicated in the progression of breast cancer [5,6]. Breast cancer comprises heterogeneous subtypes with significant biologic and clinical differences. High-grade breast tumors include carcinomas with a basal phenotype lacking the expression of hormone receptors (i.e., estrogen and progesterone receptors, ER and PR), increased proliferative activity, broad genetic heterogeneity, decreased survival and higher rates of recurrence after chemotherapy [6]. Hormone-receptor-negative breast cancers (HRNBCs), including triple-negative (TNBC) and HER2-amplified breast cancers, are more likely to be dysfunctional in the P16/Rb pathway. TNBC can show diffuse nuclear and cytoplasmic expression of P16 in up to 70% of the cases, as demonstrated by immunohistochemistry [5]. Although the molecular effects of P16 overexpression in breast cancer are still unclear, an intracellular concentration of P16 higher than physiological may interfere with cell migration and promote apoptosis contributing substantially to tumor phenotypes [4]. This overexpression of P16 appears to retain some tumor suppressor effects as demonstrated by a better survival of patients harboring P16 positive tumors as compared to those with P16 negativity [6–8].
Our knowledge regarding the temporal dynamics of P16 expression in neoplastic and nonneoplastic tissues is minimal. In this study, we aimed to assess by immunohistochemistry the effects of neoadjuvant chemotherapy (NAC) on the expression of P16 in residual HRNBCs. Normal mammary ducts and lobules, as well as adipose tissue, were also evaluated, using P16 as a surrogate marker of TIS in healthy tissues.
Methods
Case selection
Archived breast biopsies and subsequent surgical resection specimens for the past ten years were reviewed retrospectively. Inclusion criteria comprised patients with intermediate or high grade (Nottingham Score: 2 and 3) HRNBC of no special type who were treated with NAC followed by mastectomy. Receptor (ER or PR) positive tumors were excluded. TNBCs and HER2 (+) positive tumors were included. Pre-NAC versus post-NAC tumor size change (%) was estimated on radiologic studies. The patients were divided into two groups according to the radiologic and pathologic response. The complete response group included those with 100% size reduction on imaging studies and no residual tumor in pathologic examinations. The incomplete response group included both tumors with no evidence of therapy-induced regression and those with residual tumoral cells. The Mount Sinai Medical Center Institutional Review Board approved this study.
Histologic evaluation
Post-NAC treatment effect was evaluated on hematoxylin and eosin-stained slides. The pathologic response was graded as complete (no residual tumor found), incomplete (few residual tumor cells or clusters accompanied by treatment-related fibrosis or inflammation), and none (tumor present with no treatment-related fibrosis or inflammation).
Immunohistochemistry
Immunohistochemical studies were performed on formalin-fixed paraffin-embedded tissue using the primary antibodies P16 and CD-44 (CINtec® and SP37, respectively, Ventana Medical Systems, AZ, USA); according to a previously validated in-house protocol using a Ventana Benchmark automated slide stainer. UltraView Universal DAB Kit (Ventana Medical Systems, Tucson, AZ, USA) and OptiView DAB IHC Kit were used as detection systems for CD-44 and P16, respectively. Appropriate positive and negative controls were run simultaneously.
Marker expression quantification
Tumor positivity for P16 (moderate to strong nuclear and cytoplasmic staining) and CD-44 (membranous staining) was estimated as the percentage of total tumor present. For nonneoplastic tissues, the density of P16+-cells was calculated using ImageJ (V1.51t, National Institutes of Health, Bethesda, MD, USA) on captured and scaled images from four fields showing highest positivity (hotspots). Adipocytes, breast epithelium, and perilobular stromal cells were evaluated away from the tumor bed in areas with a very low proliferation index (ki-67 ≤ 1%), and excluding fat necrosis, inflammation, and degenerative lesions.
Statistical analysis
Percentage and cellular density were compared using paired, and unpaired t-tests and Pearson correlation performed on GraphPad Prism® (V6; GraphPad Software Inc, La Jolla, CA, USA). The results are shown as the mean ± SD or ± SEM. Statistical significance was determined using two-sided or one-sided P-values less than 0.05 depending on the variable and hypothesis under consideration.
Results
Patient characteristics
The cohort comprises twenty-seven women with HRNBCs, fifteen in the complete response group, and twelve in the incomplete response group, Table 1. The incomplete response group included three patients that showed no tumor regression either radiologically or pathologically. The mean age in the incomplete response group was 59.25 years (49–74, range) and in the complete response group was 45.73 years (26–74, range), a significant difference (P < 0.01). Tumor size at presentation was comparable in both groups (2.99 cm ± 1.96, SD, complete group vs. 2.78 cm ± 1.38, SD, incomplete group P ≥ 0.05). Seventeen patients with TNBCs (9 in the complete and 8 in the incomplete response group), and ten patients with Her-2 (+) positive tumors (6 in the complete and 4 in the incomplete response group) were included for the analysis. Additional patient characteristics, including percentages of pre-NAC tumor Ki-67, CD-44 and P16 positivity, and NAC regimens, are provided in table 1. Tumor size decreased by 50% on average (↑66.7%-↓98%, range) in the incomplete response group.
Patient’s characteristics including tumor phenotype, radiologic and pathologic response, baseline (pre-chemotherapy) positivity for Ki-67, P16 and CD44, and therapeutic regimens
Patient’s characteristics including tumor phenotype, radiologic and pathologic response, baseline (pre-chemotherapy) positivity for Ki-67, P16 and CD44, and therapeutic regimens
NA: tissue blocks not available. TNBC: triple negative breast cancer.
The baseline tumor expression of P16, CD-44, and Ki-67 were similar between the complete and incomplete response groups (P16: 69.5 ± 37.9% vs. 84 ± 18.9%; CD-44: 38.1 ± 35.1% vs. 37.6 ± 34.9%, Ki-67 mean: 62.5 ± 34.2% vs. 70 ± 15.9%, respectively, mean ± SD, P ≥ 0.05), Table 1. Tissue was available in twenty-one cases for the evaluation of P16 and CD-44 tumor expression. All pre-NAC HRNBCs (n = 21, 100%) showed a strong nuclear and cytoplasmic P16 expression in variable proportions, Table 1. Ten cases with residual tumors were available for matched pair comparison (pre-NAC vs. post-NAC) (Fig. 1). Independently of the baseline expression, the percentage of cancer cells showing P16 positivity trended to decrease in residual HRNBCs. The mean percentage of post-NAC P16 positivity was 64% (±13.4, SEM), which was lower than the pre-NAC P16 positivity (86 ± 6%, mean of differences: −22 ± 9.97%, one-tailed P < 0.05, paired t-test). Five out of ten tumors showed decreased P16 expression, while five tumors showed no change. Arima Y. et al. demonstrated that the expression of P16 correlates with changes in the expression of CD-44 in an in vitro model [9]. At this point of the study, we decided to incorporate CD-44 as a tumor marker of resistance to chemotherapy. The mean percentage of CD-44 expression in post-NAC residual HNBCs was 83.5% (±8.09, SEM), which was significantly higher than the pre-NAC CD-44 expression (37.6 ± 11.05%, mean of differences: 45.90 ± 13.7, one-tailed P < 0.05, paired t-test). Eight out of ten cases showed an increment in the percentage of CD-44+ cancer cells, while only one case with high CD-44 baseline expression showed downregulation (Fig. 1). The direction of expression change appeared to correlate with pre-NAC baseline levels for CD-44 (r = −0.85, Pearson Correlation, P < 0.01) but not for P16 (r = 0.37, P ≥ 0.05). Although there was a tendency to lose P16 and gain CD-44, the proportion of P16 loss did not correlate with the total percentage of CD-44 gain (r = 0.47, P ≥ 0.05).
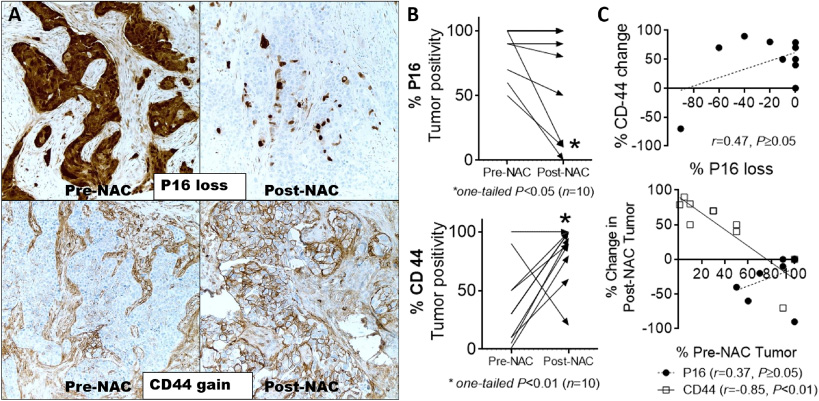
Effect of neoadjuvant chemotherapy (NAC) on the expression of P16 and CD-44 in residual hormone-receptor-negative breast cancers (HRNBCs). A. Representative microphotographs of pre- vs. post-NAC immunostains showing loss of P16 and gain of CD-44 (magnification: 400×). B. Residual HRNBCs presented with loss of P16 expression (5/10, top), while the expression of CD-44 increased (8/10, bottom) (arrow: direction of expression change). C. The percentage of P16 loss did not correlate with a proportional change in CD-44 expression (top). Post-NAC tumor positivity correlated with the pre-NAC expression for CD-44 but not with P16 (bottom).
Fourteen cases had an adequate amount of nonneoplastic breast epithelia in both pre-NAC and post-NAC samples for matched-pair analysis (six incomplete response and eight complete response), nine cases had post-NAC samples only, and one case had a pre-NAC sample only (Fig. 2). In unpaired analysis (n = 24), the density of P16+-epithelial cells was significantly higher in the post-NAC breast epithelia as compared with pre-NAC P16 baseline positivity (14.23 ± 4.7 [SEM] P16+ cells/total epithelial cells/μm2 ×10−6, pre-NAC vs. 55.28 ± 12.45 P16+ cells/total epithelial cells/μm2 ×10−6, post-NAC; difference between means: 41.05 ± 14.51, P < 0.01, unpaired t-test). In paired analysis (n = 14), all cases showed a significant tendency to accumulate P16 positive epithelial cells (16.28 ± 5.54 P16+ cells/total epithelial cells/μm2 ×10−6, pre-NAC vs. 54.76 ± 16.76 P16+ cells/total epithelial cells/μm2 ×10−6, post-NAC; difference between means: 38.48 ± 11.73, P < 0.01, paired t-test). The increment in P16 positive cells correlated with the pre-NAC cellular density (r = 0.868, Pearson correlation, P < 0.0001). The change was significantly wider in cases with a high pre-NAC P16 positivity. There was no significant correlation between patient age and pre-NAC P16 baseline positivity (r = 0.02, P ≥ 0.05) or the post-NAC P16+ cellular density change (r = −0.38, P ≥ 0.05). Furthermore, the change in the post-NAC density of P16 positive cells was higher in the complete response group as compared with the incomplete response (59.58 ± 16.58 P16+ cells/total epithelial cells/μm2 ×10−6 vs. 10.84 ± 7.3 P16+ cells/total epithelial cells/μ
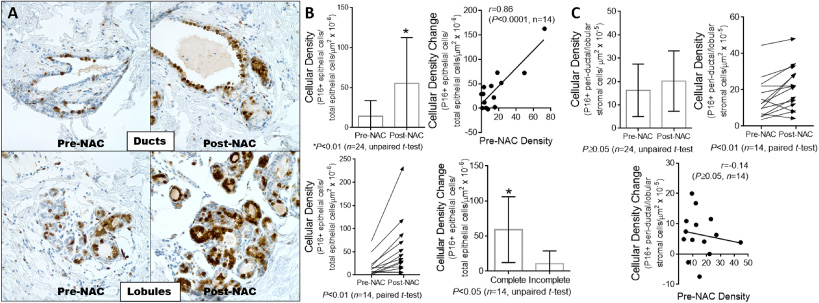
Neoadjuvant chemotherapy (NAC) caused the accumulation of P16 positive cells in the nonneoplastic breast ductal and lobular epithelia. A and B. Mammary ducts and lobules showing higher numbers of P16 positive epithelial cells after NAC in comparison with the pre-NAC baseline, significant in both paired (left bottom graph) and unpaired (left top graph) analyses (A: representative microphotographs of one case, magnification: 400×). The accumulation of P16 positive cells was more prominent in cases with a high pre-NAC P16 positive cellular density than in those with low pre-NAC P16 baseline (right top graph), and the change in cellular density was more accentuated in patients with complete pathological response (right bottom graph). C. The perilobular stroma showed a smaller increment in P16 positivity, significant in paired analysis (right top graph) but not in unpaired analysis (left top graph). In this case, the post-NAC change in the numbers of P16 positive cells did not correlate with the pre-NAC cellular density (middle bottom graph).
The perilobular stroma exhibited a small accumulation of P16+-cells, significant in paired analysis (15.36 ± 2.96 P16+ cells/μm2 ×10−6, pre-NAC vs. 21.78 ± 3.3 P16+ cells/μm2 ×10−6, post-NAC; difference between means: 6.42 ± 1.93, one-tailed P < 0.01, paired t-test) but not in unpaired analysis (16.24 ± 2.9 P16+ cells/μm2 ×10−6, pre-NAC vs. 20.19 ± 2.63 P16+ cells/μm2 ×10−6, post-NAC; difference between means: 3.95 ± 4.04, P ≥ 0.05, unpaired t-test) (Fig. 2). The adipose tissues away from tumor beds or areas of fat necrosis also contained higher amounts of P16 positive adipocytes in comparison with pre-NAC adipose tissue, significant in both paired (7.27 ± 1.62 P16+ cells/μm2 ×10−6, pre-NAC vs. 16.44 ± 2.47 P16+ cells/μm2 ×10−6, post-NAC; difference between means: 9.16 ± 2.96, one-tailed P < 0.0001, paired t-test) and unpaired analyses (7.64 ± 1.57 P16+ cells/μm2 ×10−6, pre-NAC vs. 15.51 ± 2.03 P16+ cells/μm2 ×10−6, post-NAC; difference between means: 7.86 ± 2.79, P < 0.01, unpaired t-test) (Fig. 3A and B). Contrary to what was observed in the breast epithelium, the increase in P16-positivity did not correlate with the pre-NAC P16 baseline density neither in perilobular stroma (r = −0.14) nor adipose tissues (r = 0.01). Additionally, P16 positivity in peritumoral stromal cells did not change after NAC (Fig. 3C and D). Pre-NAC densities of P16+-peritumoral cells between the complete and incomplete response groups were similar (46.64 ± 11.99 P16+ cells/μm2 ×10−6 vs. 62.44 ± 19.28 P16+ cells/μm2 ×10−6, P ≥ 0.05, unpaired t-test). The mean density of P16+-peritumoral cells did not change after NAC in unpaired (53.55 ± 10.60 P16+ cells/μm2 ×10−6, pre-NAC vs. 73.30 ± 25.01 P16+ cells/μm2 ×10−6, post-NAC; difference between means: 19.74 ± 24.24, P ≥ 0.05, unpaired t-test) or paired analysis restricted to seven residual tumors with well-demarcated peritumoral stroma (62.44 ± 19.28 P16+ cells/μm2 ×10−6, pre-NAC vs. 90.79 ± 37.35 P16+ cells/μm2 ×10−6, post-NAC; difference between means: 28.36 ± 39.9, one-tailed P < 0.0001, paired t-test). Stromal cells within fibrous tissue of tumor beds with treatment effect and no residual cancer cells showed diffuse P16 positivity in all cases (Fig. 4).
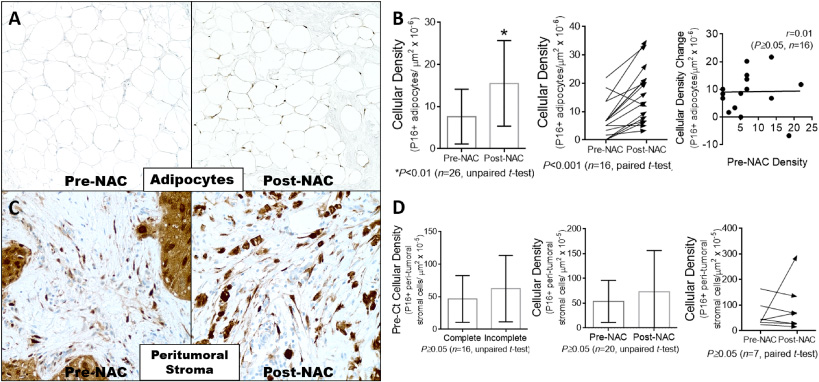
Neoadjuvant chemotherapy (NAC) caused the accumulation of P16 positive adipocytes but did not change the expression of P16 in peritumoral stromal cells. A. Representative microphotographs of one case showing significant post-NAC immunoreactivity for P16 in the adipose tissue away from the tumor bed (magnification: 200×). B. There was a tendency to accumulate P16 positive cells in the adipose tissue of post-NAC breast specimens, significant in unpaired (left graph) and paired (middle graph) analyses (arrow: expression change direction). The post-NAC change did not correlate with the pre-NAC cellular density (right graph). C. Representative microphotographs of one case showing similar pre-NAC and post-NAC immunoreactivity for P16 in the peritumoral stroma (magnification: 400×). D. The baseline pre-NAC cellular density of P16 positive cells was similar in the complete response group as compared to the incomplete response group (left graph). The peritumoral stroma showed nonsignificant changes in post-NAC P16 positivity as compared to pre-NAC baseline in neither unpaired (middle graph) nor paired (right graph) analyses.
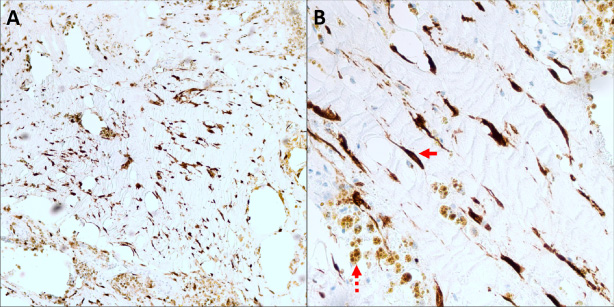
Chemotherapy-induced tumor regression was associated with diffuse immunoreactivity for P16 in stromal cells (continuous arrow) of tumors beds with no residual cancer cells. (Magnification: left, 100×; right, 400×). Dashed arrow: hemosiderin deposition.
Residual HRNBC can downregulate P16 while CD44 expression increases after NAC
NAC is a treatment modality for the management of early-stage TNBC and HER-2 amplified breast cancer. In contrast to adjuvant therapy, NAC allows observing the tumor response to NAC regimens. The presence of residual disease, as well as residual tumor burden, have been linked to a poorer prognosis in all breast cancer subtypes [10]. Several clinicopathological variables are currently used to predict recurrences and resistance to NAC [11]. For instance, disruption or inactivation of the P16/Rb pathway in pre-NAC breast tumors can predict the development of resistance to doxorubicin monotherapy or 5-fluorouracil and mitomycin [12]. The cohort included in our study comprised HRNBCs with alterations in the P16/Rb pathway, as shown by strong immunoreactivity to P16 antibodies. Thus, in agreement with previous reports [5,6], high-grade HRNBCs of no special type with high proliferative index showed a high baseline expression of P16. These tumors are likely to be associated with residual disease in post-NAC breast excisions, but the status of P16 expression in residual cancer cells has not been examined previously.
Herein, we found that some P16-expressing HRNBCs can lose or downregulate the expression of P16 in residual tumors following NAC. The significance of this finding is highlighted by the fact that silencing of the p16 mRNA in ER− negative/P16+ positive human breast cancer cell lines results in a markedly increased percentage of CD-44+ positive cancer cells with reduced chemosensitivity [9,13]. CD-44 is a multifunctional glycoprotein that acts primarily as a surface adhesion molecule able to bind many extracellular matrix ligands to promote the migration and invasion of cancer cells. Expression of CD-44 and its variants is mostly enriched in cancer cells endowed with cancer stem cell-like properties [14]. Moreover, the expression of P16 inversely correlates with CD-44 positivity in human breast cancer cell lines. CD-44 was included in our study to explore if P16 loss was part of a phenotypic change in response to NAC. Hence, the results showed that depletion of P16+ positive cancer cells was associated with a significant increment in the proportion of CD-44-expressing HRNBCs. This finding is suggestive of the acquisition of a chemotherapy-resistant cancer stem cell-like phenotype in residual tumors. In an in vitro model, depletion of P16 only decreased the sensitivity to paclitaxel- and cyclophosphamide-induced cell death. Furthermore, the proportion of P16−(negative)-cells in TNBC was an indicator for resistance to chemotherapy [9]. Loss of P16 could be one of the critical adaptive changes in residual HRNBCs that contribute to cancer cell survival after exposure to chemotherapeutic drugs, including paclitaxel, carboplatin, adriamycin, and cyclophosphamide. A limitation of our study is that the temporal dynamics on P16 tumor expression could not be evaluated in the group of complete response.
The mechanism of downregulation of P16 following NAC requires further study. The transition to a P16low/-∕CD − 44high/+ phenotype is probably a rapid adjustment triggered by cytotoxicity [9]. Direct protein-protein interactions between members of the P16/Rb pathway, and CD-44-dependent regulatory network have not been proven yet and may not be responsible for the phenotypic change. In a clinical research involving paired tumor samples from locally advanced breast cancer, widespread gene promoter methylation, including the promotor of CDKN2A (P16 coding gene), mediated acquired resistance to doxorubicin or 5-fluorouracil and mitomycin C [15]. Therefore, the post-NAC downregulation of P16 seen in HRNBCs is more likely to be an epigenetic phenomenon rather than a consequence of homozygous gene deletion or acquired mutations. Notwithstanding, it is possible that NAC can clear out more effectively P16-expressing cancer cells uncovering the presence of pre-existing P16− negative-cells.
Accumulation of P16-positive cells in the nonneoplastic breast after NAC is consistent with TIS
The meaning of P16 expression carries different connotations in healthy nonneoplastic tissues as compared with neoplasms. As it was shown above, malignant neoplasms such as HRNBCs can present with a characteristic high baseline expression of P16 along with a high proliferation index (P16+, ki − 67+/high) [4]. In this situation, the growth inhibition and cell cycle arrest effects of P16 are abolished despite its raised intracellular concentration. On the other hand, the activation of P16 pathway in normal tissues can lead to irreversible loss of replicative ability. Accordingly, P16 is a validated surrogate marker for senescence in nonneoplastic cells when it is accompanied by a very low proliferation index (P16+, ki − 67-/low) [1]. The evaluation of P16 immunostains in nonneoplastic breast compartments was restricted to non-proliferating tissues (ki-67 < 1%). Therefore, the higher post-NAC P16 immunoreactivity observed in mammary ducts and lobules, as well as adipocytes, can be attributed to TIS, a form of cellular senescence induced by cytotoxic compounds.
Our results showed that there is significant TIS in nonneoplastic cells within and away from tumor beds. TIS, P16 positivity, was broader in epithelial cells in comparison with adipocytes or perilobular stromal cells. Remarkably, cases with higher baseline P16 positivity in mammary epithelia displayed the largest accumulation of P16 positive cells following NAC. Although of unknown significance, this novel finding may be an indication of the vulnerability of epithelial cells to become senescent in response to cytotoxic injury. Current NAC protocols encompass chemical compounds that act preferentially on replicating cells; for that reason, epithelial cells, which bear higher physiological turnover rates in comparison to stromal cells or adipocytes, are more vulnerable. The increment in the density of P16 positive epithelial cells was also more accentuated in patients with HRNBCs that showed a complete response to neoadjuvant treatment. The accumulation rate of P16+ positive cells could be secondary to the efficacy of NAC treatments to generate genotoxicity (DNA damage). Therefore, pharmacokinetic and pharmacodynamic drug properties could have influenced the disparity on P16 positivity between responders and non-responders. The circumstances leading to an optimal drug action for clearing cancer cells could have also placed healthy epithelial cells in a state prone to cytotoxic injury. These findings can be translated into a new method to monitor the efficacy or toxicity of NAC regimens. For instance, monitoring the rate of induction of cellular senescence in nonneoplastic cells can be used as an indicator of the ability of cytotoxic compounds to cause cellular damage in specific patients, and in consequence, tumoral cytotoxicity. However, these conclusions remain speculative and require extensive research.
In summary, NAC regimens can downregulate the expression of P16 expression while they upregulate CD-44 in residual HRNBCs. This P16 negative/CD-44 positive phenotype should be further studied as a potential state of resistance to NAC. Furthermore, NAC was also associated with the accumulation of P16 positive cells in mammary epithelia, perilobular stroma, and adipose tissue, which was consistent with TIS. TIS is a biologic response of nonneoplastic healthy tissues that should be explored as a predictor marker of response to chemotherapy.
Footnotes
Acknowledgements
None to disclose.
Disclosure Statement
The authors have no conflicts of interest to declare.
Funding Sources
None to declare.
Author Contributions
C.A.F.A., L.H. and N.K. designed the study. C.A.F.A. wrote the manuscript, designed the tables and figures, and performed the statistical analysis. C.A.F.A., L.H., K.K. assessed the histology and immunohistochemical studies. R.P., N.K., and L.H. edited the manuscript. All authors collectively approved the final version of this manuscript.