
Abstract
Background
Dementia is a significant health concern among older people, necessitating an understanding of its spatial distribution and its ties to demographic and socioeconomic factors.
Objective
This study examines the spatial pattern of dementia mortality across U.S. counties and investigates its associations with relevant demographic and socioeconomic variables.
Methods
We analyzed 2019 county-level dementia mortality data for people aged 60 and older in U.S. counties. Using geospatial techniques, we examined the relationships between dementia mortality and pertinent demographic and socioeconomic factors. It is worth noting that 40.31% of the U.S. counties were dropped due to missing data.
Results
Dementia mortality rates varied geographically, with clusters of high rates in the South, Midwest, and Maine. Across the nation, the median income of a county was found to have a significant negative effect on dementia mortality, while the percentage of persons 60 years and older was positively associated in most areas except the West Coast. Race did not appear to be significantly associated in most areas but was found significant in the New England area and some counties in the Midwest. The percentage of rural population was also only significant in selected regions, mostly the Northeast and Florida.
Conclusions
This study highlights diverse links between dementia mortality and demographic and socioeconomic factors at the county level in the United States. Understanding these connections, considering spatial variations and scales, is crucial for tailored strategies to address dementia disparities nationwide. Geographically weighted models are valuable for analyzing such spatial data in future research.
Introduction
Dementia is one of the most prevalent illnesses in the older persons and a leading cause of impairment and death. Americans aged 65 and older are projected to grow from 58 million in 2021 to 88 million by 2050. In 2023, Alzheimer's disease (AD) is the seventh leading cause of death in the United States (US). 1 However, the diagnosis of AD and AD-related dementia (ADRD) is limited, and there are currently no cure approaches. Thus, it is critical to identify the factors associated with ADRD prevalence and mortality. Some previous studies investigated the impacts of different variables on rising dementia, reporting huge differences in dementia prevalence by population characteristics. Researchers recently pointed out that, compared to whites, Blacks had a higher dementia prevalence and were more likely to have comorbidities, such as hypertension and diabetes, that could increase the risk of developing dementia. 2 A systematic review and meta-analysis reported that the prevalence of dementia in populations who had a stroke was 30.8%, with a greater prevalence in people over 65. 3 Additionally, studies found that the prevalence of dementia was higher in females than males, and the prevalence increased with age. 4 In contrast, a higher income level and a healthier lifestyle can help to reduce its prevalence.5–7
With the high prevalence, dementia's mortality rate has also been a research focus. Researchers have paid keen attention to the relationships between dementia mortality and its influencing factors. A recent study concluded that as dementia prevalence declined, the mortality rate for people with dementia also declined during the study period from 2000 to 2016. 8 Another recent study presented a negative correlation between household size and dementia mortality rate. 9 Researchers analyzed correlations between age, sex, ethnicity, deprivation, geography, general practice (GP) contacts, and mortality rate. 10 Work has also been done to estimate the effect of dementia on survival in adults stratified by sex, education, and marital status. 11
Despite the extensive research on the determinants of dementia mortality, there is still a lack of understanding of the geographical variation of relationships between dementia mortality and health and socioeconomic factors across the US. By examining these factors and their influences spatially, we can better understand how they impact dementia mortality in different geographical contexts. Thus, geographical analyses of the relationships are crucial for identifying region-specific influences on dementia mortality rates, which can then inform targeted policy interventions and healthcare strategies. Recent studies show that despite the increasing applications of GIS/GPS methodologies in dementia care and research, there was still a significant gap in utilizing geospatial analysis for dementia care, risk factor analysis, and policy planning. 12 To address this gap, the present study aims to investigate the spatial variation of county-level demographic and socioeconomic factors associated with dementia mortality in the US. The study provides evidence of geographic disparity in dementia morality and offers spatially nuanced information that may support designing and implementing targeted policies at regional or local levels.
Two fundamental characteristics in spatially distributed phenomena are spatial autocorrelation and spatial heterogeneity. The former happens if a variable is correlated with itself over space. The latter happens when relationships between variables vary across geographic areas. For instance, the degree of association between dementia mortality and the percentage of rural population is insignificant in some counties but significant in some other counties. Even in those counties where the relationship is significant, the coefficients might be different. Geographically weighted regression (GWR) was developed in response to the spatial heterogeneity by developing local models for every case. The local models have identical model structure but each local has its own set of calibrated coefficients and respective p-values. Thus, GWR has been proven quite useful in studying spatially distributed relationships. Although the GWR model was used in several disease mortality studies, 13 only a few studies, 14 investigated the spatial variation of the relationships using the GWR model. However, each predictor variable might influence dementia mortality at different spatial scales as the underlying processes might be unique for every predictor in its association with dementia mortality. To the best of our knowledge, none of the previous studies considered the variability of spatial scales at which pertinent factors may influence Dementia mortality. Given the innate spatial nature of disease distribution and the diverse socioeconomic and demographic factors across U.S. counties, we used GWR to examine these potentially spatial heterogeneous relationships. Furthermore, the study considered the limitation of the GWR modeling approach that it assumes and examines all relationships at the same spatial scale. Due to the limitation, we recognize that the GWR model may not be reliable for examining a variety of conditional interactions since dementia is a complex and multifactorial health problem.15–18 Therefore, we also adopted the latest extension of the GWR model, the multi-scale GWR (MGWR) model, 19 to account for various conditional relationships by allowing each explanatory variable to be evaluated at a different spatial scale. By doing so, those associations will be investigated without limiting the analysis to be performed at fixed spatial scale.
The objectives of this research are twofold: (1) to examine and visualize the spatial variations of dementia mortality in the USA; (2) assess the associations of the demographic and socioeconomic factors with dementia mortality, controlling for health factors.
Methods
Data sources and representation assessment
The study collected data at the county level across the mainland of the US (states far from the mainland are excluded because of the data availability) and employed various spatial and statistical analysis techniques, including GIS, Moran's I test of spatial autocorrelation, GWR, and MGWR. Dementia mortality data at the county level were acquired from the Wide-ranging Online Data for Epidemiologic Research (WONDER), developed by the Centers for Disease Control and Prevention (CDC). Predictor factors, encompassing health-related, demographic, and socioeconomic factors, were obtained from the County Health Rankings & Roadmaps (CHRR) and the American Community Survey (ACS) data provided by the Census Bureau (Table 1). It is significant to mention that, due to the privacy policy from CDC WONDER, 40.31% of the counties (1307 counties) had missing dementia data, which we have dropped to avoid their impact in the analysis.
Predictor variables and data sources.
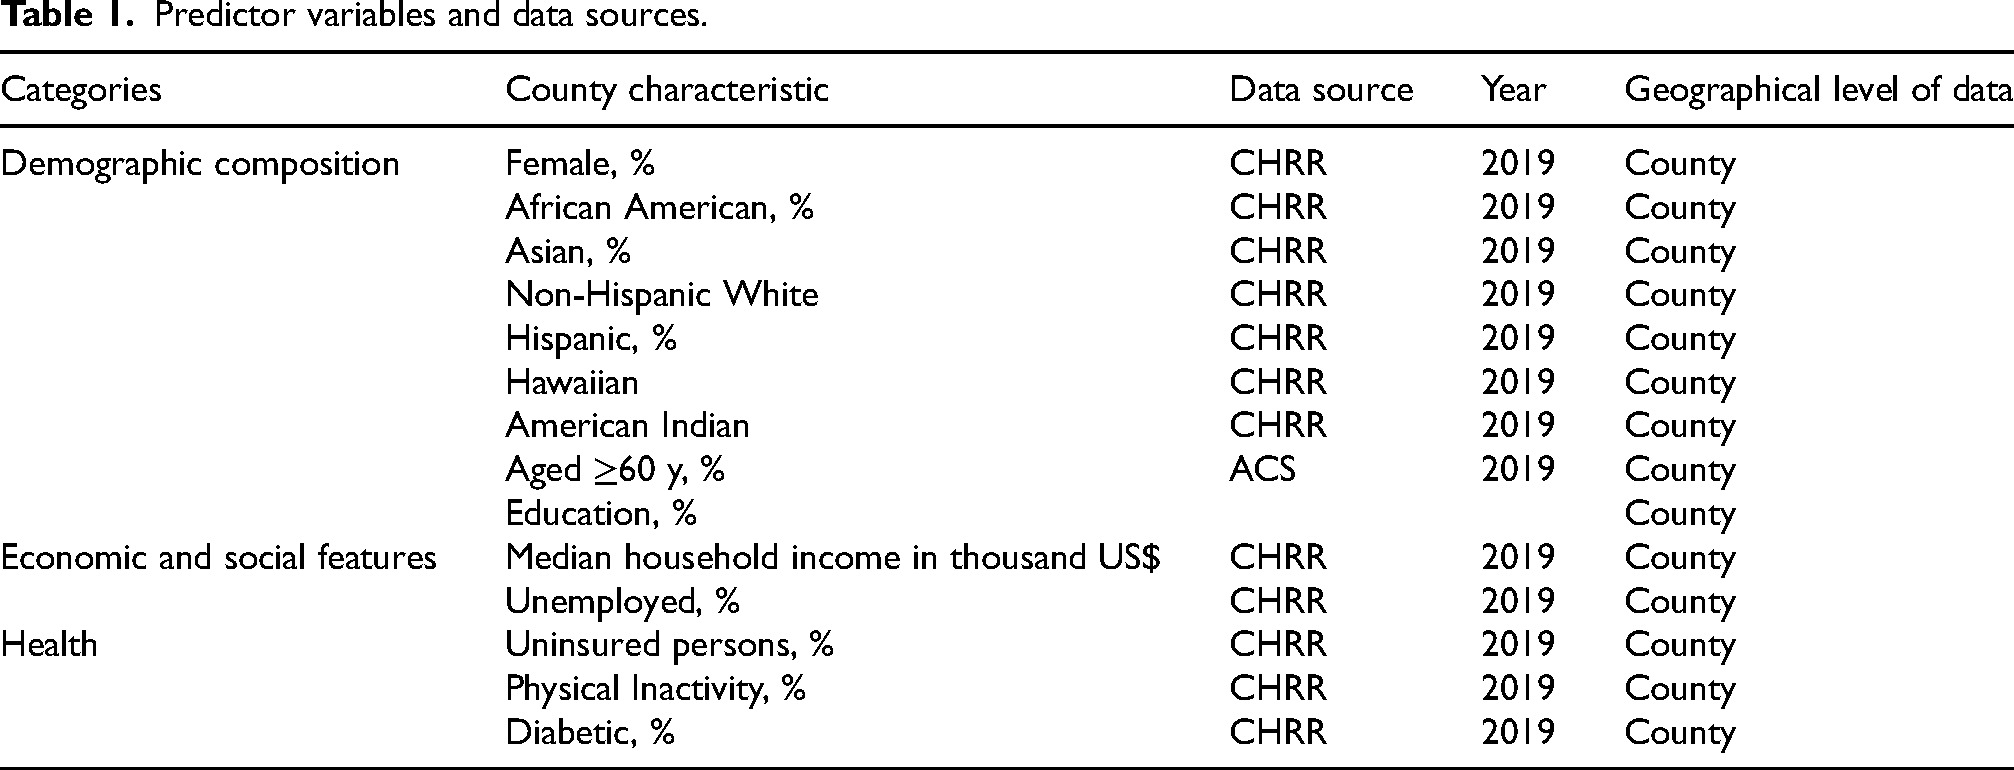
The crude rates of dementia mortality are only available for 1936 out of the 3142 U.S. counties from the CHRR data source. This study focuses on these 1936 counties, representing 61.6% of all US counties. To understand potential representation bias, we performed a Z-test for each predictor variable to compare the mean values of these 1936 counties with those of all US counties. The results are detailed in Supplementary Table 1. The analysis indicates that, at the significance level of 0.05, the average proportions of the white population and the Hispanic population in the study counties are not statistically different from those of all U.S. counties. Considering the significant representation of these demographic groups in the U.S. population, we deemed that the data at our disposal is suitable for the study. However, notable statistical differences exist in all other variables between the two sets of county data. Thus, we exercise caution in interpreting the findings emphasizing that they are based on the 1936 counties included in our study.
Measures
The identification of dementia-related deaths in this study relied on underlying causes categorized within the International Statistical Classification of Diseases and Related Health Problems, Tenth Revision (ICD-10) codes. These included unspecified dementia (F03), Alzheimer's disease (G30), vascular dementia (F01), and other degenerative diseases of the nervous system not elsewhere classified (G31). 20
The crude rates of dementia mortality were calculated as the ratio between the number of dementia-related mortalities within each county and the total population of that county and then multiplied by 10,000. Conversely, all other variables—socioeconomic, demographic, and health factors—were expressed as percentages. This involved dividing the data for each respective variable by the total county population. It is worth noting that the sole exception is the representation of median income data. Unlike the other variables, median household income for each county was presented in thousand US dollars, not as a percentage, due to its distinct nature.
Pre-screening predictors
To have a preliminary selection of predictors, we initially assess the correlation between mortality rates and all variables listed in Table 1. The outcomes are shown in the correlation matrix in Supplementary Figure 1. Only the variables demonstrating significant correlation with dementia mortality will be considered as predictors in the subsequent regression analysis. These variables include age 60+, education, physical inactivity, female, non-Hispanic white, Hispanic, Asian, American-Indian, African-American, diabetic, rural, unemployment, and median income. As some of these candidate predictors are significantly correlated, such as Education and Income, we need to exclude certain variables in regression analysis to prevent multicollinearity issues. Consequently, variables including unemployment, physical inactivity, education rate, female, Hispanic, Hawaiian, and American-Indian were excluded from the model to avoid multicollinearity. In addition, the variables for the African-American population and the uninsured population were removed due to their lack of significant correlation with the dependent variable (dementia crude rate). To account for local variation, we ran the GWR and MGWR models twice: initially including the African-American and uninsured population variables. After observing their insignificant results, we decided to exclude these variables and rerun the models. After this pre-screening, the predictor variables selected for subsequent regression analysis comprise measures for median income, rural, age upper 60, Diabetics, Asian, and non-Hispanic white.
Statistical analysis and modeling
The analysis began with exploratory spatial data analysis (ESDA) to assess the spatial clustering patterns of the data and detect any spatial autocorrelation. ArcGIS Pro Spatial Statistics tools were utilized to generate the Getis-Ord Gi* statistic. The results reveal regions characterized by dementia mortality hotspots (areas with high values) and cold spots (areas with low values).
The study employed three regression modeling approaches to examine the relationships between dementia mortality rates and predictor variables in the ArcGIS Pro software environment, each corresponding to different assumptions and considerations. The first approach is the ordinary least square (OLS) model, a conventional linear regression technique without considering spatial properties. A Moran's I test was conducted to examine the spatial autocorrelation in the residuals of the OLS model. The result indicated the presence of spatial autocorrelation. This necessitated consideration of the potential spatial dependence of variables and spatially varying associations between them. Thus, the study adopted the geographically weighted regression (GWR) modeling approach 21 to examine the spatially varying relationships between dementia mortality and its predictors. This method is particularly advantageous for identifying local variations and spatial heterogeneity, which are critical for understanding the complex interplay of factors affecting dementia mortality at a county level. Thirdly, a multi-scale geographically weighted regression (MGWR) model was developed to relax constraints on a fixed spatial scale in analysis. The GWR estimates a unique set of regression coefficients for each county, considering the spatial heterogeneity of relationships between the dependent and predictor variables. The MGWR extends the GWR approach by allowing the examination of different spatial scales for different predictors. Finally, we visually presented the analysis results and examined the spatially varying relationships between dementia mortality rate and predictors.
The GWR models can produce a set of local parameter estimates (Eq. 1). For each data point, the GWR model will produce the local R2, the local residual, and the local coefficients. This helps to investigate the geographical variation of correlations between response and predictor variables. We use an adaptive kernel base to consider the spatially non-uniform distribution of the data. The GWR model may determine the optimal bandwidth using an adaptive bi-square kernel basis by iterating the number of nearest neighbors that must be included for the local regression model. The Akaike Information Criterion (AICc) score or the local information loss is minimized to find the ideal bandwidth.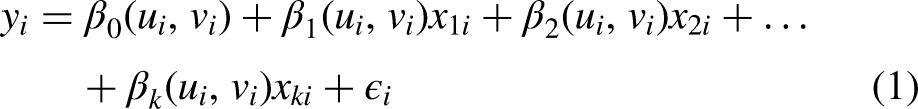
In an MGWR model, each predictor variable has its bandwidth.
23
As shown in Eq. (2), the MGWR model allows the bandwidth (and consequently, spatial scale) to be uniquely determined for each predictor variable.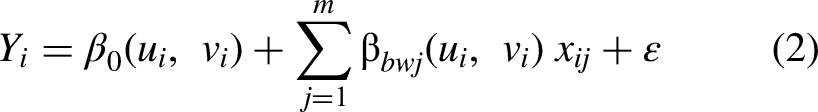
Results
Spatial distribution of dementia mortality
Dementia mortality rates exhibit significant disparities throughout the US. As depicted in Figure 1(a), a notable concentration of high mortality rates is observed in numerous counties across the eastern half of the country The spatial pattern analysis in this study confirms a clustering pattern of the dementia mortality crude rate in the US. Further analysis using the Getis-Ord Gi* Hot Spot analysis identifies distinct spatial clusters. Figure 1(a) shows elevated dementia mortality in the southern, midwestern, and Maine regions, while Figure 1(b) illustrates cold clusters characterized by lower dementia mortality rates along the West Coast, Northeast, and select areas along the South Coast.
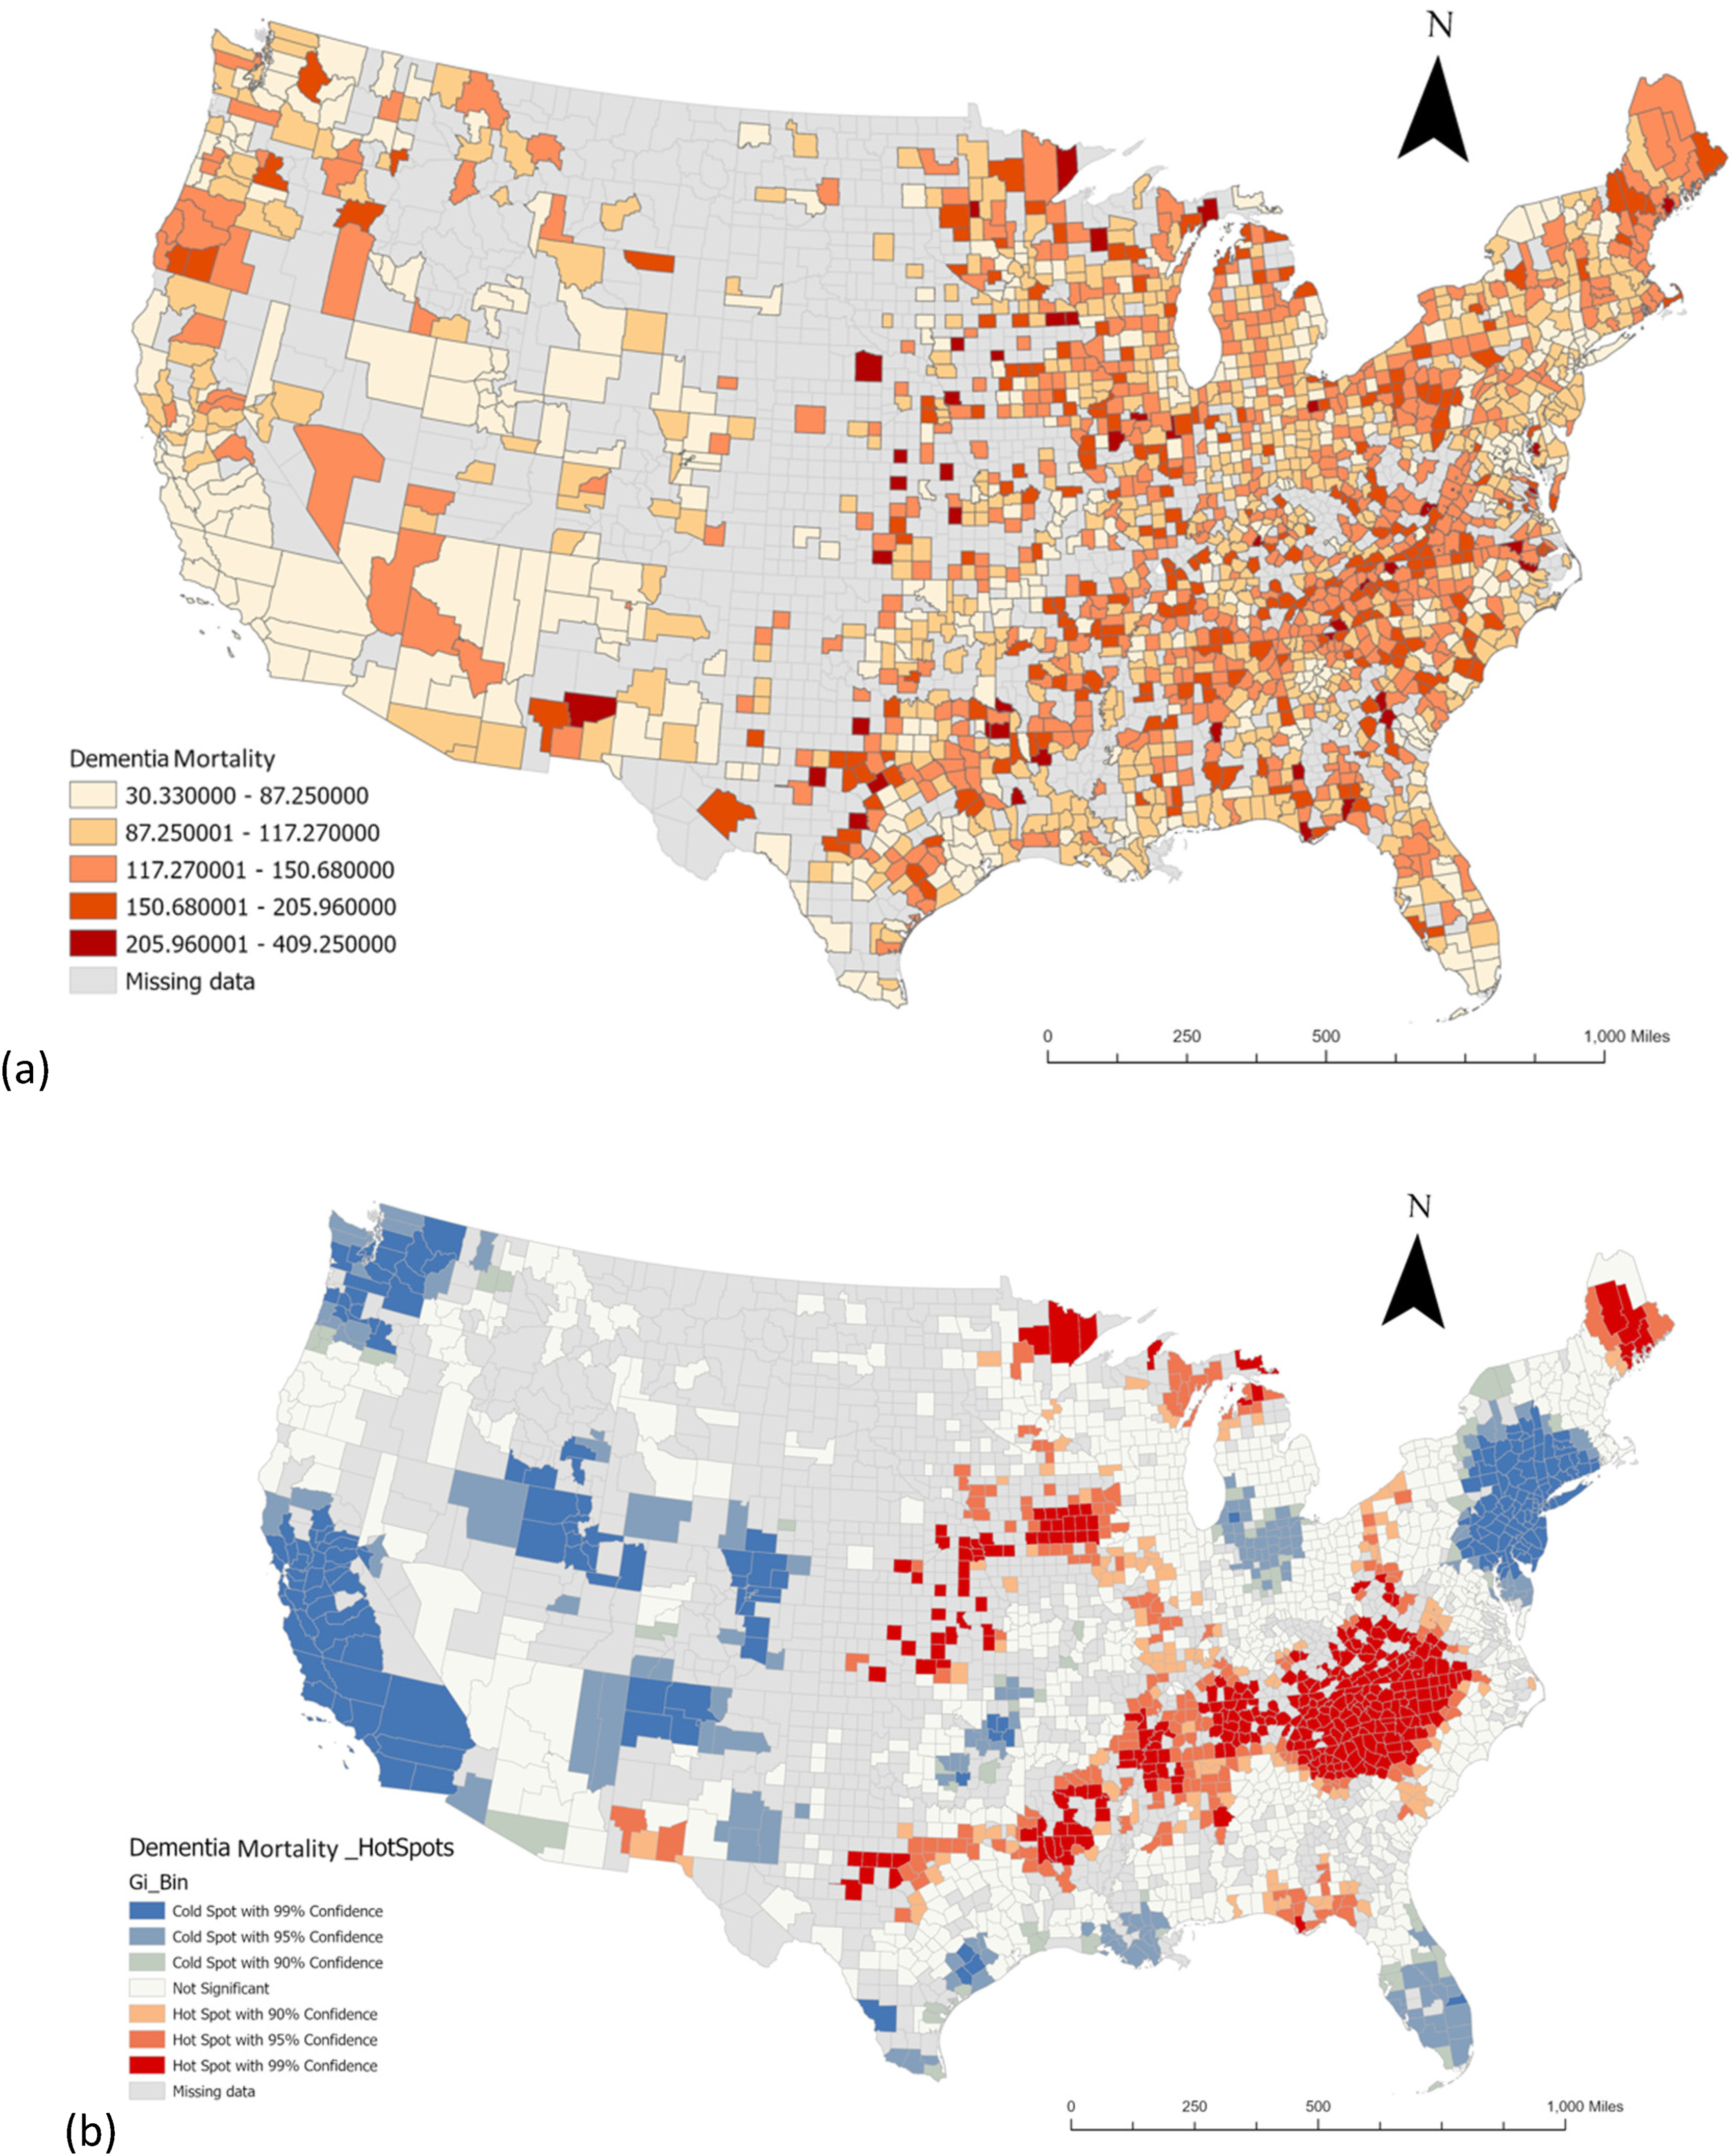
(a) Spatial distribution of dementia mortality; (b) geographical clusters of counties from Getis-Ord Gi* statistics of dementia mortality. As shown in each legend, counties with missing data are shaded to indicate they are excluded from the study.
Modeling results and interpretation
Table 2 presents a comparison of the performances of three models. It can be seen that both the GWR and MGWR models significantly outperform the conventional linear regression model, with the MGWR model exhibiting the highest performance. Thus, our ultimate choice is the MGWR model for two reasons. First, it yields the highest R2 and lowest AIC, indicating superior explanatory capability and overall model quality compared to the other models. Secondly, the MGWR model can unveil the distinct geographic scale of influence attributed to each predictor. More detailed results of the MGWR model will be presented and interpreted below.
Performance comparison of the three models.
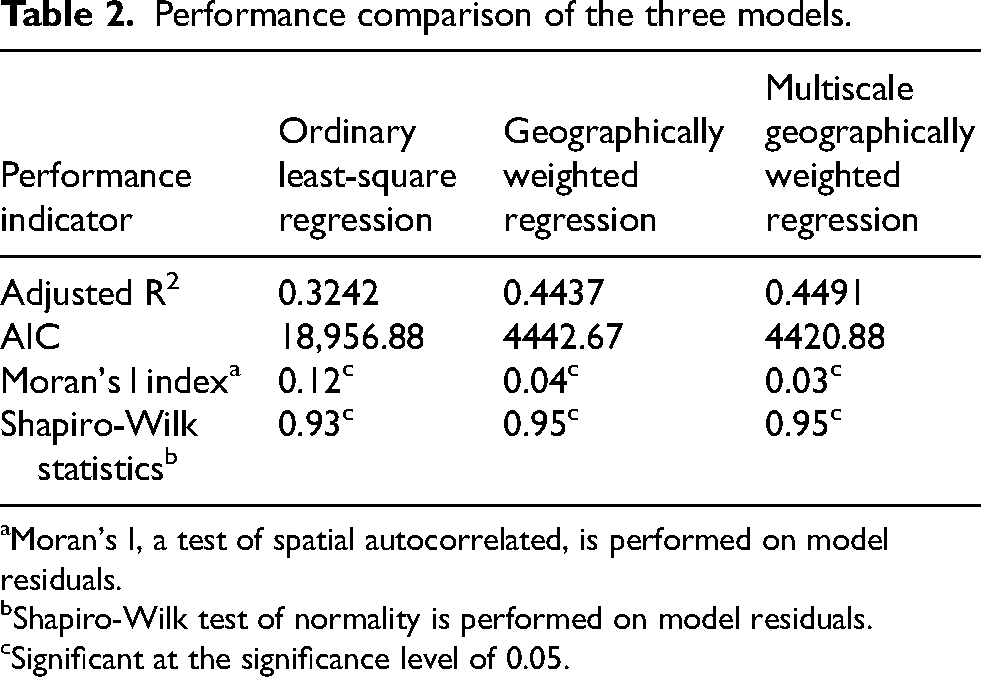
Moran's I, a test of spatial autocorrelated, is performed on model residuals.
Shapiro-Wilk test of normality is performed on model residuals.
Significant at the significance level of 0.05.
To further examine and compare the distribution model errors, we performed the Moran's I test to evaluate the spatial autocorrelation of model residuals, and the Shapiro-Wilk test to assess the normality of model residuals. The traditional OLS model residuals exhibited moderate spatial autocorrelation with Moran's I of 0.12. This was significantly reduced by the GWR model, of which the model residuals result in a Moran's I score of 0.04, suggesting that GWR model effectively reduced the clustering pattern of prediction errors. The MGWR model further refined the results, reducing Moran's I to 0.03 for the spatial autocorrelation test on model residuals. This indicates an even better fit, as MGWR adjusts bandwidths at different scales for different predictors, allowing for a more nuanced adaptation to spatial variations. In summary, residuals of all three models are found to show various levels of spatial autocorrelation and the level decrease in order from OLS to GWR and MGWR models. Non-normal distribution was also found for all three models according to the Shapiro-Wilk test results. Our interpretation is that the models aim to investigate relationships rather than predictions of mortality rates, and thus not all potentially significant explanatory variables are included in the study. The absence of those variables may account for much of the variations in model residuals.
Spatial scales of the associations between predictors and dementia mortality
The AICc method was utilized to optimize bandwidth selections for each independent variable in the MGWR model, employing a Gaussian weighting kernel. The resultant distance bands vary across various variables, highlighting the varied spatial scales at which these factors influence dementia mortality. Table 3 presents descriptive statistics of the coefficients associated with the predictors in the MGWR models. The second-last column in Table 3 reports the modeling results of the bandwidth associated with each variable. The reported numbers encompass include both the actual bandwidth (radius of the proximal area) identified for a predictor and the corresponding percentage of this bandwidth relative to the overall spatial extent of the study area, namely the US. This column illustrates variations in the spatial scales at which the predictors are associated with dementia mortality rates. Smaller distance bands signify and exhibit a more geographically localized influence. For instance, the Distance Band column indicates that the impact of Median Income operates globally, as the distance band corresponds to 100% of the study area, suggesting that median income exerts a consistent influence across all counties in the study. Conversely, other variables, such as Non-Hispanic White and Diabetic, with distance bands ranging from 13% to 15% of the spatial extent in the study area, exhibit a more localized influence. Notably, the percentage of the rural population shows a regional scale of influence, as identified with a distance band of about 33%, significantly impacting relatively smaller sections (1.50%) of the study area concerning dementia mortality rates. This analysis underscores the importance of considering spatial scales in understanding the varying impacts of different variables on dementia mortality.
Summary statistics for MGWR parameter estimates.
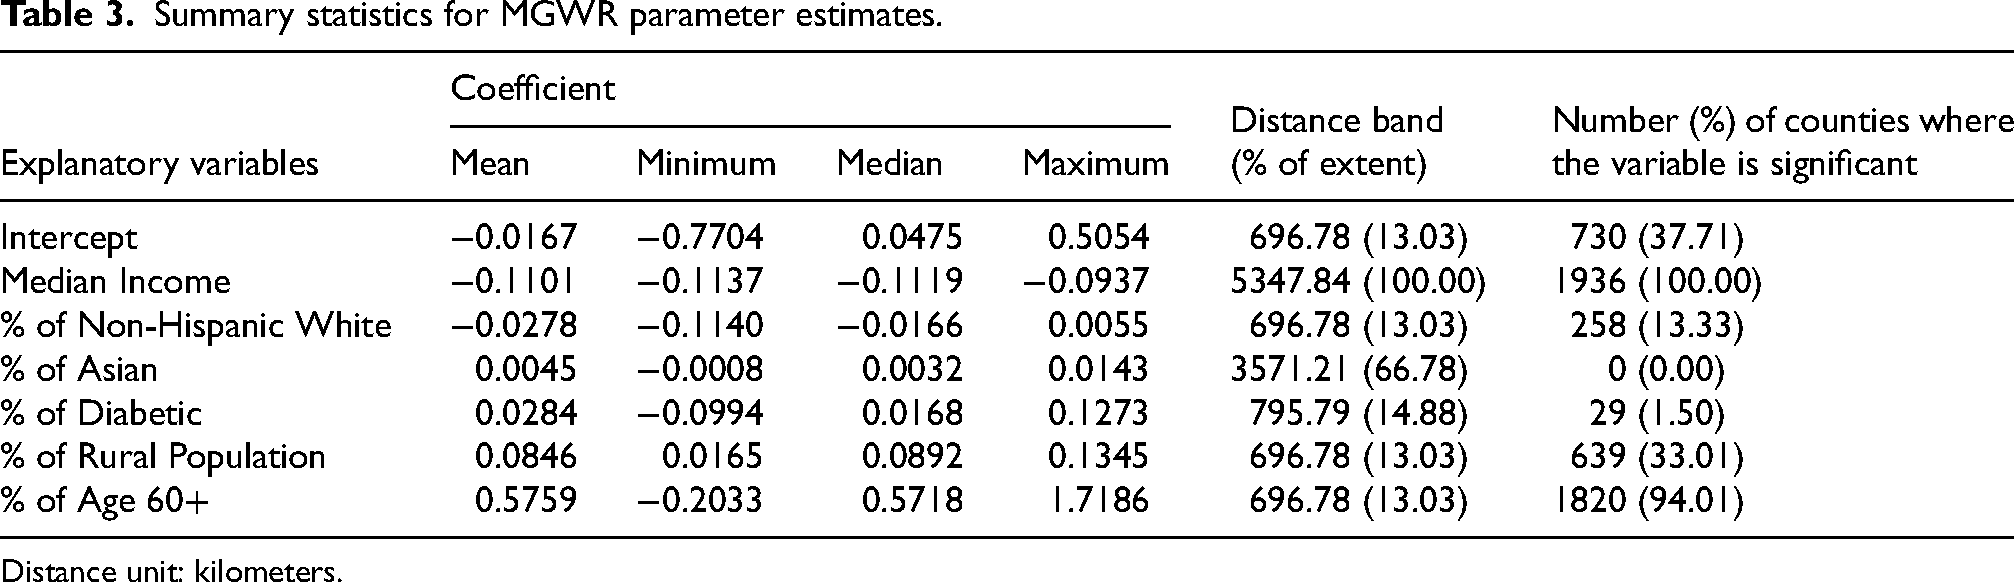
Distance unit: kilometers.
Spatial pattern of significant associations
Not all predictors exhibit a significant association with dementia mortality in all counties, and the level of association for each predictor also varies across different geographic areas. The last column of Table 2 displays the number and percentage of counties where each predictor has a statistically significant association with Dementia mortality. For instance, median income is statistically significant in all counties while the percentage of the older persons population is significant in most parts of the U.S. The specific areas of these associations are displayed in Figure 2. Regarding the predictor of median income, the study provides important insights into its association with dementia mortality. Firstly, it reveals a negative relationship between them, indicating that wealthier people are less likely to succumb to dementia compared to those with lower socioeconomic status. Unlike previous studies that did not find significant association between midlife income levels and dementia-related mortality.25,26 The result of this study illustrates that median income is significant across the entire study area supporting the earlier conclusion that its influence operates globally Figure 2(a). Figure 2(b) illustrates the spatial pattern of the association coefficient for the percentage of the older persons population. It generally confirms the findings in the literature regarding the positive relationship between aging and dementia crude rate. 3 However, this map shows a more nuanced picture of spatially varying relationships. The gray areas in Figure 2(b) indicate regions where the percentage of older persons people is not statistically significantly associated with the dementia mortality rate. Most counties are colored in green shades which indicate significant associations. Higher levels of association in the central and northeast regions. Figure 2(c) shows that the percentage of the white population is positively associated with dementia mortality in the northeastern tip of the country, encompassing Connecticut, Massachusetts, Vermont, New Hampshire, and the eastern part of New York. This confirms the findings in the previous study 27 which revealed that dementia mortality rates were higher in states with larger white populations compared to states with smaller white populations. This geographic variation suggests that there might be underlying factors, such as access to healthcare, socioeconomic status, and environmental influences, that contribute to the differences in dementia mortality rates among the white population across different regions. 27 In addition, it is also positively and significantly associated with dementia mortality in certain areas in the Southwest and the Midwest. A previous study identified a significant relationship between rural residence and dementia mortality rate. 28 Specifically, people with dementia living in rural areas were found to have nearly three times the risk of mortality compared to their urban counterparts. 28 This study confirms the finding of the previous studies that rurality is a significant factor in association with dementia mortality rate. However, this significance varies positively and negatively in different locations. Figure 2(d) shows that the rural population demonstrates a negative significance in northern states but a positive significance in isolated areas of Nebraska, Arizona, and Texas in the central region. Additionally, a positive association is observed in certain counties of Georgia, Florida, and Alabama in the southeast. The negative relationship in the northern states may be attributed to the higher healthcare accessibility.
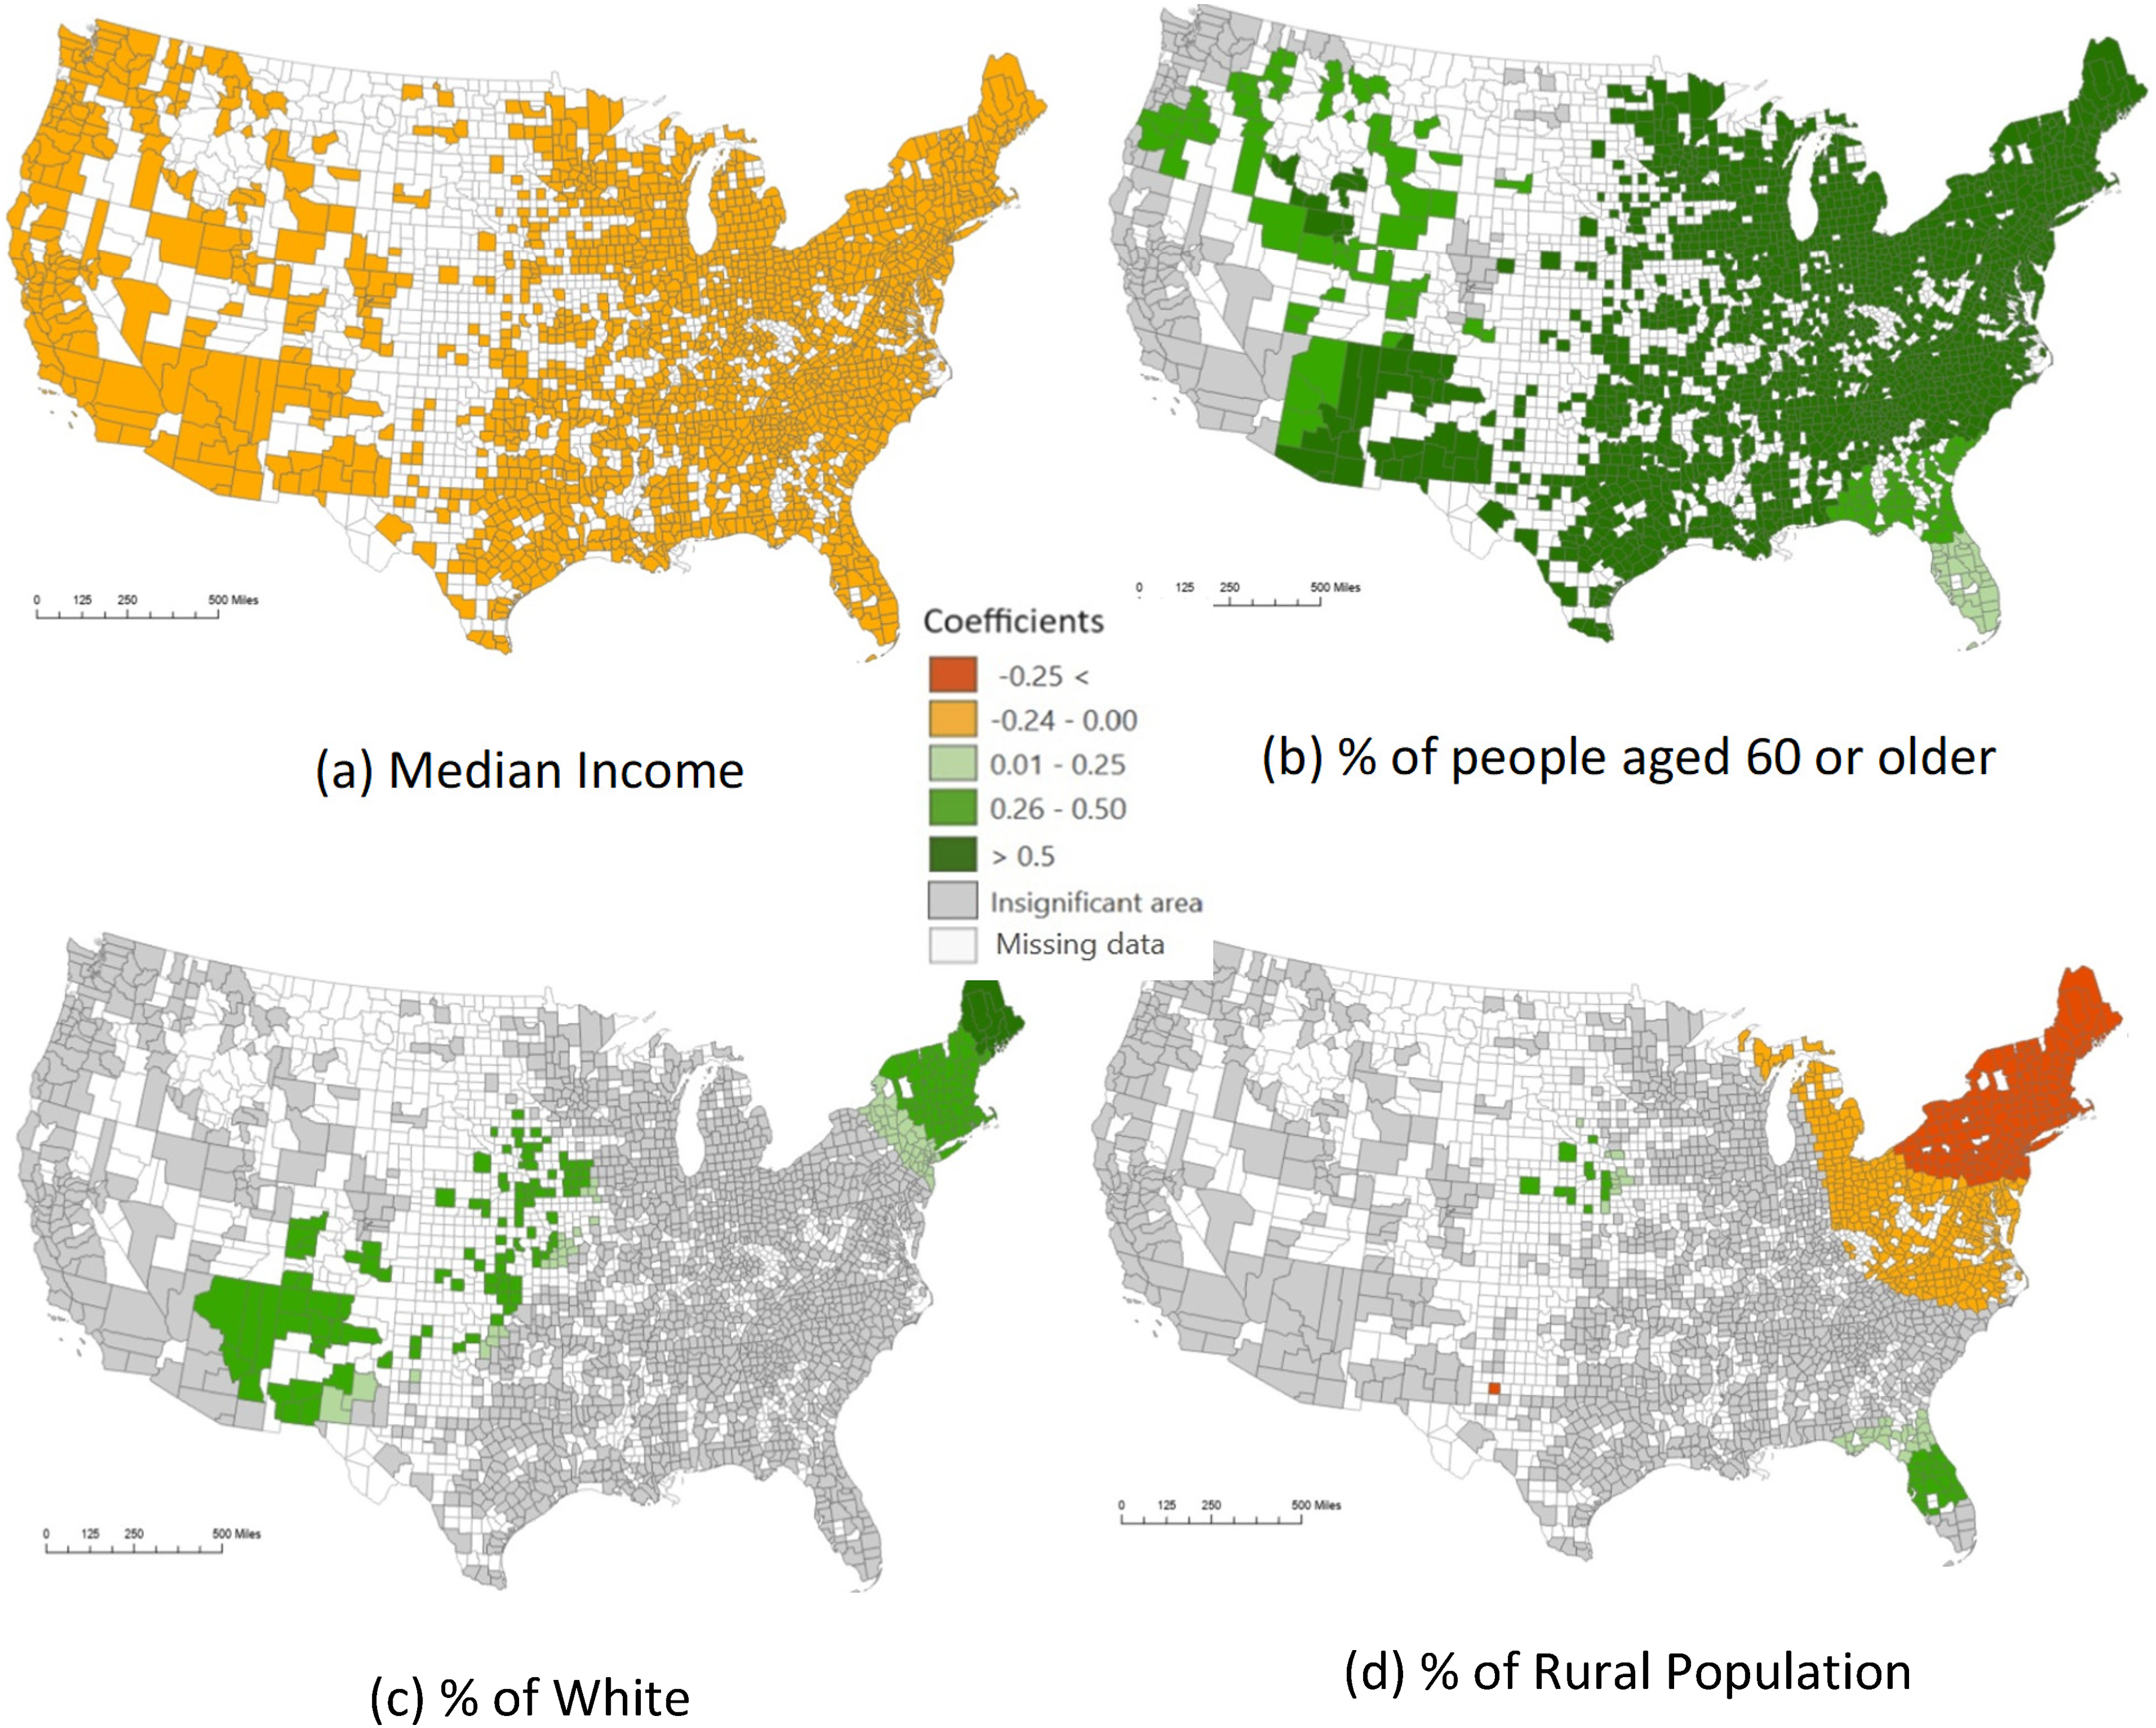
Significant areas and coefficients of predictors in the MGWR model.
On the other hand, the low explanatory power of the percentage of diabetics and Asians regarding dementia mortality is likely due to spatial heterogeneity and localized effects. The study found that while some variables, like median income, have a consistent influence across all regions, others, such as the percentage of diabetics and Asians, show significant associations only in localized areas. Additionally, the limited representation of Asians in many places and the complex interplay of various demographic, socioeconomic, and health factors further dilute the overall impact of these variables. Thus, their contributions to dementia mortality are not as evident on a broader, national scale, leading to lower explanatory power in the model.
Discussion
This study identifies demographic and socioeconomic predictor variables that exhibit significant associations with dementia mortality. Furthermore, the study unveils that these factors function at different spatial scales and manifest distinct effects across different US regions. The findings underscore the importance of taking into account the geographic context, including aspects like income level and demographic composition, when designing public health interventions aimed at reducing mortality associated with dementia.
The study constructed multi-scale local models to provide location-specific insights into the complex relationships between Dementia mortality rate and demographic and socioeconomic factors. The spatial scales range from the county level (local scale) to the national level (global scale) in the US, as ascertained by the modeling results. It means that some variables are significant in global scale like median income and some of them are significant on the local scale like rural population, age upper 60, Asian percentages, non-Hispanic White percentages, and diabetic percentages. The analysis highlights the importance of considering spatial heterogeneity and scale dependency when exploring these relationships. Specifically, we found that the median income and percentages of the older persons population, non-Hispanic white population, and rural population are important determinants of dementia mortality in various regions of the country. It is noteworthy that the influences of most determinants vary across different regions of the US, with stronger associations in certain areas than others. The sole exception is the income factor, which maintains a consistently high level of influence across the nation. These results can inform policymakers and health professionals in developing targeted interventions and policies to reduce the burden of dementia in different regions of the country. The study demonstrates that geospatial techniques are instrumental in analyzing spatial data for public health research.
The current investigation is subject to several limitations, indicating avenues for further research efforts. Firstly, the study only includes two-thirds of all US counties due to missing Dementia mortality data in the other counties. The incomplete data may affect the analysis results and potentially impact the overall findings due to the uneven representation of regions in the US. As noted previously, the mortality data are from the CHRR dataset. We believe the unavailability of some mortality data is primarily attributed to small population size or rare cases in those counties. Future studies can deal with the well-known small number problem using existing or innovative techniques so that all countries can be studied. Secondly, another important consideration is the boundary problem on the US borders with Canada and Mexico. This issue arises when data values from neighboring areas outside the study zone are unavailable, potentially affecting the analysis. Additionally, this effect is compounded by the missing data within the country, which may further influence the results. Future studies should account for these boundary effects and strive to include comprehensive data from all relevant regions to enhance the robustness of the findings. Thirdly, the study focuses on the associations with demographic and socioeconomic determinants while controlling for health factors. However, the current analysis only incorporates one health factor as a control variable—the percentage of people with diabetes. Future research endeavors could broaden the scope by considering additional highly influential health factors for a more comprehensive understanding.
Supplemental Material
sj-docx-1-alr-10.3233_ADR-240107 - Supplemental material for Geospatial analysis of dementia mortality and its associations with demographic and socioeconomic factors
Supplemental material, sj-docx-1-alr-10.3233_ADR-240107 for Geospatial analysis of dementia mortality and its associations with demographic and socioeconomic factors by Farnoosh Roozkhosh, Angela Yao, Hao Yang, Suhang Song and Tianming Liu in Journal of Alzheimer's Disease Reports
Footnotes
Acknowledgments
The authors have no acknowledgments to report.
Author contributions
Farnoosh Roozkhosh (Conceptualization; Data curation; Formal analysis; Methodology; Writing – original draft; Writing – review & editing); Angela Yao (Conceptualization; Funding acquisition; Methodology; Supervision; Writing – original draft; Writing – review & editing); Hao Yang (Formal analysis; Writing – review & editing); Suhang Song (Data curation; Methodology; Writing – review & editing); Tianming Liu (Conceptualization; Funding acquisition).
Funding
The study is partially funded by the National Institutes of Health under Grant No. R01NS128534 and Grant No. R01AG075582.
Declaration of conflicting interests
The authors declared no potential conflicts of interest with respect to the research, authorship, and/or publication of this article.
Data availability
The data supporting the findings of this study are openly available online. These data were derived from the following resources available in the public domain: [Centers for Disease Control and Prevention (cdc.gov), County Health Rankings & Roadmaps, American Community Survey (ACS) (census.gov)].
Supplemental material
Supplemental material for this article is available online.