
Abstract
Background:
Alzheimer’s disease (AD), one of the most prevalent causes of dementia, is mainly sporadic in occurrence but driven by aging and other cofactors. Studies suggest that excessive alcohol consumption may increase AD risk.
Objective:
Our study examined the degree to which short-term moderate ethanol exposure leads to molecular pathological changes of AD-type neurodegeneration.
Methods:
Long Evans male and female rats were fed for 2 weeks with isocaloric liquid diets containing 24% or 0% caloric ethanol (n = 8/group). The frontal lobes were used to measure immunoreactivity to AD biomarkers, insulin-related endocrine metabolic molecules, and proinflammatory cytokines/chemokines by duplex or multiplex enzyme-linked immunosorbent assays (ELISAs).
Results:
Ethanol significantly increased frontal lobe levels of phospho-tau, but reduced Aβ, ghrelin, glucagon, leptin, PAI, IL-2, and IFN-γ.
Conclusions:
Short-term effects of chronic ethanol feeding produced neuroendocrine molecular pathologic changes reflective of metabolic dysregulation, together with abnormalities that likely contribute to impairments in neuroplasticity. The findings suggest that chronic alcohol consumption rapidly establishes a platform for impairments in energy metabolism that occur in both the early stages of AD and alcohol-related brain degeneration.
Keywords
INTRODUCTION
Alzheimer’s disease (AD) is globally the most prevalent dementing neurodegenerative disease in which familial or genetic factors account for 5% – 10% of the cases, but the overwhelming majority of afflicted people exhibit sporadic occurrences. In the United States alone, 6.7 million people over the age of 65 were diagnosed with AD in 2023, 1 and in 2020 and 2021, AD was the seventh leading cause of death. 1 The annually rising incidence and earlier-age onset trends for AD 2 fuel urgency to gain a better understanding of its pathogenesis and means of prevention. Although considerable effort and resources have been devoted to diagnostics and therapeutics based on signature brain neuropathological lesions including build-ups of amyloid-β (Aβ) plaques and fibrils, and hyperphosphorylated tau,3–9 there have not been substantial gains in the treatment or prevention of AD.10–13 The nearly 50 years of disappointing results and failure to generate significant mainstream disease-remediating products despite enormous deficit spending have finally drawn investigators to consider the pathogenic roles of lifestyle and exposure-related co-factors linked to AD.
Aging is the most dominant risk factor for AD, but since all people age with prolongation of survival yet only a subset eventually develops neurodegeneration, additional influences must govern the decision path toward benign (normal) versus malignant (neurodegeneration-prone) aging. 14 Human and experimental research led to the discovery that neurodegeneration in AD, as well as other diseases, is associated with brain insulin and insulin-like growth factor (IGF) resistances, neuroinflammation, oxidative stress, mitochondrial dysfunction, cerebral microvascular disease, and repeated head trauma. 14 The list of lifestyle and exposure factors that contribute to both aging and neurodegeneration continues to grow and currently includes air pollution, obesity, insulin resistance diseases, environmental toxins, smoking, and nitrosamines.1,14, 1,14 In addition, several reports have raised concern or provided experimental evidence that excessive alcohol consumption may promote or contribute to AD-type cognitive impairment or neurodegeneration.15–17
Epidemiological data linking either increased or decreased risks of developing AD to alcohol consumption were generated with varied study designs and exposure level criteria, accounting for their mixed results. In a relatively large retrospective case-control study, heavy regular weekly alcohol consumption was associated with greater odds of developing dementia, but additional contributing factors included male sex, diabetes mellitus, an apolipoprotein E (APOE) ɛ4 allele, and former drinker status, whereas abstinence was deemed to be protective. 18 However, the study did not show any differences between the risks of vascular dementia versus AD in relation to heavy drinking, and consideration was not given to the concept that the cognitive decline may have been due to alcohol-related brain degeneration or damage,19–22 including thiamine deficiency disorders.23,24, 23,24 Earlier, smaller studies, which were likely under-powered and varied in their operational definitions of heavy alcohol use, failed to show any significant relationship between alcohol consumption and AD.25–27 Instead, they demonstrated the protective effects of alcohol, particularly wine,27–29 or a U-shaped dementia risk curve suggesting that both nil and very high levels of regular alcohol consumption increased dementia risk. 30 Similarly, in a long-term follow-up study, a U-shaped curve with higher dementia rates among both abstainers and heavy drinkers was observed, but the effects were not distinguished for AD and vascular dementia. 31
Besides differences in research design, other factors likely contributed to the disparate results of epidemiological studies. The finding that prior mid-life heavy drinking can increase the risk for dementia and possibly AD, despite quitting,31,32, 31,32 suggests the consequences of alcohol-related neurotoxic injury drive a cascade of neurodegeneration that evolves over time. Whether such effects could be mediated by an “off-response” with attendant excitotoxic neuronal damage33–36 requires further investigation. Another consideration is that outcomes were based on dementia diagnoses rather than current biomarker subtyping that distinguish between AD and vascular dementia. 37 Furthermore, heavy alcohol consumption also appears to increase the risk for other non-AD neurodegenerative diseases such as frontotemporal lobar degeneration.37,38, 37,38
Yet another recurrent theme is that genetic risk factors for AD, in particular, the presence of an APOE ɛ4 allele, have emerged as an important co-factor increasing AD risk among heavy drinkers18,39, 18,39 and in transgenic mouse models. 40 The comprehensive study of alcohol exposure effects in the 3xTg-AD by Hoffmann et al. revealed substantial exacerbations of AD-type neurobehavioral and molecular pathologies with dysregulated signaling through mechanistic target of rapamycin (mTOR) pathways, 41 similar to the findings in experimental models of sporadic AD-type neurodegeneration14,42,43, 14,42,43 and following heavy binge alcohol exposure alone. 44 Further studies revealed that heavy alcohol’s interactive effects on AD pathogenesis could be linked to its inhibition of protective genes with the attendant enhancement of tau pathology and neuroinflammation, 45 and increased expression of Aβ, pTau, and neuroinflammatory mediators.46,47, 46,47
To address the overarching questions about the role of excess alcohol consumption as a causal or contributing factor in AD, attention must be paid to hints provided by epidemiological studies. One recurrent theme has been that prior to AD diagnosis, high-level or binge alcohol exposures occurred at significantly higher rates than in non-demented subjects. Of particular interest is the potential impact of initiating alcohol misuse behavior in adolescence, which could have profound adverse effects on brain development, behavior, and later life cognitive functions. 48 Furthermore, the propensity to continue drinking remains high during adolescence due to high levels of neurotransmitter activity leading to dopamine surges together with reductions in GABAergic inhibitory effects in the frontal lobe.21,48–50, 21,48–50 Approximately 38% of adolescents (aged 15– 19) consume alcohol, and 19% engage in binge drinking (ingesting alcohol in a pattern that brings the blood alcohol concentration to 0.08 g/dL or above).48,51,52, 48,51,52 Experimental data suggest that alcohol misuse in early adolescence or the persistence of abuse over time contributes to later life risk of neurodegeneration with AD features,46,47, 46,47 possibly due to increased pro-inflammatory signaling in the brain.53–55
Since the pathologies of alcohol-related brain degeneration (ARBD) and AD intersect due to their strong mechanistic associations with brain insulin and insulin-like growth factor (IGF) resistances, neuroinflammation, oxidative stress, and metabolic dysfunction, the concept that alcohol misuse contributes to the pathogenesis and progression of AD is plausible. The present study addresses these questions using an established Long Evans rat model of short-term (2 weeks) moderate-level chronic ethanol feeding. In contrast to previous studies, we elected to use a non-genetic model because most human AD cases occur sporadically and lack the genetic alterations incorporated into transgenic AD mouse models. Previous studies using the same Long Evans rat model showed that chronic ethanol exposures cause neurobehavioral abnormalities with deficits in spatial learning and novel object recognition. 56 The aim of this study was to determine if the emergence of AD molecular pathologies, including metabolic and inflammatory abnormalities with pathogenic links to AD could account for the neurobehavioral deficits that develop following chronic moderate-level alcohol consumption.
MATERIALS AND METHODS
Materials
Pharmaceutical-grade ethanol was used to prepare liquid diets. Table 1 lists the epitope-specific commercial primary antibodies that were used to perform duplex enzyme-linked immunosorbent assays (ELISAs), together with their sources and validation references. The ELISA MaxiSorp 96-well plates, Bicinchoninic acid (BCA) reagents, horseradish peroxidase (HRP)-conjugated secondary antibodies, and Superblock (TBS) were purchased from Thermo-Fisher Scientific (Bedford, MA USA). The soluble fluorophores, Amplex UltraRed and 4-Methylumbelliferyl phosphate (4-MUP) were from Life Technologies (Carlsbad, CA, USA). Vector Laboratories Inc. (Newark, CA, USA) was the source of the Proton Biotin Protein Labeling Kit and Alkaline Phosphatase-conjugated Streptavidin. The 5-Plex magnetic bead-based Diabetes Panel was from Bio-Rad Laboratories (Hercules, CA, USA), and the 5-Plex MILLIPLEX MAP Rat Cytokine Magnetic Bead Panel was from Millipore (Burlington, MA, USA). All other fine reagents were purchased from CalBiochem/Millipore Sigma (Burlington, MA, USA), Pierce Chemical (Dallas, TX, USA), or Sigma-Aldrich Co. (St. Louis, MO, USA).
Antibodies Used for Duplex ELISA Studies
Experimental model
Long Evans rats (n = 8/group; 4 male, 4 female) purchased from Charles River Laboratories (Wilmington, MA, USA) at 4 weeks of age were group-housed by sex and adapted to their new environment for 1 week prior to use in experiments. The pathogen-free environment had an automated 12-h light/dark cycle (7 AM lights on; 7 PM lights off) and the rats were provided unrestricted access to food. The use of rats for these studies was approved by the Institutional Animal Care and Use Committees (IACUC) at Lifespan and the Providence VA Medical Center, and the protocols adhered to the National Institutes of Health (NIH) Guide for the Care and Use of Laboratory Animals.
Chronic, moderate-level ethanol exposure models were generated by pair-feeding the rats with isocaloric commercial Lieber-deCarli liquid diets (BioServ, Flemington, NJ, USA) containing 24% ethanol (caloric content; 6% V/V) or 0% ethanol (control) as previously reported. 56 In brief, after a 4-day period of adaptation, the rats were maintained on liquid diets for 2 weeks to study the effects of short-term ethanol exposures. Ample food was provided throughout the experiment and food was never withdrawn even prior to sacrifice. The liquid diets were replenished twice daily by fresh replacements in the mornings (9 AM) and evenings (6 PM). Food consumption was checked with each change of liquid diet. Behavior and general health were monitored daily, and weight gain was measured weekly. At the experimental endpoint, between 9 AM and 12 PM, the rats were weighed, and blood was obtained to measure alcohol concentration using a colorimetric assay kit (BioVision, CA, USA). The rats were then euthanized with a lethal dose of inhaled isoflurane. The freshly harvested brains were weighed, and the frontal lobes were isolated by making a coronal plane cut through the cerebral hemispheres at the level of the temporal tips. Frontal lobe tissue was snap-frozen on dry ice and stored at – 80°C for molecular and biochemical assays. The frontal lobes were studied because they are major central nervous system (CNS) targets of neurodegeneration in both AD57,58, 57,58 and ARBD. 22
Sample preparation
Individual fresh frozen frontal lobe samples were homogenized in 5 volumes of weak lysis buffer (50 mM Tris (pH 7.5), 150 mM NaCl, 5 mM EDTA (pH 8.0), 50 mM NaF, 0.1% Triton X-100) containing chemical protease (1 mM PMSF, 0.1 mM TPCK, 2 μg/ml aprotinin, 2 μg/ml pepstatin A, 1 μg/ml leupeptin, 1 mM NaF, 1 mM Na4P2O7) and phosphatase (10 mM Na3VO4) inhibitors. Sample homogenization was achieved using a TissueLyser II (Qiagen, Germantown, MD, USA) instrument and 5-mm diameter stainless steel beads as described.59,60, 59,60 After centrifuging the homogenates at 14,000 rpm for 10 min at 4°C, the supernatant fractions were aliquoted and stored at – 80°C for multiplex and duplex ELISAs. Protein concentrations were measured with the BCA assay.
Duplex ELISA
Duplex ELISAs were used to measure immunoreactivity to amyloid-β protein precursor (AβPP), the Aβ1-17 cleavage fragment of AβPP-Aβ, tubulin associated unit (Tau), phospho-Tau (paired-helical filament-PHF), choline acetyltransferase (ChAT), acetylcholinesterase (AChE), aspartyl-asparaginyl-β-hydroxylase (ASPH), and glucose-6-phosphate dehydrogenase (GAPDH). The results were normalized to large acidic ribosomal protein (RPLPO) immunoreactivity measured in the same samples as a loading control.61–64 The Duplex ELISAs were performed as previously described. 59 In brief, triplicate aliquots of the clarified frontal lobe homogenates containing 50 ng of protein in 50 μL of binding buffer were adsorbed to the bottoms of 96-well MaxiSorp plates overnight at 4°C. Non-specific binding sites were masked with Superblock TBS. Then, with gentle platform agitation, the samples were incubated overnight at 4°C with the primary antibodies (0.2– 5.0 μg/ml). Immunoreactivity was detected using species-specific HRP-conjugated secondary antibodies and the Amplex UltraRed soluble fluorophore. Fluorescence intensity was measured (Ex 530 nm/Em 590 nm) in a SpectraMax M5 microplate reader. RPLPO61–65 was subsequently detected with biotinylated anti-RPLPO, streptavidin-conjugated alkaline phosphatase, and 4-MUP fluorophore. Fluorescence intensity was measured in a SpectraMax M5 microplate reader (Ex 360 nm/Em 450 nm). The calculated ratios of the target protein to RPLPO, which served to normalize the results based on sample loading, were used for statisticalcomparisons.
Diabetes panel and cytokine magnetic bead-based multiplex ELISAs
The 5-Plex magnetic bead-based Diabetes Panel was used to measure Ghrelin, GLP-1, Glucagon, Leptin, and PAI, and the 5-Plex MILLIPLEX MAP Rat Cytokine Magnetic Bead Panel was used to measure Interferon-gamma (IFN-γ), Interleukin-1 β (IL-1β), IL-2, IL-6, and tumor necrosis factor-alpha (TNF-α). Both assays were performed in accordance with the manufacturer’s protocols. For the Diabetes Panel, the reactions included 200 μg protein in 50 μL of sample diluent (Bio-Rad, Hercules, CA, USA). For the cytokine assays, the reactions included 150 μg of protein in 25 μL of assay buffer (Millipore-Sigma, Burlington, MA, USA). The samples were incubated with antibody-conjugated magnetic beads. Immunoreactivity detected with biotinylated secondary antibodies and Streptavidin-conjugated Phycoerythrin was measured in a Milliplex MagPix Instrument. Results were analyzed using xPONENT software. Standard curves for each analyte were included in all assays to calculate levels of immunoreactivity.
Statistical analyses
Previous studies using an adolescent Long Evans rat model of chronic ethanol feeding demonstrated significant sex effects on body weight and blood alcohol concentration but not brain weight, neurobehavioral function, or molecular/biochemical protein expression in the brain.56,66, 56,66 Mixed model ANOVA tests were used to characterize male/female sex effects on terminal mean body weight, brain weight and blood alcohol concentration. since 97.2% of the two-way ANOVA tests to evaluate sex effects on biomarker expression in the frontal lobes were negative (Supplementary Table 1), the data from the male and female samples were combined to focus the analyses on ethanol’s effects. However, it is noteworthy that the experimental design was not powered to specifically study sex as a biological variable. Two-way mixed model ANOVA with post hoc Tukey tests were used to examine the effects of moderate-level ethanol exposure on AD biomarkers, endocrine-metabolic pathway proteins, and cytokines/chemokines. GraphPad Prism 10.2 (San Diego, CA, USA) software was used to analyze and graphically display the results with boxplots that include the individual data points, calculated means (mid-horizontal bar), 95% confidence interval limits (top and bottom edges of the boxes), and ranges (upper and lower stems). In addition, Heatmaps of Log10-transformed data (to accommodate the broad range in the levels of immunoreactivity) were used to display the within-group and between-group differences in metabolic and inflammatory marker expression measured with multiplex ELISA panels.
RESULTS
Model features
Two-way ANOVA tests demonstrated significant sex effects on body weight, and ethanol and sex effects on blood alcohol concentrations (Table 2). The graphed data and post hoc tests showed that females, both control and ethanol-fed, had significantly lower mean body weights than males within their corresponding groups (Fig. 1A). However, ethanol feeding did not significantly alter mean body weight among males or females. There were no significant sex-dependent differences in mean brain weight, and mean brain weight was not significantly altered by ethanol feeding (Fig. 1B). As expected, the blood alcohol concentrations were strikingly elevated in the ethanol diet groups (Fig. 1C). In addition, a small but significant difference was detected between male and female blood alcohol concentrations in the ethanol diet groups.
Ethanol and sex effects on model characteristics—ANOVA Tests
Ethanol feeding, sex, and their interactions analyzed by two-way ANOVA tests. Figure 1 shows the graphed data and results of post hoc Tukey multiple comparisons tests. N = 4 males or 4 females/group. F (DFn, DFd)=F(1,12) for each variable. Bold font marks significant p-values (p≤0.05). NS, not significant.
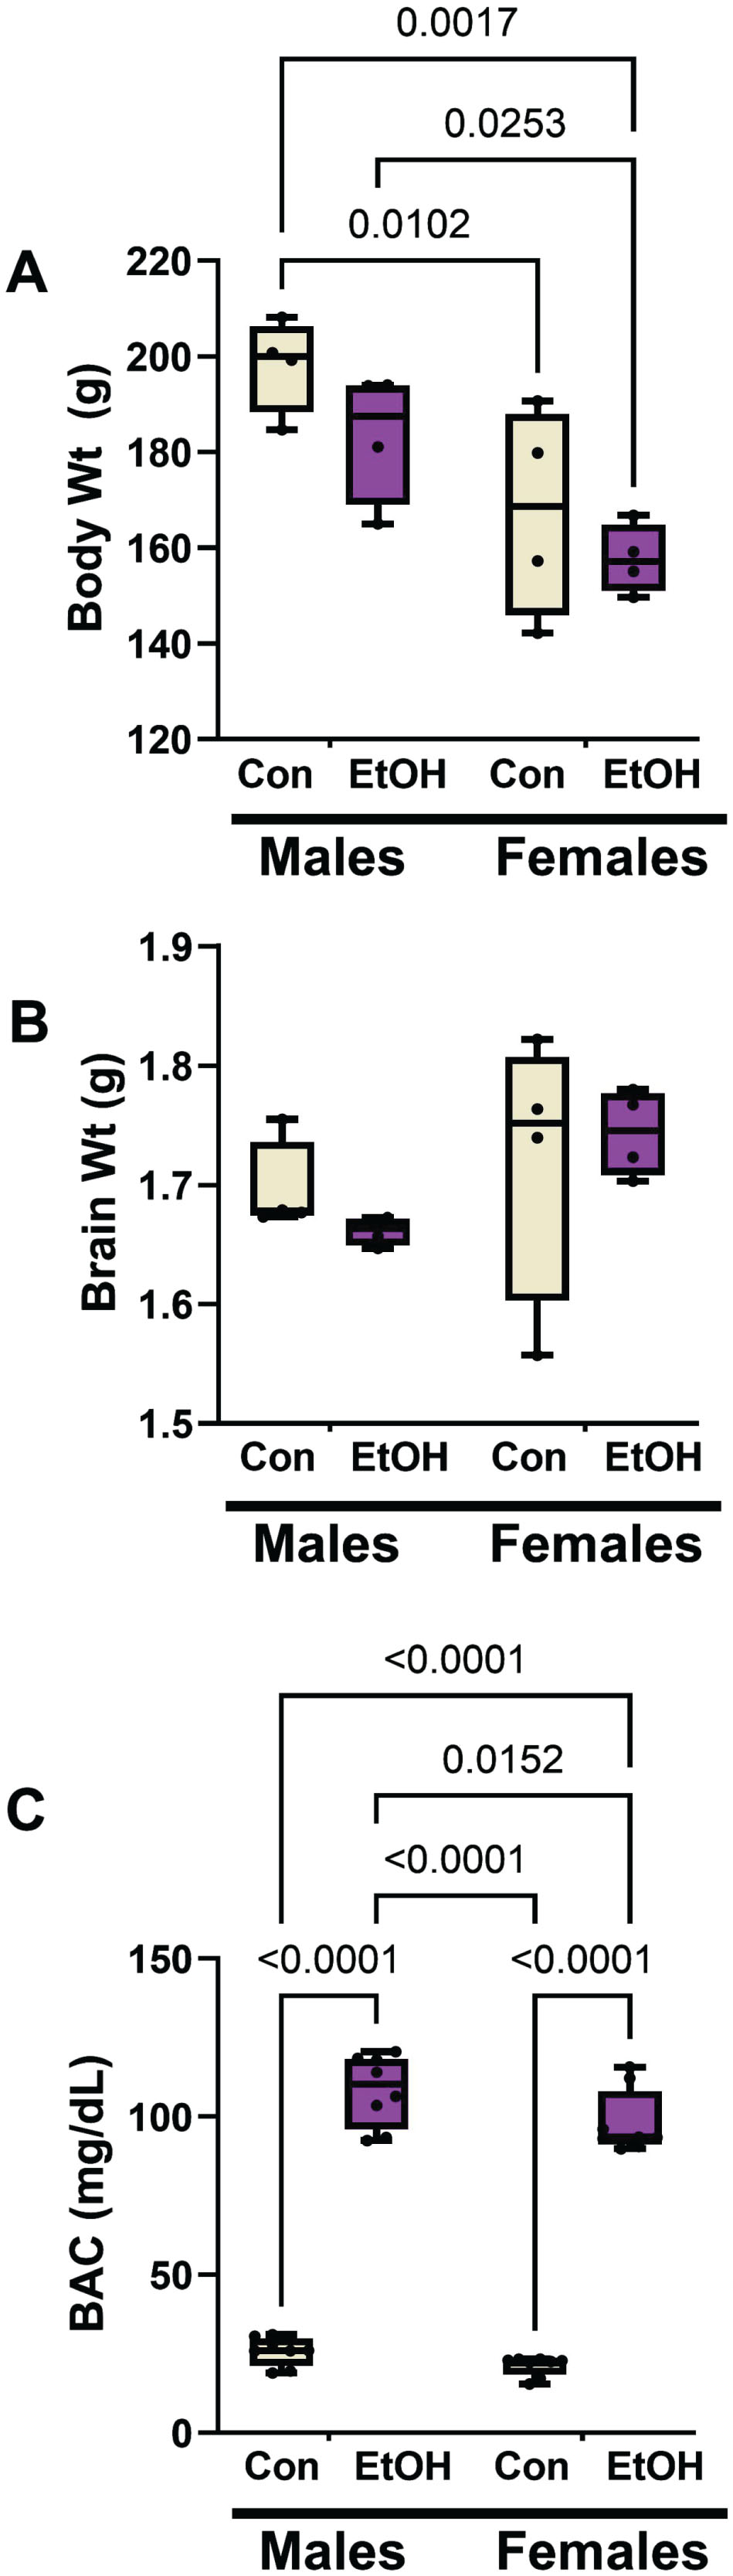
Moderate alcohol exposure effects on body weight, brain weight, blood alcohol concentration by sex. Long Evans male and female rats were maintained on isocaloric liquid diets containing 0% (control) or 24% ethanol (n = 8/group) for two weeks. A) Terminal mean body weights differed significantly by sex but not ethanol feeding. B) The mean brain weights did not differ significantly among the groups. C) Blood alcohol concentrations were significantly elevated by chronic ethanol feeding in both male and female rats. Results were analyzed by two-way mixed model ANOVA (Table 2) with post hoc Tukey tests. Significant inter-group differences are shown within the panels.
AD, cholinergic, and insulin-responsive proteins
AβPP, Aβ, Tau, and pTau were measured to assess the ethanol effects on standard AD biomarkers. ChAT and AChE served as indices of cholinergic function. Aspartyl-asparaginyl-β-hydroxylase (ASPH) and GAPDH are insulin-responsive enzyme proteins expressed in the brain but reduced by chronic oxidative, mitochondrial dysfunction, 67 and ethanol exposure.68,69, 68,69 The use of duplex ELISAs enabled the levels of immunoreactivity to be normalized to the internal RPLPO standard, 70 and thereby adjust for small technical differences in protein loading or binding to the ELISA plates. To validate this approach, we demonstrated that RPLPO immunoreactivity increased linearly with protein loading between 10 ng and 80 ng/well (r2 = 0.9795; Fig. 2A). In addition, corresponding with the calculated additions of 50 ng/well of protein, the levels of RPLPO immunoreactivity measured in control and ethanol frontal lobe samples did not differ significantly (Fig. 2B). The results corresponding to the relative levels of each protein normalized to RPLPO were analyzed statistically and displayed with boxplots (Fig. 3).
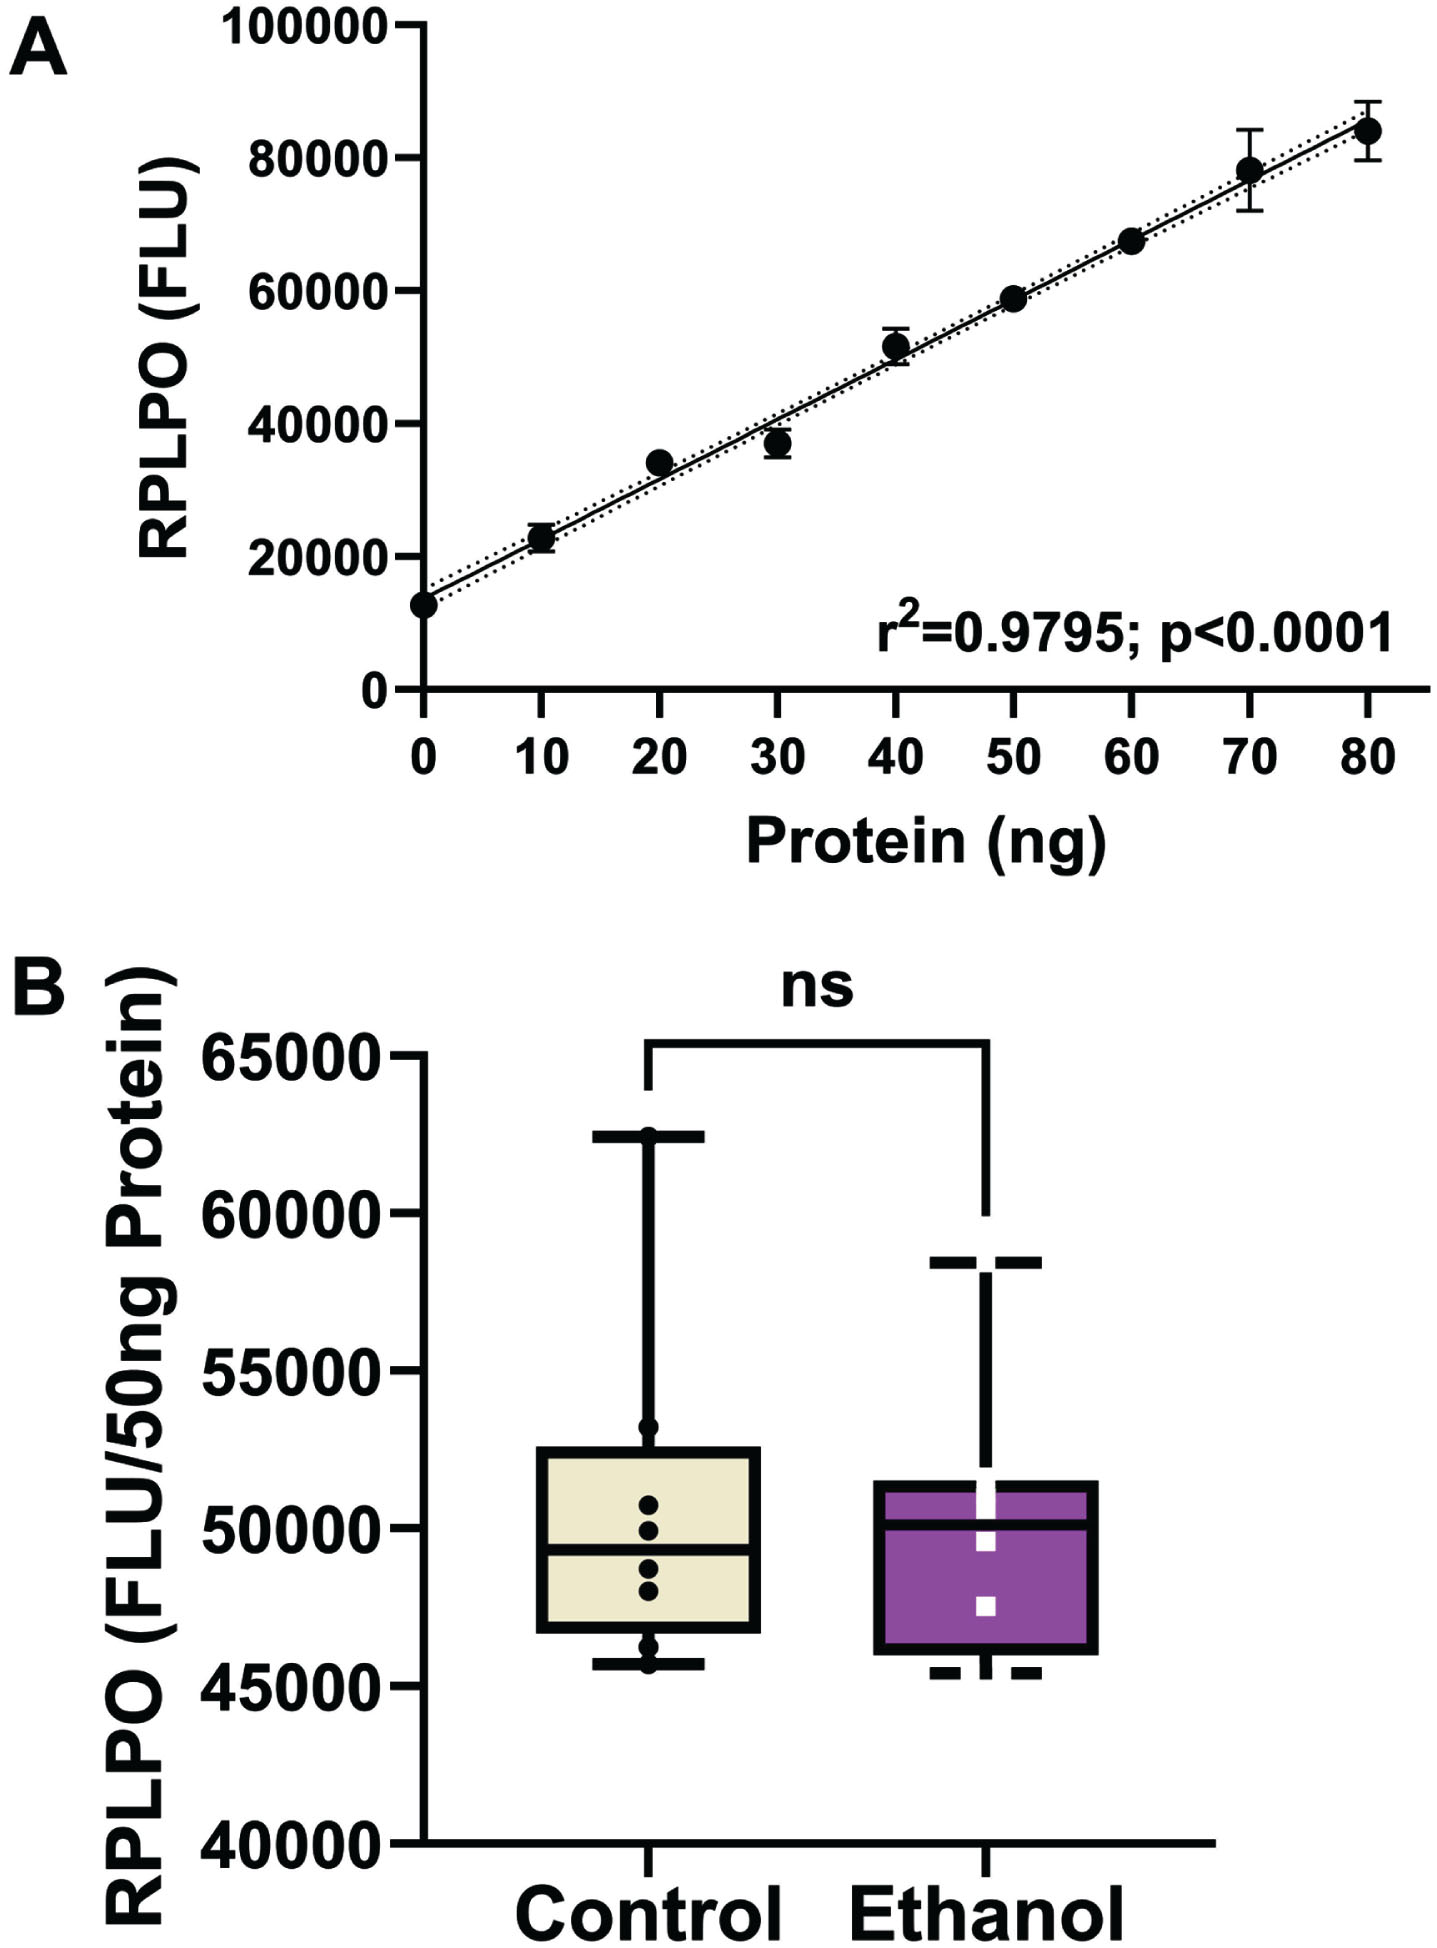
Large acidic ribonuclear protein (RPLPO) immunoreactivity. RPLPO immunoreactivity was used as a normalizing control. A) Immunoreactivity measured by direct binding ELISA is linearly correlated with protein content between 5 ng and 80 ng (r2 = 0.99). B) Boxplots of RPLPO immunoreactivity measured in 50 ng protein homogenate samples from frontal lobe control and ethanol-fed rats (n = 8/group). Inter-group comparisons were made by T-test. RPLPO immunoreactivity was used to normalize results obtained by duplex ELISAs in Fig. 3.
Two-way ANOVA tests detected significant ethanol (p = 0.013), biomarker type (p < 0.0001), and ethanol x biomarker type (p = 0.0083) effects difference in the expression levels of the 8 molecules measured by duplex ELISA (Table 3). The boxplots with post hoc Tukey test results show similar levels of AβPP (Fig. 3A), Tau (Fig. 3C), ChAT (Fig. 3E), AChE (Fig. 3F), ASPH (Fig. 3G), and GAPDH (Fig. 3H) in the control and ethanol groups, but significantly reduced Aβ (Fig. 3B) and increased pTau (Fig. 3D) in the ethanol group. Although the assays for each of these proteins were independent rather than multiplexed, heatmaps of the Log10-transformed data helped reinforce the dominant within-group differences in marker expression (Supplementary Figure 1). Heatmaps were generated with all 8 makers (Supplementary Figure 1A) and with Tau excluded (Supplementary Figure 1B) due to data compression resulting from substantially higher levels of expression relative to the other proteins. With Tau included in the heatmap, the control versus ethanol difference is evident for Aβ, but the results corresponding to ChAT, AChE, ASPH, and GAPDH are compressed. In contrast, omission of Tau from the heatmap more effectively displays the within-group and between-group differences in biomarker expression across the “panel”, whether they were statistically significant or not.
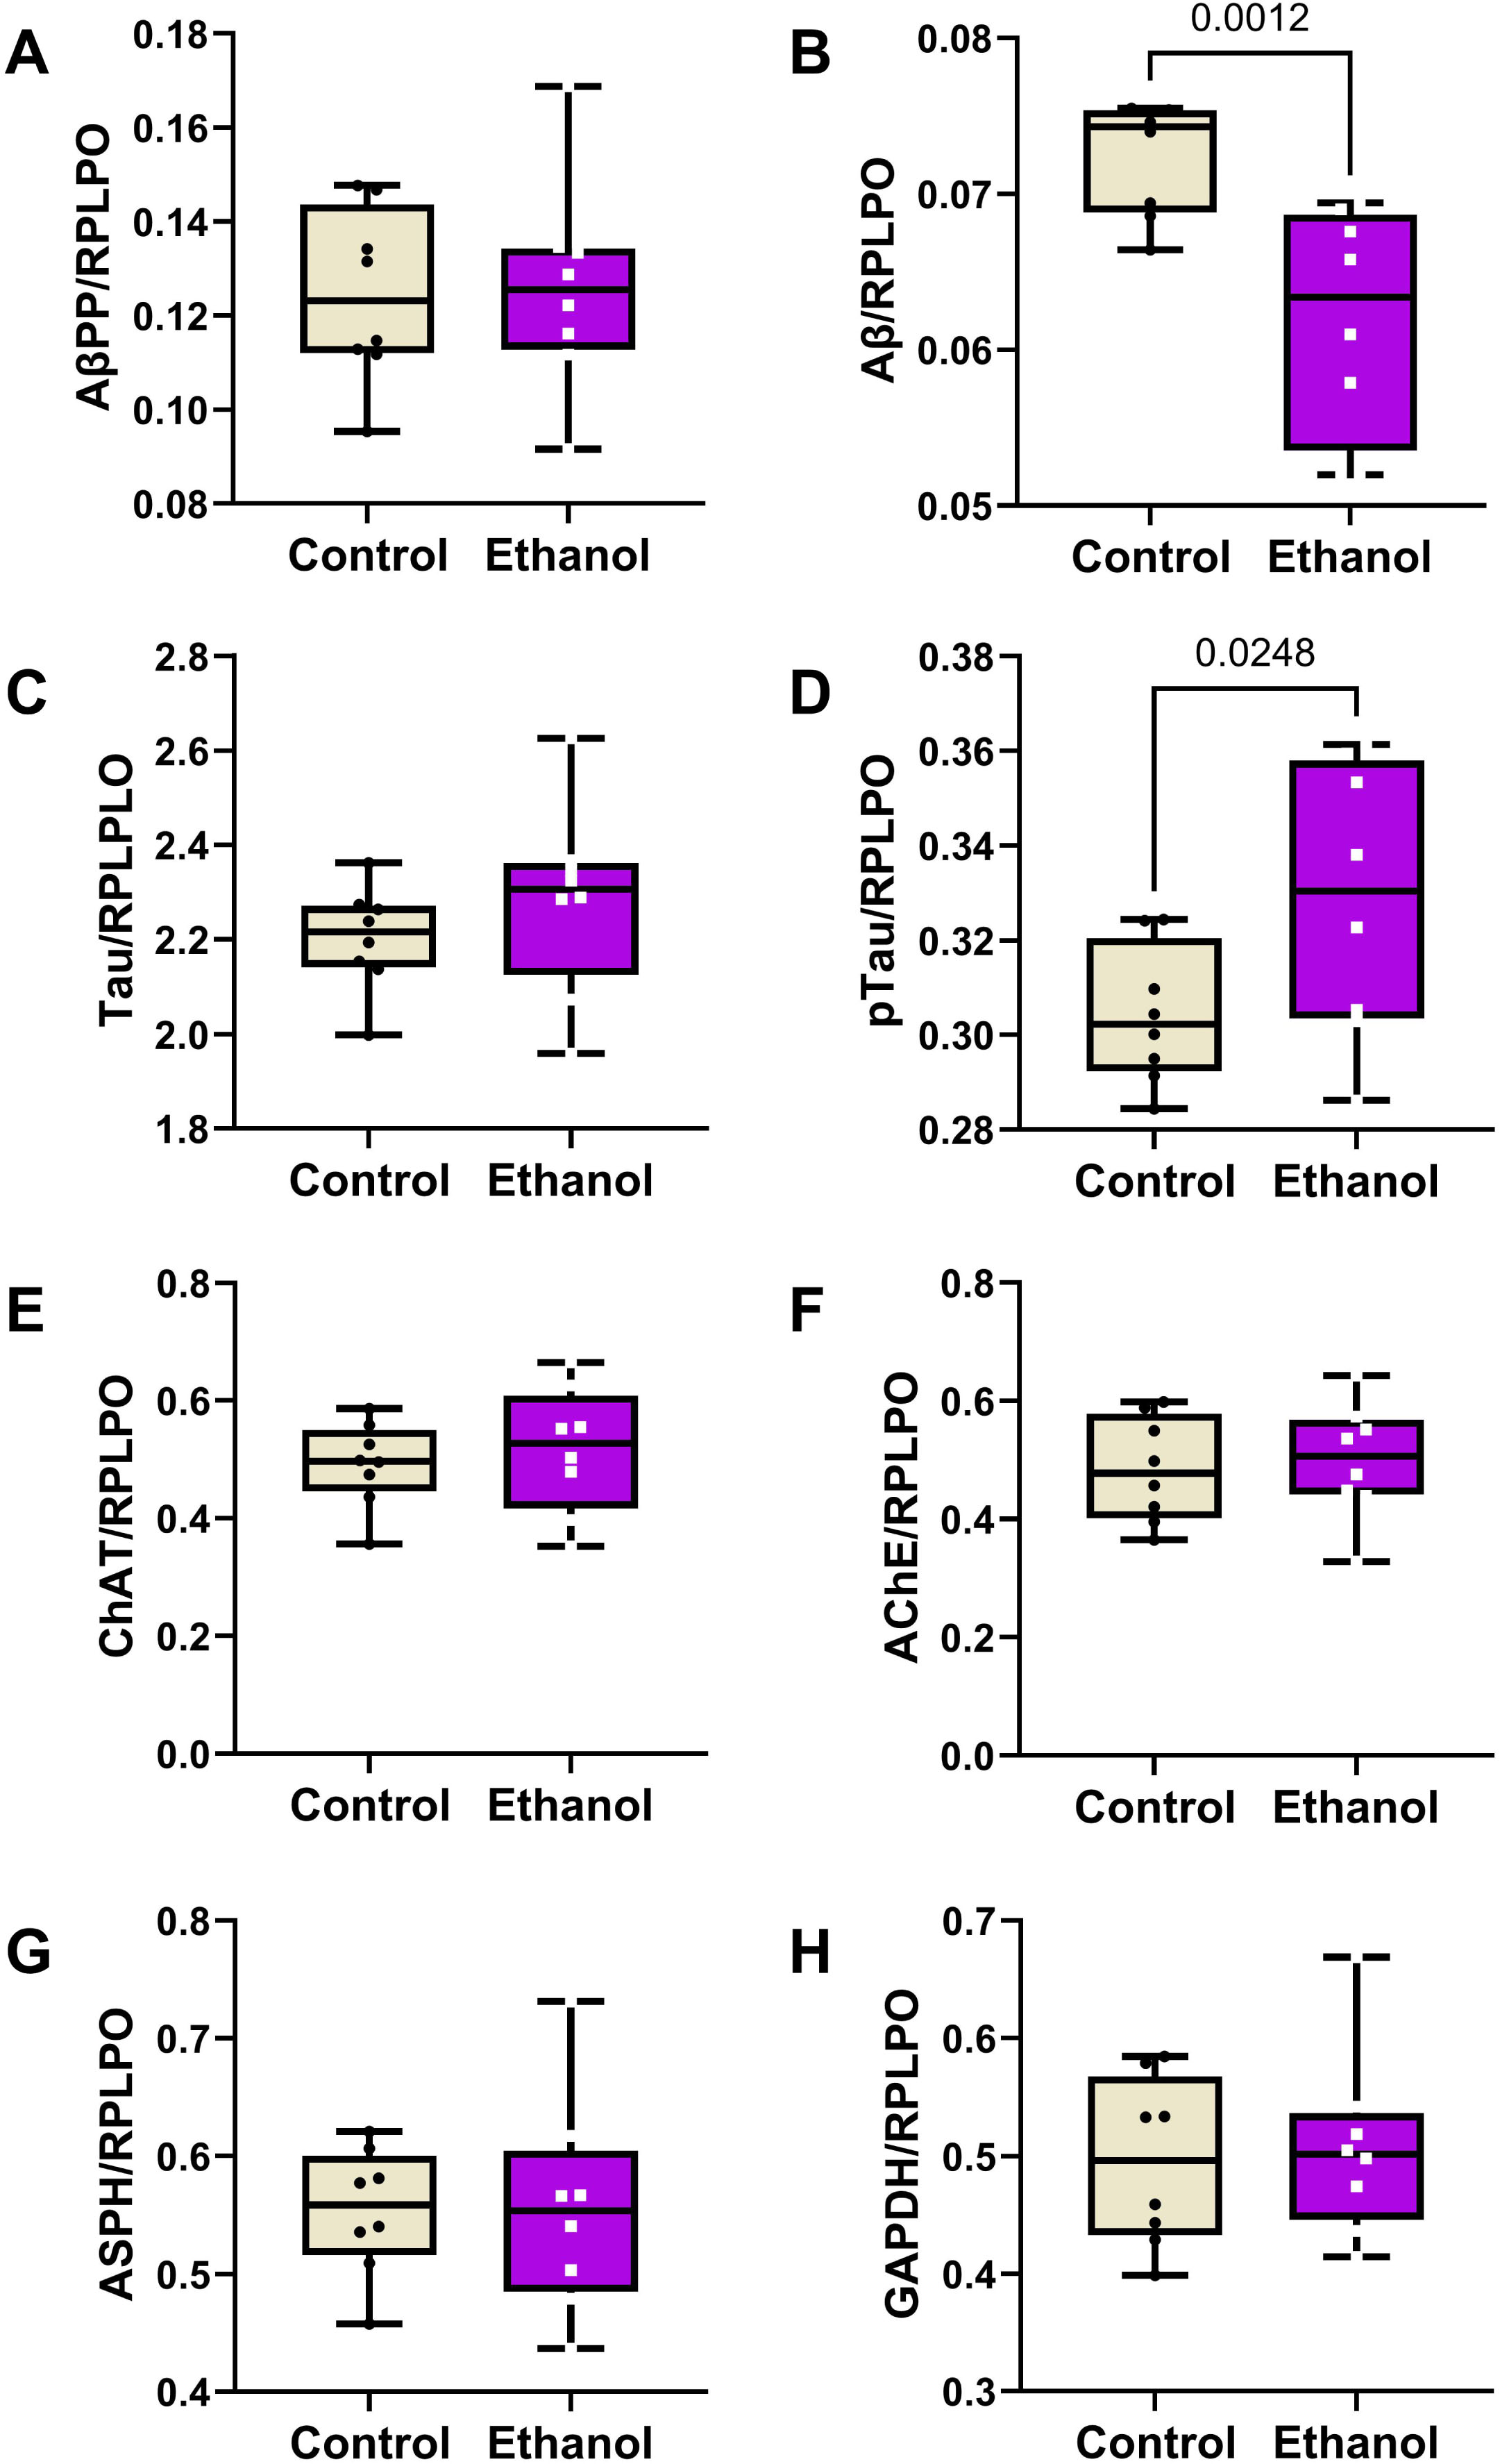
Effects of chronic moderate-level ethanol exposures on Long Evans rat frontal lobe levels of (A) AβPP, (B) Aβ, (C) Tau, (D) pTau, (E) ChAT, (F) AChE, (G) ASPH, and (H) GAPDH immunoreactivities (n = 8/group). Rats were maintained on isocaloric liquid diets containing 24% or 0% caloric ethanol for 2 weeks. Immunoreactivity was measured by duplex ELISA with results normalized to RPLPO. Results are depicted with boxplots that include individual (dots) and mean (horizontal bar) sample values, 95% confidence interval limits (top and bottom box limits), and ranges (stems). Inter-group statistical comparisons were made by two-way ANOVA (Table 3) and post hoc Tukey tests. Significant p-values are displayed within the panels. See Supplementary Figure 1 for heatmap corresponding to the within-group and between-group differences in the levels of immunoreactivity.
Ethanol effects on biomarker expression—ANOVA Tests
Ethanol feeding, frontal lobe biomarker type/source and their interactions analyzed by two-way ANOVA tests. N = 8 frontal lobe samples/group. F (DFn, DFd)=F(7,112) for AD and related factors; F(4,70) for Metabolic Markers; F(4,70) for Cytokines/Chemokines. Bold font marks significant p-values (p≤0.05). NS, not significant. Figures 3– 5 display the graphed data and results of post hoc Tukey multiple comparisons tests.
Endocrine-metabolic markers
A 5-Plex Diabetes panel was used to measure ghrelin, GLP-1, glucagon, leptin, and PAI-1 (pg/200 μg Protein). A two-way ANOVA test demonstrated significant ethanol (p < 0.0001), biomarker type (p < 0.0001) and ethanol x biomarker type (p < 0.0001) interactive effects (Table 3). The boxplots with post hoc Tukey test results revealed significant ethanol-associated reductions in the mean levels of ghrelin (Fig. 4A), glucagon (Fig. 4C), Leptin (Fig. 4D), and PAI (Fig. 4E), and no significant difference in the mean level of GLP-1 (Fig. 4B). A heatmap generated with Log10 transformed data shows the within-group and between-group differences in neuroendocrine metabolic marker expression (Fig. 4F). Note the relatively low frontal lobe levels of ghrelin and PAI-1, intermediate levels of leptin and glucagon, and broadly distributed expression levels of leptin and GLP-1.
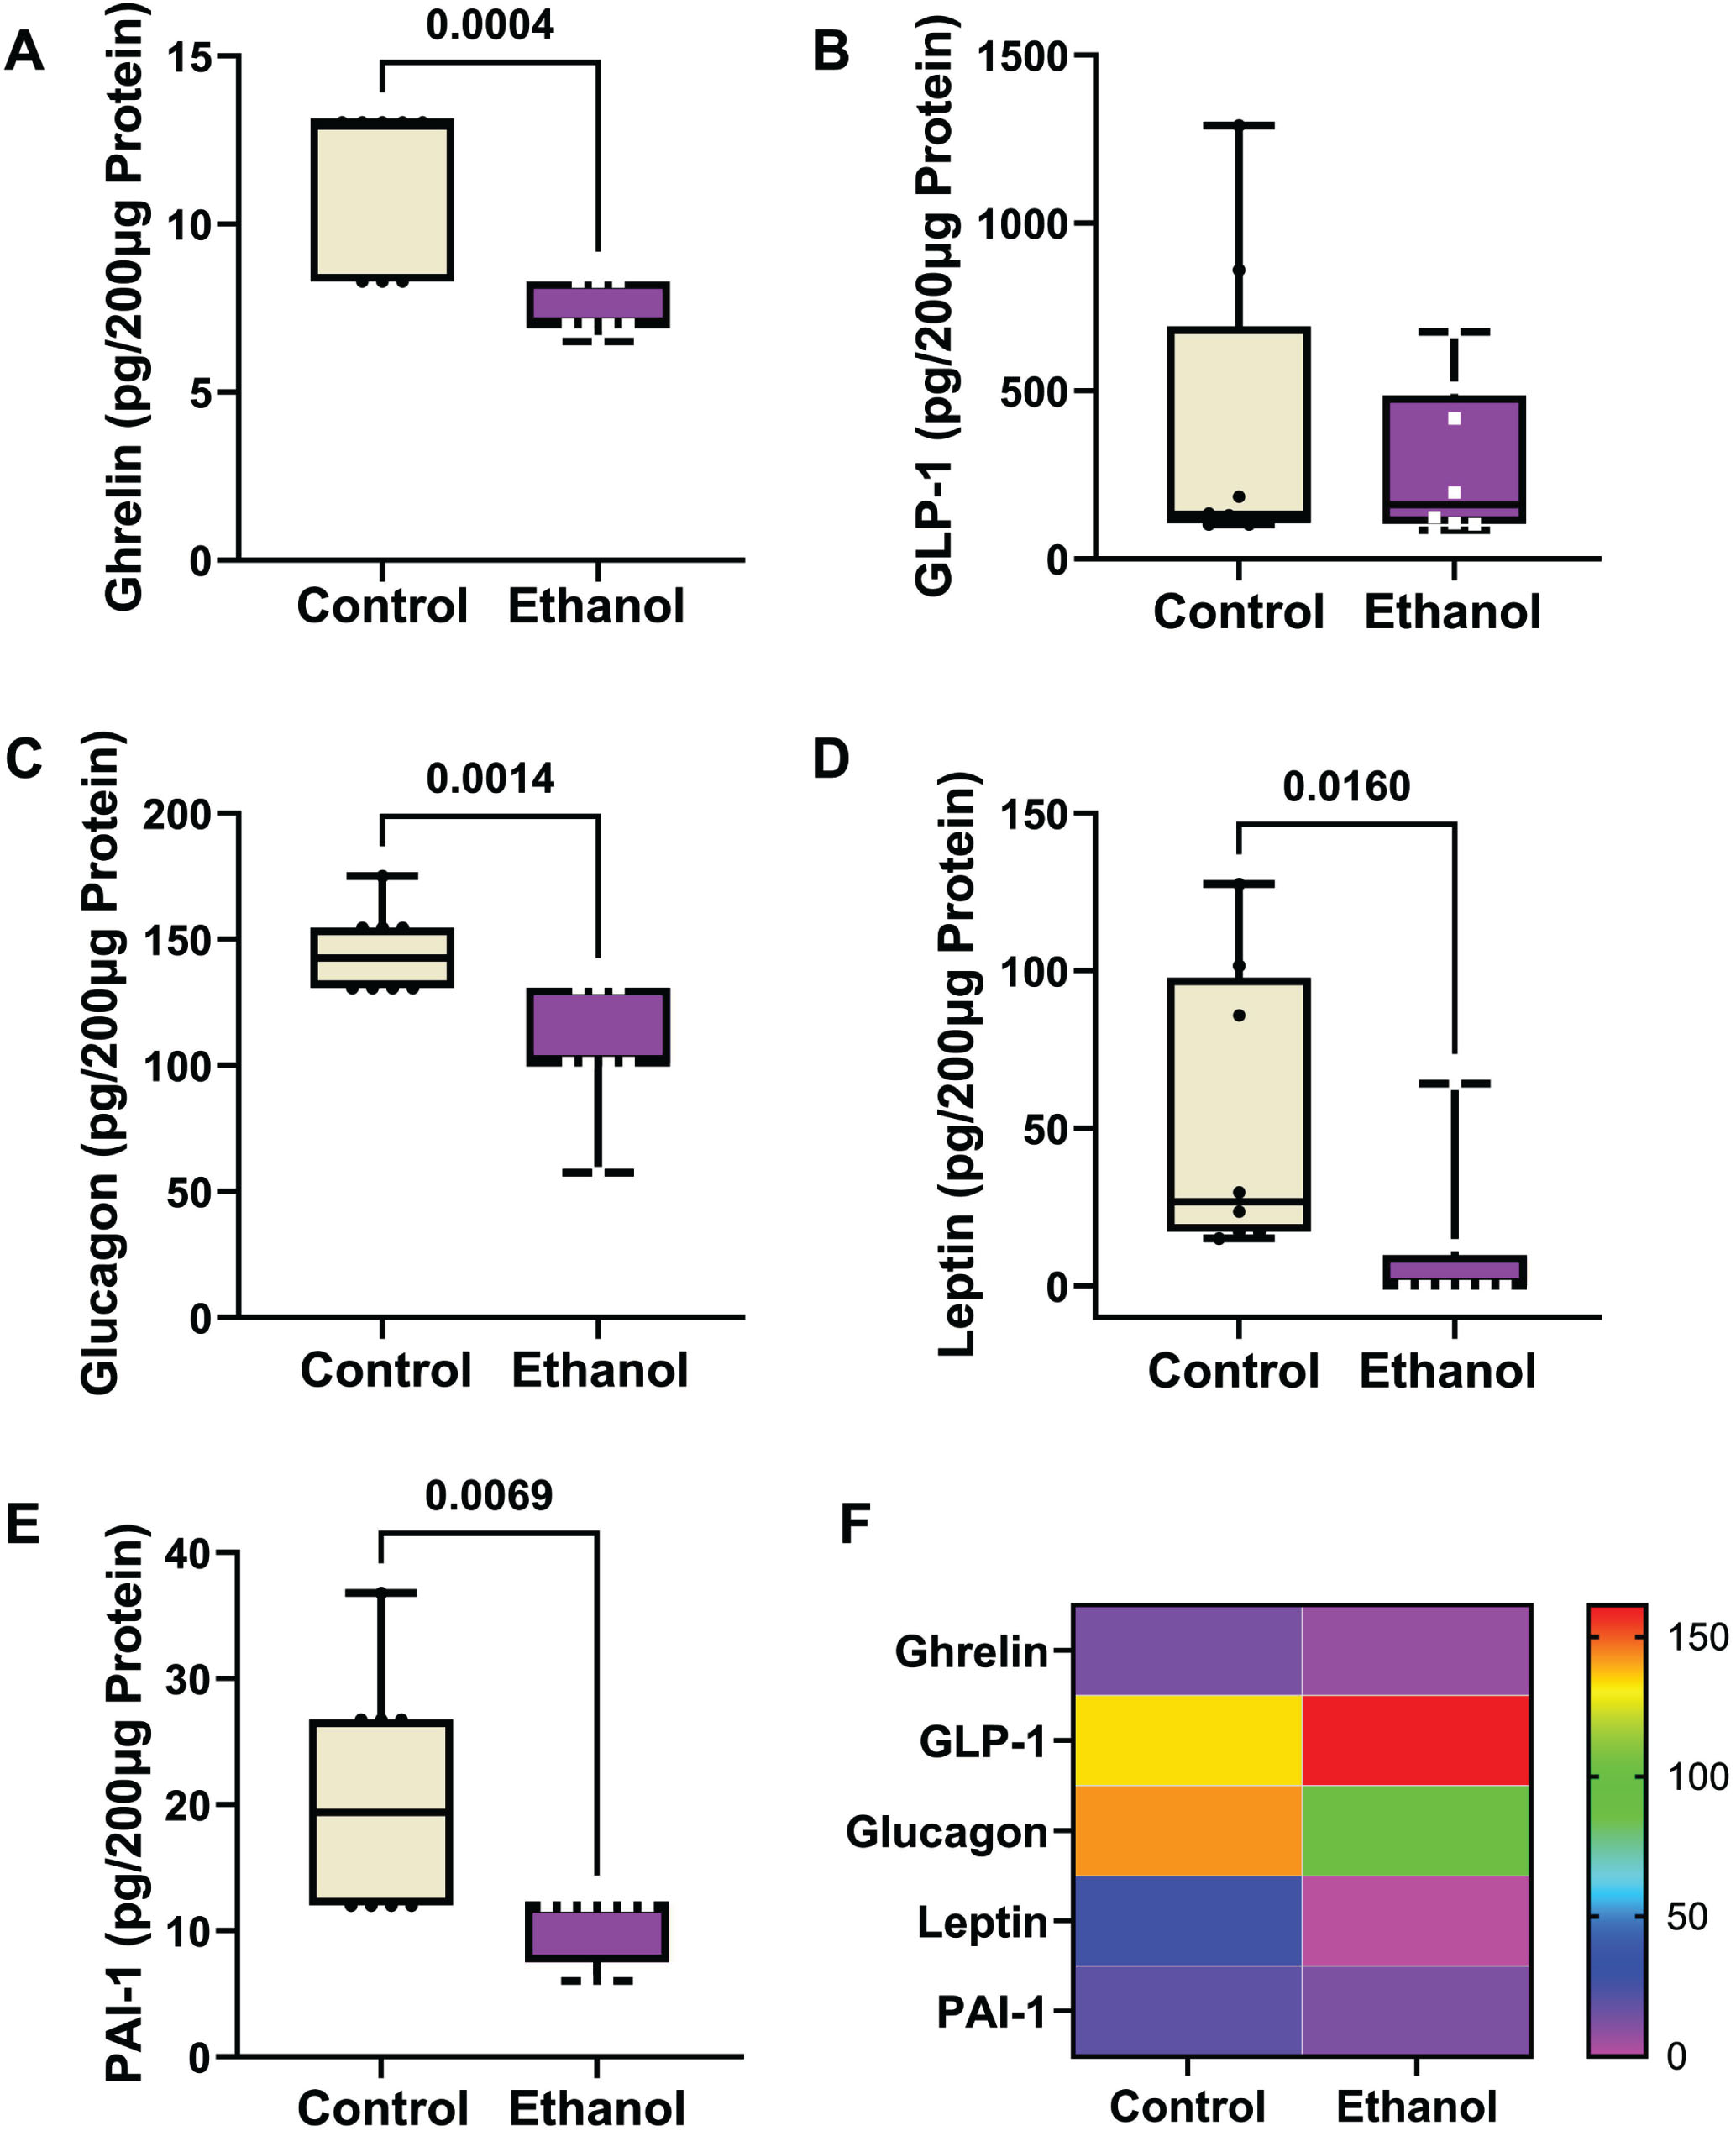
Ethanol exposure effects on frontal lobe expression of (A) ghrelin, (B) GLP-1, (C) glucagon, (D) leptin, and (E) PAI-1. Immunoreactivity was measured with a 5-Plex Diabetes Panel with equivalent amounts of protein per sample. Results are depicted with boxplots. Inter-group statistical comparisons (n = 8/group) were made by two-way ANOVA (Table 3) and post hoc Tukey tests. Significant p-values are displayed within the panels. (F) Heatmap displaying within-group and between-group differences in neuroendocrine polypeptide expression. The scale bar reflects pg/200 μg Protein.
Inflammatory cytokines and chemokines
A 5-plex ELISA was used to measure immunoreactivity (pg/150 μg of protein) corresponding to four cytokines (IL-1β, IL-2, IL-6, and TNF-α) and one chemokine (IFN-γ) in frontal lobe samples. Two-way ANOVA tests detected significant ethanol (p = 0.0004) and cytokine/chemokine type (p < 0.0001), but not ethanol x cytokine/chemokine type (Table 3). Boxplots (Fig. 5A– 5E) show the inter-group differences in cytokine/chemokine expression, and a heatmap (Fig. 5F) generated with Log10 transformed data depicts the within-group and between-group differences. The post hoc Tukey tests demonstrated significant ethanol-associated reductions in IL-2 (Fig. 5B) and IFN-γ (Fig. 5D), and a statistical trend effect for ethanol-reduced IL-6 (p = 0.0794) (Fig. 5C). No significant or trend effects of ethanol were detected with respect to IL-1β (Fig. 5A) or TNF-α (Fig. 5E). The heatmap (Fig. 5F) depicts a broad with-group range in the levels of cytokine/chemokine expression, with TNF-α being the lowest, IL-6 the highest, and IL-1β, IL-2, and IFN-γ more similar in levels. The ethanol effects on IL-2 and IFN-γ are evident in the heatmap.
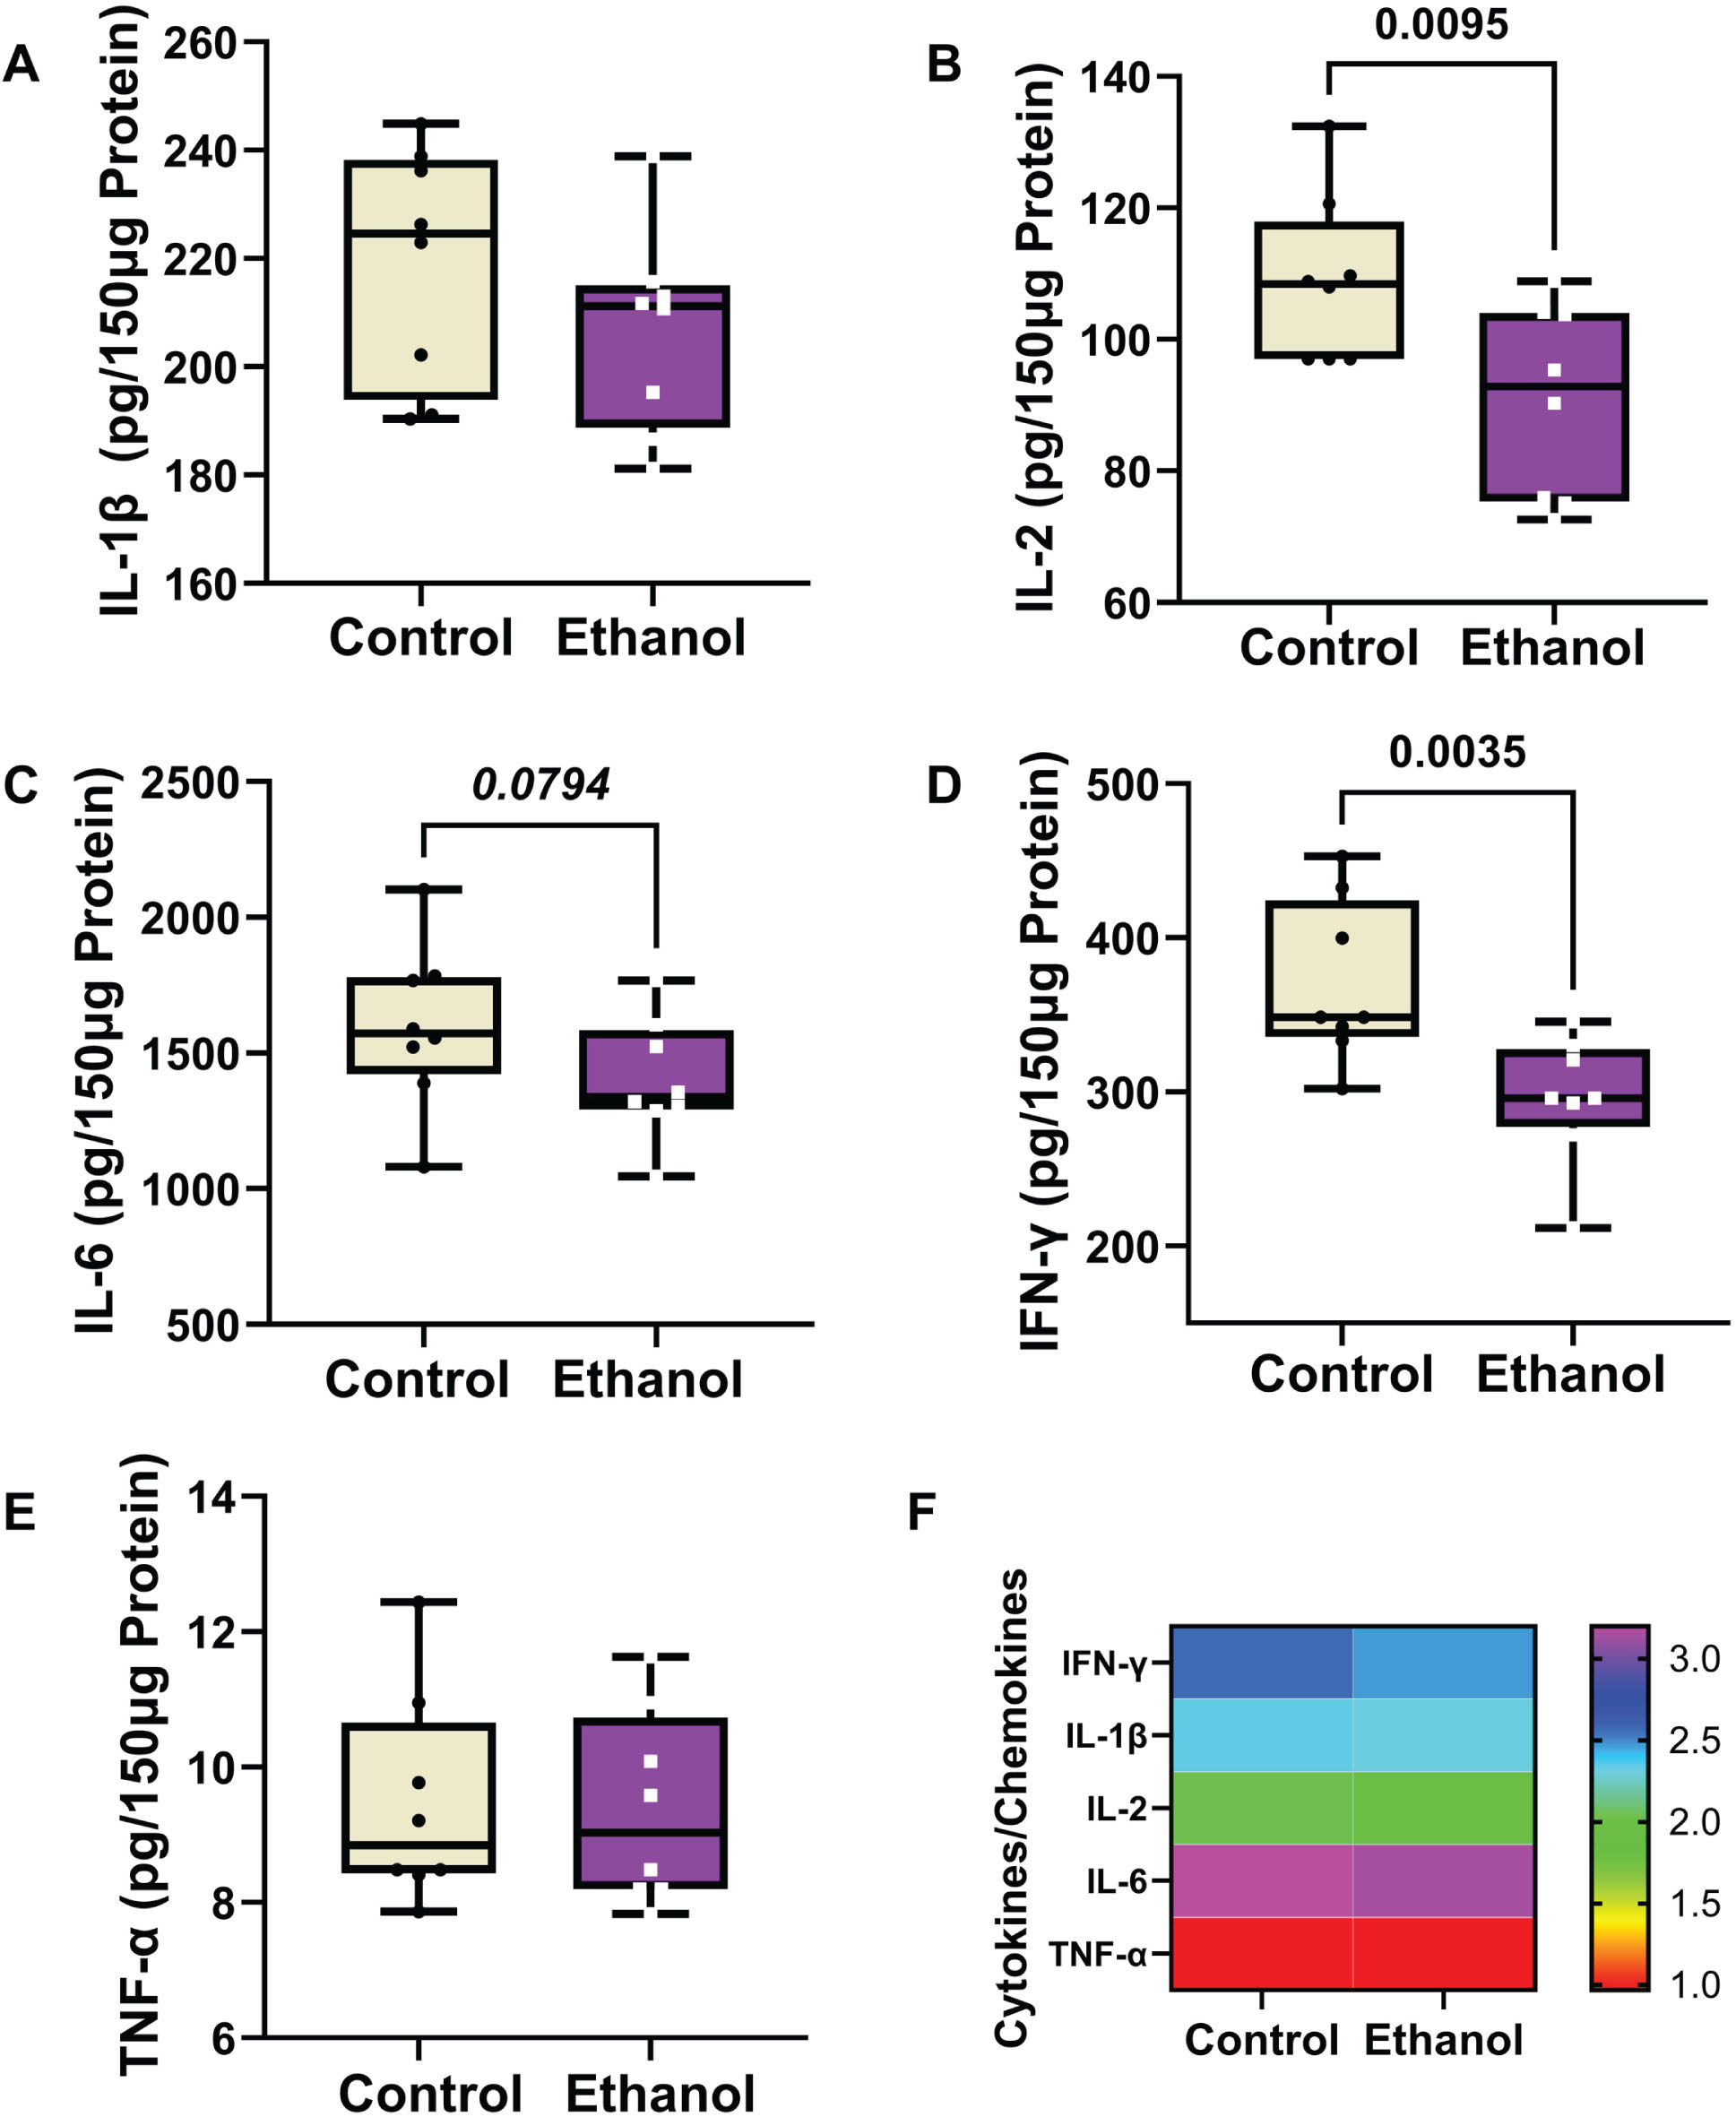
Ethanol exposure effects on frontal lobe expression of (A) IL-1β, (B) IL-2, (C) IL-6, (D) IFN-γ, and (E) TNF-α in Long Evans rats (n = 8/group). Immunoreactivity was measured with a 5-Plex pro-inflammatory cytokine and chemokine panel with equivalent amounts of protein per sample. Results are depicted with boxplots that include individual mean sample values (dots). Inter-group statistical comparisons (n = 8/group) were made by two-way ANOVA (Table 3) and post hoc Tukey tests. Significant p-values are displayed within the panels. (F) Heatmap displaying within-group and between-group differences in cytokine/chemokine expression. The scale bar reflects the Log10-transformed pg/150 μg protein results.
DISCUSSION
The progressive increase in AD prevalence over the past several decades, combined with modest advancements toward effective treatments have stimulated interest in environmental exposure and lifestyle related co-factors as mediators of the sporadic forms of neurodegeneration. 71 Consequently, links between AD-type neurodegeneration and obesity, insulin resistance diseases including diabetes mellitus, or repeated head trauma have gained attention.72–78 In addition, research on pathophysiological processes that contribute AD including deficits in energy metabolism associated with dysregulated insulin and other endocrine signaling networks, mitochondrial dysfunction, impairments in neuroplasticity, synaptic functions, cell growth and cell survival, neuroinflammation, and oxidative/nitrosative stress, 79 have been furthered, conceivably expanding opportunities for therapeutic targeting.
Beyond the nearly global shifts toward unhealthy lifestyle choices, is the potential role of heavy chronic or repeated binge alcohol exposures, which damage both cognitive-behavioral functions and brain structure in humans and experimental models19,20,22,80, 19,20,22,80 due to pathophysiological processes that overlap with those already known to occur in various neurodegenerative diseases, including AD. Given the high rates of alcohol use/abuse in underage (adole-scent) [https://www.niaaa.nih.gov/alcohols-effects-health/alcohol-topics/alcohol-facts-and-statistics/underage-drinking-united-states-ages-12-20] and adult[https://drugabusestatistics.org/alcohol-abuse-statistics/] populations in the US, it is worthwhile to consider how alcohol exposures may contribute to the pathogenesis of AD or other forms of neurodegeneration. Thus far, human studies designed to assess causal relationships between excessive alcohol consumption and AD have yielded mixed or inconclusive results, probably due to inhomogeneity regarding dose and duration of alcohol exposure. For example, studies that evaluated long-term effects of light or moderate alcohol consumption showed health benefits and diminished risk of neurodegeneration due to reduced cardiovascular disease.81,82, 81,82 In contrast, moderate to heavy chronic alcohol consumption was linked to premature aging.24,83,84, 24,83,84 However, since one of the leading risk factors for AD is aging, the findings in these studies suggest that heavy alcohol use could serve as a cofactor for AD due to accelerated aging. The present work was designed to examine the effects of moderate-level chronic alcohol exposure on the development of AD molecular pathologies in an established experimental model that previously was shown to exhibit brain atrophy and cognitive impairment. 56 However, the aim was to characterize early molecular and biochemical pathologies that could help explain the later development of neurodegeneration, including its potential relationship to AD.
One of the main findings in this study was that moderate chronic alcohol consumption modestly increased frontal lobe pTau but reduced Aβ immunoreactivity, indicating that at the relatively early time point studied, ethanol had just subtle to minimal effects on signature AD biomarkers. Aβ is generated by proteolytic cleavage of AβPP via beta and gamma-secretases.85,86, 85,86 Since AβPP has normal roles in neuronal growth, neurogenesis, and plasticity, 87 its processing and turnover, including proteolytic cleavage by secretases, would be expected to be high during periods of active brain maturation. Besides AβPP cleavage, secretases have important roles in Notch signaling, 85 a mediator of many functions including neurogenesis, 88 which is robust during adulthood brain maturation. 89 Conceivably, the ethanol-associated decline in Aβ reflected parallel reductions in secretase activity, 90 neurogenesis and Notch signaling. 91 Correspondingly, Aβ levels were found to be reduced in heavy alcohol users compared with non-drinkers. 92
The small upward trend in pTau could reflect either an AD-type neurodegenerative effect, or a response to sustained oxidative stress with increased activation of glycogen synthase kinase-3β (GSK-3β) mediated by ethanol-impaired insulin and IGF-1 signaling.93,94, 93,94 On the other hand, the failure to detect a robust increase in pTau as occurs in AD, could reflect the relatively short duration of the model, since previous studies showed that Tau phosphorylation, including pTau-205, occurs at later, more established stages of AD95,96, 95,96 and following chronic ethanol exposure in adolescent rats. 97 However, against that notion are the previous findings that the inhibition of IGF-1 signaling with activation of GSK-3β is sufficient to increase neuronal pTau within minutes, 98 and that GSK-3β is activated in neuronal cells within minutes of high-dose (binge) alcohol exposures. 94 Therefore, additional studies are needed to unpack the dynamics of Tau phosphorylation in the early stages of ethanol exposure since yet unknow factors may govern the reversibility versus persistence of this response.
Previous studies demonstrated significant AD-associated alterations in cholinergic function including reduced brain levels of ChAT and increased AChE in humans99,100, 99,100 and experimental models. 101 The absence of significant ethanol-related alterations in ChAT and AChE may indicate that the enzymatic mediators of acetylcholine biosynthesis and degradation were not modulated by the relatively short-term ethanol exposures. While these observations may support the concept that moderate chronic ethanol consumption does not contribute directly to AD pathology, one caveat is that the analyses were not focused on the basal forebrain which has abundant ChAT expression and previously was shown to be reduced by alcohol exposures in adolescent models.102–105
Studies directed toward measurements of metabolic markers linked to alterations in brain insulin pathway functions were notable for their consistent response patterns. For glucagon, leptin, ghrelin, and PAI-1, but not GLP-1, chronic ethanol feeding reduced the mean levels of protein expression relative to control. These results suggest that the early responses to moderate-level chronic ethanol feeding include inhibition of key regulators of energy metabolism in the brain.
Glucagon’s counter-regulatory role to insulin increases CNS glucose levels. In addition, glucagon stimulates the utilization of ketones and thereby enables glucose-independent brain metabolic activity. 106 Therefore, in the setting of brain insulin resistance with impairments in glucose metabolism, increased levels of glucagon could potentially support energy metabolism by promoting alternative fuel utilization, e.g., beta-hydroxybutyrate. In states of insulin resistance and reduced glucose metabolism, the brain can utilize ketones as an alternative energy source. 107 Brain insulin resistance occurs in both AD108–110 and alcohol-related brain degeneration. 109 However, the significantly reduced levels of brain glucagon detected in the ethanol exposure model indicates that the insulin resistance-mediated impairments in glucose utilization were not compensated for by increased levels of glucagon. Instead, the reduced levels of glucagon may have exacerbated energy deficits caused by insulin resistance in chronic ethanol-exposed brains.
Although leptin’s main effect in the brain is to regulate food intake by controlling the hypothalamus via JAK-STAT signaling, 111 one of its other functions is to reduce the formation of pTau-neurofibrillary tangles via inhibition of GSK-3β.111,112, 111,112 Since hyper-phosphorylated Tau-neurofibrillary tangle build-up correlates with severity of dementia in AD,113,114, 113,114 the ethanol-mediated reduction in leptin expression may be permissive to AD neurodegeneration due to its failure to inhibit pTau-neurofibrillary tangle formation. The ethanol-inhibition of leptin observed herein corresponds with the findings in a previous report 115 and may have relevance to the higher levels of pTau detected in ethanol samples.
Ghrelin is an endogenous ligand of the growth hormone secretagogue receptor 1a, and a hormone that opposes the physiological effects of leptin.58,116, 58,116 The ethanol-associated reduction in ghrelin corresponds with the previous finding that alcohol administration inhibits ghrelin secretion.117,118, 117,118 This effect of alcohol may serve as a short-term protective off-switch to reduce ghrelin-stimulated craving,119,120, 119,120 and consequently mitigate harmful reward-driven intake of alcohol. However, long-term heavy alcohol consumption with dependence is associated with elevated levels of ghrelin and alcohol consumption.121,122, 121,122 In this regard, the findings in a preclinical study that ghrelin increased self-administration whereas a ghrelin receptor antagonist reduced self-administration of rewarding substance 123 have potential applications for craving management in people with alcohol use disorder. Correspondingly, intravenous administration of ghrelin was shown to enhance alcohol craving in alcohol-dependent drinkers 124 while ghrelin receptor antagonism has shown promise in reducing alcohol craving, 125 consumption and relapse behavior in experimental models and humans.120,126,127, 120,126,127 Besides its effects on craving and alcohol-dependence behavior,120,128, 120,128 ghrelin positively impacts brain function,116,129, 116,129 and its deficiency or inhibition has been detected in human brains with moderate to advanced stages of AD, 58 as demonstrated by the improvements in spatial learning and memory in mice following intracerebroventricular administrations.116,129, 116,129 Therefore, a potential adverse effect of ghrelin inhibition by ethanol is to promote cognitive impairment, which occurs in both AD and ARBD.
Neuroinflammation is considered as one of the shared mechanistic mediators of neurodegeneration in ARBD and AD. Ample evidence has highlighted the presence of increased inflammation with the activation of pro-inflammatory cytokines in the chronic phases of many neurodegenerative diseases, including ARBD130–133 and AD.134,135, 134,135 Astrocytes and microglial cells have critical roles in elaborating cytokines and contributing to neuronal injury and death. Although there is considerable overlap with respect to the nature of pro-inflammatory and pro-oxidant mediators, the triggers and outcomes are not identical for ARBD and AD. Neuroinflammatory processes contributing to ARBD can be mediated by alcohol’s direct neurotoxic effects leading to cell damage and attendant cytokine release by activated astrocytes and microglia. 136 In addition, alcohol’s damaging effects on the liver drive pro-inflammatory and inhibit anti-inflammatory mediators, the effects of which can propagate CNS injury via the liver-brain or gut-liver-brain axis.109,137, 109,137 In AD, cytokine-mediated neuroinflammatory responses occur endogenously and are driven by astrocyte and microglial cell activation coupled with oxidative stress, largely in relation to Aβ and pTau pathologies, and metabolic dysregulation linked to impairments in insulin and IGF signaling through mTOR pathways.14,42,43, 14,42,43 In addition, systemic pro-inflammatory states, particularly those linked to dysregulated metabolism associated with insulin/IGF resistance, such as obesity, diabetes mellitus, and metabolic dysfunction-associated fatty liver disease (MAFLD) contribute to AD pathogenesis. 138 Correspondingly, neuroinflammation in the early stages of AD is associated with increased systemic pro-inflammatory cytokine activation,139–141 mirroring the concept that systemic inflammatory factors can contribute to AD neurodegeneration, similar to the pathophysiology of ARBD. By extension, a critical area of research would be to investigate the contributions of alcohol-mediated inflammation as mediators of neuroinflammatory responses leading to AD-type neurodegeneration.136,142,143, 136,142,143
PAI-1 is a serine protease inhibitor that prevents plasmin formation by inhibiting urokinase plasminogen activator. 144 Increased PAI in the CNS marks aging, vascular thrombosis, neuroinflammation, and insulin resistance. 144 In contrast, reduced PAI may help mediate Aβ degradation via increased activation of plasminogen. 145 Therefore, the reductions in PAI detected after ethanol exposure correlate with the declines in Aβ, suggesting that inhibition of PAI may be neuroprotective against some features of AD.
IL-1β, IL-2, and IL-6 are pro-inflammatory cytokines that play important roles in AD neuroin-flammation. 135 IL-2 and IFN-γ were significantly suppressed by ethanol whereas TNF-α was unaffected. Although chronic heavy drinking commonly leads to increased inflammation with activation of innate immune-mediated responses and attendant cellular injury and dysfunction,131,137,146–148, 131,137,146–148 acute alcohol exposure can have the opposite, albeit transient effects, resulting in immune suppression.137,149, 137,149 Similarly, abstinence in long-term drinkers has been associated with immune suppression.150,151, 150,151 The significance and consequences of these varied responses in relation to organ-systems functions are still under investigation. Since the brains were harvested during intoxication, the reduced cytokine levels could not be attributed to withdrawal effects. Instead, one possible interpretation is that the inhibitory effects of ethanol on IL-2 and IFN-γ corresponded to the non-inflammatory functions of these molecules in the brain.
IL-2 increases T cell proliferation and B cell activation in the periphery, but in the CNS, its neuroprotective actions help maintain septo-hippocampal cholinergic neurons. 152 The finding of reduced levels of IL-2 in AD hippocampal biopsies 153 suggest that inhibition or down-regulation of CNS IL-2 may mediate the cholinergic deficits that correlate with cognitive impairment and neurodegeneration in the early stages of AD.154,155, 154,155
IFN-γ causes inflammatory-mediated impairment of neural stem and progenitor cell maturation and differentiation.156,157, 156,157 However, like many other cytokines, in the CNS, IFN-γ has dual actions that are either pro-inflammatory or neuroprotective, depending on dose or expression levels, cellular stage of development, and disease stage. 158 IFN-γ -mediated neuroprotection supports neurogenesis effects that enhance spatial learning and memory. 159 It is unlikely that the significant reductions in IFN-γ immunoreactivity reflected an anti-inflammatory response vis-à-vis other evidence of neurodegeneration together with deficits in cognitive behavioral functions manifested by increased anxiety and impairments in spatial learning and memory. 56 Instead, like IL-2, the reduction CNS IFN-γ corresponds with previous reports that chronic alcohol consumption impairs neural plasticity in concert with perturbations cytokineactivity. 160
Conclusions
This study examined the degree to which moderate-level chronic ethanol exposures lead to molecular pathological changes of AD-type neurodegeneration. The only classical AD effect was a modest increase in phospho-tau. Instead, most of the alterations were related to impairments in energy metabolism corresponding to a well-recognized early component of both AD-type and alcohol-related neurodegeneration.
AUTHOR CONTRIBUTIONS
Yiwen Yang (Data curation; Formal analysis; Investigation; Writing – original draft; Writing – review & editing); Ming Tong (Data curation; Formal analysis; Investigation; Methodology; Project administration; Supervision; Writing – review & editing); Suzanne de la Monte (Conceptualization; Formal analysis; Funding acquisition; Investigation; Methodology; Project administration; Resources; Supervision; Validation; Visualization; Writing – original draft; Writing – review & editing).
Footnotes
ACKNOWLEDGMENTS
The authors thank Busra Delikkaya and Emine Yalcin for their support in generating the animal models and initial processing of the samples. The authors acknowledge Dr. Jason Machan, Director of the Lifespan Biostatistics Core, for support and consultation related to the statistical analyses ofour data.
FUNDING
This work was supported by grants from the National Institute on Alcohol Abuse and Alcoholism (AA-011431, AA-028408), and the Veterans Administration (IK2 BX004961/BX/BLRD VA).
CONFLICT OF INTEREST
The authors have no conflict of interest to report.
DATA AVAILABILITY
The data supporting the findings of this study are available within the article and/or its supplementary material.