
Abstract
Background:
Composite scores have been increasingly used in trials for Alzheimer’s disease (AD) to detect disease progression, such as the AD Composite Score (ADCOMS) in the lecanemab trial.
Objective:
To develop a new composite score to improve the prediction of outcome change.
Methods:
We proposed to develop a new composite score based on the statistical model in the ADCOMS, by removing duplicated sub-scales and adding the model selection in the partial least squares (PLS) regression.
Results:
The new
Conclusions:
ADSS can be utilized in AD trials to improve the success rate of drug development with a high sensitivity to detect disease progression in early stages.
Keywords
INTRODUCTION
In Alzheimer’s disease (AD) trials, the primary endpoint is often chosen as change from baseline on cognitive measures in the treatment group compared to the placebo group at the end of the double-blind period [1, 2]. Cognitive outcome measures are used to assess the severity of dementia and disease progression for mild cognitive impairment (MCI) and AD patients. Frequently used cognitive outcome measures include the Clinical Dementia Rating – Sum of Boxes (CDR-SB), Alzheimer’s Disease Assessment Scale – Cognitive Subscale (ADAS-Cog), and Mini-Mental State Examination (MMSE). In addition to these individual cognitive and global assessment measures, several composite scores were developed to increase the sensitivity to detect score change from baseline, such as the AD Composite Score (ADCOMS), and the Integrated Alzheimer’s Disease Rating Scale (iADRS) [3–5]. Such composite scores were calculated from the sub-scales or the total scores of instruments used in the trials. The ADCOMS was one of the secondary outcomes in the most recent FDA approved AD drug, lecanamab [6, 7]. The primary outcome of that phase 3 trial was the CDR-SB. With a large sample size in phase 3 trials, the pre-specified clinically meaningful change in the CDR-SB can be detected. In early phase trials (e.g., proof of concept trials), sample size is often small and an outcome measure that is sensitive to detect outcome change is needed to identify potentially effective treatments.
For a composite score developed from a repeated-measure study, linear mixed-effect models may be used to develop optimal composite scores [8]. Unfortunately, composite scores based on mixed-effect models may decrease the statistical power [8] for the following two reasons: 1) multicollinearity among sub-scales; and 2) positive or negative association between cognitive measures and disease progression. Several statistical models were developed to overcome these challenges, including the nonlinear mixed model with constraints on the range of the parameters, and the partial least squares (PLS) regression.
Variable selection methods are commonly used in data analysis to reduce the number of predictors in the final model. The three classical methods are forward selection, backward elimination, and stepwise selection. Traditionally, these methods depend on one criterion, such as the p-value of a model. However, in the variable selection procedure for the composite score development, two criteria are considered: the relationship between cognitive outcome measures and time since baseline, and the variable importance (VIP). In practice, we would expect a monotonic relationship between time since baseline and cognitive outcome measures. Variable importance is referred to be as the importance index of a variable in the model prediction. We built the
Sample size calculation is a key aspect of AD trial planning. Reducing the sample size of a trial will decrease the time required for recruitment and accelerate the ability to assess putative therapies in trials. The subtraction method is traditionally used to calculate sample size based on the two-sample z test with the score change as the outcome [9]. This method has a closed formula which is relatively easy to implement [10–12], but it has several limitations [13]. This method could under- or over-estimate sample size when a new study’s follow-up is longer or shorter than the pilot study’s follow-up time [13]. In addition, the correlation between the cognitive outcome measure at the follow-up and that at baseline could be utilized to improve designing AD trials [14, 15].
METHODS
Data sets
Two data sets were used to develop and validate new composite scores to detect clinical progression in early stages of AD. First, in the development of the new ADSS, we included data of MCI patients from the ADNI database (downloaded on the date of November 29, 2022) [16, 17]. The total number of MCI patients was 1096 with n = 396 from ADNI-1, n = 129 from ADNI-Go, n = 342 from ADNI-2, and n = 229 from ADNI-3. Among them, there were over 800 participants having visits at the 6-month follow-up, 788 participants having year 1 visit, and 676 participants completed year 2 visit. Among 676 participants with year 2 follow-up, 624 participants had complete sub-scales for the outcomes of our interest, and they are MCI patients in building the model. Out of these 624 MCI patients, 173 patients progressed to dementia due to AD at the year 2 follow-up with the estimated conversion rate of 27.7%.
Second, in validating the ADSS, we utilized data of the MCI participants from the Alzheimer’s Disease Cooperative Study (ADCS) to evaluate the efficacy of vitamin E and donepezil for the treatment of MCI in a randomized placebo-controlled three-arm study. That study enrolled a total of 769 MCI patients.
Baseline characteristics of these two cohorts are presented in Table 1. The proportion of female in the ADCS study is slightly higher than that in the ADNI MCI cohort. Other than that, these two studies have similar study populations.
Baseline characteristics of the ADNI MCI cohort and the ADCS study
ADNI, Alzheimer’s Disease Neuroimaging Initiative; MCI, mild cognitive impairment; ADCS, Alzheimer’s Disease Cooperative Study; CDR-SB, Clinical Dementia Rating – Sum of Boxes; ADAS-Cog, Alzheimer’s Disease Assessment Scale – Cognitive Subscale; MMSE, Mini-Mental State Examination.
Models for longitudinal data
Wang et al. [3] developed a statistical model to detect clinical decline with the outcome as the time from baseline. Let t be the time at the follow-up and t0 be the time at baseline. For a study with K outcome measures (e.g., CDR-SB, ADAS-cog, their sub-scales), their proposed model is presented as
Outcome measures
We included the commonly used clinical trial total score measures: (I) CDR-SB, (II) the 13-item ADAS-cog, and (III) MMSE. Their sub-scales were included in the model. The CDR-SB has 6 domains: 1) memory, 2) orientation, 3) judgment and problem solving, 4) community, 5) home and hobbies, and 6) personal care. The ADAS-cog-13 include 13 domain areas: word recall, commands, constructional Praxis, delayed recall, naming, ideational praxis, orientation, word recognition, recall instructions, spoken language, word finding, comprehension, and number cancellation. The MMSE has 7 domain areas: orientation to time, orientation to place, language, attention and calculation, registration, recall, and constructional praxis [3, 22].
We also investigated the additional prediction power gain by adding other measures, such as Functional Activities Questionnaire (FAQ) and Neuropsychiatric Inventory (NPI) [23]. The FAQ includes 10 domain areas: manage finances, complete forms, shop, perform games of skill or hobbies, prepare hot beverages, prepare a balanced meal, follow current events, attend to television programs, books or magazines, remember appointments, and travel out of the neighborhood. Each domain has the score from 0 to 5, with the maximum total score of 50. The FAQ scores were used in predicting the disease progression [24]. NPI consists of 12 sub-scales to assess neuro-psychiatric symptoms [23].
Partial least square regression and model selection
The statistical model in Equation (1) was used in the PLS regression to derive the ADSS using the ADNI MCI data. PLS regression is used to find independent components from the existing variables. The first component was used as the composite score in this research. This component represents the eigenvector (e.g., the weights) for the largest eigenvalue of the covariance matrix between time (t − t0) and cognitive scores. It is possible that the weight for each cognitive score may be negative although a positive correlation coefficient between time and each cognitive score is assumed. The backward variable selection approach was utilized to remove cognitive measures whose parameter estimates are negative in the fitted statistical model. The following steps were used to derive the final composite score based on the PLS and the backward variable selection approach. Step 1: Select the clinical scores that have a positive correlation with time t−t0. These X
i
s are the initial set of the outcome measures which is a subset of {X
i
: = 1, 2, …, K}. Step 2: Run a PLS regression with the identified set of outcome measures from Step 1. Step 3: The backward selection approach was used in the PLS regression model to delete outcome measures with negative parameters. Step 4: Among the remaining outcome measures, the ones with low VIP values were then removed by using the backward selection approach. During this step, any cognitive outcome measure with a negative parameter estimate was removed first by using the method in Step 3.
This can be viewed as an iterative approach as Step 3 could be used multiple times. The backward selection approach was used in removing cognitive outcome measures with negative parameter estimates or low VIP values.
To avoid including similar orientation sub-scales from the three cognitive measures, we run this model selection approach three times by including the orientation sub-scale from one of the three measures in Step 1.
Comparison with other measures
We first compared the sensitivity of the developed ADSS with the existing measures by using the mean to standard deviation ratio (MSDR). We calculated the bias-corrected MSDR by using 10,000 bootstrap samples. The existing cognitive scores include three widely used total score outcome measures (CDR-SB, ADAS-Cog, and MMSE), and the composite score ADCOMS [3]). A larger MSDR value represents a larger effect size, which leads to greater sensitivity. In addition to the MCI population, we also compared the MSDR between the new composite scores and the existing scores in some enriched population (e.g., Apolipoprotein E ɛ4 (APOE4) carries and Amyloid-β positive patients assessed with positron emission tomography (PET)).
We then compared the sample sizes required for a parallel randomization study by using the ADNI MCI patients as the control group. The sample size for a randomized study was calculated by assuming a 25% slowing of cognitive decline as the observed benefit in a new treatment group as compared to the control group. In addition to the traditional subtraction method for sample size calculation, we considered the approach based on analysis of covariance (ANCOVA) where the baseline measure is the only covariate in the sample size calculation [15]. After analysis of the ADNI MCI data, we used the SMC cohort from the ADNI to validate the newly derived ADSS.
In a two-arm randomized trial, suppose μ G 0 and μ G 1 are the mean of the outcome measure at baseline and that at the follow-up for the group G, G = c for the control group and G = t for the treatment group. Then, μ t = μ t 1 − μ t 0 (color blue in Fig. 1) and μ c = μ c 1 − μ c 0 (color red in Fig. 1) are the change of the outcome at the follow-up from baseline in the treatment group and the control group, respectively. Their difference δ = μ c − μ t is the parameter of interest (green line in Fig. 1). The statistical hypothesis is:
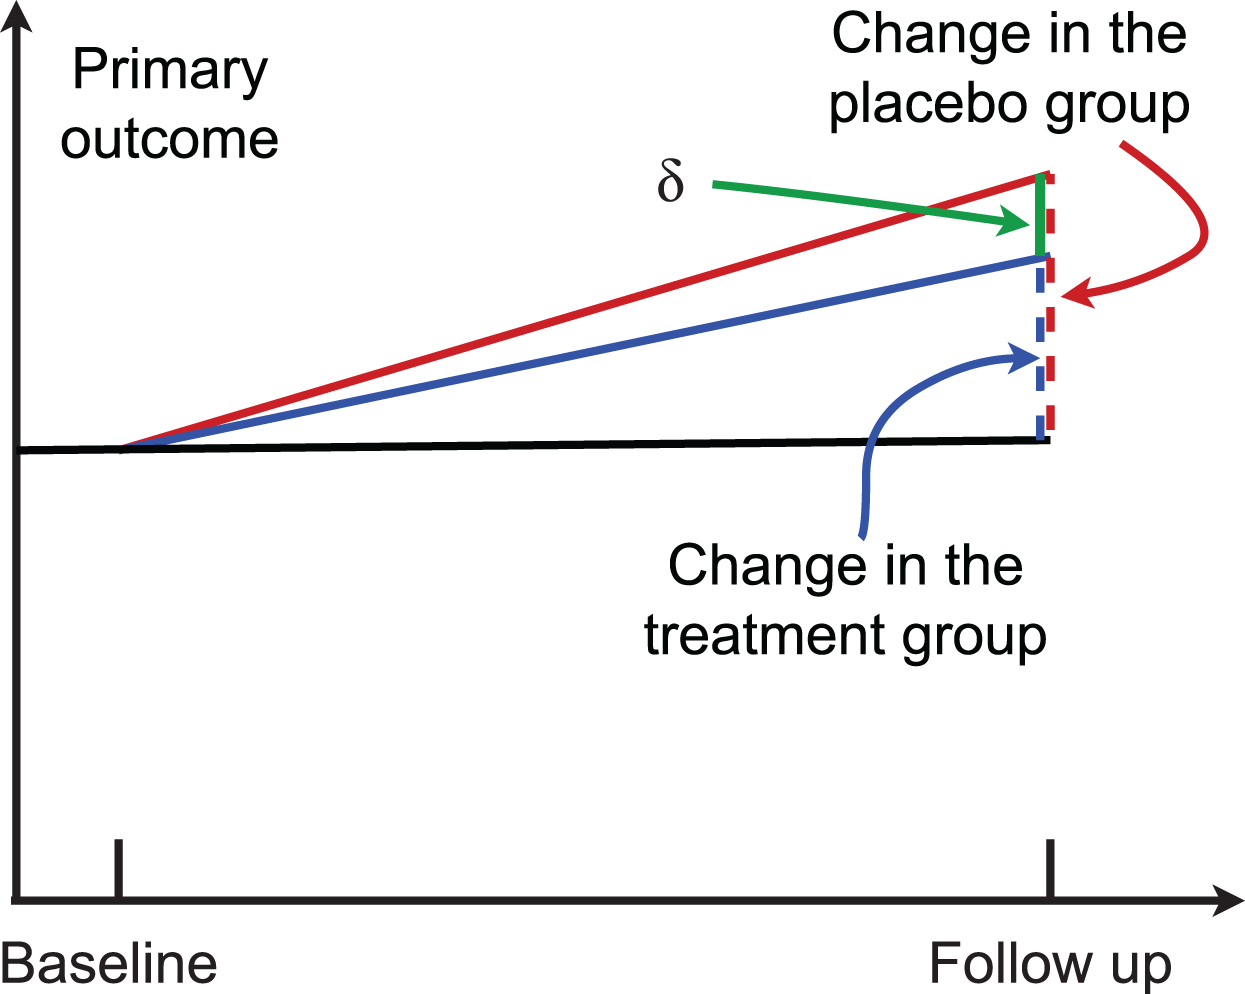
A randomized two-arm study. Higher scores indicate worse cognitive performance.
The traditional subtraction method calculates the sample size by using the estimated value of
RESULTS
We first used the sub-scales from CDR-SB, MMSE, ADAS-cog-13 to derive the ADSS by using the method described above, by using the ADNI MCI patients having baseline, 6 month, 1-year, and 2-year follow-up data. The threshold value of VIP could affect the model performance. For that reason, we run the model with VIP threshold value from 0.3 to 0.8 by 0.05, and found that the model with the threshold value of 0.75 with MMSE orientation sub-scales has a high MSDR. That final model includes 7 sub-scales: 4 sub-scales from CDR-SB (memory, community, home and hobbies, and judgment and problem solving), 1 sub-scale from ADAS-cog (delayed word recall), and 2 sub-scales from MMSE (orientation to time, and memory recall). Their weights are presented in Table 2. The VIP results are shown in Fig. 2.
Weights for the new ADSS
ADSS, AD composite Score with variable Selection; ADAS-Cog, Alzheimer’s Disease Assessment Scale – Cognitive Subscale; MMSE, Mini-Mental State Examination; CDR-SB, Clinical Dementia Rating – Sum of Boxes.
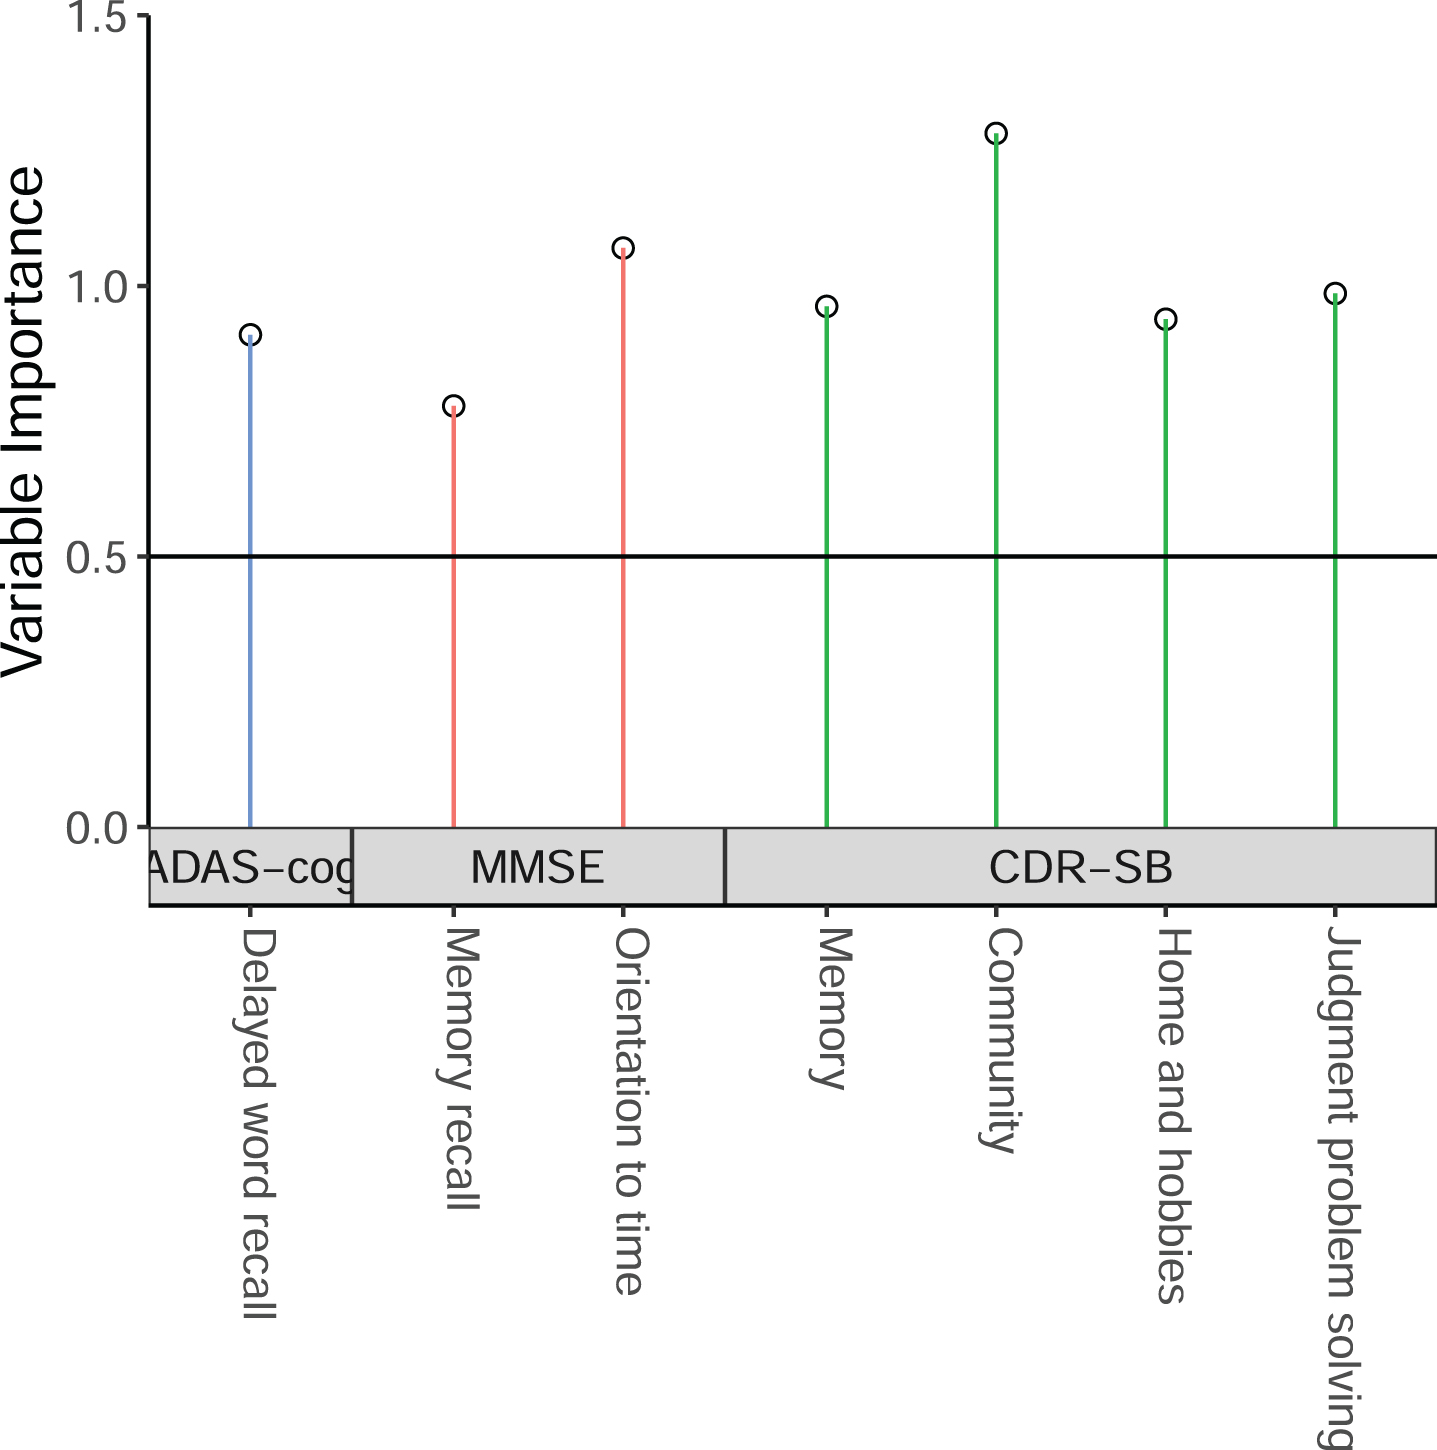
The selected cognitive outcome measures in the new ADSS composite score.
We compared the MSDR of the new ADSS with the existing cognitive scores including the composite score ADCOMS in Table 3. In the MSDR calculation, the score change at 2-year follow-up from baseline was used to calculate the mean and the standard deviation of score change in 2 years. The estimated MSDR for the new composite score was 0.5726, and the bias-corrected MSDR estimated using the bootstrap approach was 0.5508. The range of MSDR is from 0.4026 to 0.5726 for these five scores. ADCOMS has similar MSDR as the proposed new composite score (0.5535 versus 0.5726). Orientation sub-scales from the three cognitive tests were all included in the ADCOMS. The duplicated effects from orientation sub-scales may increase the difficulty in interpretation. The proposed ADSS has a larger MSDR than the commonly used total score CDR-SB (0.4556). The MSDR ratio between the new ADSS and the existing scores is at least 1.03 as compared to the commonly used scores including ADCOMS. In the subgroups of APOE4 carries or amyloid-β positive patients, the ADSS has a larger MSDR than the existing scores, and the difference is similar to that in the overall MCI population.
Sensitivity comparison between the new ADSS with the existing scores by using the MSDR in MCI group and two enriched subgroups
ADSS, AD composite Score with variable Selection; MSDR, mean to standard deviation ratio; MCI, mild cognitive impairment; CDR-SB, Clinical Dementia Rating – Sum of Boxes; ADAS-Cog, Alzheimer’s Disease Assessment Scale – Cognitive Subscale; MMSE, Mini-Mental State Examination; ADCOMS, AD Composite Score.
In Table 4, we presented sample sizes for a study to detect a 25% reduction in clinical decline at 2-year follow-up from baseline by using the existing 4 scores and the new ADSS. When a study was designed by using the subtraction method, the required sample size is a function of the MSDR. For that reason, the new composite score requires the smaller sample size as compared to the existing total scores as shown in Table 3 comparing MSDR values. The ratio of the required sample sizes between the existing cognitive measure and the new composite score is the square of the MSDR ratio between them. ADCOMS requires similar sample sizes as the ADSS. The individual total scores require at least 59% more participants than the ADSS in MCI patients.
Sample size comparison between the new ADSS with the existing scores by using the MSDR in MCI group and two enriched subgroups, to detect a 25% benefit in a new treatment as compared to the control group. Two methods were used for sample size calculation: the subtraction method and the ANCOVA method
ADSS, AD composite Score with variable Selection; MSDR, mean to standard deviation ratio; MCI, mild cognitive impairment; CDR-SB, Clinical Dementia Rating – Sum of Boxes; ADAS-Cog, Alzheimer’s Disease Assessment Scale – Cognitive Subscale; MMSE, Mini-Mental State Examination; ADCOMS, AD Composite Score.
When the ANCOVA approach is used in sample size calculation with baseline cognitive score being adjusted in the outcome, the sample size formula in Equation (3) can be used to calculate the required trial sample sizes. As compared to the sample size n s based on the subtraction method, the sample size n c is often much smaller, especially when the correlation ρ is high. For these measures, the range of ρ is from 0.45 to 0.78. ADAS-cog has the highest correlation, followed by ADSS, and ADCOMS. The new score reduces sample sizes at least 77% as compared to CDR-SB.
Validation
The developed ADSS was validated by using MCI patients’ data from the ADCS [28]. We identified 536 MCI participants having complete CDR-SB, ADAS-cog, MMSE, and their sub-scales at 18 months. At the 18-month follow-up visit, the donepezil treatment group (n = 168) had the lowest MCI-to-AD conversion rate of 14% as compared to the AD onset rate of 24% and 22% in the vitamin E arm (n = 184) and the placebo arm (n = 184), respectively. When combining data from all the three arms, the new ADSS has the highest MSDR of 0.405, followed by CDR-SB (0.383), MMSE (0.270), and ADAS-cog (0.231). In this example, the ADCOMS has a slightly higher MSDR than the ADSS. Within each arm, the new ADSS and the CDR-SB often have larger MSDR values than others. The ADSS has similar MSDR values as the CDR-SB in the donepezil arm and the vitamin E arm, but the ADSS has 15% higher MSDR than CDR-SB in the placebo arm.
We calculated the predictive validity of the ADSS by using the 624 MCI patients from the ADNI [29]. They can be separated into two subgroups: 173 patients progressed to dementia due to AD at the year 2 follow-up visit, and the remaining 451 patients who remained MCI status. In these 2 years, MCI patients who remained stable in that 2 years had very slight decline of the ADSS (mean change of 0.35 with SD of 1.41), while the ADSS was increased by 3.56 (SD = 2.07) in the 173 patients progressed to dementia due to AD. These results indicate high predictive validity of the proposed ADSS.
DISCUSSION
Our goal in developing the ADSS was to create a valid score that will allow sample size reductions for clinical trials. The slowest aspect of clinical trial conduct is recruitment of patients; the recruitment time usually exceeds the period of drug exposure in the trial [30]. Reducing sample size can decrease the recruitment time and accelerate assessment of candidate treatments in trials. To overcome the challenge of multicollinearity, we first calculated the Pearson correlation coefficients between each cognitive total score or sub-scale and the outcome. We included only the cognitive outcome measures with outcomes measures in the expected direction of correlation in the statistical model to derive a new composite score. Different cognitive tests may have similar domains (e.g., orientation) [10], leading to highly correlated measures [31, 32]. The PLS regression was used in this project to compute independent components.
The threshold value of VIP in the model selection was chosen to be as 0.75. The model prediction could be affected by the VIP threshold value [33]. When the VIP threshold value is too low, many cognitive outcome measures will be selected, which could increase the complexity of model interpretation. Meanwhile, a high VIP threshold value reduces the number of predictors in the final model. In this case, the model prediction may be affected. The commonly used threshold value of 0.8 for VIP [34] did not perform as well as the lower threshold values. The threshold value of 0.75 was used to select enough cognitive outcome measures in the ADSS.
We investigated the improvement of the final composite score by adding additional predictors from the FAQ for measuring impairment in instrumental activities of daily living [24] and the NPI for assessing neuropsychiatric symptoms [23]. The estimated MSDR of change from baseline can be increased when the following 7 sub-scales from the FAQ were added to the final composite score: finances, paperwork, preparing a meal, events, travel, game, and shopping. But not all AD trials collect FAQ data which limits the usage of the model with FAQ sub-scales. For the NPI sub-scales, given the significant amount of missing data, we did not observe improvement in the prediction power.
We only utilized the natural history data (the ADNI study) in developing the model, which could be considered as a limitation as compared to the ADCOMS developed by using the ADNI and the control group data from AD trials. ADSS was developed to avoid including multiple highly correlated orientation sub-scales. As ADSS was developed by using the statistical model in the ADCOMS, we would expect them have similar prediction performance in some applications. In general, the ADSS has similar performance as the ADCOMS. It should be noted that the ADNI data is an observational dataset [35]. MCI patients in the ADNI study may have different disease progression rates as compared to the MCI patients who are assigned to the control group in AD trials.
In addition to the commonly used cognitive outcome measures (e.g., ADAS-cog), more sensitive outcome measures are in great need to detect cognitive change. One example would be the digital cognitive testing, which can be assessed remotely [36]. The PLS method provides the parameter estimates that can be used directly in computing the composite score. The statistical model is used to select the sub-scales, which may not lead to better interpretation of clinical meaningfulness of the composite scores. Alternatively, machine learning methods that can provide parameter estimates may be considered in the future to further improve the prediction of disease progression. We consider utilizing machine learning methods to develop new composite scores as future work.
AUTHOR CONTRIBUTIONS
Guogen Shan (Conceptualization; Data curation; Formal analysis; Funding acquisition; Investigation; Methodology; Project administration; Resources; Software; Supervision; Validation; Writing – original draft; Writing – review & editing); Xinlin Lu (Methodology; Software; Validation; Writing – original draft); Zhigang Li (Methodology; Writing – original draft); Jessica Z.K. Caldwell (Methodology; Resources; Writing – original draft); Charles Bernick (Conceptualization; Methodology; Writing – original draft); Jeffrey Cummings (Conceptualization; Data curation; Methodology; Writing – original draft).
Footnotes
ACKNOWLEDGMENTS
We would like to thank the four reviewers and editor whose comments helped us improve the manuscript. Data collection and sharing for this project was funded by the Alzheimer’s Disease Cooperative Study (ADCS) (National Institutes of Health Grant U19 AG010483).
FUNDING
GS is supported by grants from the National Institutes of Health: R01AG070849, R03AG083207, and R03CA248006. JC is supported by NIGMS grant P20GM109025; NINDS grant U01NS093334; NIA grant R01AG053798; NIA grant P20AG068053; NIA grant P30AG072959; NIA grant R35AG71476; Alzheimer’s Disease Drug Discovery Foundation (ADDF); Ted and Maria Quirk Endowment; and the Joy Chambers-Grundy Endowment.
CONFLICT OF INTEREST
JC has provided consultation to Acadia, Actinogen, Alkahest, AlphaCognition, Aprinoia, AriBio, Biogen, BioVie, Cassava, Cerecin, Corium, Cortexyme, Diadem, EIP Pharma, Eisai, GemVax, Genentech, Green Valley, GAP Innovations, Grifols, Janssen, Karuna, Lilly, Lundbeck, LSP, Merck, NervGen, Novo Nordisk, Oligomerix, Optoceutics, Ono, Otsuka, PRODEO, Prothena, ReMYND, Resverlogix, Roche, Sage Therapeutics, Signant Health, Simcere, Sunbird Bio, Suven, SynapseBio, TrueBinding, and Vaxxinity pharmaceutical, assessment, and investment companies.
All other authors have nothing to disclose.
DATA AVAILABILITY
Data used in preparation of this article were obtained from the Alzheimer’s disease Neuroimaging Initiative (ADNI) database (![]() ). Thus, the investigators within the ADNI contributed to the design and implementation of ADNI and/or provided data, but did not participate in this analysis or the writing of this report. A complete listing of ADNI investigators can be found at its website.
). Thus, the investigators within the ADNI contributed to the design and implementation of ADNI and/or provided data, but did not participate in this analysis or the writing of this report. A complete listing of ADNI investigators can be found at its website.
The vitamin E and donepezil trial was supported by NIH (U19AG010483), Pfizer and Eisai, and DSM nutritional products (vitamin E donation). The complete list of institutions and persons participated in the ADCS can be found their website.