
Abstract
Recently, low-sensitive plasma assays have been replaced by new ultra-sensitive assays such as single molecule enzyme-linked immunosorbent assay (Simoa), the Mesoscale Discovery (MSD) platform, and immunoprecipitation-mass spectrometry (IP-MS) with higher accuracy in the determination of plasma biomarkers of Alzheimer’s disease (AD). Despite the significant variability, many studies have established in-house cut-off values for the most promising available biomarkers. We first reviewed the most used laboratory methods and assays to measure plasma AD biomarkers. Next, we review studies focused on the diagnostic performance of these biomarkers to identify AD cases, predict cognitive decline in pre-clinical AD cases, and differentiate AD cases from other dementia. We summarized data from studies published until January 2023. A combination of plasma Aβ42/40 ratio, age, and APOE status showed the best accuracy in diagnosing brain amyloidosis with a liquid chromatography–mass spectrometry (LC–MS) assay. Plasma p-tau217 has shown the best accuracy in distinguishing Aβ-PET+ from Aβ-PET–even in cognitively unimpaired individuals. We also summarized the different cut-off values for each biomarker when available. Recently developed assays for plasma biomarkers have undeniable importance in AD research, with improved analytical and diagnostic performance. Some biomarkers have been extensively used in clinical trials and are now clinically available. Nonetheless, several challenges remain to their widespread use in clinical practice.
INTRODUCTION
Plasma biomarkers of Alzheimer’s disease (AD) are less invasive and have lower costs, providing more time-efficient measurements than cerebrospinal fluid (CSF) or molecular neuroimaging biomarkers. Most studies have focused on detecting pre-clinical AD cases, aiming to improve subject selection for clinical trials testing disease-modifying drugs for AD [1, 2]. The most extensively evaluated plasma AD biomarkers are the plasma amyloid-β (Aβ), especially Aβ42 and Aβ40, and the phosphorylated tau (p-tau) protein at epitopes 181, 217, and 231 (p-tau181, p-tau217, and p-tau231), which are markers of the pathological hallmarks of AD, i.e., neuritic plaques and neurofibrillary tangles, respectively [3]. In recent years, these plasma biomarkers of AD have shown promising results to become viable surrogates for the CSF or molecular brain imaging biomarkers’ modalities [2]. Other plasma biomarkers commonly evaluated in AD include the neurofilament light protein (NfL), a marker of neuroaxonal injury and neurodegeneration, and the glial fibrillary acidic protein (GFAP), a product of astroglial activation and astrocytosis [4–6]. These biomarkers have been studied in clinical and community samples [7] and, together with other recent advances in the field, including commercially available tests [8, 9], anticipate the possibility of their use not only for research purposes but also in clinical settings.
Despite the technical advances in measuring different plasma AD biomarkers, there are still many challenges before their large-scale application, especially in clinical settings. For example, it is still unclear which is the best platform to measure these biomarkers. Also, there is no consensus on the best cut-off values for these biomarkers that can be applied in different samples to distinguish between AD versus non-AD cases. Additionally, we need a better understanding of how different variables like the blood-brain barrier permeability, the biomarkers’ metabolization dynamics, the typical brain aging, and the systemic comorbidities can affect their measurement [10–13].
This review aims to provide a critical overview of the most recent developments in the investigation of plasma AD biomarkers. We review available assays and measurement methods, their advantages, and disadvantages. When applicable, we review the available data on the biomarkers’ cut-off scores and how these biomarkers can be used in research and clinical settings. Although our focus is on plasma AD biomarkers, we acknowledge that the analyses of other biological matrices, like the CSF, and structural and molecular neuroimaging methods have been extensively used to analyze AD biomarkers.
METHODS
We searched the PubMed database in January 2023 for articles matching the following search terms: Alzheimer’s disease AND blood OR plasma OR serum biomarkers. We also checked a reference list to include other important published works on the field. We included articles published in English only. We focused on articles describing novel laboratory methods for measuring blood-based biomarkers and included information about cut-off values to discriminate AD from normal aging or other non-AD dementia syndromes.
LABORATORY METHODS AVAILABLE
Since the late 1990s, different analytical platforms have been used to measure plasma AD biomarkers. The early laboratory methods, like the enzyme-linked immunosorbent assay (ELISA), were initially developed to detect AD biomarkers, i.e., Aβ40 and Aβ42 peptides, total tau (t-tau), and p-tau protein in the CSF. However, they yielded inconsistent results for their analyses in the plasma. For example, studies using the INNOTEST® assay (Fujirebio, Europe) showed that significant reductions in the concentration of Aβ42 in the CSF were mostly related to amyloid deposition in the brain due to AD pathology [14]. However, studies using ELISA did not show significant correlations between plasma Aβ and CSF Aβ concentrations or brain Aβ burden [15–17]. In addition, different methodological issues significantly affected the performance of these ELISAs, including their low sensitivity to detect AD biomarkers at very low concentrations in the blood and the significant interference of the blood matrix composition in the assay performance.
In the past few decades, other analytical methods have been developed and evaluated to measure plasma AD biomarkers with different success rates [18]. The Multiple Analyte Profiling (xMAP) technology was one of the first technologies available as an alternative to traditional ELISA. One advantage of the xMAP is the simultaneous measurement of Aβ40, Aβ42, total tau, and p-tau isoforms, thus, reducing the amount of sample and improving the general workflow for biomarkers’ analyses [19]. Although presenting with higher sensitivity than ELISA, the results from the semi-automated Luminex xMap® assays for plasma AD biomarkers were frustrating, including the absence of significant correlations between plasma and CSF Aβ concentrations, and poor reproducibility of the assay across different laboratories [15, 20].
In 2010, a single molecule enzyme-linked immunosorbent assay (digital ELISA) was developed to detect AD biomarkers. This technology uses arrays of femtoliter-sized reaction chambers named Simoa (Quanterix, Billerica, MA, USA) [21]. This platform can detect much lower protein concentrations than conventional ELISA or multiplex assays (femtogram versus picogram, respectively). The Simoa platform allowed greater plasma or serum sample dilution while providing fewer matrix interferences. The digital assay technique generates precise and exact quantifications of these biomarkers [22, 23]. The Simoa platform has become one of the most used platforms for plasma biomarkers analyses and has been recently granted the designation of Breakthrough Device from the Food and Drug Administration (FDA) in the United States for the plasma p-tau181 assay [24].
Fully automated, electrochemiluminescence (ECL)-based assays are increasingly moving forward as surrogates of traditional ELISA and xMAP technologies. These include the Elecsys immunoassay (Roche Diagnostics, Penzberg, Germany), the EUROIMMUN® ECL immunoassay (EUROIMMUN, Lüebeck, Germany), and the Mesoscale Discovery (MSD) platform (Meso Scale Diagnostics, Rockville, MD, USA) (Table 1). These platforms showed improved sensitivity to detect lower levels of biomarkers in the plasma over traditional ELISA assays [25–28]. The ECL-based assays have comparable performance with the Simoa assay for both Aβ and p-tau quantification, especially after the development of automated systems such as the MSD platform [27–30]. The recently available, fully automated Lumipulse G System® (Lumipulse, Fujirebio, Ghent, Belgium) plasma test, a chemiluminescent enzyme immunoassay, is an example of a new technique paving the way to replace the need for lumbar puncture and neuroimaging in AD diagnostic workups [1]. The FDA recently approved its version for CSF analyses for clinical use [9, 31].
Platforms available for plasma biomarkers of AD analyses and their characteristics
Aβ, amyloid-β; TDP-43, TAR-DNA binding protein 43; IA, immunoassay.
Another major milestone in the field was the development of an immunoprecipitation and mass spectrometry (IP-MS) test to measure different plasma biomarkers. The IP-MS methods are very reliable for protein quantification and have shown robust results for Aβ and p-tau quantification in the plasma [8, 33]. Some MS-based methods can be interfaced with liquid chromatography (LC-MS), adding accuracy to this technology [32, 35]. Two recent studies comparing several assays using a head-to-head design revealed the superiority of some IP-MS methods, e.g., LC-MS, compared to other assay methods, especially ELISA assays for detecting Aβ and p-tau species [27, 32]. These techniques have been extensively studied for Aβ and need further development and validation to quantify different p-tau species in the plasma [2]. Although more prospective studies are necessary to determine their diagnostic properties, some MS-based assays have been used as Laboratory Developed Tests (LDT) in the United States [27, 38]. Other assays, like the PrecivityADTM test, the Quest AD-DetectTM, and the Elecsys Amyloid Plasma Panel (EAPP), are also available for clinical use (see below) [37–39].
Despite the major advances in the field, with some assays already available for clinical use, these ultra-sensitive platforms are still costly and have limited availability, restricting their widespread use in clinical settings, either as screening or diagnostic tools. However, incorporating biomarkers analyses has become the norm in clinical trials as screening tools for trial inclusion, evaluation of target engagement, and monitoring the effect of drugs or biologics on AD pathological hallmarks [40]. Table 1 summarizes the different platforms available for analyzing plasma biomarkers of AD and their characteristics.
AMYLOID AND TAU PLASMA BIOMARKERS
Plasma amyloid-β
A large bulk of literature evaluated the plasma levels of Aβ42, Aβ40, and the Aβ42/40 ratio in AD using different platforms. Most studies have found lower plasma Aβ levels in patients with AD compared to cognitively unimpaired individuals. Also, it has been able to distinguish abnormal from normal amyloid-β positron emission tomography (Aβ-PET) scans with gradually increasing accuracy [34, 41–44]. Noteworthy, the use of Aβ-PET status to define the presence of AD pathology resulted in higher accuracy of plasma Aβ quantification than the clinical diagnosis [45]. The plasma Aβ quantified using both fully automated immunoassays and MS-based methods shows significant discriminative accuracy of the brain Aβ burden using the CSF Aβ42/40 levels or Aβ-PET as standards of truth [27]. Despite variations in detection sensitivity and reported biomarkers concentrations, these results are consistent across different analytical methods. However, MS-based methods usually outperformed immunoassays in most studies [27, 46]. In a head-to-head study including ten different assays, the LC-MS method showed the best diagnostic performance among all tested assays [27]. The plasma Aβ42/40 ratio has a stronger correlation with brain Aβ burden and better diagnostic and prediction accuracy than either Aβ42 or Aβ40 alone [27, 47–49]. In addition, using the ratio rather than each Aβ species alone seems to correct pre-analytical and analytical confounders [50].
Some of the initial analytical problems related to plasma Aβ detection, e.g., low assay sensitivity, narrower dynamic range to detect the lower concentration levels of Aβ in plasma than in CSF, and the need for sample dilution were mitigated after the development of ultrasensitive methods. Therefore, the ability to reliably detect and quantify lower levels of plasma Aβ would allow the use of plasma Aβ levels as surrogate measures of brain Aβ deposition.
In a study of three different cohorts using a Simoa assay, there were positive and significant associations between plasma and CSF levels of Aβ42, Aβ40, and the Aβ42/40 ratio. In addition, a higher Aβ burden measured by Aβ-PET was associated with a lower plasma Aβ42 and a lower plasma Aβ42/40 ratio [42]. Using two independent data sets from two different sites and IP-MS analyses, Nakamura et al. showed that plasma Aβ had high performance predicting brain Aβ burden when subjects were classified using Aβ-PET. Receiver operating characteristic analyses were performed for this study and revealed an area under the curve (AUC) of 0.94 and an accuracy of 90%. They also showed that the Aβ levels measured in the plasma, CSF, and PET imaging were highly correlated with each other [47]. Furthermore, the plasma Aβ42/40 ratio, in combination with age and apolipoprotein E (APOE) status, showed good accuracy in diagnosing brain amyloidosis with an LC-MS analysis [35].
However, there are several challenges to the widespread use of plasma Aβ as a surrogate measure of brain amyloid pathology. First, a large proportion of individuals included in different studies had biomarkers levels close to the cut-off points and within the limits of statistical error, increasing the chance of misinterpretation of results [51]. Different from the CSF Aβ concentration, the differences in plasma Aβ levels between Aβ-PET+ and Aβ-PET–groups is around 10% to 15% (versus 40% to 60% on CSF concentrations) [8, 27]. Finally, plasma Aβ concentrations may be influenced by peripheral production of Aβ by other tissues, including circulating platelets [52], and the presence of medical comorbidities, like cardiovascular and cerebrovascular risk factors that probably impact its diagnostic properties [53–55].
Diagnostic and prognostic performance
Studies using different analytical platforms have reported that plasma Aβ biomarkers accurately detect brain amyloidosis. In 2017, a study held by Ovod et al. showed that the plasma Aβ42/40 ratio, measured by an LC-MS assay, had good accuracy with an AUC of 0.88 to distinguish amyloid positivity in Aβ-PET or CSF [34]. In a more recent study, using EUROIMMUN® ELISA, the ability of the plasma Aβ42/40 ratio to differentiate subjects with Aβ pathology measured by CSF Aβ levels was lower with an AUC of 0.79, a result that was improved (AUC = 0.86) by a composite of plasma Aβ42/40 ratio, p-tau217, NfL, and GFAP [51]. In fact, using a combination of biomarkers usually improved the overall accuracy of Aβ measurements. Janelidze et al. also demonstrated that adding other variables such as the APOE status improved the diagnostic performance of the LC-MS-based assay when compared to using the Aβ42/40 ratio alone [27].
Understanding the impact of cohort differences, processing procedures in different analytical methods, and the role of other risk factors for AD have improved the diagnostic properties of plasma Aβ assays. Using the clinically available PrecivityADTM test [8, 37], an LC-MS-based method, a plasma Aβ42/40 ratio cut-off value of 0.0975 had an AUC of 0.81 and an accuracy of 75% [8]. When adjusting to cohort differences, the diagnostic performance improved the AUC to 0.86 and the accuracy to 81%. The AUC increased to 0.90 and the accuracy to 86% with additional adjustments for age and APOE status [8, 37]. The method had a robust diagnostic performance in diagnosing Aβ positivity when both CSF and neuroimaging methods were used as standards. The diagnostic accuracy of this method was not significantly affected by potential confounding variables like differences in plasma sample collection in different cohorts [8, 37]. Their findings were similar to other studies, indicating that the MS-based method accurately predicts brain Aβ positivity while maintaining reproducibility across different laboratories [27, 35]. The Quest AD-DetectTM test, a high-throughput LC-MS assay, showed similar performance characteristics to the MS-based plasma assays performed by other laboratories [8, 37].
Other recent studies have shown good accuracy using other analytical platforms. For example, Yamashita et al., using an ECL-based assay, reported an AUC of 0.94 in the test sample (AUC = 0.86 in the validation sample), with a sensitivity of 96% and a specificity of 83.5%, in a study with AD subjects screened for the elenbecestat Phase 3 program [30]. Another study showed that the plasma Aβ42/40 ratio cut-off value of 0.089 had an AUC of 0.79, a sensitivity of 85%, a specificity of 63%, a positive predictive value (PPV) of 81%, and a negative predictive value (NPV) of 70% [33]. Adding APOE status improved the AUC to 0.86 and the overall accuracy to 78%. In the same study, using data from an independent cohort, the plasma Aβ42/40 ratio optimum cut-off value was 0.092 with an AUC of 0.86, a sensitivity of 90%, a specificity of 71%, a PPV of 76%, and an NPV of 88%. The overall accuracy increased to 83% after age and APOE status were included in the statistical model [33]. Together these results reinforce the role of the plasma Aβ42/40 ratio as a robust biomarker for Aβ pathology.
Total tau and phosphorylated tau
Many individuals will present elevated brain Aβ burden without showing signs of cognitive decline [56, 57]. Biomarkers of neurodegeneration, e.g., tau protein accumulation, are more better markers of cognitive decline [58], have a strong association with AD diagnosis [59, 60], and improve the prediction of future dementia among individuals with mild cognitive impairment (MCI) [61, 62]. However, total tau is unspecific to different neuropsychiatric conditions, including traumatic brain injury, limiting their use for AD diagnosis [63].
The tau protein has multiple phosphorylation sites, and currently available assays are mainly focused on the tau protein phosphorylated at three different epitopes, namely the p-tau181, p-tau217, and p-tau231 [1]. The phosphorylated tau protein, the main component of the neurofibrillary tangles, is more specific to AD pathology [64]. As with Aβ measurements, the development of highly sensitive assays and MS-based technologies significantly improved the identification of p-tau species in the plasma. The plasma p-tau181, for example, was strongly correlated with the neuropathological changes observed in AD [6]. In addition, plasma p-tau181 was strongly associated with Aβ-PET and CSF p-tau181 measures and had a high specificity to discriminate AD from other tauopathies [65–67]. Furthermore, this biomarker has been capable of differentiating Aβ-PET+ from Aβ-PET–subjects and predicting progression to dementia [68, 69] and was also strongly correlated with brain tau burden and atrophy in AD-related brain areas [66].
More recently, studies have suggested that the plasma p-tau217 increases before other p-tau isoforms in earlier stages of the AD pathological continuum [29, 32]. Plasma p-tau217 has shown good accuracy in distinguishing Aβ-PET+ from Aβ-PET–cognitively unimpaired individuals [29, 70], showing also higher accuracy than the p-tau181 to identify individuals at risk of AD [29, 65]. The p-tau231 has also shown promising results and may be used as a biomarker of Aβ pathology at the early stages of the disease [4, 71].
In general, plasma p-tau levels (p-tau181, p-tau217, and p-tau231) were significantly higher in patients with AD than in cognitively unimpaired individuals [72–74]. Two meta-analyses found that plasma p-tau biomarkers have better results than plasma Aβ biomarkers in discriminating patients with AD from cognitively unimpaired individuals [59, 75]. Also, plasma p-tau biomarkers, especially the p-tau217, accurately predict the evolution from subjective cognitive decline (SCD) and MCI to dementia when combined with other risk factors [28, 76]. Even a minor elevation in plasma p-tau biomarkers is related to future cognitive decline, increased atrophy rates measured by magnetic resonance imaging, and hypometabolism measured by 18F-fluorodeoxyglucose PET (18F-FDG-PET) in the AD continuum [60, 61]. Interestingly, this relationship seems independent of elevated brain Aβ [60].
As the field moves forward in determining the prospective validity of these plasma p-tau assays, the Elecsys Amyloid Plasma Panel received, from the FDA, the Breakthrough Device Designation, becoming the first qualitative test combining the levels of the plasma p-tau181 and the APOE status to detect early AD available in clinical settings, similarly to the Simoa assay for p-tau181 as previously mentioned [39].
Diagnostic and prognostic performance
Using a Simoa assay, Lantero Rodriguez et al. showed that plasma p-tau181 had very high accuracy in discriminating AD from non-AD pathologies with an AUC = 0.97 prior to neuropathological assessment [77]. Likewise, Karikari et al. showed that the p-tau181 (Simoa assay) could distinguish AD from cognitively unimpaired individuals with low brain amyloidosis with an AUC higher than 0.90 [67].
The plasma p-tau217 has shown better diagnostic accuracy than p-tau181 levels in the CSF and plasma [29, 78]. A head-to-head comparison of plasma p-tau217 and p-tau181 showed that the p-tau217 had higher diagnostic accuracy than plasma p-tau181 for AD diagnosis (p-tau217: AUC = 0.91 versus p-tau181: AUC = 0.89) using ECL-based assays [44]. Brickman et al., using the MSD platform, showed that plasma p-tau217 also had a high accuracy in identifying individuals with high brain amyloid burden based on Aβ-PET scans (AUC = 0.84) [70]. Janelidze et al., using the same platform, showed that plasma p-tau217 was elevated before tau-PET became positive in cognitively unimpaired, Aβ-PET+ older adults [79]. In addition, a study using the BioFINDER cohort reported that the plasma p-tau217 could predict the progression from MCI to AD within four years with significant accuracy (AUC = 0.83) [28]. The diagnostic performance significantly increased when the plasma p-tau217 was combined with cognitive performance and APOE genotype (AUC = 0.91).
Previous studies showed a strong correlation between the earliest AD pathological changes and CSF p-tau231 levels [80, 81]. Using a Simoa-based assay, Ashton et al. showed that plasma p-tau231, similarly to CSF p-tau231, discriminated patients with and without AD pathology at post-mortem assessment with an AUC of 0.99 [4]. A cut-off value of 17.652 pg/mL for plasma p-tau231, measured using in-house Simoa assay, showed a sensitivity of 81.2%, and a specificity of 93.3%, with an AUC of 0.94 to diagnose patients with AD [82].
These recent results demonstrate the plasma p-tau assays’ ability to accurately diagnose AD (based on clinical and pathological criteria), to identify individuals at the earliest stages of the AD pathological continuum, and to identify older adults at the highest risk of cognitive decline. Nonetheless, the large variability in biomarkers’ measurement across different assays and platforms and the lack of universally accepted biomarkers cut-off levels preclude its widespread use, especially in clinical settings. This is a particularly pressing issue since the emergence of FDA-approved interventions with disease-modifying properties (e.g., aducanumab and lecanemab) [83, 84] might be more effective if individuals are identified in the earliest stages of the AD pathological continuum and at the lowest cost possible. Table 2 summarizes recent studies that reported cut-off values using different analytical platforms.
Summary of studies that reported cut-off values of different plasma biomarkers of AD
Studies were published from 2020 to 2022 and selected based on novelty and importance. Only studies that reported cut-off values were included in the table. TRIAD, Translational Biomarkers in Aging and Dementia; MCSA, Mayo Clinic Study of Aging; BioFINDER, Biomarkers For Identifying Neurodegenerative Disorders Early and Reliably; AIBL, Australian Imaging, Biomarkers and Lifestyle study of aging; ADNeT, Australian Dementia Network; PARIS discovery, discovery cohort of the Plasma Test for Amyloidosis Risk Screening study; MissionAD, dataset of 437 biobanked patient samples; ADNI, Alzheimer’s disease neuroimaging initiative; UCSF, University of California San Francisco; ARTFL, Advancing Research and Treatment for Frontotemporal Lobar Degeneration; IA, immunoassay; ELISA, enzyme-linked immunosorbent assay; MSD, meso scale discovery; Simoa, single-molecule array; LC-MS/MS, liquid chromatography-tandem mass spectrometry; CU, cognitively unimpaired; SCD, subjective cognitive decline; MCI, mild cognitive impairment; AD, Alzheimer’s disease; DAT, dementia of Alzheimer type; Aβ+, amyloid-β positive; Aβ–, amyloid-β negative; FTLD, frontotemporal lobar degeneration; FTP-PET, Flortaucipir positron emission tomography; Aβ-PET, amyloid-β positron emission tomography; tau-PET positron emission tomography; SUVr, standardized update value ratio; APOE, apolipoprotein E; FDG-PET, 18F-fluorodeoxyglucose positron emission tomography; NfL, neurofilament light; t-tau, total tau; p-tau181 and p-tau217, phosphorylated tau at residues 181 and 217; CSF, cerebrospinal fluid; SD, standard deviation; AUC, area under the curve; PPV, positive predicted value; NPV, negative predictive value; CI, confidence interval; SS, sensitivity; SP, specificity; CUY, cognitively unimpaired young.
OTHER PROMISING BIOMARKERS OF ALZHEIMER’S DISEASE
In addition to the biomarkers that reflect the core pathological changes in AD, i.e., Aβ accumulation and tau protein phosphorylation, several other biomarkers—plasma-based or not—reflecting AD risk factors (e.g., APOE genotype, platelets) or downstream pathophysiological processes (e.g., axonal degeneration, astrocytosis) have been evaluated in AD. The NfL is a component of the neural cytoskeleton released after axonal damage. For many years, NfL was used as a neuroaxonal injury marker for its higher elevated levels in neurological conditions such as traumatic brain injury, amyotrophic lateral sclerosis, atypical parkinsonian disorders, multiple sclerosis, and neurocognitive dysfunction secondary to HIV infection [85]. An important characteristic of NfL in the plasma is a strong correlation to CSF NfL levels with demonstrated ability to differentiate frontotemporal dementia (FTD) from primary psychiatric disorders and Parkinson’s disease from atypical parkinsonian disorders [85–87]. This biomarker has shown consistently increased levels in patients with MCI and patients with AD dementia compared to cognitively unimpaired individuals [88, 89], and this is particularly true in patients with Aβ pathology. However, NfL performs better when separating AD dementia from patients with FTD (clinically diagnosed, AUC of 0.82) and AD from FTD-tau and FTD-TDP cases (neuropathologically confirmed, AUCs of 0.97 and 0.96) [44].
Ultrasensitive immunological assays and IP-MS methods in AD studies have demonstrated the ability to quantify concentrations of NfL even in cognitively unimpaired individuals with no age restrictions [87]. Gerards et al. reported an AUC of 0.81, a sensitivity of 80%, and a specificity of 67% using a Simoa-based assay comparing individuals with subjective cognitive decline and AD dementia [90]. Palmqvist et al., using the same analytical platform, showed that the plasma NfL could discriminate concentrations capable of differentiating subjects with and without Aβ pathology in two cohorts [29]. In the Arizona-based neuropathology cohort (cohort-1), a cut-off of 41.9 pg/mL had a sensitivity of 82% and specificity of 32% to discriminate between AD from non-AD cases. In the BioFINDER-2 cohort (cohort-2), the best cut-off for plasma NfL was 26.5 pg/mL (AUC of 0.51, sensitivity of 67%, and specificity of 38%) [29]. The findings from this study highlight the difficulty of generating a universally accepted cut-off value for different biomarkers in AD, probably due to the heterogeneity of the AD pathological continuum and the dissociation between AD pathology and cognitive decline, especially in the earliest stages of the AD pathological continuum.
Astroglial activation and astrocytosis may represent a link between amyloid pathology and tau pathology [91]. Oeckl et al. first reported an increase in plasma GFAP levels in AD patients compared to CU individuals and these levels were significantly correlated with cognitive decline [90]. Since then, studies have revealed important results conferring GFAP an essential role in AD biomarkers studies [91–97], albeit with significant variability. Pereira et al., for example, demonstrated that GFAP showed increased levels in subjects with amyloid pathology, predicting the positivity of Aβ-PET with an AUC of 0.76, superior performance to CSF GFAP, and other glial markers [89]. Interestingly, the association of plasma GFAP levels with Aβ pathology seems to be higher than the CSF GFAP levels [91]. Furthermore, higher plasma GFAP has been associated with brain amyloid pathology (Aβ-PET+), independent of the stage of cognitive decline (cognitively unimpaired, MCI, or clinical dementia) [96]. Finally, higher plasma GFAP has been associated with faster cognitive decline [95].
The association of plasma GFAP with other AD-related biomarkers can significantly improve the diagnostic performance of individual biomarkers. For example, one study showed that plasma GFAP levels were significantly higher in subjects with amyloid pathology with an AUC of 0.78 [98]. However, in a model including plasma GFAP and plasma Aβ42/40 ratio, the AUC was significantly increased to 0.92 [98]. Moreover, a biomarker panel including plasma GFAP and NfL with other known AD risk factors, e.g., age, sex, APOE genotype, showed an AUC of 0.91 in differentiating CU from AD dementia subjects, an AUC of 0.81 in differentiating CU from MCI subjects, and an AUC of 0.87 in predicting Aβ positivity [99].
Improvements have been made in developing more sensitive and specific assays that measure β-synuclein levels in blood [100]. This synaptic biomarker has its levels increased as an early sign of synaptic degeneration in AD [101, 102]. It has also been linked to plasma levels of p-tau181 and Aβ, suggesting an association with amyloid pathology. Additionally, no altered levels of β-synuclein were found in other tauopathies, and the underlying structural brain changes associated with β-synuclein levels are different from those related to plasma NfL and p-tau181 [103–105]. Taken together, these findings put this biomarker as an important tool in the early diagnosis of AD.
The APOE polymorphism can also be considered a biological marker since the presence of the allele ɛ4 of the apolipoprotein E represents the strongest genetic risk factor for the development of sporadic AD [106]. However, the APOE status alone is not sufficient to act as a biomarker for the diagnosis of AD [107, 108]. The primary applicability of the APOE status would be in combination with one or more biomarkers, as is the case of the PrecivityADTM test, which combines the plasma Aβ42/40 ratio with the APOE status and the individual’s age to provide a score that estimates the probability of the presence of amyloid plaques [37].
Platelets have been postulated as an important peripheral source of biomarkers for the presence of neurodegeneration associated with AD [52, 110]. They carry virtually almost all circulating amyloid-β protein precursor (AβPP), and the ratio of the levels of two different forms of AβPP (130/110 kDa) has been correlated with the clinical diagnosis of AD, independently of age, and related to the degree of cognitive impairment [111–113]. In addition, platelet tau has been linked to AD-related brain atrophy and a clinical outcome measured by the Clinical Dementia Rating (CDR) scale [114]. In their pioneer work, Guzmán-Martínez et al. reported a higher ratio of heavy tau (HMWtau) and low molecular weight tau (LMWtau) in human platelets correlating with the decrease in the brain volume as measured by structural magnetic resonance imaging as being a reliable biomarker of AD, which the authors named Alz-tau® [115]. This biomarker adds to other different available approaches in the diagnostic workup of AD. However, studies that compare the accuracy of Alz-tau® with other well-established biomarkers of AD, e.g., Aβ-PET and CSF, are lacking, and there are only a few studies available in the literature focused on this biomarker. In addition, the role of tau platelet as a biomarker of AD has been questioned [116].
IMPORTANT QUESTIONS TO BE ADDRESSED BEFORE CLINICAL IMPLEMENTATION
Despite the rapid advances in the development of plasma AD biomarkers, many challenges and open questions still need to be addressed before its widespread implementation in clinical settings.
Estimated costs of different biomarkers modalities in the diagnostic workup of Alzheimer’s disease
*Great variability in costs due to availability and different costs of PET ligands. **Venipuncture is included in the cost of biomarker assessment. ***Considering the feasibility of inclusion in the primary care routine assessment of cognitive decline. acosts of equipment implementation not shown; bcost of liquid chromatography with tandem mass spectrometry (LC-MS/MS)-based assay; an approved Lumipulse assay is believed to cost under $500; cprojected costs; the PrecivityADTM test from C2N Diagnostics, for example, still costs $1,250 per analysis. PET, positron emission tomography; Aβ, amyloid-beta; CSF, cerebrospinal fluid; IP-MS, immunoprecipitation mass spectrometry [132, 138–143].
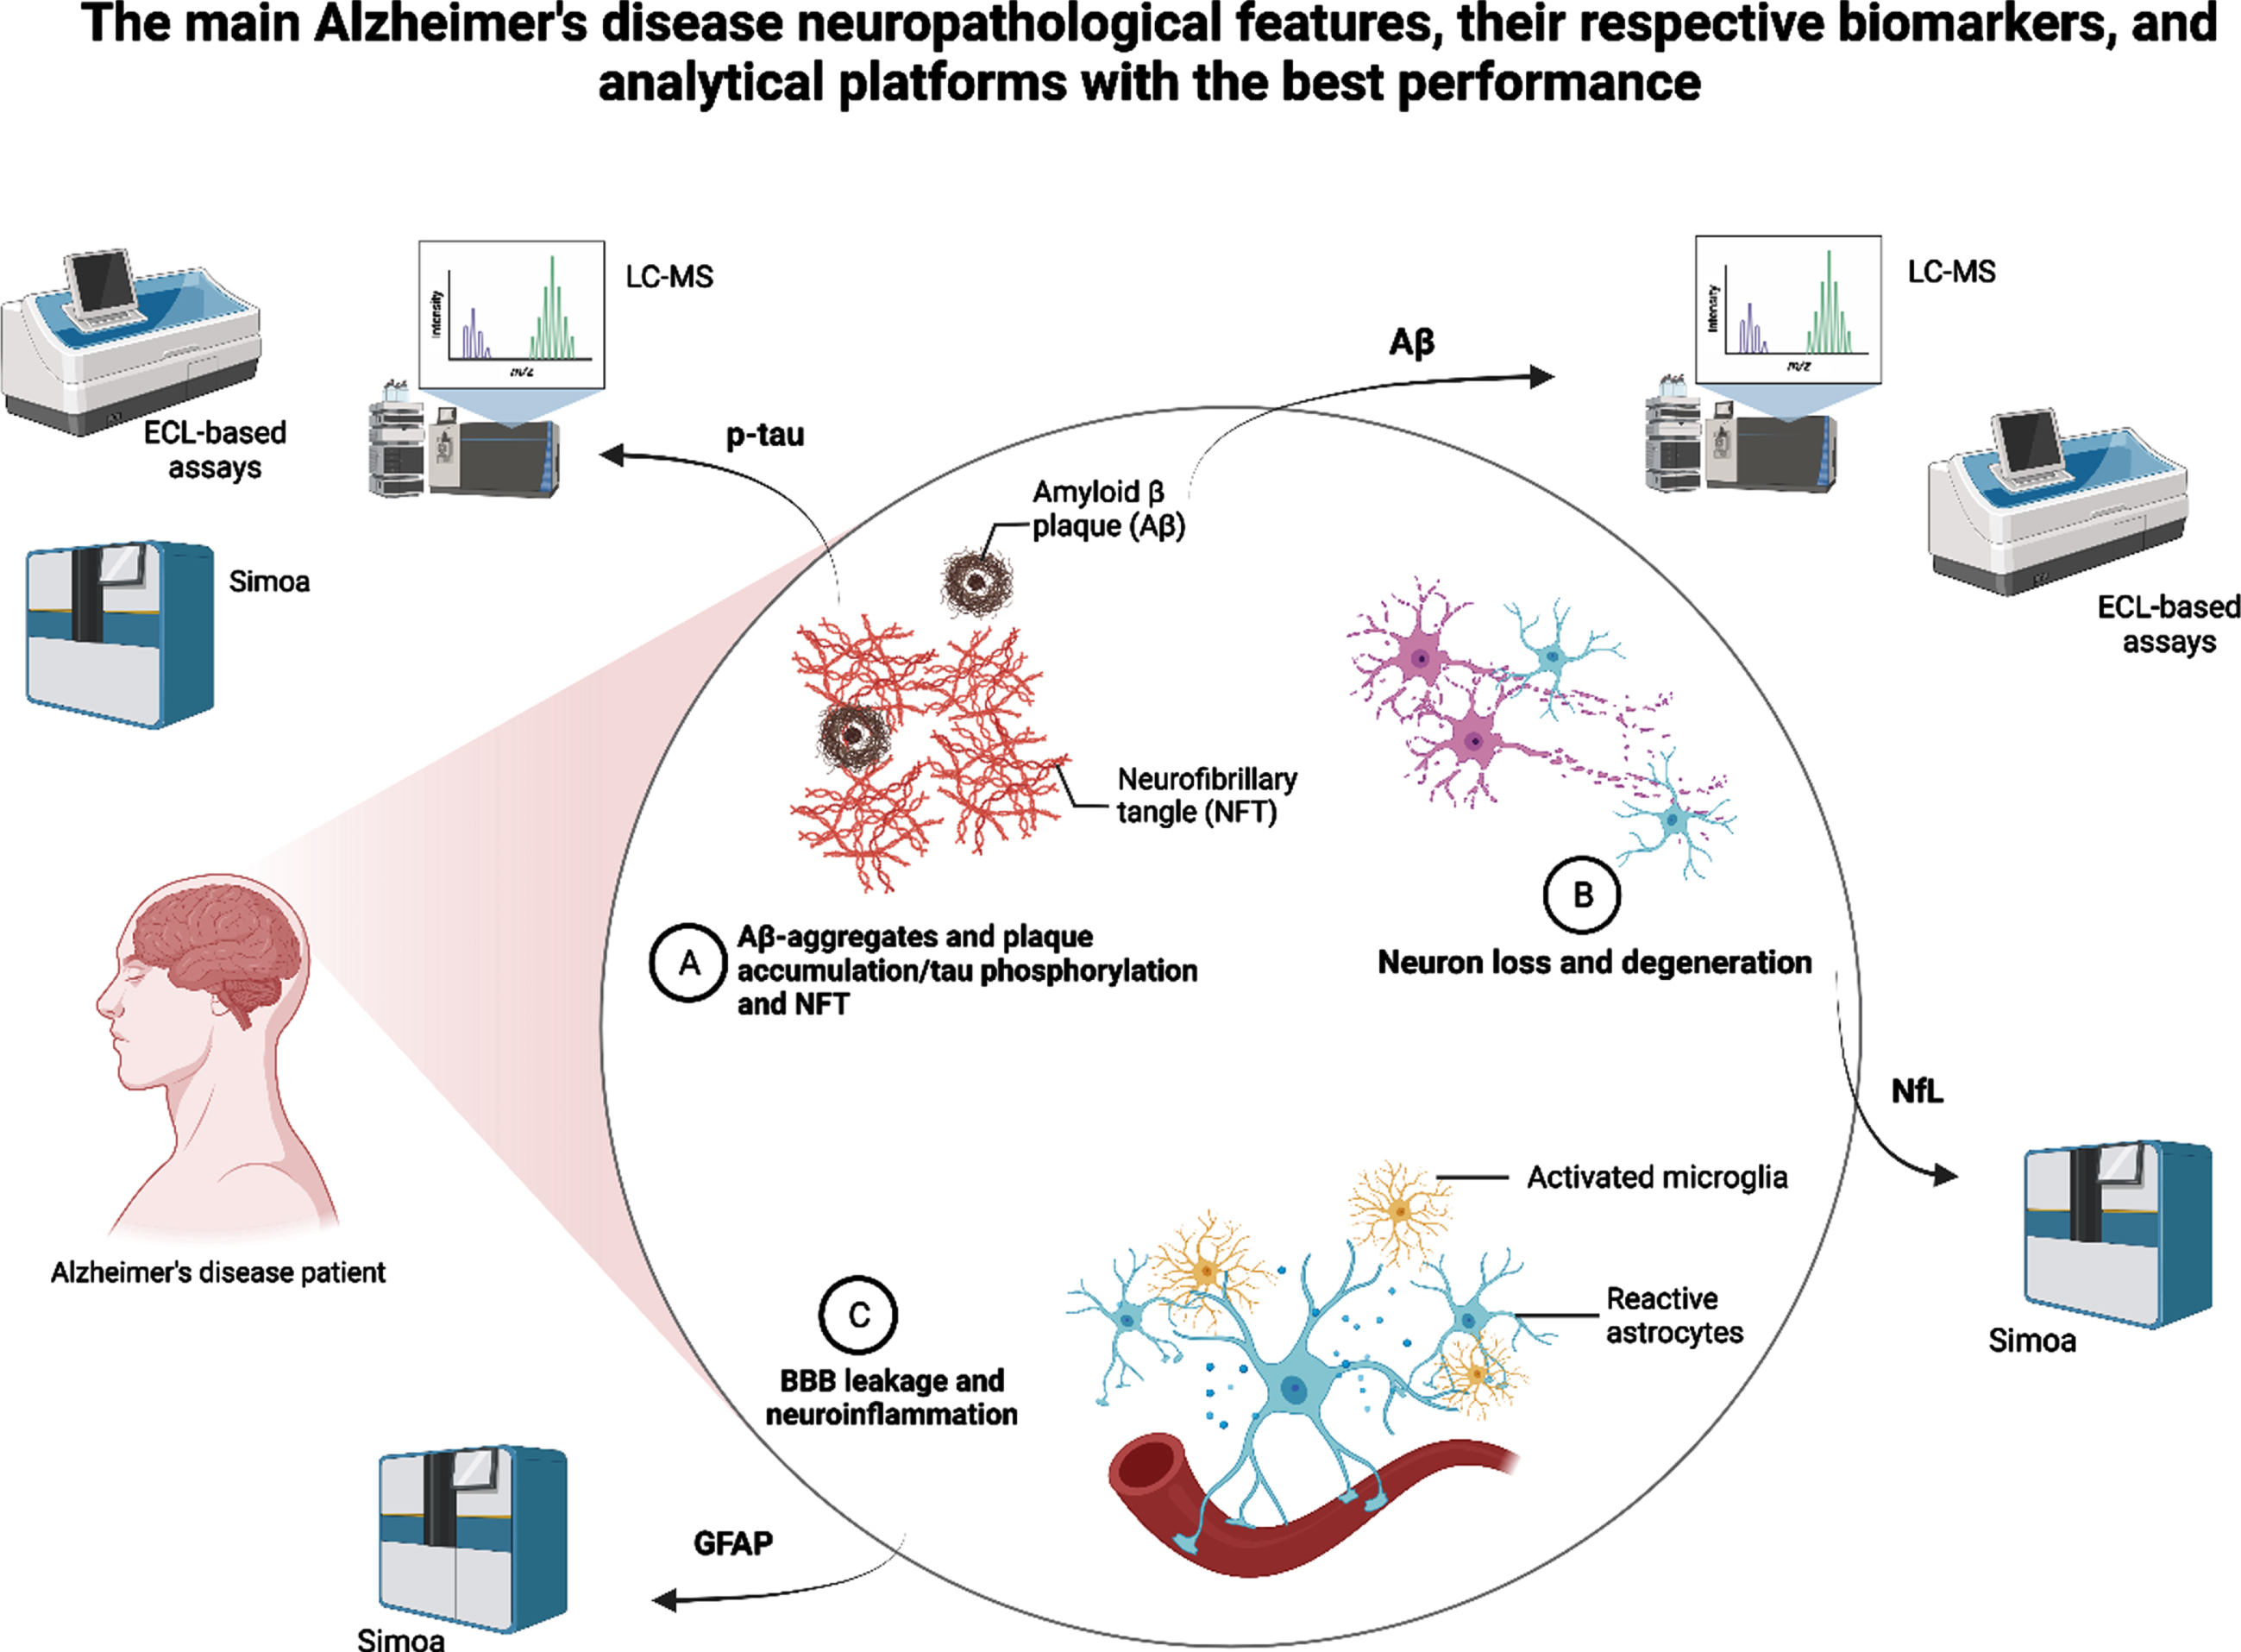
Summary of the main Alzheimer’s disease neuropathological features, their respective and most promising biomarkers, and the analytical platforms that showed the best performance in recent studies. LC-MS, liquid chromatography-mass spectrometry; ECL, electrochemiluminescence; Simoa, single-molecule array; p-tau, plasma phosphorylated tau; Aβ, amyloid-beta; GFAP, glial fibrillary acidic protein.
Which is the best analytical platform for plasma biomarkers of AD?
Since blood is a more complex biological matrix than CSF, there are many challenges in studying plasma biomarkers. Pre-analytical, analytical, and post-analytical factors can impact the accuracy of the results. These confounding factors include the handling of samples, the aging process and the presence of comorbidities, the reduced plasma concentration of brain proteins, the presence of blood proteases, and the metabolization and elimination dynamics of different proteins [2, 120]. The plasma NfL, for example, is highly affected by age and by renal function [123]. Chronic kidney disease significantly interfered with determining a reference value for plasma p-tau levels in a study using a community sample [6]. Furthermore, the intra- and inter-assay variability and differences across methods preclude the determination of a unified cut-off for most of these biomarkers. However, Cullen et al. further investigated test-retest variability of plasma biomarkers of AD, and the authors reported that this effect can be surpassed by combining different biomarkers in a panel [50].
In the face of a multiplicity of platforms and techniques available for plasma biomarker analysis, it is difficult to determine, solely based on the reported results, which is the best platform available. Two recent head-to-head studies attempted to address this issue. Janelidze et al. compared plasma Aβ42/40 ratio measurements from eight different assays [26] and of p-tau181, p-tau217, and p-tau231 measured by ten different assays [31] to detect abnormal brain Aβ deposition and future progression to AD dementia. MS-based methods performed better than immunoassays to measure plasma Aβ40 and Aβ42 across all studied cohorts and for different outcome measures [26]. Both IP-MS-based methods from Washington University, St. Louis, US [34] and Shimadzu, Kyoto, Japan [46] showed the highest accuracy [26]. One significant result was the differences in accuracy between results from the head-to-head study and the original studies (AUCs range 0.82–0.87 versus 0.88–0.97, respectively), underpinning the impact of confounding factors such as cohort characteristics, matrix interferences, and assay procedures on the analytical results [26].
Another study focusing on p-tau biomarkers showed that MS-based methods had the best analytical performance, especially for the plasma p-tau217 [31]. The findings from head-to-head studies show that the MS-based methods may show, to date, the most accurate and reliable platforms to analyze plasma biomarkers of AD. Nonetheless, these methods still need further validation studies, especially for p-tau biomarkers, and lower costs before implementation as a preferred tool for future clinical use.
How to use the reported cut-off values of the most promising biomarkers?
A recent meta-analysis showed that the diagnostic effectiveness of plasma Aβ42 was not influenced by different cut-off values, with a pooled sensitivity of 88% and a specificity of 81%. This was also true for studies that defined different cut-off values for plasma tau biomarkers [68]. Therefore, studies that define cut-off values should clearly explain their applied methods, allowing better use of the results portrayed. Furthermore, these studies should elucidate confounding factors while developing methods to predict their impact in deriving statistical models and interpreting results [124].
Although studies report similar methods and platforms, current recommendations are that cut-off values should be defined internally for different populations. Currently, most multicenter studies still use the same analytical site to perform analyses of samples from different populations [27, 46]. However, this reality could change as researchers run worldwide trials using different analytical sites when plasma biomarkers become broadly used and universally accepted cut-off values are available.
On the other hand, these findings point to possible large-scale implementation issues since the biomarkers’ cut-offs will depend on the analytical method and reference cohort and may hinder the interpretability of the biomarkers’ results in clinical settings. Therefore, current recommendations are that cut-off values should be defined internally for different populations. In this context, studies must provide clear information about the analytical methods, cohort characteristics, the present thresholds for positive and negative results, sensitivity and specificity values, and positive and negative predictive values, standard accuracy metrics for proper clinical implementation [125].
What to do with “mismatches” and “gray zones” frequently found in studies?
Clinicians are often challenged with unexpectedly dubious results, “mismatches,” and “gray zones” in biomarkers analyses. As previously reported, many biomarkers still present overlapping results between positive and negative cases mainly because the prediction of outcomes is not possible in a certain range of biomarker values [50]. In addition, studies have shown high misdiagnosis rates when judgment is based solely on clinical criteria. For example, a study showed that in a non-neglectable part of the cases, the etiologic diagnoses were changed after patients underwent neuroimaging biomarker assessments [126]. Interestingly, many clinically diagnosed AD patients will present with no evidence of AD neuropathological changes at postmortem assessments [127]. The high number of “mismatches” between biomarker levels and outcome measures, when added to other analytical factors and random errors, can be major obstacles in setting a universal cut-off value and preclude their widespread use [50, 128]. In the face of such challenges, we recommend using these biomarkers in clinical practice to be parsimonious and aligned with sound clinical judgment [50]. In addition, using biomarkers’ ratios, such as the plasma Aβ42/40 ratio, seems to improve accuracy and minimize analytical and methodological issues and should be included in the diagnostic workup [48, 129]. Finally, due to the dynamic aspect of the neuropathology of AD, combining biomarker changes with longitudinal follow-up would help improve diagnostic capabilities [27].
Which is the best plasma biomarker to reflect AD pathology?
Evidence has been mounting as plasma biomarkers present consistent results providing useful prognostic information in the AD continuum. Recent advances in the development of plasma Aβ and plasma p-tau assays may profoundly impact the field in the next few years [26, 118]. These biomarkers already outperform clinical evaluation in predicting outcomes of subjects with SCD and MCI [50]. However, studies need to answer a pressing question: which is the best plasma biomarker of AD pathology? Recent studies have been showing the best results for plasma p-tau231 and p-tau217 using Simoa, MSD, or MS-based methods. When compared to other plasma biomarkers, these plasma p-tau biomarkers have the strongest correlation with early Aβ pathology and longitudinal accumulation [2, 130]. However, confounding factors deserve further investigation since they make interpreting of results not straightforward. In addition, an ideal biomarker would be not invasive, cost-effective, and readily available for clinical use. This ideal biomarker should also be scalable and available for serial measures. Mass spectrometry-based methods are still costly and not widely available.
In another direction, combining biomarkers in a panel could represent a way to improve the screening possibilities for clinical use. A combination of biomarkers showed very high accuracy in many studies [7, 94], reaching approximately 90% when using Aβ-PET as a standard for comparison [46]. Palmqvist et al. showed that a model combining plasma Aβ42/40, plasma p-tau181, and the APOE status accurately predicted Aβ positivity and progression to AD dementia in 6 years (AUCs from 0.88 to 0.93). The techniques used were Elecsys-based fully automated assays [131]. Although a panel of biomarkers would still maintain costs very high, precluding clinical dissemination, using plasma biomarkers in different combinations could represent the best screening tool for distinguishing patients in the AD continuum. Nonetheless, further investigation would still be needed to establish a diagnosis.
FUTURE DIRECTIONS
The dynamic field of plasma biomarkers of AD has been advancing at high speed in the last few years. As a result, much research has been dedicated to improving the analytical methods and laboratory platforms. The ultimate goal is to find a clinically accessible tool to help with the timely diagnosis of AD, especially in its pre-clinical stages. However, many challenges still exist. These include the lack of universally accepted reference values for fluid biomarkers of AD, although many studies have consistently presented accurate results. In addition, the multiple analytical methods still present significant variability in their results, preventing further use and reproducibility.
To overcome these challenges, future studies should address important questions. First, studies should include head-to-head comparisons of different analytical methods. In head-to-head analyses, the performance of different assays, platforms, and protein species can be investigated together, resulting in more robust evidence. Second, studies should follow standard operating procedures to control for pre-analytical and analytical biases, investigating test re-test variability of different laboratory methods. Also, studies need long follow-up periods for better prediction of desired outcomes, e.g., progression from normal cognitive performance to dementia or from low to high brain amyloid burden. Finally, studies need to investigate sex differences and include diverse populations [132], focusing on underrepresented minority groups, such as Black and Hispanics, and socioeconomically disadvantaged groups. For example, a recent study investigated the impact of race on the predictive ability of biomarkers algorithms and found inconsistent results with the use of cut-offs across different racial groups [133].
Furthermore, the results reported by most studies underpin the idea that all analyses have improved accuracy when other biomarkers or risk factors are added to the plasma biomarker under evaluation. The combination of biomarkers in a composite panel seems to improve outcome prediction in most studies. Different from other reported panels of potential biomarkers [134], studies reporting such improvements have selected patients based on established AD biomarkers making it easier to interpret results. The high costs of the most promising methods have been addressed with investments in fully automated assays with comparable performance to most advanced techniques and are easier to implement. Thus, many groups have established highly accurate in-house reference values. Nevertheless, a consensus is still needed to achieve substantial advancements in the field. The EU/US CTAD Task Force meeting held in May 2022 [135] was a step in this direction, with discussions about the scientific progress, the current barriers and limitations, and future steps in the pathway to implementing these biomarkers in clinical practice.
Novel biomarkers are still under investigation with studies showing significant results with new PET tracers, e.g., the novel 18F MAO-B PET tracer (S)-(2-methylpyrid-5-yl)-6-[(3-18F-fluoro-2-hydroxy)propoxy] quinoline (18F-SMBT-1), binding significantly higher in the brain of Aβ+ compared with Aβ–healthy controls [136], and the combination of different genetic loci such as the coat protein complex I G2 (COPG2) and the WW domain-containing oxidoreductase (WWOX) genes with known biomarkers to develop better predictive models to diagnose AD [137].
CONCLUSION
The first identification of plasma biomarkers of AD was a breakthrough in the field. Incorporating new ultra-highly sensitive techniques played an important role in advancing studies with plasma AD biomarkers. Many studies have also provided an overview of the recommendations and most promising biomarkers available and are shedding new light on technical aspects that need clarification before widespread implementation. Furthermore, although the costs of such assays are still high, the recent advances allowed for the development of a blood test now available for clinical use based on plasma Aβ. Other biomarkers must soon follow. Recently, research has been focusing on real-world scenarios and aspects that may affect the interpretation of the results of plasma biomarkers studies in different populations. These steps anticipate the widespread use of plasma biomarkers of AD.
Footnotes
ACKNOWLEDGMENTS
The authors have no acknowledgments to report.
FUNDING
The Laboratory of Neuroscience (LIM-27) receives financial support from Fundação de Amparo à Pesquisa do Estado de São Paulo (FAPESP, Project 14/50873-3) and Associação Beneficente Alzira Denise Hertzog da Silva (ABADHS). Dr. Diniz is supported by the NIH (National Institute of Health; grants R01MH115953 and R01MH118311).
CONFLICT OF INTEREST
The authors have no conflict of interest to report.