
Abstract
Background:
While Alzheimer’s disease (AD) pathology is associated with altered brain structure, it is not clear whether gene expression changes mirror the onset and evolution of pathology in distinct brain regions. Deciphering the mechanisms which cause the differential manifestation of the disease across different regions has the potential to help early diagnosis.
Objective:
We aimed to identify common and unique endotypes and their regulation in tangle-free neurons in sporadic AD (SAD) across six brain regions: entorhinal cortex (EC), hippocampus (HC), medial temporal gyrus (MTG), posterior cingulate (PC), superior frontal gyrus (SFG), and visual cortex (VCX).
Methods:
To decipher the states of tangle-free neurons across different brain regions in human subjects afflicted with AD, we performed analysis of the neural transcriptome. We explored changes in differential gene expression, functional and transcription factor target enrichment, and co-expression gene module detection analysis to discern disease-state transcriptomic variances and characterize endotypes. Additionally, we compared our results to tangled AD neuron microarray-based study and the Allen Brain Atlas.
Results:
We identified impaired neuron function in EC, MTG, PC, and VCX resulting from REST activation and reversal of mature neurons to a precursor-like state in EC, MTG, and SFG linked to SOX2 activation. Additionally, decreased neuron function and increased dedifferentiation were linked to the activation of SUZ12. Energetic deficit connected to NRF1 inactivation was found in HC, PC, and VCX.
Conclusions:
Our findings suggest that SAD manifestation varies in scale and severity in different brain regions. We identify endotypes, such as energetic shortfalls, impaired neuronal function, and dedifferentiation.
Keywords
INTRODUCTION
Alzheimer’s disease (AD) is a slowly progressive neurodegenerative disorder characterized by significant memory loss and cognitive decline, ultimately leading to death [1]. While the study of autosomal-dominant mutations in PSEN1, PSEN2, and APP, which cause familial Alzheimer’s disease (FAD), has enhanced our understanding of AD pathogenesis, most cases (∼95%) are due to non-autosomal, sporadic Alzheimer’s disease (SAD) where the exact etiology is not known [2, 3]. Though the histopathological hallmarks of AD, such as neuronal and synaptic loss, diffuse brain atrophy, amyloid plaques, and neurofibrillary a tangles, are common to FAD and SAD, their clinical manifestations are highly heterogeneous [4, 5]. In addition to an earlier age at onset, FAD patients exhibit greater psychiatric changes, seizures, bradykinesia, aphasia, and myoclonus than those suffering from SAD [6]. Clinical markers are also distinct, such as preferential amyloid deposition occurring in the cortex in SAD, in contrast with FAD, as well as increased striatal tau accumulation in FAD. Key reasons for the failure of AD drug trials are the selection of patients and the timing of intervention: while most AD knowledge has been derived from studying FAD, clinical drug trials have primarily been conducted on SAD patients already exhibiting AD symptoms, potentially past the point in disease progression of symptom reversal [7, 8]. Furthermore, by analyzing this cohort containing brain regions with temporally distinct manifestations of disease pathology (e.g., the entorhinal cortex (EC) is affected by AD early, while the visual cortex (VCX) is affected late), we can potentially use the brain regions as a proxy for the temporal progression of AD when identifying and characterizing endotypes. Therefore, it is essential to stratify the SAD-specific disease manifestations into subtypes and characterize them in terms of endotypes, i.e., pathological mechanisms underlying the disease subtype [9]. Such an approach would help us capture variations in disease pathology and provide insights into disease progression. Further, it would help stratify AD according to the severity as well as identify biomarkers and drug targets. Recently, we identified repressor element 1 silencing transcription factor (REST)-mediated neuron dedifferentiation and NRF1-linked mitochondrial dysfunction as key disease endotypes in FAD patient induced pluripotent stem cell (iPSC)-derived neurons and postmortem brains [10]. Others have identified inflammation, energy deficits, decreased oxidative phosphorylation, and impaired DNA damage repair as molecular mechanisms of AD [11–14].
Endotypes could pinpoint common and distinct disease mechanisms in specific brain regions and enhance our understanding of AD manifestation in the human brain. Our work used differential gene expression (DGE), gene set enrichment (GSE), transcription factors (TF) activity, and co-expression gene module detection to gain functional and mechanistic insights into distinct and shared endotypes across different brain regions through secondary analysis of the public mRNA microarray dataset (GSE5281). We selected this dataset due to its utilization of laser-microdissected, tangle-free neurons from six brain regions—the entorhinal cortex (EC), hippocampus (HC), medial temporal gyrus (MTG), posterior cingulate (PC), superior frontal gyrus (SFG), and visual cortex (VCX)—in SAD patients along with age-matched healthy controls [15, 16]. The tangle-free neurons in an otherwise diseased brain provide a unique opportunity to understand the compensatory mechanisms in these neurons as well as pathogenic mechanisms that precede the hallmark lesions. Therefore, this dataset and our analysis provide a view into the SAD neuronal transcriptome preceding tangle formation, allowing a unique insight into potential mechanisms.
Liang et al. reported a widespread dysregulation of metabolism and cellular transport/organization, as well as that of unique processes such as biopolymer modification and neurotransmitter secretion in the SFG and energetic abnormalities in the PC in their original analysis [16, 17]. Here, we demonstrate that neuron function suppression (in the EC, MTG, PC, and VCX), dedifferentiation of a mature neuron to a neuronal precursor state (in the EC, MTG, and SFG), and decreased energy production (in the HC, PC, and VCX) are the key endotypes in SAD. Further, we believe that activation of a known repressor of neuron-specific genes, REST [18, 19] and transcription factor SOX2, combined with inhibition of NRF1 activity, possibly via transcriptional and post-transcriptional mechanisms, regulate neuron function suppression, dedifferentiation, and altered energetics endotypes in SAD. We validate and extend these findings in two key ways: by interrogation of tangle-free and tangled SAD samples for the EC gathered by Dunckley et al. (GSE4757) using microarray data to assess the changes in endotypes with tangle presence, potentially correlating with temporal disease progression; and by evaluating the mRNA expression of key TFs in curated bulk HC RNA-seq data from the Allen Brain Atlas Aging, Dementia, TBI study (ADT) [20]. Our analysis of the former revealed that in the EC, tangled neurons have a further negative enrichment for REST targets and neuron function relative to tangle-free neurons, suggesting that tangles may compound existing disease-associated change in SAD, while analysis of the latter identified REST and SOX2 to be upregulated in the HC from Allen Brain Atlas’ ADT bulk RNA-seq dataset.
METHODS AND MATERIALS
Data acquisition
Publicly available gene expression data, downloaded from NCBI GEO (GSE5281), were derived from healthy age-matched, non-demented control (NDC) and SAD postmortem human brain samples [15, 16]. Fourteen NDC samples were collected from subjects with Braak scores I-II, while 34 SAD samples were collected from patients with Braak scores III-VI. Control samples came from 10 males and 4 females while SAD samples from 15 males and 18 females. Roughly 500 histopathologically normal neurons were collected by laser capture microdissection from each of the six brain regions for each individual. The isolated neurons were assessed for purity using GFAP expression and screened for tau tangles using thioflavin-S fluorescence. The neurons came from six brain regions: the EC, HC, MTG, PC, SFG, and VCX, which were specifically chosen by Liang et. al. due to their intimate association with AD pathology and progression. The EC and HC were chosen due to their affiliation with memory and learning and preferential tangle development in AD [15]. The EC, which acts as an interface between the HC and the cerebral cortex and gives major input to the HC, is one of the first brain regions to develop AD pathology [15, 21]. Additionally, the MTG and SFG were selected because of their vulnerability to neuritic plaque pathology, while the PC was chosen due to it being an early epicenter of metabolic aberrancies in SAD. Finally, the VCX was chosen since its abnormalities in SAD were known to be relatively mild and would serve as a contrast to brain regions with greater affected SAD pathology.
In the Liang et al. study, large layer II stellate cells from EC and pyramidal neurons from the CA1 regions in HC were collected. EC layer II and CA1 pyramidal populations are among the earliest and most impacted by tangle formation. Layer III pyramidal neurons were collected from the MTG, PC, SFG, and VCX regions which are also preferentially affected by tangle formation. Therefore, these specific neuron types were selected for RNA collection. Total RNA was isolated from cell lysate and profiled using the Affymetrix Human Genome U133 Plus 2.0 microarray (for more details, refer to [15, 16]).
Additionally, we used GSE4757, an additional laser-capture microarray dataset containing post-mortem, tangled and tangle-free EC neurons from AD patients, to assess potential pathological changes resulting from tangle presence [20]. A total of twenty paired samples (10 tangle-free and 10 tangled), both from the EC of SAD patients, were collected in the above study. These neuron samples also came from layer II and were selected for tangle presence using the thioflavin-S staining.
Preprocessing and differential gene expression
For each sample, raw data was preprocessed using rma (Robust Multichip Averaging Algorithm) from the oligo R package [22]. Then, lmfit from limma was used for DGE calculation, fitting linear models based on least squares regression for each probe in each condition [23]. Six contrasts were then made with twelve conditions in a design matrix (NDC and AD for each of the six brain regions) for GSE5281. One contrast was made for tangled versus tangle-free AD neurons for GSE4757 which accounted for paired samples. Next, the eBayes function in limma was used to reduce false positive detection and calculate the moderated t-statistic and the adjusted p-value across all genes. Six comparisons were performed and recorded using the topTable function. Differentially expressed genes (DEGs) were defined as those with a false discovery rate adjusted p-value less than 0.05. Expression data were visualized in R using ggplot2 and nVennR packages in R [24–26].
Functional enrichment and transcription factor analysis
Functional enrichment was performed using the fgsea multilevel test from the fgsea package on the moderated t-statistic ranked gene list for each brain region [27]. MSigDB’s Hallmark and GOBP collections were used for this enrichment. EnrichR’s ENCODE ChEA Consensus (ECC) database was used with the fgsea multilevel test for TF enrichment. Further TF activity and motif analysis were performed with ISMARA and the Swiss regulon database to predict transcriptional regulation [28–31].
Co-expression gene module detection
CEMiTool was used to identify gene co-expression modules [32]. The parameters used include: merge_similar = FALSE, p-value < 0.05, network_type = ‘signed’, and force_beta = TRUE. Overrepresentation analysis (ORA) of CEMiTool modules was performed using the hypergeometric test in the tmod R package with Hallmark and GOBP collections for functional enrichment and with the ECC for TF enrichment [33].
Allen Brain Atlas: Aging, Dementia TBI study
Allen Brain Atlas’ Aging, Dementia, TBI study (ADT) bulk RNA-seq dataset was used to compare the activity of key regulators identified in our analysis [34]. Non-demented samples with Braak scores 0-II were compared with probable and possible AD samples with Braak scores III-VI. “Probable” and “possible” AD is the language used by the Allen Brain Atlas (ABA) to designate the likelihood of AD diagnosis. Probable AD is more certain than possible AD. We included possible AD alongside probable AD to investigate whether the severity of dysregulation in certain gene classes (e.g., targets of a TF) increased with disease progression. We focused on the HC as that was the only brain region similar between ADT and GSE5281. Samples with a history of previous traumatic brain injury (TBI) were excluded from the analysis due to a potential confounding effect as the TBI status of patients from Liang et al. is unknown.
RESULTS
Greater transcriptional changes in temporal and inferior parietal lobes
To identify potential endotypes in SAD, we first characterized transcriptomic data from human postmortem, tangle-free neurons from the EC, HC, MTG, PC, SFG, and VCX brain regions (Fig. 1A). DGE analysis was performed for each brain region comparing AD with NDC using the limma R package [23]. The MTG, PC, and EC showed the greatest number of differentially expressed genes (DEGs) (Fig. 1B), suggesting that SAD-related transcriptional changes are prominent in temporal and inferior parietal lobes. In addition, they also showed the greatest number of unique DEGs (>900) (Fig. 1C). The complete list of DEGs found in study can be found in Supplementary File 1.
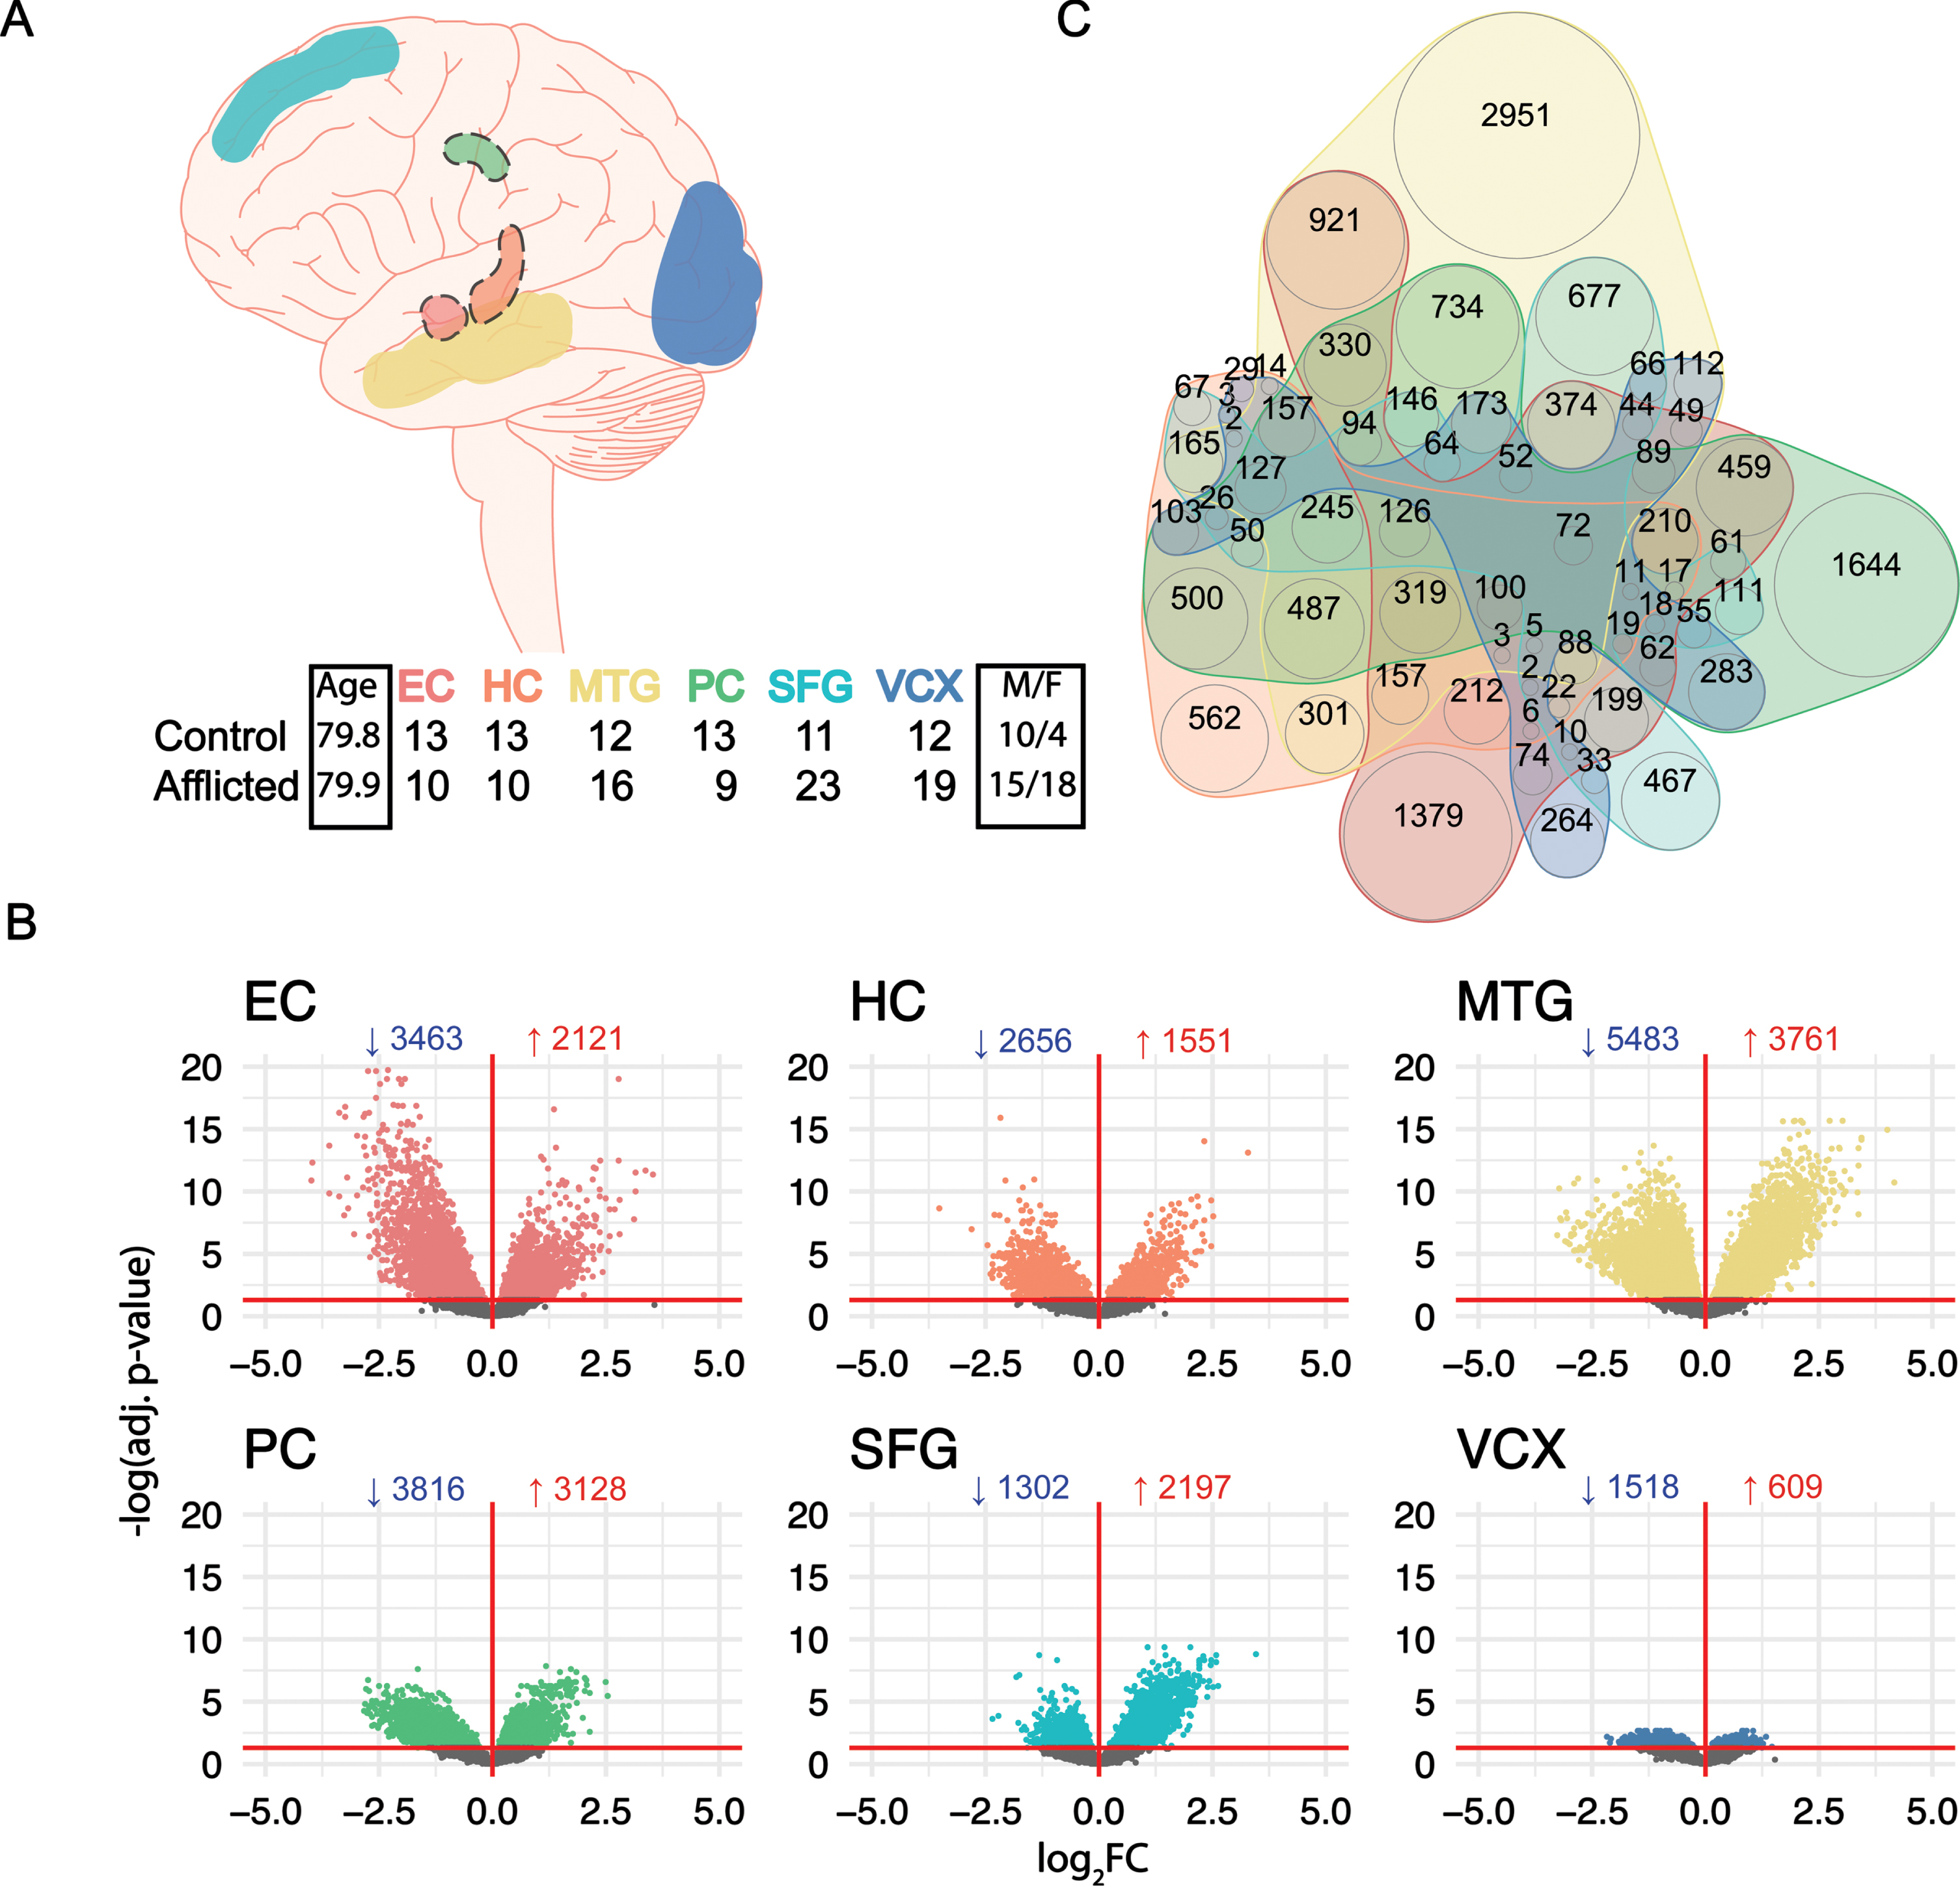
Differential Gene Expression in SAD laser-dissected neurons. (A) Top: neuron samples from NDC (Braak I-II) and SAD patients (Braak III-VI) were collected from the entorhinal cortex (EC), hippocampus (HC), medial temporal gyrus (MTG), posterior cingulate (PC), superior frontal gyrus (SFG), and visual cortex (VCX) by Liang et al.; a dashed line around the brain region indicates interior anatomical location. Bottom: table of the number of control and afflicted samples alongside age and gender breakdown. (B) Volcano plots of differential gene expression across all 6 brain regions; the directional profile of DEGs is indicated in each sub-panel; the numbers indicate downregulated (blue) and upregulated (red) DEGs, respectively; the horizontal red line indicates an adjusted p-value < 0.05 cutoff for significance. (C) Quasi-proportional Venn diagram of shared and unique DEGs between each brain region.
Energetics, dedifferentiation, inflammation, and DNA repair involved in SAD
Functional enrichment using fgsea with the Hallmark and GO Biological Processes (GOBP) gene set libraries revealed anomalies in key cellular functions, with the highest enrichment observed for pathways related to energetics and dedifferentiation (Fig. 2A, B) [27–29]. Energetic processes, including oxidative phosphorylation (Hallmark and GOBP) and mitochondrial organization (GOBP), were significantly negatively enriched in the PC, HC, and VCX regions. In contrast, gene sets related to dedifferentiation and non-ectodermal identification, such as epithelial to mesenchymal transition (EMT) (Hallmark), circulatory system development (GOBP), and tube morphogenesis (GOBP), were significantly positively enriched in the SFG. In the context of energy deficits and increased dedifferentiation, it was no surprise that a reduction in neuron function through synaptic signaling (GOBP) was found in the EC, MTG, PC, and VCX. In addition, an increase in potentially genotoxic processes such as inflammatory response (Hallmark), interferon-γ response (Hallmark), and hypoxia (Hallmark) were observed in the EC, MTG, and SFG; and a decrease in ameliorative mechanisms such as DNA repair (Hallmark and GOBP) was present in the HC, PC and VCX.
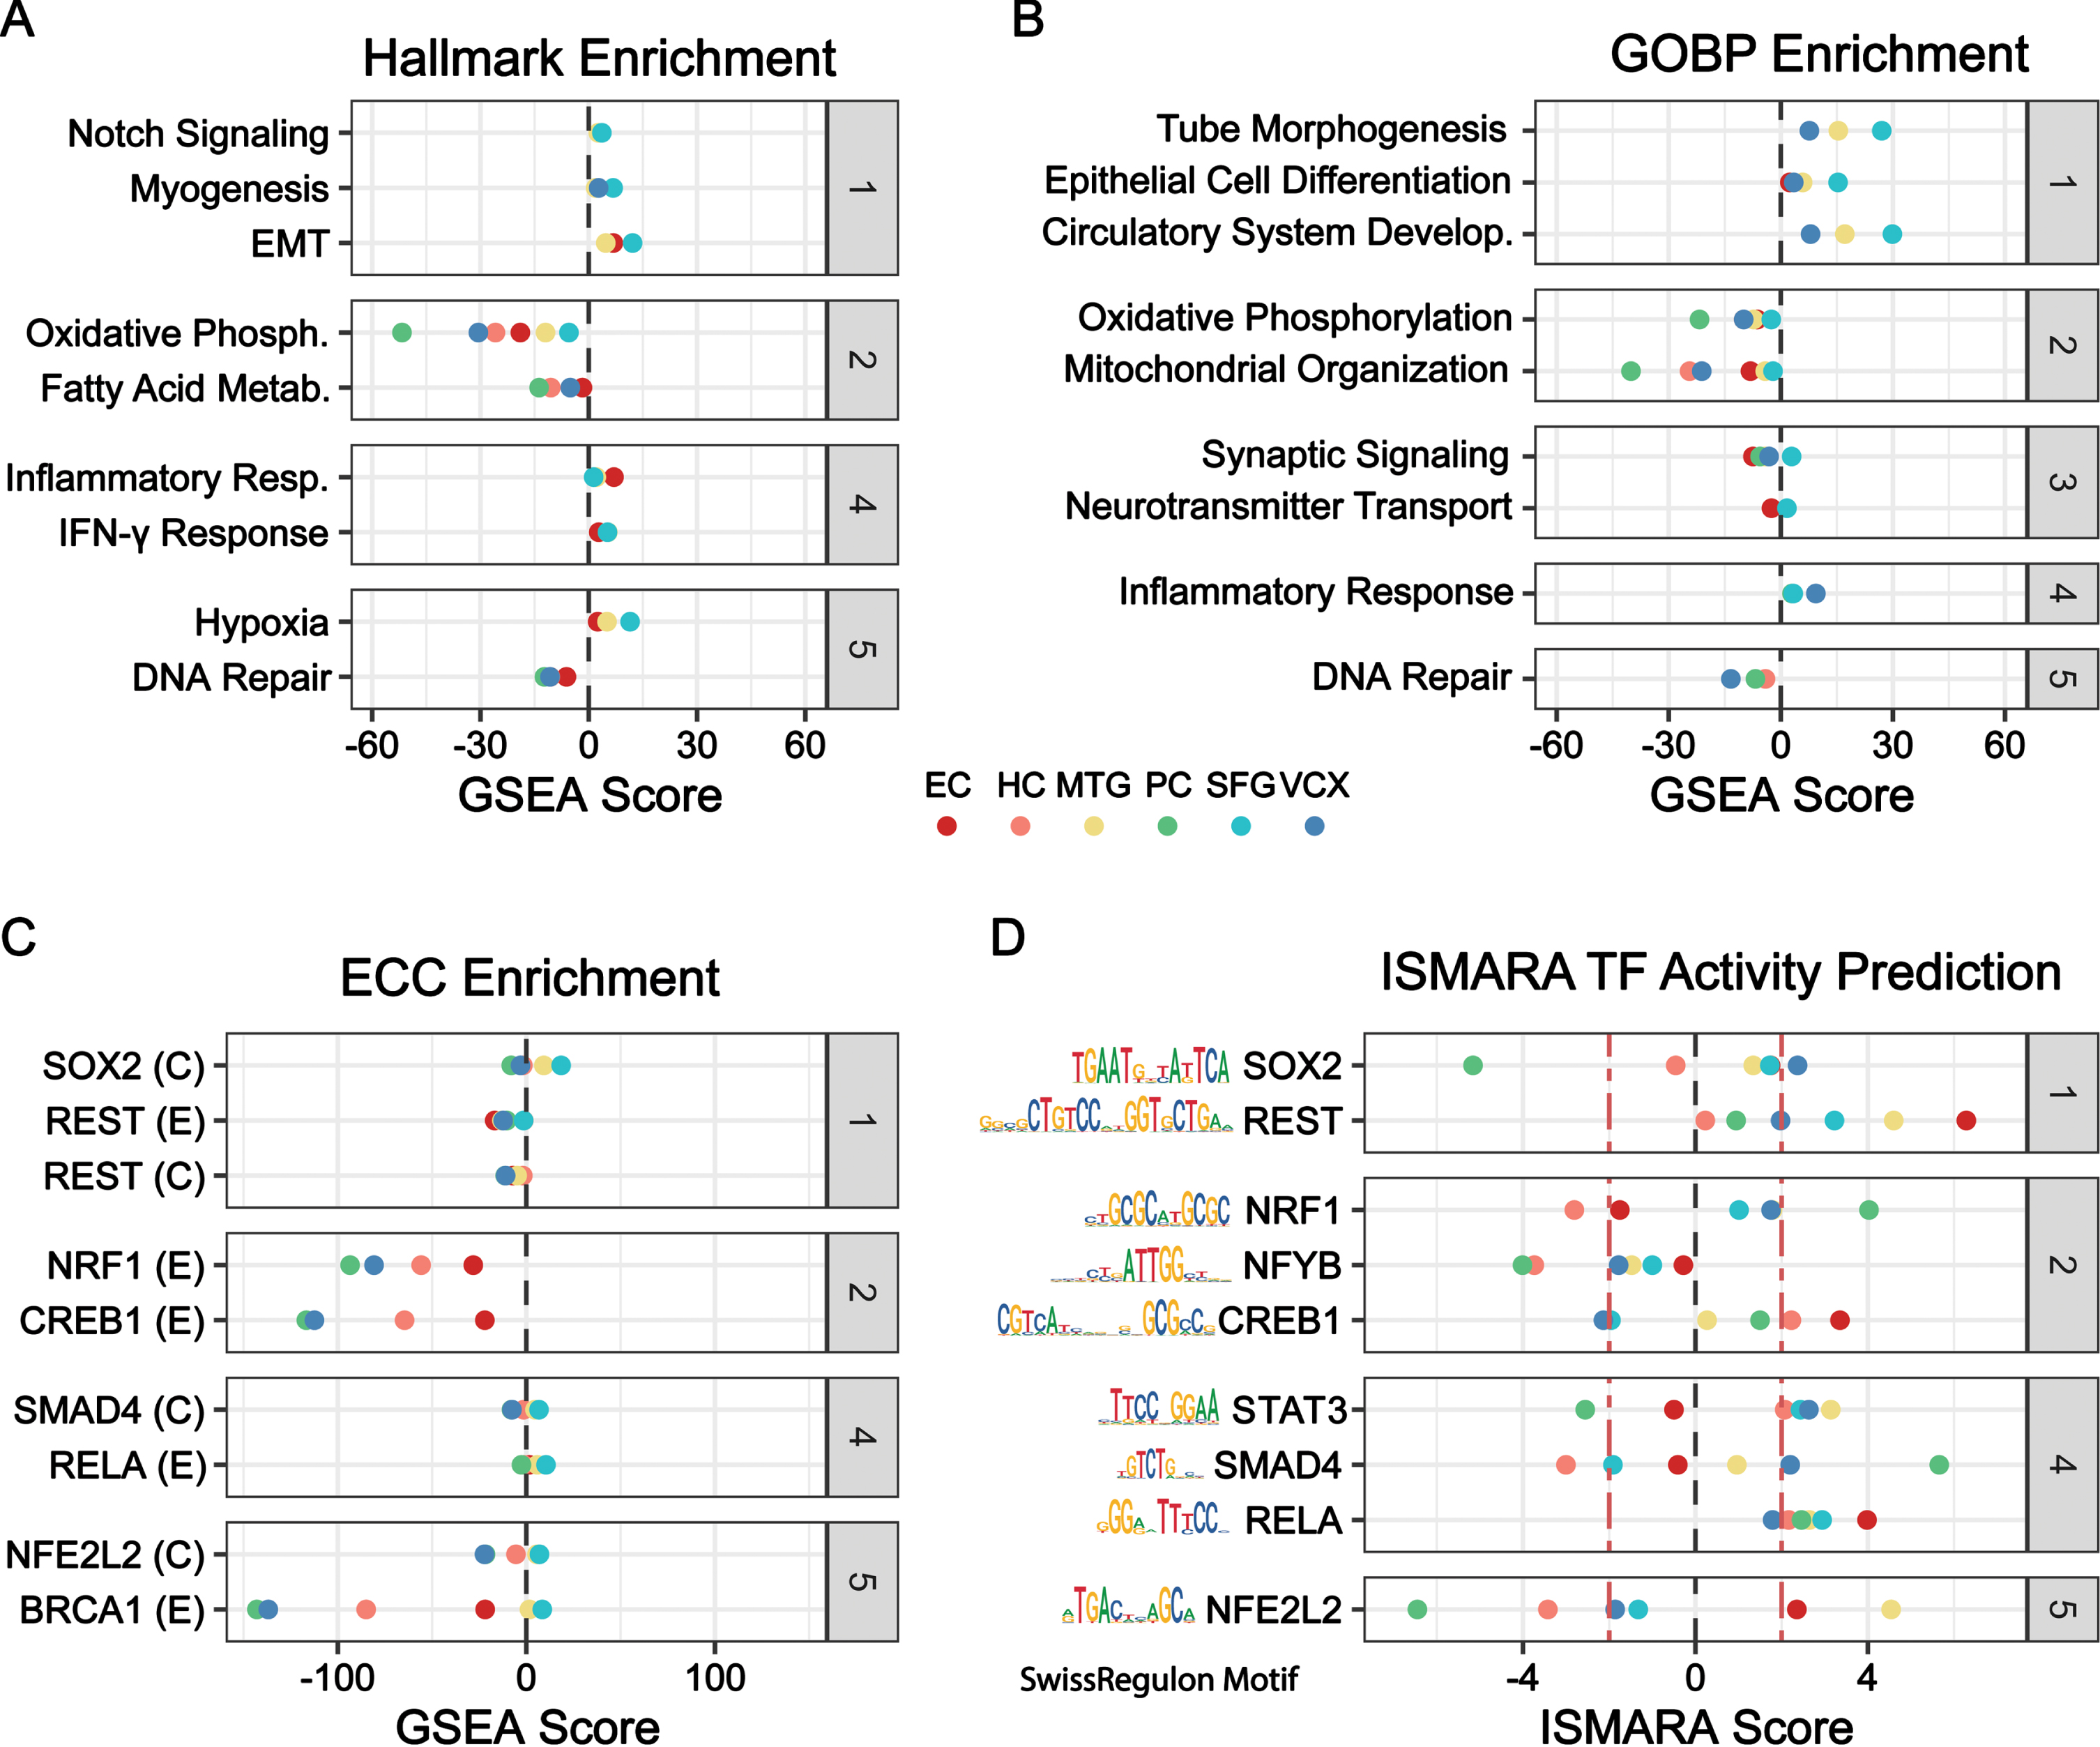
Functional enrichment, TF-target enrichment, and motif-based TF-activity prediction. Categories (gray): (1) Dedifferentiation, (2) Energetics, (3) Neuron Function, (4) Inflammation, (5) Stress Response. A-C) Geneset enrichment analysis by fgsea in all six brain regions using (A) Hallmark, (B) GOBP, and (C) ENCODE-ChEA Consensus (ECC) TF-gene target collection. GSEA score is the -log10 of the adjusted p-value multiplied by the sign of the NES (net enrichment score). D) ISMARA TF activity prediction using the Swiss regulon motif database across all six brain regions. ISMARA score is a function of the z-score, the direction of mean TF target expression change, and the direction of Pearson correlation between TF gene expression and target gene expression. The red line delineates the ISMARA score of ±2, outside of which terms are considered significant.
TF enrichment and TFs underlying the gene expression were identified with fgsea using the Encode ChEA Consensus (ECC) TF-target geneset library [30] and with ISMARA TF activity prediction [31], respectively [30, 31]. Targets of energetics, such as those of TFs NRF1 and CREB1 were downregulated in most brain regions, suggesting widespread energy deficits (Fig. 2C) [35–37]. We also uncovered a negative target enrichment and a positive TF activity for neural repressor REST, indicating inhibition of genes that determine neuron identity and function in EC, MTG, and SFG (Fig. 2C-D, Supplementary Figure 1A) [38]. A further departure from neuron identity was observed through target upregulation of pluripotency-inducing factor SOX2 in MTG and SFG [39]. RELA, a subunit of canonical inflammatory TF NFκB, was activated in most brain regions [40]. In addition, target downregulation for DNA repair factor BRCA1 was found in several brain regions, consistent with BRCA1 depletion findings in postmortem AD neurons of other human cohorts [41].
Energetics, dedifferentiation, and impaired neuron function gene modules identified
Next, we employed CEMiTool to uncover co-expressed gene modules that may encapsulate endotypes and determine the brain regions in which the modules were most active [32]. Five modules (M1 to M5) were identified, and modules with more than 100 genes (M1 to M4) were subjected to further analysis (Fig. 3A). Functional enrichment of each module was carried out using fgsea, and M1 was most significantly enriched in the EC, MTG, PC, and VCX; M2 in the PC and VCX; M3 in the EC, MTG, and SFG; and M4 in the HC, PC, and VCX (Fig. 3B). Further, enrichment analysis of the genes in each module using the tmod hypergeometric test unveiled functional and transcriptional insights: M1 is strongly enriched for neuron function terms such as synaptic signaling (GOBP), M2 is marginally enriched for neuron development (GOBP), M3 is enriched for non-ectoderm lineage terms and M4 is enriched for energetics, namely, oxidative phosphorylation (GOBP) (Fig. 3C) [33].
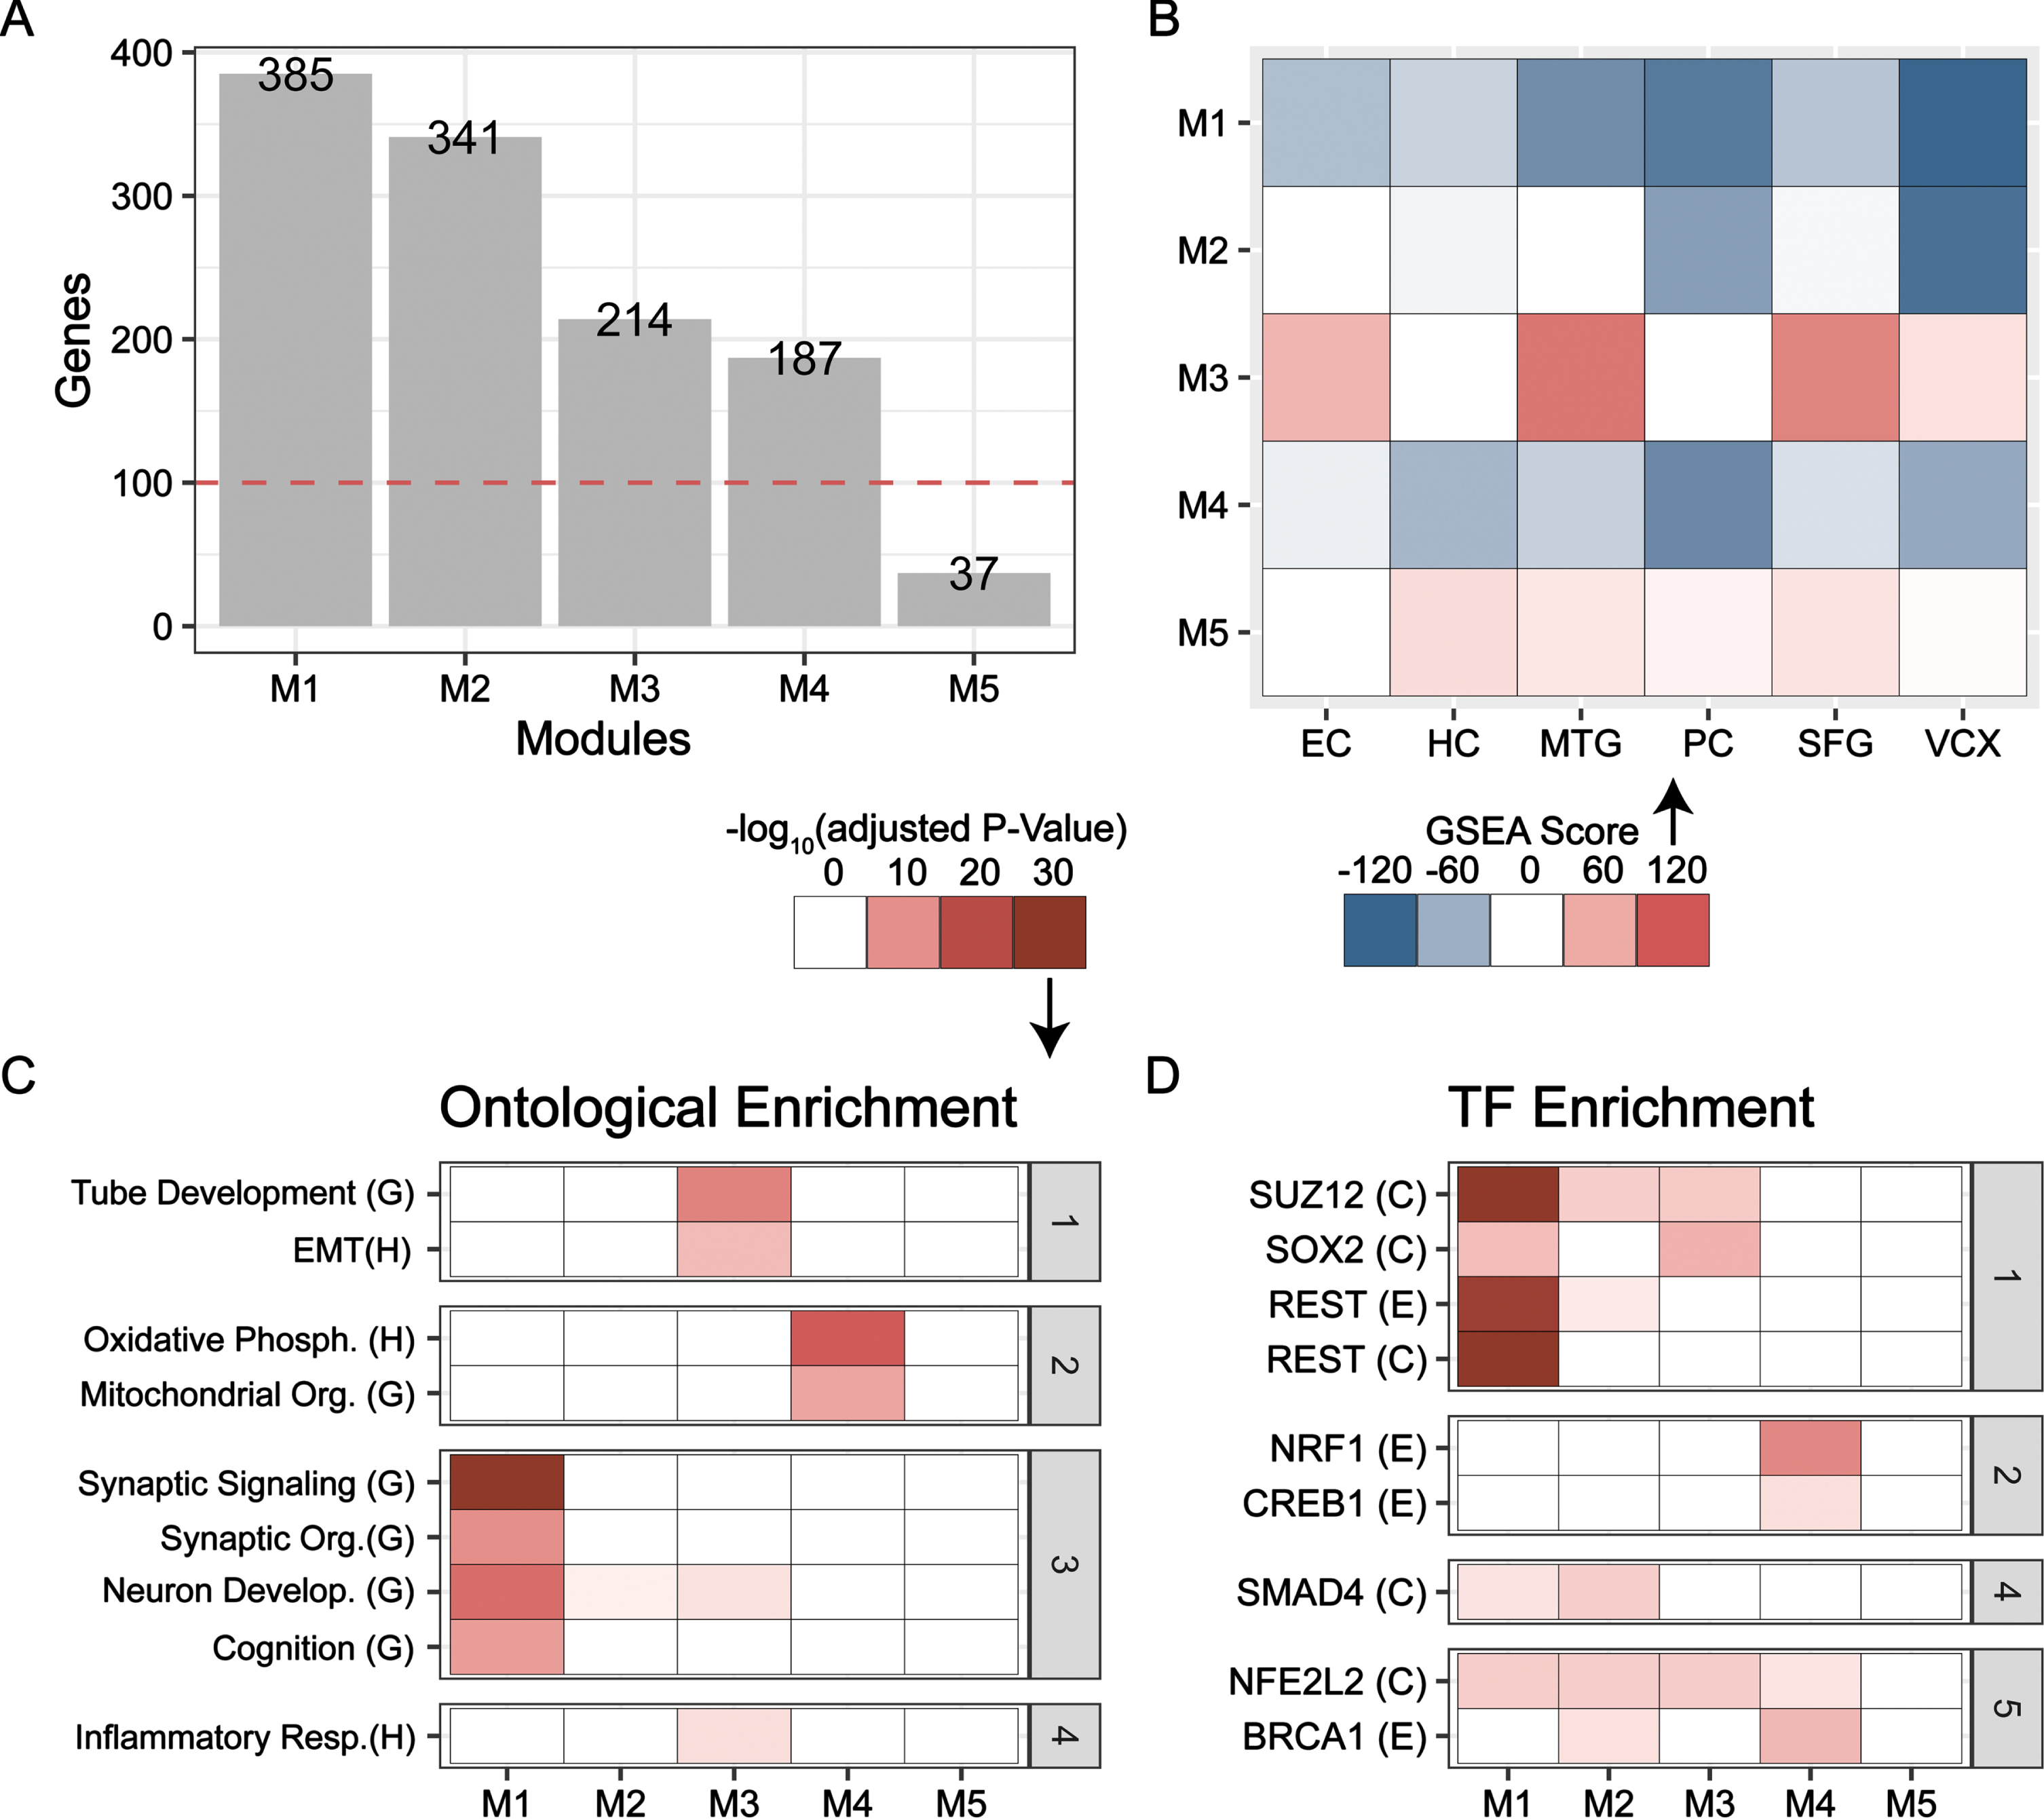
CEMiTool Co-expressed gene module identification. Categories (gray): (1) Dedifferentiation, (2) Energetics, (3) Neuron Function, (4) Inflammation, (5) Stress Response. A) Number of genes in co-expressed modules across all six brain regions. Modules with over 100 genes were selected for further functional and TF Target enrichment. B) Enrichment of each module across all brain regions using the fgsea multilevel test on limma t-value ranked gene lists. Enrichment utilized modules as the collection. C, D) The tmod hypergeometric enrichment for each module. C) Functional enrichment with Hallmark (H) or GOBP (G). D) TF-target enrichment with ENCODE (E) or ChEA (C) libraries.
TF-target enrichment largely concurs with functional findings for each module. Here, M1 was enriched for targets of neural repressor REST (Fig. 3D). M2 was weakly enriched for targets of antioxidant factor NFE2L2, REST, and inflammatory factor SMAD4 [42, 43]. SOX2 targets were enriched in M3 while NRF1 and CREB1 targets were enriched in M4. Further, targets of chromatin modifier SUZ12, a component of polycomb repressive complex 2 (PRC2), were strongly enriched in M1 and to a lesser degree, in M2 and M3 [44]. Together, the functional and TF-target enrichments link M1-M4 to disease endotypes. M1 and M2 represent neuron function, but the former has a stronger link; M3 is strongly associated with dedifferentiation, and M4 is representative of energetics.
Further, we assessed module affiliation with biological programs by inspecting the top hub genes for each module. Not surprisingly, M1, M3, and M4 were found to be associated with neuron function (NSF, NELL2, SNAP91), dedifferentiation or neuronal precursor-like cell state (NOTCH2, ZIC2), and energetics (TOMM20, ATP5MC3, ATP5F1A) (Supplementary Figure 2A, C, D) [45–51]. For the M2 module, the top hub genes were related to neuron function, with the identification of synaptic genes CHL1, NPTN, and neuronal transport gene WDR47 (Supplementary Figure 2B) [52–54].
Identifying potential regulators of endotypes
To identify potential regulators for each module, we considered the differential expression of module-specific targets of key TFs in regions where the module was most significantly enriched. We considered REST for M1, SOX2 for M3, and NRF1 for M4 based on their consistent enrichment across methods and functional relevance reported previously; we did not find a strongly enriched TF in module M2. Targets of REST and NRF1 are largely repressed (Fig. 4A, C), while SOX2 targets are predominantly upregulated (Fig. 4B). REST and SOX2 targets in M1 and M3 were found to be enriched for neuron functioning and dedifferentiation, respectively (Supplementary Figure 1C, E). In contrast, NRF1 targets in M4 were linked to oxidative phosphorylation and related energetics terms (Supplementary Figure 1F). Further, we looked at targets of chromatin modifier SUZ12 in M1 and found them to be downregulated (Supplementary Figure 1B) and enriched for neuron function (Supplementary Figure 1D).
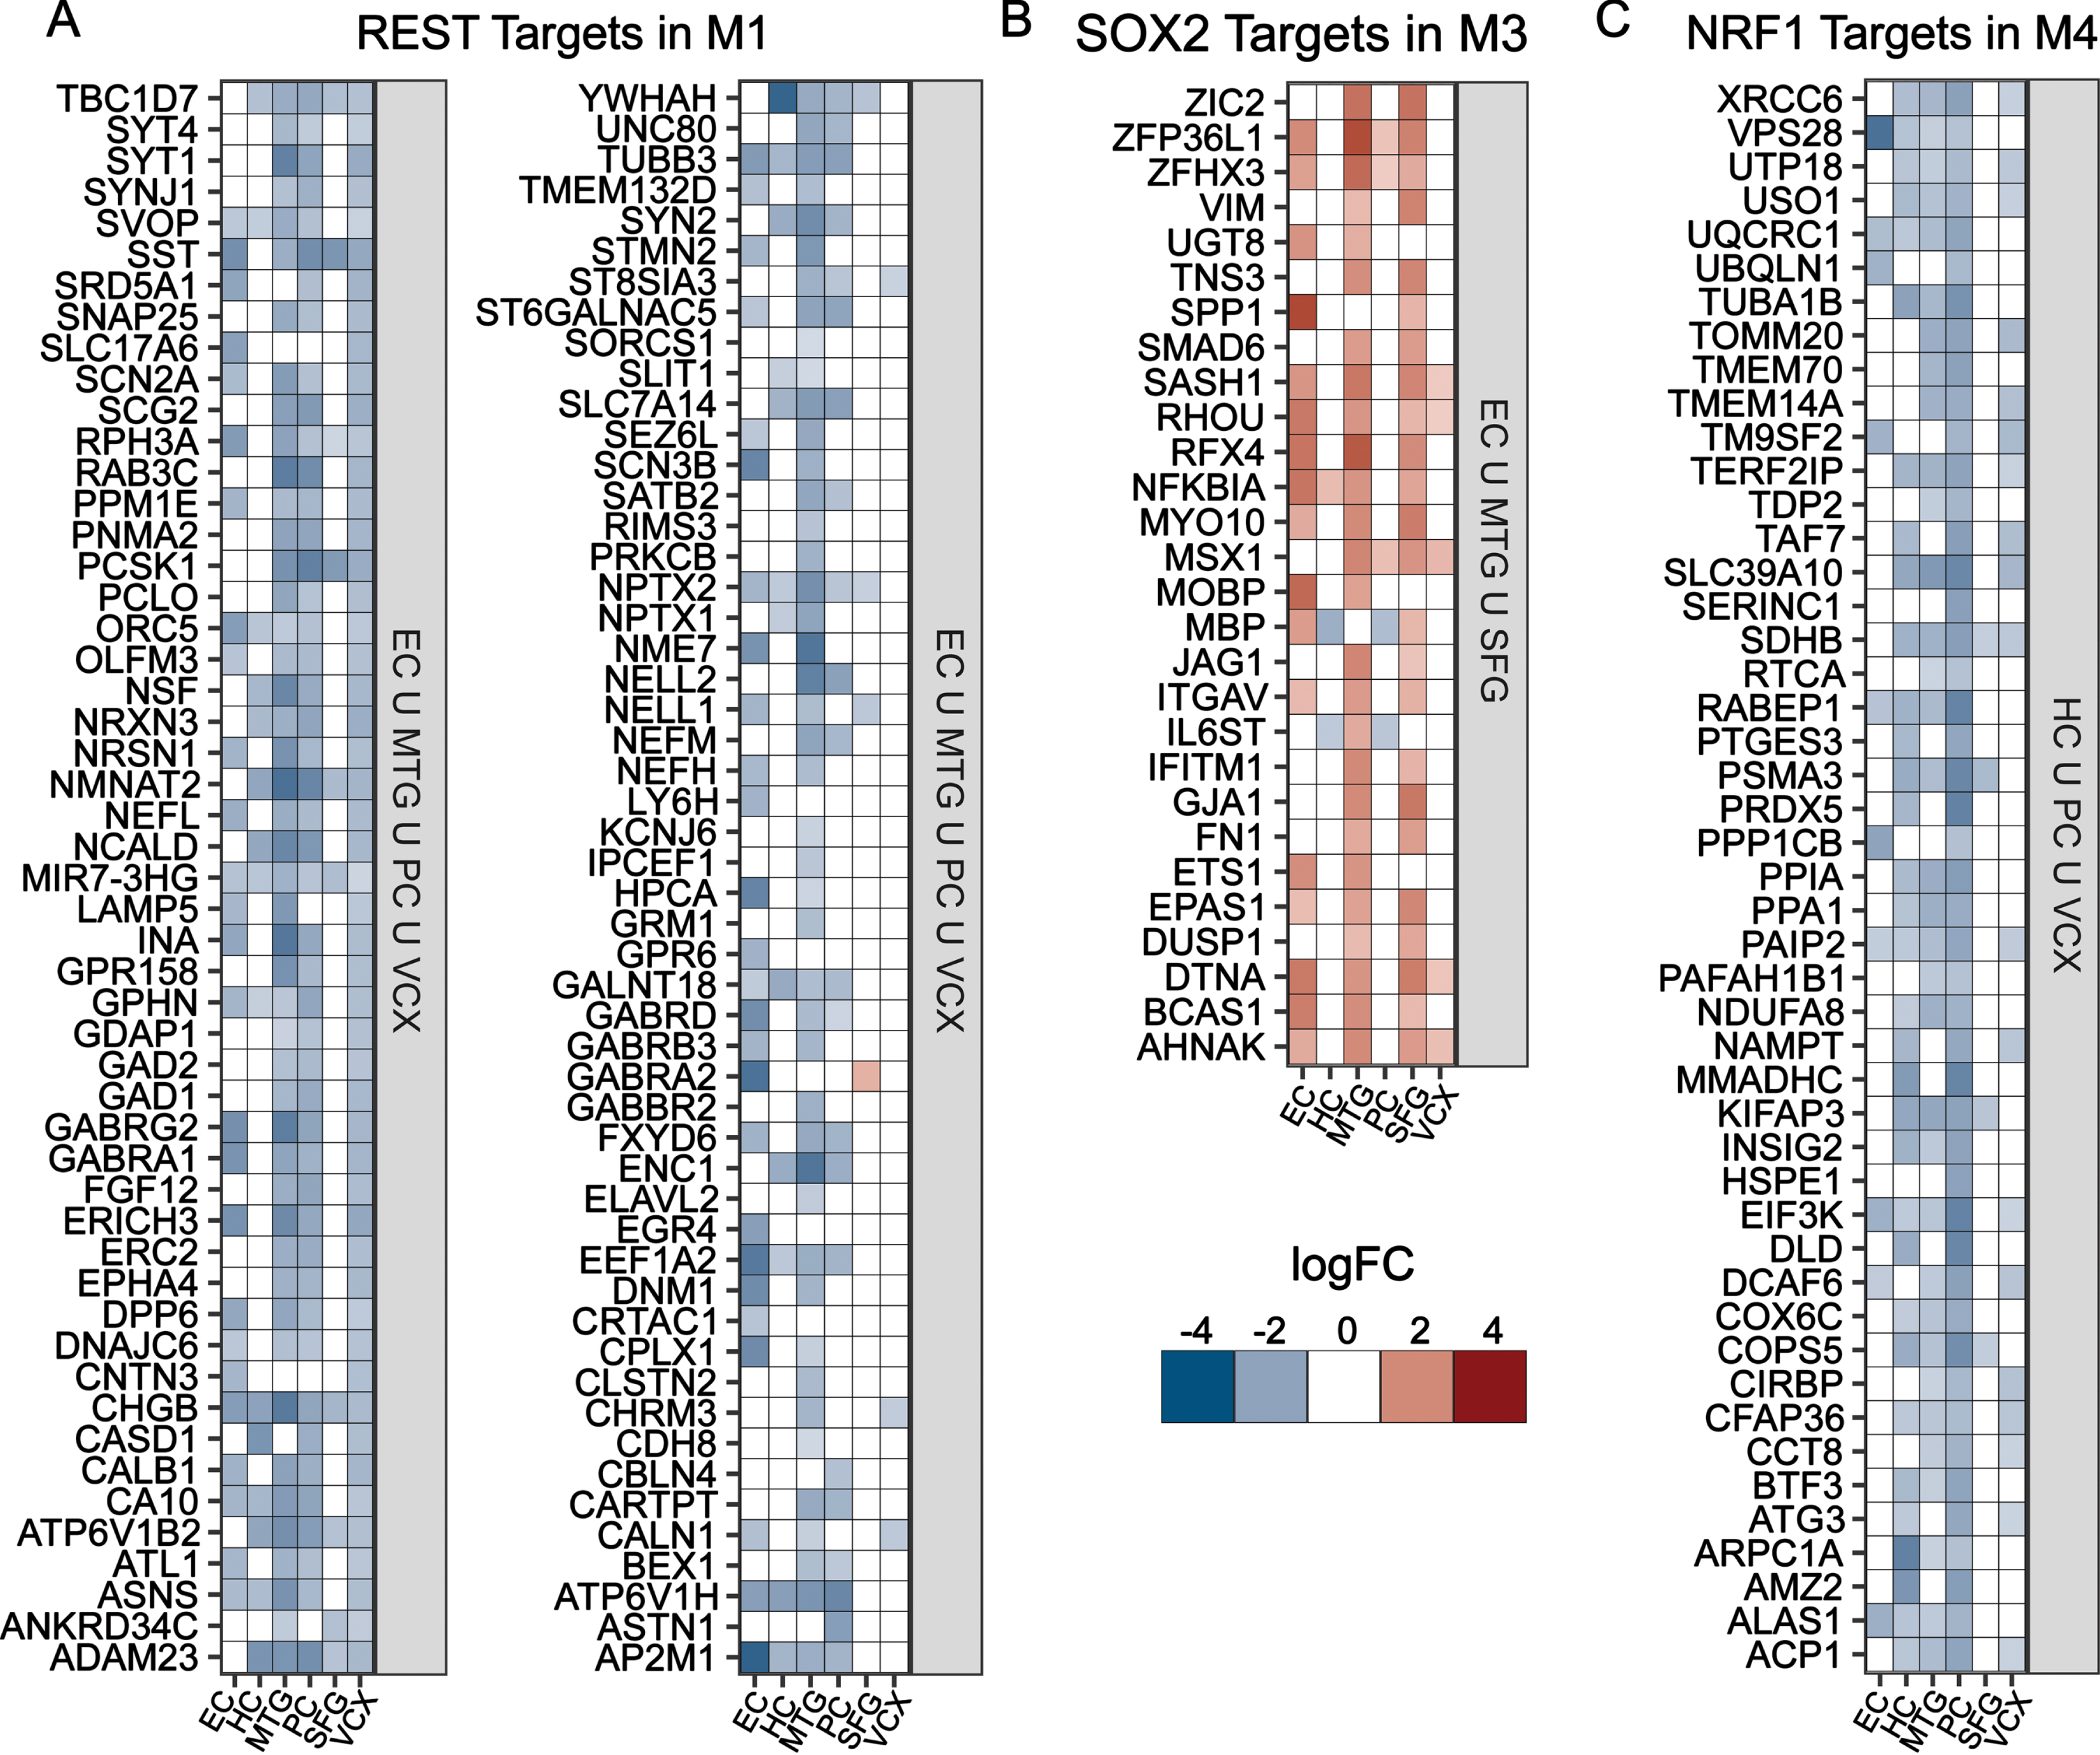
TF target differential gene expression for Module-specific TFs. A-D) Gene expression heatmaps for the targets of key TFs identified for modules M1, M3, and M4; (A) M1 REST targets in EC ∪ MTG ∪ PC ∪ VCX; (B) M3 SOX2 targets in EC ∪ MTG ∪ SFG; and (C) M4 NRF1 targets that are in HC ∪ PC ∪ VCX.
Tangles enhance EC endotypes
Further, we sought to identify the role tangles may play in AD development. To this end, we used GSE4757 to compare tangled neurons to tangle-free neurons in the EC obtained from similar sporadic AD brains. Differential analysis failed to identify any DEGs, and this is additionally observed in the multidimensional scaling (MDS) plot where no clear clustering between the two conditions is evident (Fig. 5A). In MDS space, the tangle and tangle-free samples are identified, and no clear directional shift is observed. We performed fgsea on a limma-generated ranked list to uncover enrichment and observe transcriptome-wide expression shifts in ontological and transcriptional categories. This analysis revealed that neuron function terms such as neuron development (GOBP) and synaptic signaling (GOBP) were negatively enriched (Fig. 5B). Additionally, the negative enrichment of REST targets was also uncovered (Fig. 5C). Our results suggest that tangles may amplify endotypes specific to the EC such as impaired neuron function. There are multiple possible reasons for this observation; perhaps the presence of tangles could result in a feedback loop that contributes to increased endotype dysregulation in the same direction as tangle-free SAD neurons relative to NDC, or it is possible that tangle neurons have an earlier disease incipience than tangle-free neurons. Nevertheless, involvement of REST and impaired neuron function is still observed.
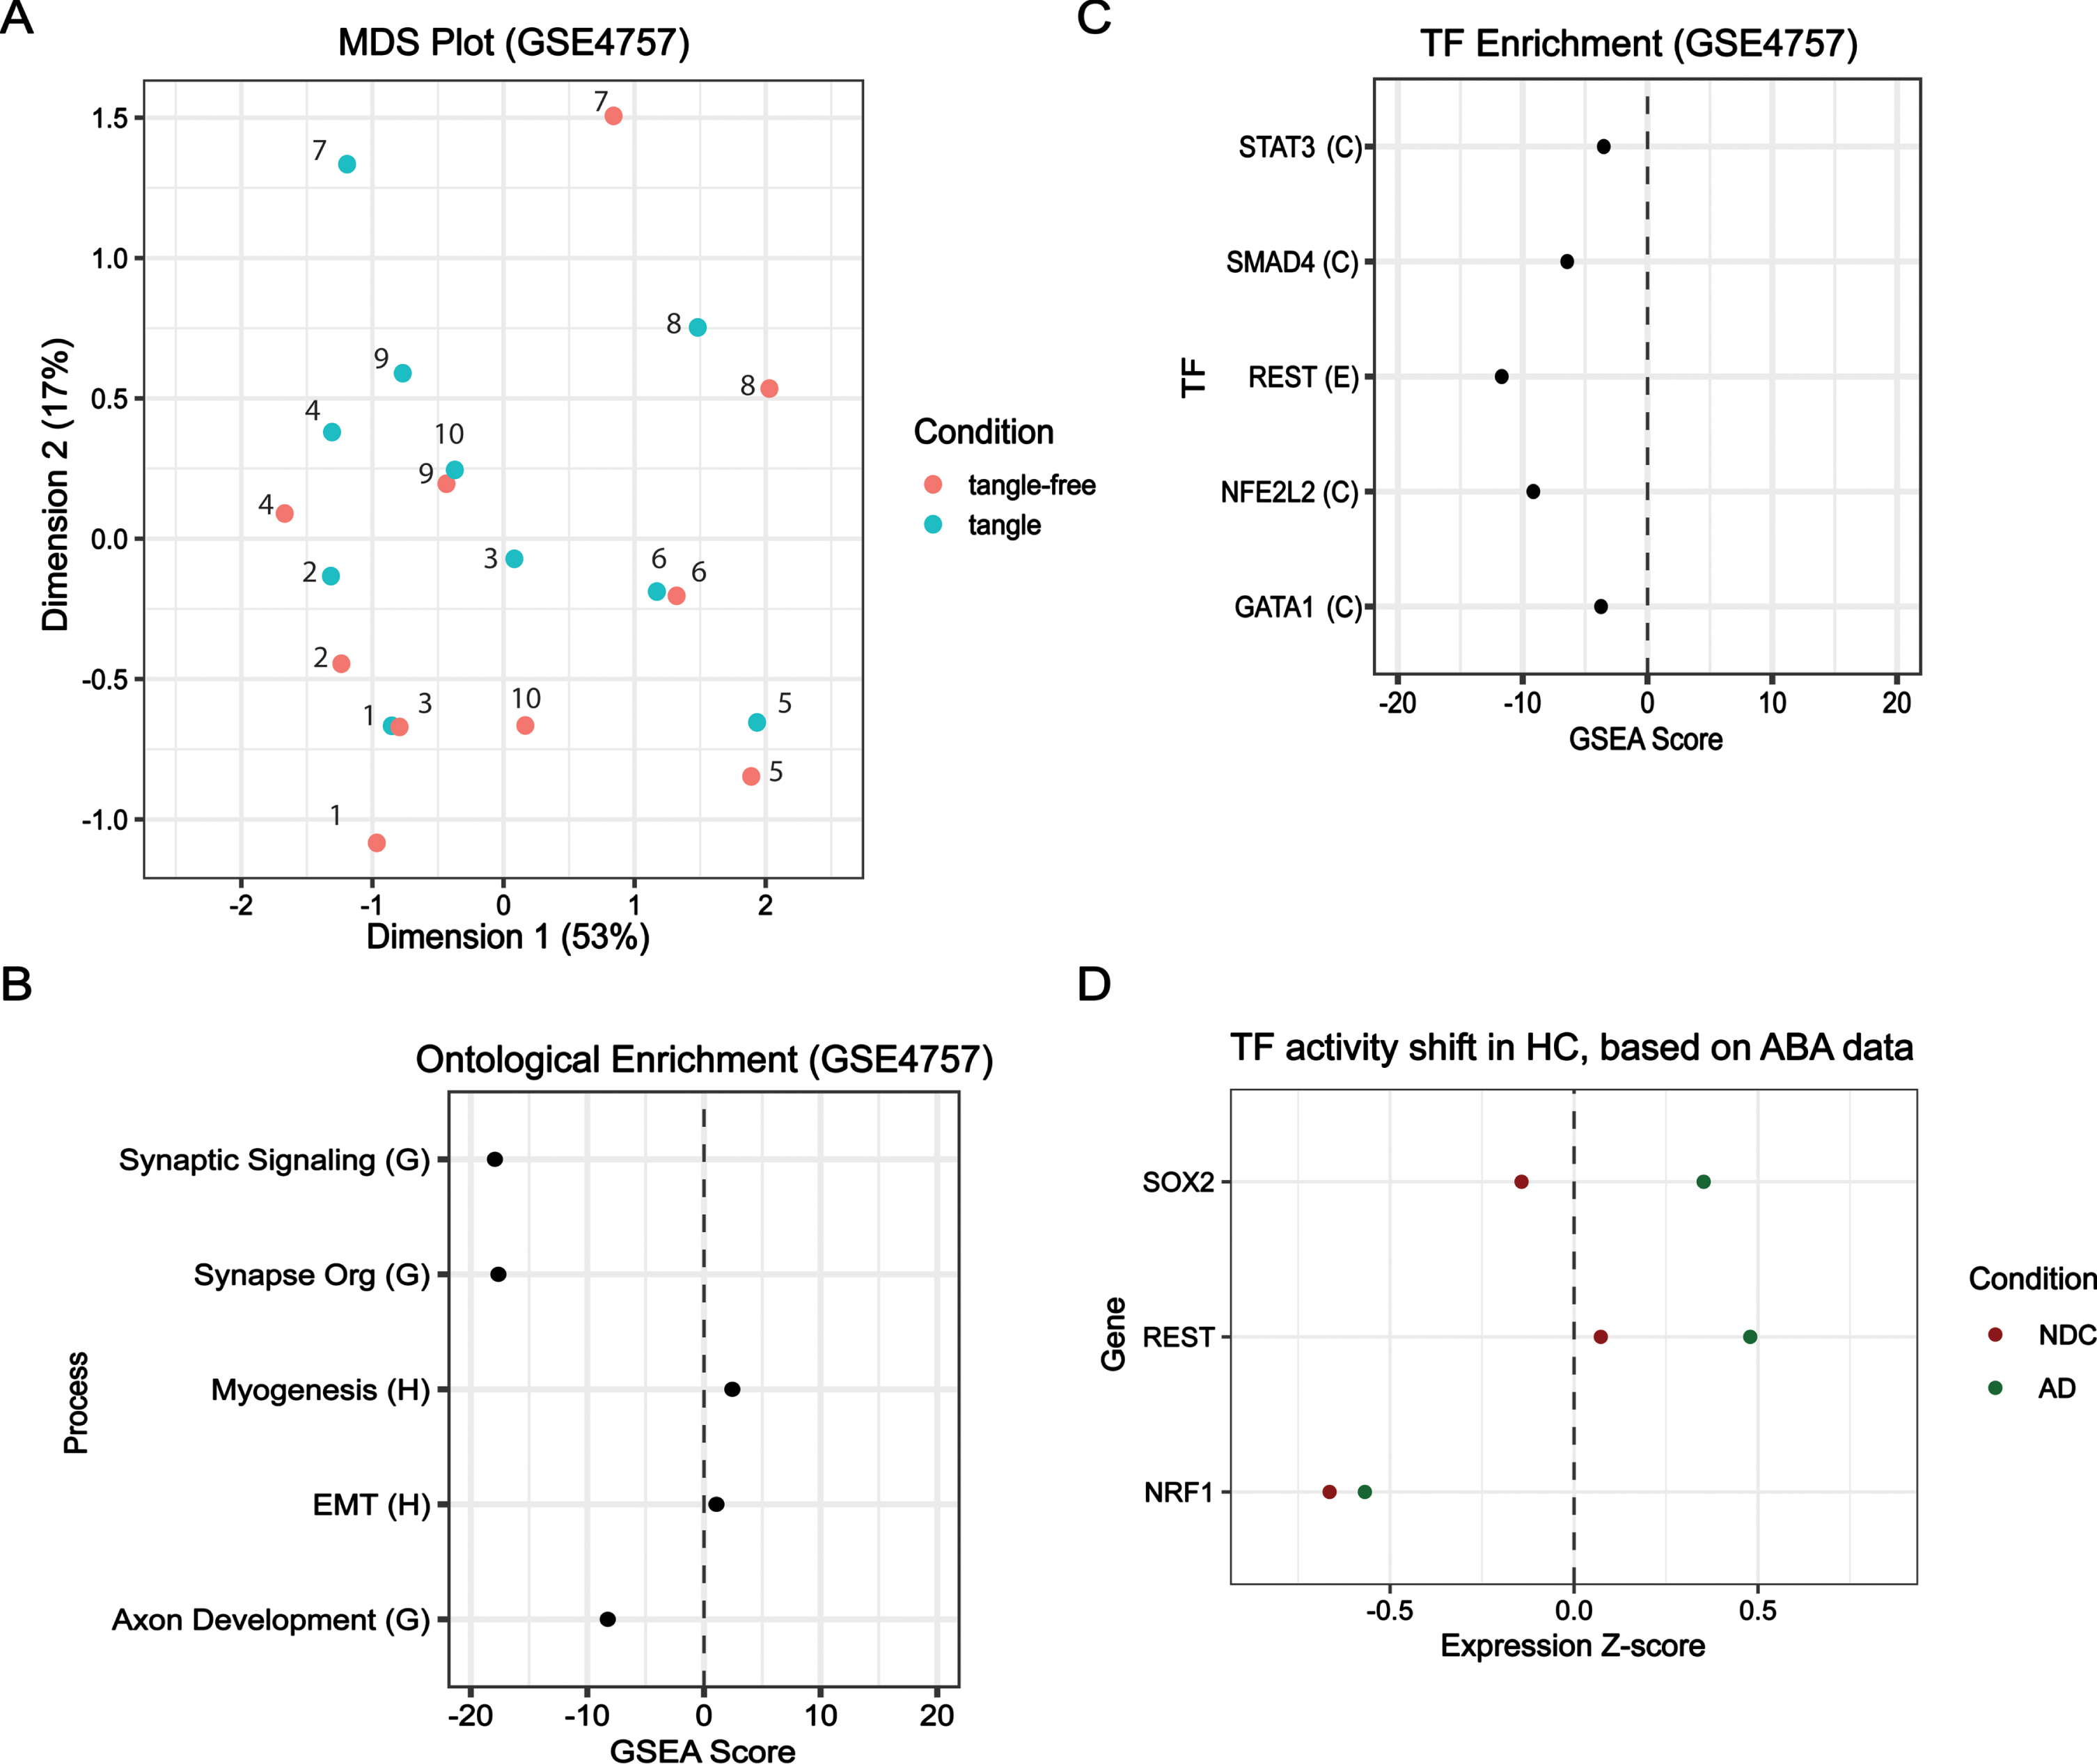
Comparison of key regulators in HC from AD, Demented, and Control samples. For GSE4757: (A) multidimension scaling (MDS) comparing tangle-free and tangle samples; (B) ontological enrichment using GOBP library; and (C) TF-target enrichment using the ECC library. For Allen Brain Atlas samples: (D) hippocampus (HC) z-score expression values from Allen Brain Atlas’ ADT data for NRF1, REST, and SOX2 are plotted for two conditions (1) Non-demented control (NDC) (Braak I-II) and (2) probable AD samples (AD) (Braak III-VI). Traumatic brain injury samples were excluded for all conditions assessed.
Similar TF expression observed in the Allen Brain Atlas dataset
To determine whether our findings extend beyond this dataset to other AD cohorts, we compared our findings with other publicly available curated RNA-seq datasets, such as the Allen Brain Atlas’ Aging, Dementia, TBI (ADT) study [34]. We matched the ADT NDC cohort with Liang et al. NDC cohort parameters and compared with putative HC AD samples to query the expression levels of disease endotype regulators, such as REST, SOX2, and NRF1 (Fig. 5D). The HC was the only brain region common between the ADT and GSE5281. The expression profiles for REST and SOX2 coincided with our predictions based on the GSE5281 dataset, suggesting common endotypes in these SAD cohorts. In contrast, we did not observe a comparable downregulation of NRF1 expression in the putative SAD HC samples in ADT. This may be because the ADT dataset used tissue samples that were not filtered for specific cell types and suggests that the loss of NRF1 expression and TF activity may be a neuron-specific feature of AD.
DISCUSSION
Studies on postmortem AD brains and brain imaging of AD patients show that disease manifestation varies in different brain regions [16, 55]. Studying this differential manifestation of disease in different brain regions will help decipher underlying mechanisms and provide insights into the disease distribution in the brain. It can also lead to better diagnostics and therapeutics. In this study, we identified key endotypes that are common and unique across six brain regions in SAD neurons. We used multiple enrichment approaches, TF analysis, and co-expressed gene module detection to identify mechanistic endotypes underlying AD. We found that suppression of neuron function, activation of dedifferentiation, and energetic deficits are the key disease endotypes in SAD and discuss further their potential mechanism of action below.
Loss of synaptic connections is one of the best correlates of dementia and cognitive deficits in AD [56]. Early aberrations in synaptic communication and structure might be reversible, but not eventual synaptic disintegration resulting in neuron death [56]. Synapse formation and maintenance is a neuron-specific activity inhibited by REST in non-neuronal and stem cell populations [19, 57]. REST is a repressor of neuron-specific genes in non-neuronal cells [18], and its increased activity in neurons indicates a reversal of neuron identity (dedifferentiation) in AD. FAD iPSC-derived neuron models showed that REST drives neuronal dedifferentiation [10]. Our analysis also suggests that REST activation orchestrates the suppression of the neuron function endotype in EC, HC, MTG, PC, and VCX. This is supported by the observed repression of synapse-associated REST targets such as SNAP25, which is linked to short-term neuroplasticity and vesicle exocytosis [58]. The reduced mRNA expression of SNAP25 has also been identified in other AD cohorts [59, 60]. Other downregulated REST targets involved in synaptic function include DPP6 and LAMP5 [61, 62]. DPP6 is involved in synaptic development, and its inhibition is linked to impaired hippocampal memory, and LAMP5 regulates synaptic transmission in GABAergic neurons [61, 62]. While REST activation may be shared between FAD and SAD, specific REST target involvement may vary between the conditions and warrants additional investigation. Further, we identified involvement of neuron function genes NPTN, CHL1, and WDR47 (Supplementary Figure 2B) in PC- and VCX-linked module M2. NPTN and CHL1 have been linked to synaptic health through cellular adhesion mechanisms, whereas WDR47 is involved in axon and dendritic development alongside microtubule homeostasis in neurons and is an essential player in neuronal transport processes [52–54].
We observed the involvement of SUZ12 in impaired neuron function and, to a lesser degree, in the dedifferentiation endotypes. PRC2, of which SUZ12 is a component, is a chromatin modifier that promotes a repressed, closed chromatin state via modulation of the H3K27 methylation [44]. Here, we observed that SUZ12 targets were repressed and enriched for neuron function terms such as synaptic signaling (GOBP), GABAergic synaptic transmission (GOBP), and axon development (GOBP) (Supplementary Figure 1D). Interestingly, recent genomic analysis of cerebrospinal fluid (CSF) from AD patients with normal CSF total-tau levels has linked SUZ12 and REST to the repression of synaptic plasticity genes [63]. Further, REST is known to recruit the PRC2 complex, and we have found that REST and SUZ12 have 42 gene targets in common in M1 that are also differentially expressed in the EC, MTG, PC, and VCX [64]. This suggests chromatin modification and transcriptional binding repression may be responsible for impaired neuron functioning in SAD. Our observations are bolstered by findings that chromatin landscape in hiPSC-derived neurons from fibroblasts of SAD patients display an immature neuronal state alongside chromatin changes indicative of dedifferentiation in FAD models [10, 65]. While aging is linked to global hypomethylation in neurons and this has been linked to learning and memory decline, our findings indicate that even compared to age-matched controls, SAD samples exhibited SUZ12 mediated repression. Further, epigenetic signature experiments in SAD human fibroblast iPSC-derived neurons suggest that the AD epigenome is in a state indicative of neuronal hypomaturity rather than accelerated aging [65]. Together, the activation of PRC2 and REST are likely to contribute to reversal of neuronal identity via epigenetic and transcriptomic mechanisms [65].
While a quasi-dedifferentiated neuron may lose its ability, to maintain the structure and function of the synapse and long-term potentiation, and generate action potentials, we observed activation of pluripotency and non-ectoderm lineage programs [10, 66]. The pluripotency factor SOX2 was identified as a primary regulator of the dedifferentiation endotype in the EC, MTG, and SFG. Activation of SOX2 target genes such as MOBP, a marker of oligodendrocytes and ZIC2, a neural stemness gene, indicate a quasi-precursor-like state. Dedifferentiation in astrocytes, a cell type with a largely shared lineage with neurons, has been coupled to inflammation and the activation of the canonical inflammatory factor NFκB [49, 68]. Our analysis uncovered target upregulation and increased TF activity of NFκB subunit RELA in most brain regions, combined with non-ectodermal term and pluripotency factor enrichment suggestive of precursor-like reversion in neurons [40].
We compared tangled and tangle-free AD neurons to gauge whether endotype involvement changed. No DEGs were found using limma, and we hypothesize that this is because at late stage of AD, in the most affected brain region (EC), the disease progression has likely reached a terminal stage in both tangle and tangle free neurons. This is further illustrated by lack of condition-specific clustering on the MDS plot. Analysis using a limma-generated ranked list, uncovered negative enrichment of neuron function and REST targets in tangled AD neurons in EC, a region where we identified REST-mediated dedifferentiation when comparing tangle-free AD and NDC neurons. This reveals that tangle pathology may accentuate endotype association and enhance disease-associated transcriptomic dysregulation. It is well known that accumulation of tau, a microtubule protein involved in axonal transport, is neurotoxic and can lead to neuron death; it is possible that tau may additionally play a role in amplification of these specific endotypes [69].
Our recent work on iPSC-derived neurons from FAD patients has shown that dedifferentiation and loss of neuronal function are the key endotypes, and the same has been confirmed in young onset AD patients without canonically defined familial mutations [10, 70]. However, such characterization has not been performed on postmortem, tangle-free human SAD neurons. Other transcriptomic studies from multiple brain regions in SAD have similarly identified AD-related transcriptional changes in the temporal lobe and found impaired neuron functioning through enrichment analysis. This has provided unique insights into cell-type specific dysregulation with disease progression and increased transcript variant usage in AD [71, 72]. Further, another study performed on SAD fibroblast derived-iPSC neurons found transcriptomic and epigenetic indicators of mature neuron identity reversal, concordant with our findings in this study [65].
There is a tight coupling between energetics and cellular processes, such as metabolic demands and homeostasis [73]. Region-specific impaired glucose utilization and mitochondrial dysfunction occur several years before cognitive dysfunction in AD, leading to oxidative stress, ATP depletion, and cell injury [74]. The inactivation of NRF1, a master regulator of mitochondrial gene expression, is responsible for the energetics endotype. Its dysregulation contributes to disease mainly in the HC, PC, and VCX. Oxidative phosphorylation is a crucial process for cellular energetics and survival powered by electron transport chain (ETC) enzyme complexes and intermediate electron carriers, which all have been implicated in AD [13, 75]. NRF1 regulates ETC enzyme complex subunit genes, affecting ATP synthesis [76]. In the HC and PC, downregulation of NRF1 targets such as NDUFA8 (complex I), SDHB (complex II), UQCRC1 (complex III), and cytochrome C gene COX6 C implicate ETC anomalies in the energetics endotype [77–79]. Another NRF1 target and mitochondrial biogenesis regulator, NAMPT, which modulates NAD+ synthesis, critical to oxidative phosphorylation is downregulated in HC, PC, and VCX [80, 81]. NAMPT inhibition has been linked to ATP reductions in HC of early AD rodent models [81]. Oxidative phosphorylation is associated with mature neuron identity, and successful neuron differentiation requires an energetic shift to oxidative phosphorylation [13]. Our enrichment of NRF1 targets in module M4 demonstrates oxidative phosphorylation linked ATP deficits (Supplementary Figure 1F) and, thus, suggests a reversal of neuron identity.
Additionally, it is known that metabolic conditions such as diabetes increase the risk of developing AD [82]. Our findings suggest that dysregulation of carbohydrate metabolism, primarily through oxidative phosphorylation anomalies, is significant in the SAD brain. While we lack the diabetic status of the subjects in GSE5281, it has been suggested that improper carbohydrate processing in neurons, as observed in this work, may be linked to AD pathogenesis [83]. Alterations in carbohydrate metabolism, primarily that in glucose utilization in the AD brain has already been observed using fluorodeoxyglucose (FDG)-positron emission tomography (PET) scans [84]. Hyperactivity of neurons is another metabolic aberration that has been observed in neurons of pre-clinical AD, mild cognitive impairment, and early stages of AD prior to the neuronal loss yet we do not observe such indications in the tangle-free neurons we have chosen to analyze [85]. Instead, our findings are suggestive of a hypometabolic states consistent energetic deficit.
Liang et al. found ETC-linked energetic abnormalities, such as downregulation of mitochondrial translocase encoding genes, prominent in PC and less so in VCX [17]. Using contemporary enrichment methods alongside TF regulatory analysis and co-expressed gene module detection, we could identify that energetics-related transcriptomic shifts affect PC, HC, and VCX. While VCX is believed to be relatively unaffected in early AD pathology, transcriptomic evidence from another sporadic postmortem AD human cohort has similarly linked this brain region to energetic shortfalls [70, 86]. A recent functional MRI study has found disruption of face-evoked visual processing and functional connectivity networks in VCX, correlating with the severity of AD cognitive symptoms [87]. Also, optical coherence tomography has uncovered changes in central retinal thickness alongside impaired visual function in AD patients, indicating greater visual system involvement in AD. These findings align with the early pathogenic transcriptional shifts we observe in the afflicted VCX [88].
We performed DEG analysis revealing that the MTG, PC, and EC have the greatest number of unique DEGs, yet we did not find any endotype unique to these regions. This suggests that while endotypes and regulatory dysfunction might be shared between different brain regions, underlying pathological transcriptomic signatures may vary, explaining the presence of a great number of unique DEGs. Additionally, it remains unknown why energetic deficits are stronger in the PC, HC, and VCX than in the MTG and EC. In the context of energy deficits and increased dedifferentiation, we hypothesize that it is likely that the brain is also exhibiting a reversal of neuron identity. Oxidative phosphorylation is the primary energetic process in neurons and its reversal is indicative of neuron precursor-like states [13]. This is further bolstered by observing a transcriptome that is indicative of dedifferentiation in these post-mitotic neurons. Together this indicates that mature neuron identity is being reversed.
Our analysis towards deciphering endotypes extends the original analysis by Liang et al. both in statistical and functional analysis methodology. While Liang et. al relied on an unpaired two tailed t-test in excel to find DEGs and focused primarily on known AD pathology-associated pathways, our work uses limma to leverage the expression patterns of the entire dataset to identify differential expression, paired with curated geneset libraries and unbiased Functional Class Sorting-based geneset enrichment tests [23]. Further, we compared the differentially expressed gene probes between our analysis and that done by Liang et al., revealing an increased number of differential probes in our analysis (Supplementary Figure 3). We attribute this to improvements in probe annotation and methods for differential expression testing since the publication of this dataset (i.e., limma).
While we have successfully characterized endotypes and proposed potential regulatory mechanisms, we are limited in this study by the lack of chromatin topology data, preventing us from going beyond gene expression and further elucidating brain region-specific mechanisms at the epigenomic level. In addition, the sole usage of microarray data for gene expression suffers from limitations inherent to the platform, such as increased background noise, biased transcript pool, and lower sensitivity compared to modern high-throughput sequencing methods [89]. Nonetheless, this dataset is unique because it comes from six different brain regions and is derived from tangle-free neurons instead of bulk tissue to gain insights from a critical cell type in AD [15, 16]. The selection of tangle-free neurons lets us observe molecular mechanisms that precede tangle formation. Further, we addressed whether our findings translate to other AD cohorts by comparing the gene expression of key TFs with the ADT cohort and found that REST and SOX2 upregulation is present also in these cohorts.
Our study points to common and unique mechanisms associated with different brain regions and provides insights into their regulation in SAD. While dedifferentiation and altered energetics are common AD endotypes in all brain regions, it will be of interest to identify the timing associated with the onset and progress of these endotypes in different regions. We expected to observe greater DGE in the temporal lobe regions, such as the HC and EC, since the appearance of AD pathology is observed earlier in these regions [90]. These changes could predict the gene expression alterations in other brain regions where AD pathology manifests later (e.g., the SFG). While we sought to identify the temporal changes of AD endotypes using brain regions as a proxy for disease progression, our work did not identify such relationship. Therefore, we conclude that deciphering the temporal nature of disease progression will require additional information, such as cognitive scores and disease duration information. With the advent of single cell sequencing approaches and spatial transcriptomics, analysis of AD patient samples from a spectrum of brain regions like the six studied here will present an opportunity to temporally map disease progression not only in different brain regions but also help characterize cell heterogeneity changes across the regions.
Footnotes
ACKNOWLEDGMENTS
This study was supported by National Institute of Health Grants, R01 LM012595 (S.S.), R01 HL108735 (S.S.), OT2 OD030544 (S.S.), and R01 HL106579-07 (S.S.), a grant from the Chen Foundation (S.S.) and the Joan and Irwin Jacobs Endowed Professorship (S.S.).
FUNDING
This work was supported by the National Institutes of Health.
CONFLICT OF INTEREST
The authors have no conflict of interest to report.
DATA AVAILABILITY
The data supporting the findings of this study are openly available in GEO with accession IDs: GSE5281 and GSE4757.