
Abstract
Background:
There is considerable variability in the rate at which we age biologically, and the brain is particularly susceptible to the effects of aging.
Objective:
We examined the test-retest reliability of brain age at one- and three-year intervals and identified characteristics that predict the longitudinal change in brain-predicted age difference (brain-PAD, defined by deviations of brain age from chronological age).
Methods:
T1-weighted magnetic resonance images were acquired at three timepoints from 497 community-dwelling adults (73.8±3.5 years at baseline, 48% were female). Brain age was estimated from whole brain volume, using a publicly available algorithm trained on an independent dataset. Linear mixed models were used, adjusting for sex, age, and age2.
Results:
Excellent retest reliability of brain age was observed over one and three years. We identified a significant sex difference in brain-PAD, where a faster rate of brain aging (worsening in brain age relative to chronological age) was observed in men, and this finding replicated in secondary analyses. The effect size, however, was relatively weak, equivalent to 0.16 years difference per year. A higher score in physical health related quality of life and verbal fluency were associated with a faster rate of brain aging, while depression was linked to a slower rate of brain aging, but these findings were not robust.
Conclusion:
Our study provides consistent evidence that older men have slightly faster brain atrophy than women. Given the sparsity of longitudinal research on brain age in older populations, future prospective studies are needed to confirm our findings.
Keywords
INTRODUCTION
Aging is an inevitable biological process, characterized by the gradual accumulation of cellular and tissue damage, and subsequent attenuation of sensory, motor, and cognitive functions [1, 2]. The brain is particularly susceptible to the effects of aging, undergoing many structural and functional changes over the lifespan. Progressive age-related brain atrophy (i.e., loss of brain tissue volume) [3] has been associated with a decline in cognitive performance [4] and a greater risk of neurodegenerative disorders [5]. There is, however, considerable interindividual variability in the rate of brain aging and disease risk, which is influenced by genetic and environmental factors [6]. As such, some individuals will remain relatively healthy in later life, while others will experience a severe decline in cognitive function, independence, and quality of life.
Interindividual differences in the progression of biological brain changes can be investigated through the construct of ‘brain age’. Brain age is a neuro-imaging-based biomarker created for its correlation with chronological age. An older brain age relative to chronological age is considered a sign of advanced brain aging (i.e., greater age-related changes, including the loss of brain tissue volume), and has been linked to poor health [7] and cognitive decline [8]. A number of structural brain age models have been developed and examined in community-dwelling older populations [9–11]. This includes the algorithm developed by Cole and colleagues [6] that uses voxel-level analyses of grey and white matter volume, and cerebrospinal fluid to provide a single estimate of brain age, taken from across the whole brain. The difference between chronological and brain age is referred to as brain-PAD (the brain-predicted age difference). We have found a brain-PAD representing an older brain age relative to chronological age is associated with a lower cognitive performance [12], and others have shown brain-PAD to predict dementia and mortality risk [6, 13].
A growing body of evidence supports the contributing role of sociodemographic, physical, and psychological health and wellbeing in interindividual differences in brain structure. For example, a weaker grip strength in midlife have been linked to a smaller whole brain volume in later life (aged 69–71 years) [14], while greater brain atrophy has been identified in people with depression or poor metabolic health [15, 16]. The protective effect of a higher educational attainment on brain volume has also been identified in older individuals cross-sectionally [17, 18] and may be an initial advantage that carries into later life [18, 19]. Brain age studies report similar patterns of association in the general population, through which an older brain age relative to chronological age was found to be cross-sectionally associated with poor grip strength and cardiometabolic health [6, 21]. Some cross-sectional studies have linked depression to advanced brain aging, though there remain inconsistencies among studies that primarily relate to symptomatic patient populations [22–24]. Single estimates of brain age have been found to be higher in women than men [25–28], though the findings are somewhat inconsistent. Conversely, cross-sectional studies link a younger brain age relative to chronological age to meditation [29], musical attainment [30], more years of formal education, and physical activity [31].
An important consideration for improving later-life health, and resilience to age is to determine whether these sociodemographic, physical, and psychological factors can change brain-PAD over time (e.g., could a stronger grip strength delay the process of brain aging over time). While some have investigated brain age longitudinally, most such studies relate to early life factors [32–34] or involve small samples of young adults [35–38], or patient populations [39–41]. For this reason, there is a need for longitudinal studies that measure brain age at multiple timepoints, and which investigate the influence of a range of factors on the change in brain-PAD in older community dwelling adults. The aim of this study was firstly to assess the test-retest reliability of brain age estimation using serial magnetic resonance images (MRIs) collected over a three-year period in older community dwelling adults. Secondly, we sought to determine whether baseline factors relating to sociodemographic, health, mood, quality of life, and physical and cognitive function are associated with the change in brain-PAD in older community dwelling adults.
MATERIALS AND METHODS
Study design
This study utilized neuroimaging data from ASPREE-NEURO (NEURO) [42], a sub-study of the ASPirin in Reducing Events in the Elderly (ASPREE) clinical trial [43]. ASPREE is a double-blind, randomized, placebo-control trial aimed to determine whether daily treatment of low dose aspirin (100 mg) could extend disability free life in older adults from Australia and the US [43]. Full eligibility criteria for ASPREE have been published elsewhere [43]. In brief, Australian participants were eligible if aged 70 years and over at study entry; were without major cognitive impairments (i.e., none reported a diagnosis of dementia, or had a Modified-Mini-Mental State (3MS) examination score≤77) [44]. They were free of any previous cardiovascular event, including atrial fibrillation, and were not taking antithrombotic therapy; they were also devoid of any serious illness that was a high risk of major bleeding or was likely to cause death within 5 years of randomization [43].
NEURO recruited 572 ASPREE participants residing in Melbourne and nearby regional Victoria, of whom 497 completed a baseline MRI scan and one or more follow-up scans, and comprise our study sample. Of these participants, 430 completed a brain scan at each timepoint, while the remaining 67 attended scanning at baseline and the one- (n = 57) or three-year follow-up (n = 10). Fifty-two NEURO participants were excluded as they had only attended scanning at baseline (n = 34), year one (n = 8), year three (n = 3), or both the one- and three-year follow-up (n = 7). A further 23 individuals were excluded as they had no estimate of brain age at any timepoint. Relative to the included sample, the excluded group had a lower mean score on cognitive tasks assessing psychomotor speed, and episodic memory (Table 1). Although these individuals were comparable in chronological age and sex, a greater proportion were obese, and had a slow gait speed, depression, diabetes, or hypertension (Table 1).
Baseline participant characteristics for included (n = 497) and excluded study participants (n = 75)
aNumber of total participants who are missing from race (n = 1), SDMT (n = 2), HVLT-R (n = 1), body mass index (n = 3), weak grip strength(n = 4), and slow gait speed (n = 3). bNumber of total participants who are missing from SDMT (n = 1) and weak grip strength (n = 1). COWAT, Controlled Oral Word Association Test; HRQoL, Health-related quality of life; HVLT-R, Hopkins Verbal Learning Test-Revised, delayed memory recall; SDMT, Symbol-Digit Modalities Test; SES, socioeconomic status; 3MS, Modified-Mini-Mental State examination.
For scanning purposes, participants were free of contraindications to MRI, including foreign bodies and metallic or electronic implants unsafe at 3T, and claustrophobia [42]. All participants provided written informed consent to both ASPREE and NEURO, and study procedures were conducted in accordance with institutional guidelines. ASPREE is registered with the International Standard Randomized Controlled Trial Number Register (ISRCTN83772183) and Clinicaltrials.gov (NCT01038583). NEURO is registered with the Australian and New Zealand Clinical Trial Registry (ACTRN12613001313729). The current study was approved by the Monash University Human Research and Ethics Committee (Project ID: 29311).
Baseline participant characteristics
Participants completed a number of questionnaires and assessments at baseline, and those relevant to the current study are detailed below [45]. Socioeconomic status (SES) was derived using the Index of Relative Socio-Economic Advantage and Disadvantage percentile score (SEIFA) [46] and divided into binary groups using a median split. For the purpose of this analysis, education status was defined as less than 12 years of education (i.e., did not complete all years of secondary education in Australia), or 12 or more years of education (i.e., completed secondary or higher years of education in Australia) [47].
Participants having diabetes mellitus were those receiving treatment for diabetes, or who had a fasting blood glucose of at least 126 mg per deciliter (≥7 mmol per liter), or who provided a self-reported diagnosis. Dyslipidemia was defined by the participant being prescribed cholesterol lowering medication; having serum cholesterol levels of at least 212 mg per deciliter (≥5.5 mmol per liter), or a low density lipoprotein (LDL) level of more than 160 mg per deciliter (≥4.1 mmol per liter). Hypertension was defined by a systolic and/or diastolic blood pressure (BP) more than 140/90 at trial entry, or by participants who had previously received advice that treatment for hypertension was appropriate [45].
Physical function was assessed using measures of grip strength and gait speed. These were quantified as the average of three trials of grip strength, using the dominant hand, and mean time to complete a 3-meter walk (in seconds), respectively [45]. Weak grip strength was defined as the lowest quintile after adjusting for sex and weight. Slow gait speed was defined as the lowest quintile after adjusting for sex and height.
Frailty was defined using modified Fried Frailty criteria, which includes having a low body mass index (< 20 kg/m2); weak grip strength and slow gait speed (as described above); self-reported exhaustion using questions from the Center for Epidemiologic Studies Depression (CES-D) scale [48], and low physical activity (i.e., defined using self-reports of no walking outside the home, or walking for less than 10 minutes without rest in the past two weeks) [49]. Participants were categorized as ‘prefrail’ and ‘frail’ if they satisfied 1–2 or 3 + criteria, respectively [49]. For our analysis we combined prefrail and frail participants as there were only three people identified as frail. Depressive symptoms were defined as a score of≥8 on the CES-D, which identifies people with more severe depressive symptoms than participants scoring < 8 [48]. Summary measures of physical and mental health-related quality of life (HRQoL) were derived from items from the Short-Form-12 (SF-12) [50], as described previously [51]. A higher score in either measure represents better well-being.
Cognitive function was measured using a battery of tests that assessed phonological verbal fluency (Controlled Oral Word Association Test [COWAT], using the single letter ‘F’) [52], psychomotor speed (Symbol-Digit Modalities Test [SDMT]) [53], delayed verbal memory recall (Hopkins Verbal Learning Test-Revised [HVLT-R]) [54], and global cognition (3MS) [44]. A lower test score indicates a poorer cognitive performance for each of these measures except for SDMT, on which a higher score indicates a faster performance.
Neuroimaging data collection and quality control
Structural MRI data was acquired at three timepoints: baseline and the one- and three-year follow-ups (a median duration of 14 [IQR = 11–20], 355 [IQR = 349–381], and 1,085 [IQR = 1,071–1,106] days after the assessment of participant baseline characteristics), using a 3 Tesla Siemens Skyra MR scanner (Siemens Erlangen, German) with a 32-channel head and neck coil, located at Monash Biomedical Imaging in Melbourne Australia. High resolution 3D magnetization prepared rapid gradient-echo (MPRAGE) images were acquired in the sagittal orientation, with 1mm isotropic resolution (192 slices, FOV = 256×240 mm2, TR = 2300 ms, TE = 2.07 ms, TI = 900, flip angle = 9°).
Image quality was assessed using the MRI Quality Control toolbox (MRIQC) [55]. An empirical criterion was used to identify outliers (> 1.5 inter-quartile range) on one or more metrics of image quality, followed by a visual inspection by three study investigators (JW, PW, IHH), as previously described [12]. A total of 26 images at baseline; 13 at year one, and 21 at year three received a poor image quality rating and were excluded from this study.
Brain age prediction
Estimates of brain age were derived from raw T1-weighted MR images using Cole and colleague’s software (https://github.com/james-cole/brainageR) [6]. All images were pre-processed using the Statistical Parametric Mapping (SPM12) toolbox (Univer-sity College London, London, UK). This includes segmentation into grey matter, white matter, and cerebrospinal fluid, followed by normalization to the Montreal Neurological Institute (MNI) space using a non-linear (DARTEL) registration [56]. Tissue volume at each voxel was retained through scaling of the normalized tissue maps by the Jacobian determinant of the deformation [57]. Images were resampled to a voxel size of 1.5 mm and smoothed using a Gaussian spatial smoothing kernel of 4 mm at full-width-half-maximum [56].
Normalized tissue maps were combined and divided into 435 principal components previously identified for a training cohort of 3,377 healthy adults (aged 18–92 years), sourced from seven publicly available datasets that cover a range of geographical locations (including Australia, the US, and UK), scanner strengths and data acquisitions (refer to https://github.com/james-cole/brainageR for further details). Components covering 80% of the total variance of chronological age were input into a Gaussian process algorithm, and the resulting rotation matrix used to predict brain age for the NEURO participants. Brain-PAD was defined as the difference between brain age and chronological age. A positive value (i.e., older brain age relative to one’s chronological age) is considered a sign of accelerated brain aging; while negative values (i.e., younger brain age relative to chronological age) reflect decelerated brain aging.
Statistical analysis
The mean (standard deviation [SD]) are reported for continuous data, or as the median (interquartile range [IQR]) if the distribution was skewed. Categorical data is summarized by the frequency and percentage. Intraclass correlation coefficients (ICC) were employed to assess the reliability of brain age and brain-PAD over the one- and three-year follow-up. ICCs and their respective 95% confidence intervals were calculated based on a single-rating, consistent-agreement, using a two-way mixed effects model [58]. Reliability was interpreted as poor (< 0.5), moderate (0.5–0.75), good (0.75–0.9), and excellent (> 0.9) [59]. Minimal detectable change (MDC), representing the least amount of change necessary to exceed measurement noise [60], was calculated using the following formula: 1.96 * SEM *
Linear mixed modelling was used to investigate the association between baseline participant characteristics (‘exposures’) and the baseline, and rate of change in brain-PAD (‘outcome’). Models included fixed effects of time (i.e., annual visits of 0 [baseline], 1 and 3 years, treated as a continuous variable) and exposures, along with the interaction between time and exposures, and a random intercept and slope. To account for potential age bias and sex, multivariable models were adjusted for age, age2, and sex [37]. A polynomial for age was included given prior knowledge regarding brain-PAD and age bias [63], and its contribution to our model variance in baseline random effects. Results are reported using unstandardized coefficients of the baseline intercept, and interaction, alongside their respective confidence intervals.
Given that the availability of only three repeated measures may limit the reliability of estimates from a linear mixed model, we conducted additional analyses to assess the robustness of our main findings [64]. This involved classifying participants by the overall pattern of change in brain-PAD over three years, which we defined as ‘accelerate’, ‘decelerate’, and ‘stable’, and was dependent on the change in brain-PAD increasing (i.e., a numerically positive change that represents greater brain atrophy), or decreasing (i.e., a negative change indicating preserved brain aging) by two or more years, or had otherwise remained relatively stable (irrespective of direction, change in brain-PAD was less than two years) over the three year follow-up. Multinomial logistic regression models were used to determine which baseline exposures predicted the likelihood of being in one of these groups, with the stable group treated as the reference for all models. The change in brain-PAD of two years was chosen to define groups as this exceeds our cohorts mean change of 0.47 years over the three-year follow-up, therefore attenuating the likelihood of selecting participants by measurement noise alone. All analyses were performed using Stata software, release 16 (Statacorp, TX).
RESULTS
Study participants
The median chronological age of participants at baseline was 72 years, more than half had more than 12 years of formal education, and 48% were female. Although they were recruited as a relatively healthy cohort without major illness at baseline, participants had a range of chronic conditions including obesity, hypertension, diabetes and depression (Table 1).
Reliability of brain age and the brain-predicted age difference
The mean brain age at baseline, year one and three are summarized in Fig. 1. Mean baseline brain age was very similar to the mean chronological age, collected at the time of scanning (72.2 versus 73.8 years). The mean change in brain age from baseline to year 1 was 1.4 years (n = 487, 95% CI = 1.19, 1.56, p < 0.0001) and from baseline to year 3 was 3.4 years (n = 440, 95% CI = 3.17, 3.64, p < 0.0001). This was similar to the mean one- and three-year chronological age of 74.8 and 76.7 years, collected a median of 0.9 (IQR = 0.92–0.99), and 2.9 (IQR = 2.90–2.97) years after the baseline scan, respectively. Excellent test-retest reliability for brain age was found for both timepoints (Fig. 2). Chronological age was significantly correlated with brain age at baseline (rho = 0.44), indicating moderate accuracy of prediction, which remained at the one (rho = 0.42) and three-year (rho = 0.43, all p < 0.0001) follow-ups. This is further supported by a MAE of 4.97 years at baseline and was relatively consistent at each follow-up (one-year = 4.84 years; three-year = 4.74 years).
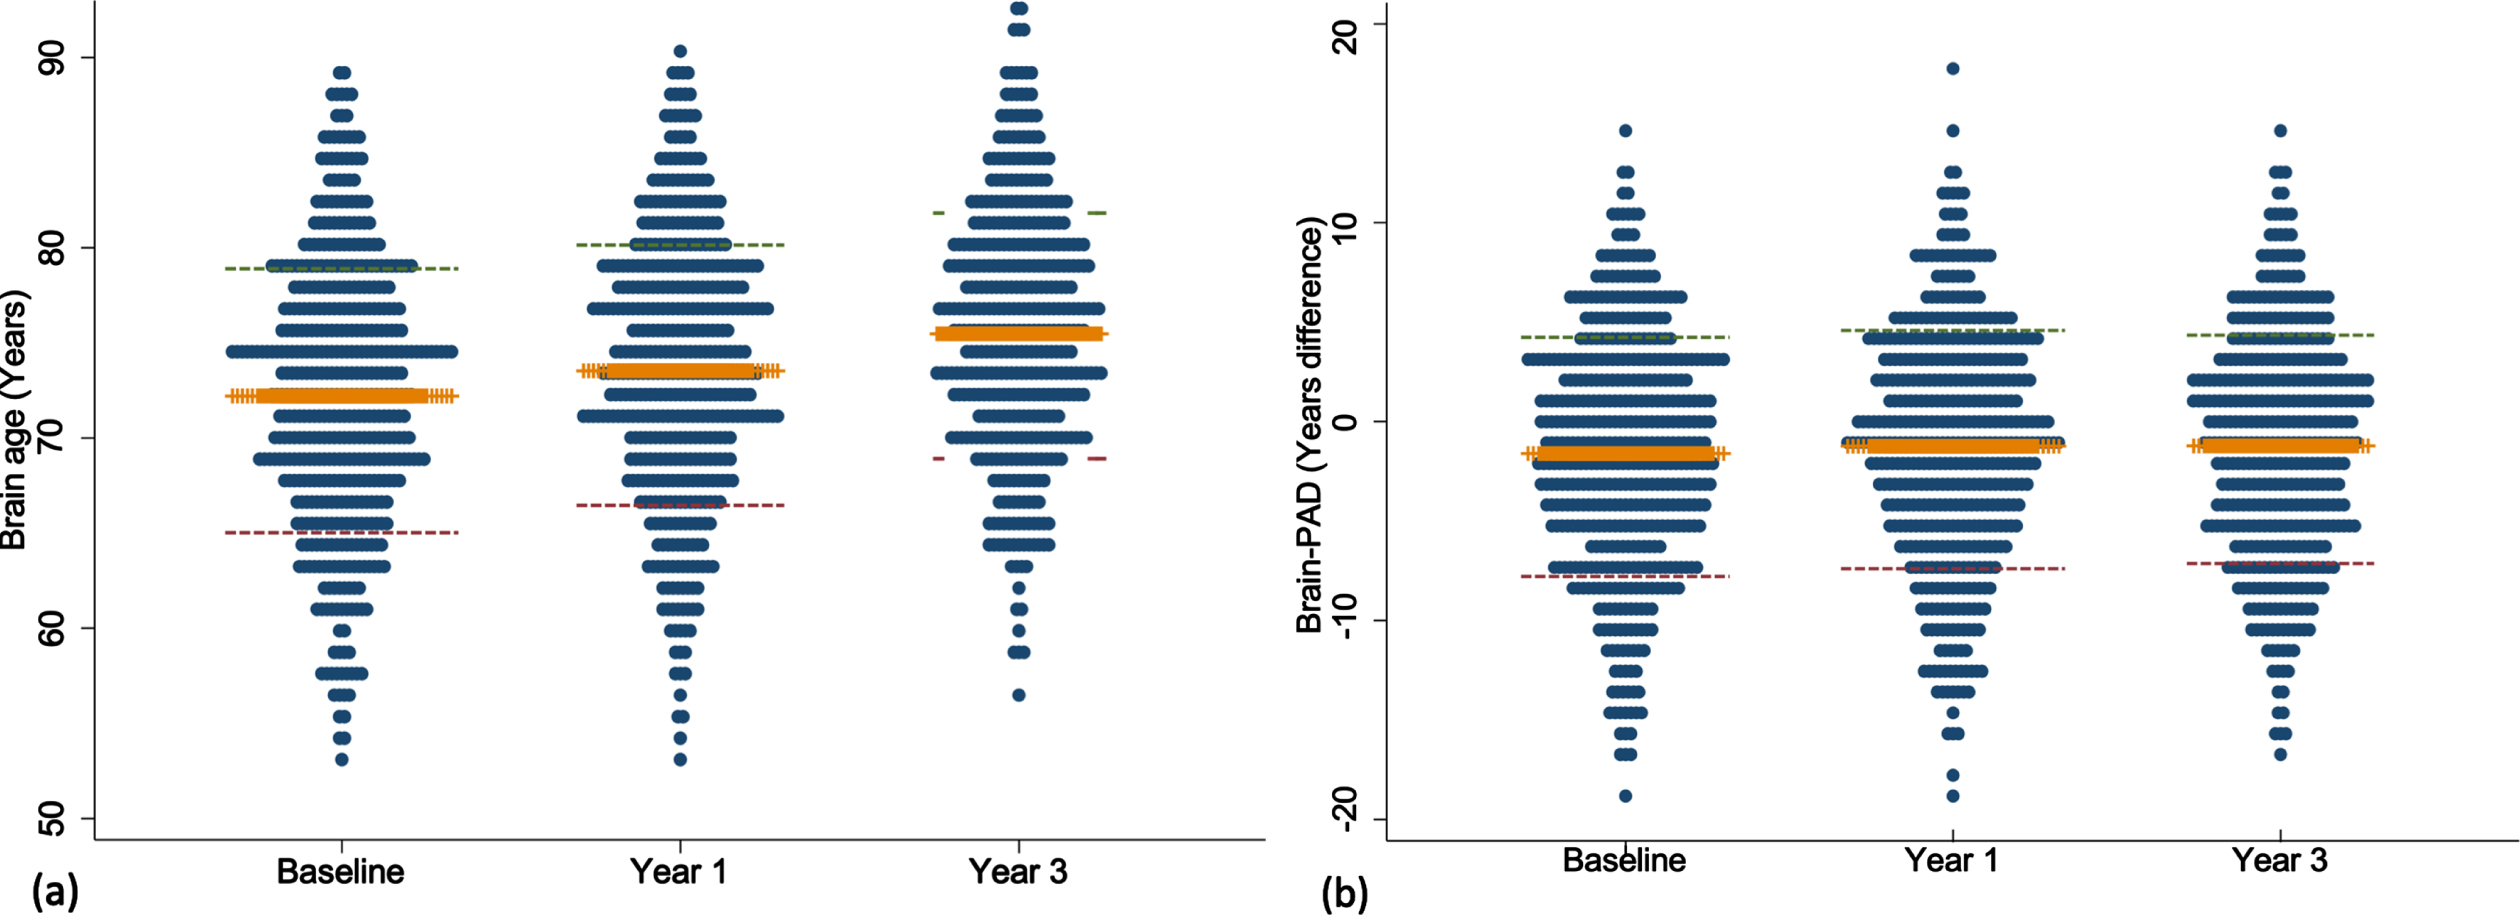
Dot plots presenting the mean and standard deviation of brain age (a) and brain-PAD (b) measured at baseline, year one and three. Orange line represents the mean; red and green lines define the standard deviation.
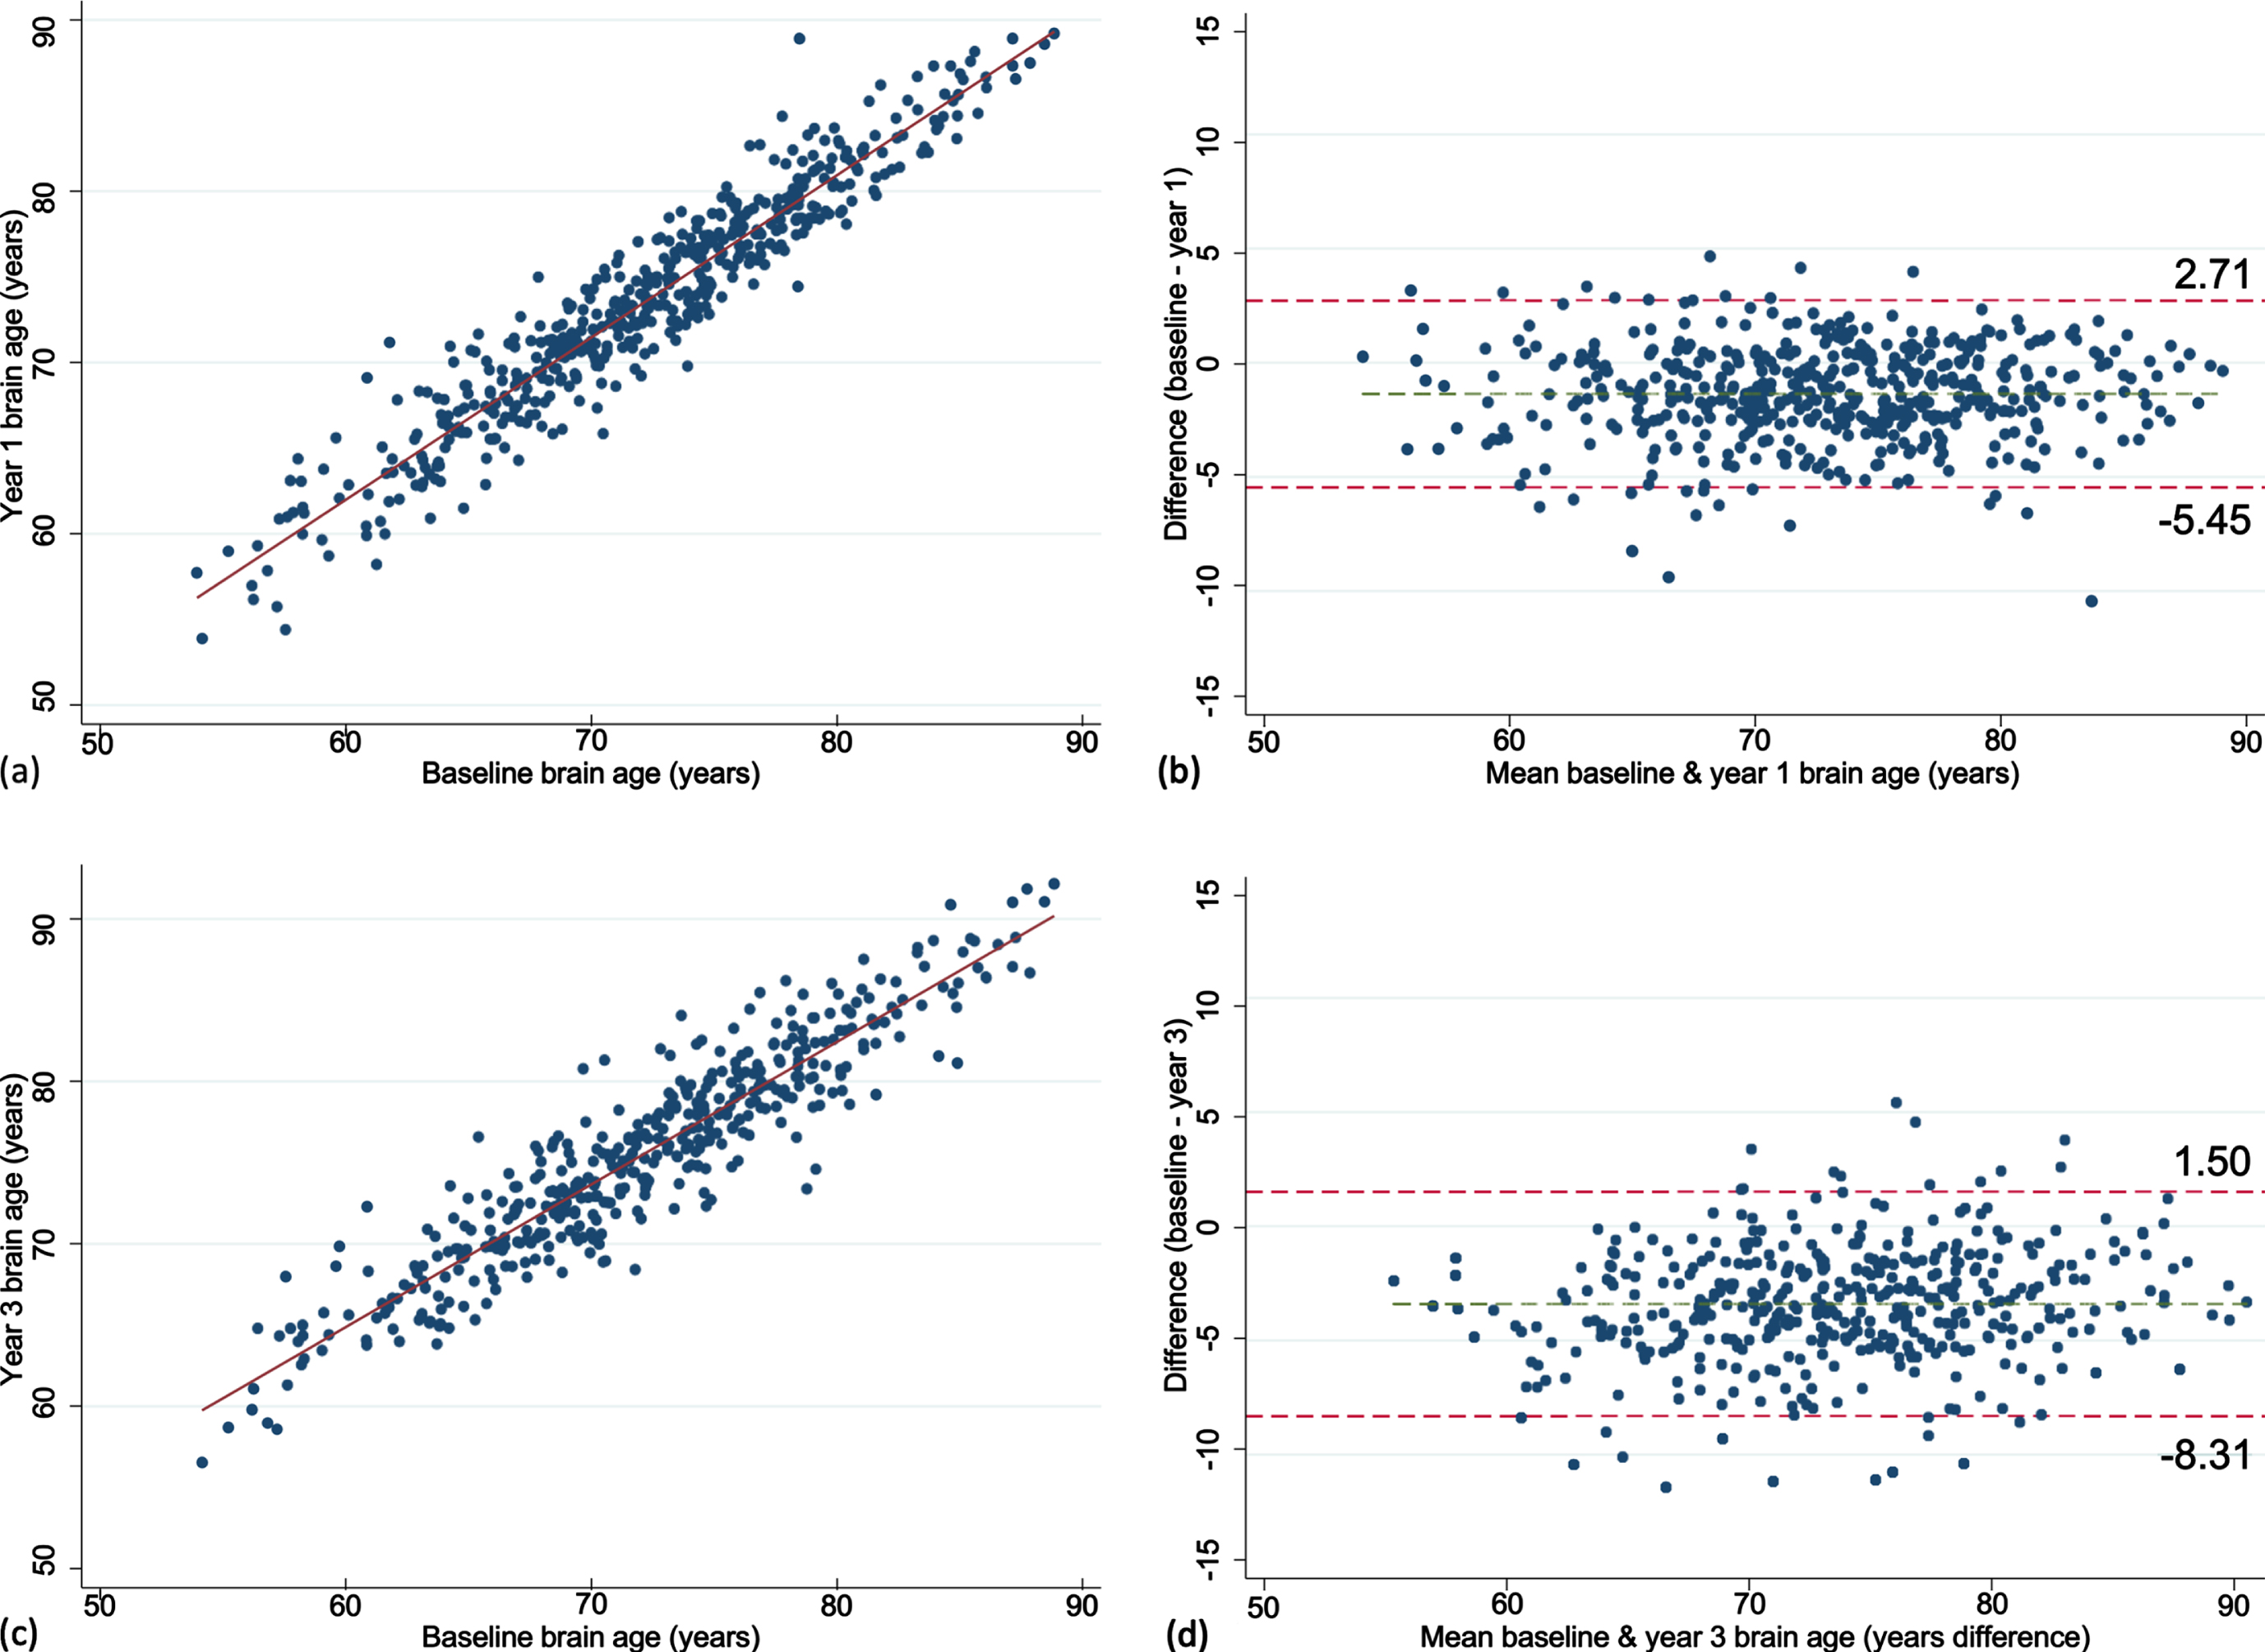
Scatter and Bland-Altman plots showing test-retest reliability of brain age over 1 (a, b) and 3 years (c, d). The limits of agreement are represented by values above and below the dotted red line (images b, d).
Participants individual brain-PAD trajectories are summarized in Supplementary Figure 1. Mean baseline brain-PAD was –1.6 years (SD of 6.0) indicating that the sample, on average, had a slightly younger brain age relative to their chronological age (Fig. 1). There was a statistically significant increase in brain-PAD over one (0.40 [2.1]) and three years (0.47 [2.5]; both p < 0.0001), respectively. No significant association was observed between chronological age and baseline brain-PAD (rho = –0.02, p = 0.60), suggesting no age bias in the prediction of brain-PAD. This was consistent at one (rho = –0.04, p = 0.39) and three years (rho = –0.02, p = 0.75). The MDC was small for baseline-year 1 and increased with a longer follow-up (baseline-year 3; Table 2).
Test-retest reliability measures for brain age and brain-PAD
ICCs (intraclass correlation coefficient) and their respective 95% confidence intervals were calculated based on a single-rating, consistent-agreement, using a two-way mixed effects model [58]. MDC, minimal detectable change; SEM, standard error of measurement.
Associations between baseline participant characteristics and the change in brain-PAD
Of all the characteristics examined, COWAT (a measure of verbal fluency whereby a lower score represents a poor cognitive performance) was negatively associated with brain-PAD at baseline (Supplementary Table 1), but with a faster rate of change in brain-PAD (i.e., greater change in brain age relative to chronological age) over time (Supplementary Figure 2a). Other characteristics associated with the rate of change in brain-PAD were sex (Fig. 3), depression, and physical HRQoL (i.e., interaction term was significant) (Supplementary Figure 2b, c). The sex differences are shown in Fig. 3, where males have a statistically significant faster rate of change in brain-PAD over time, compared to females. Depression was linked to a slower rate of change in brain-PAD (i.e., lesser change in brain age relative to chronological age) (Supplementary Figure 2b), while higher scores of physical HRQoL (i.e., better physical well-being) were associated with a faster rate of change in brain-PAD (Supplementary Figure 2c). Given participants were from the ASPREE trial, we assessed the effects of aspirin but found no association with baseline or the rate of change in brain-PAD over three years. This, in addition to all other interactive effects are summarized in Fig. 4. When treated as a covariate, aspirin had little to no effect on the prior significant findings (Sex: –0.16 [–0.31, –0.004], p = 0.04; COWAT, baseline brain-PAD: –0.12 [–0.24, –0.003], p = 0.044; COWAT: 0.02 [0.001, 0.03], p = 0.042; physical HRQoL: 0.01 [0.0004, 0.02], p = 0.041; depression: –0.27 [–0.54, –0.01], p = 0.041). Given that 18 characteristics were examined, and a 5% significance level, we would anticipate at least one of these associations would be significant by chance alone.
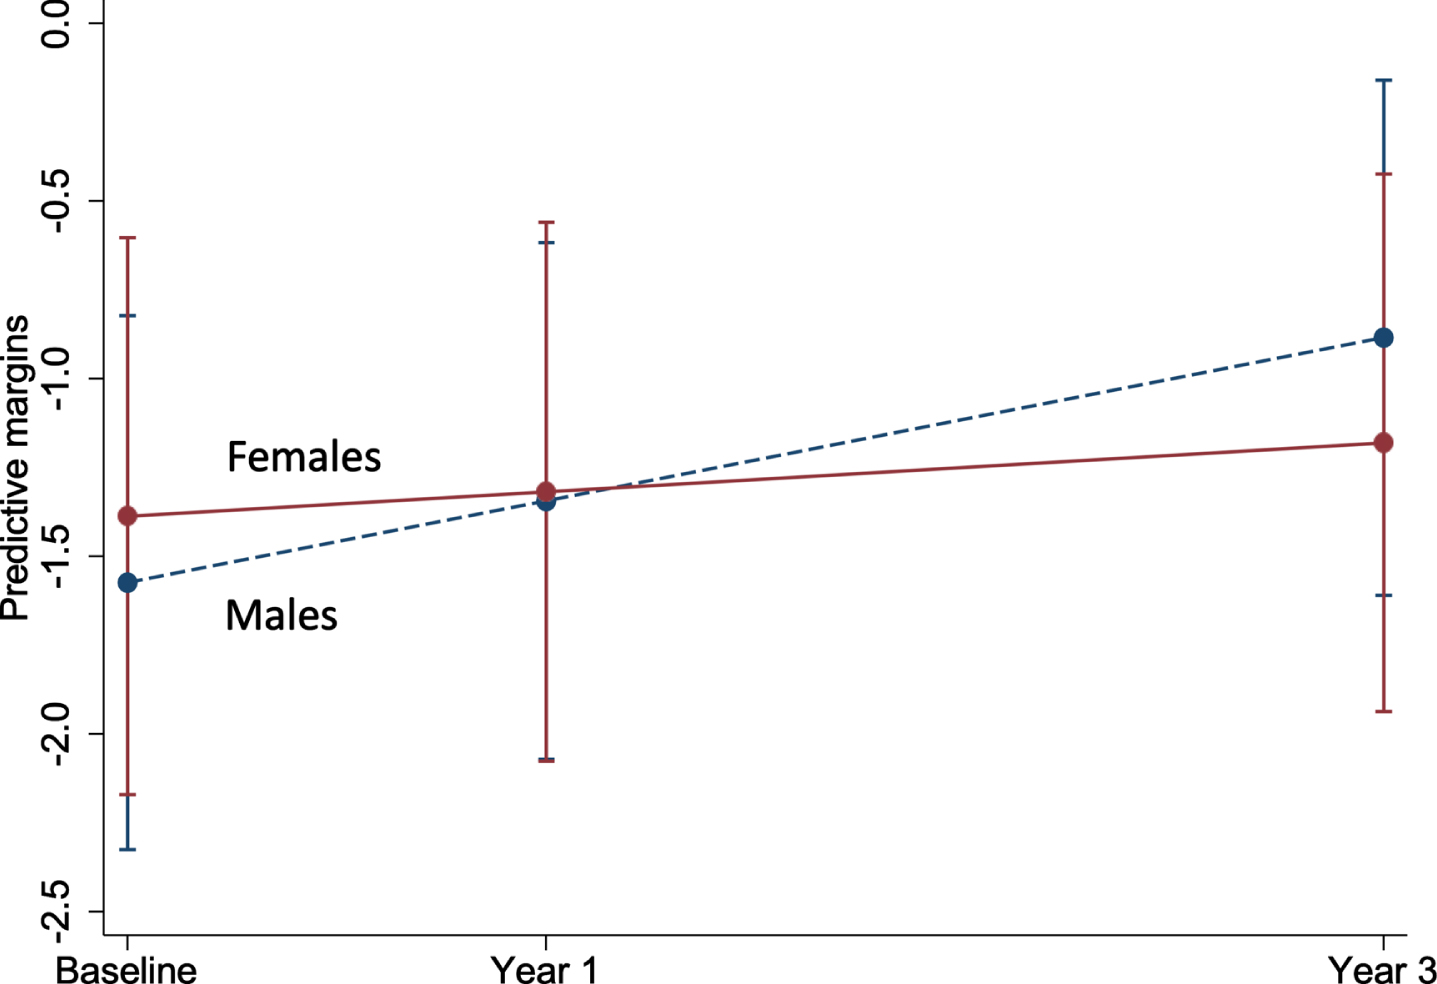
Marginal plot comparing the change in brain-PAD between males and females (n = 497). This plot represents the predictive margins and 95% CI for males (baseline = 259; 1 year = 253; 3 year = 230) and females (baseline = 238; 1 year = 234; 3 year = 210), taken from linear mixed models adjusting for age and age2.
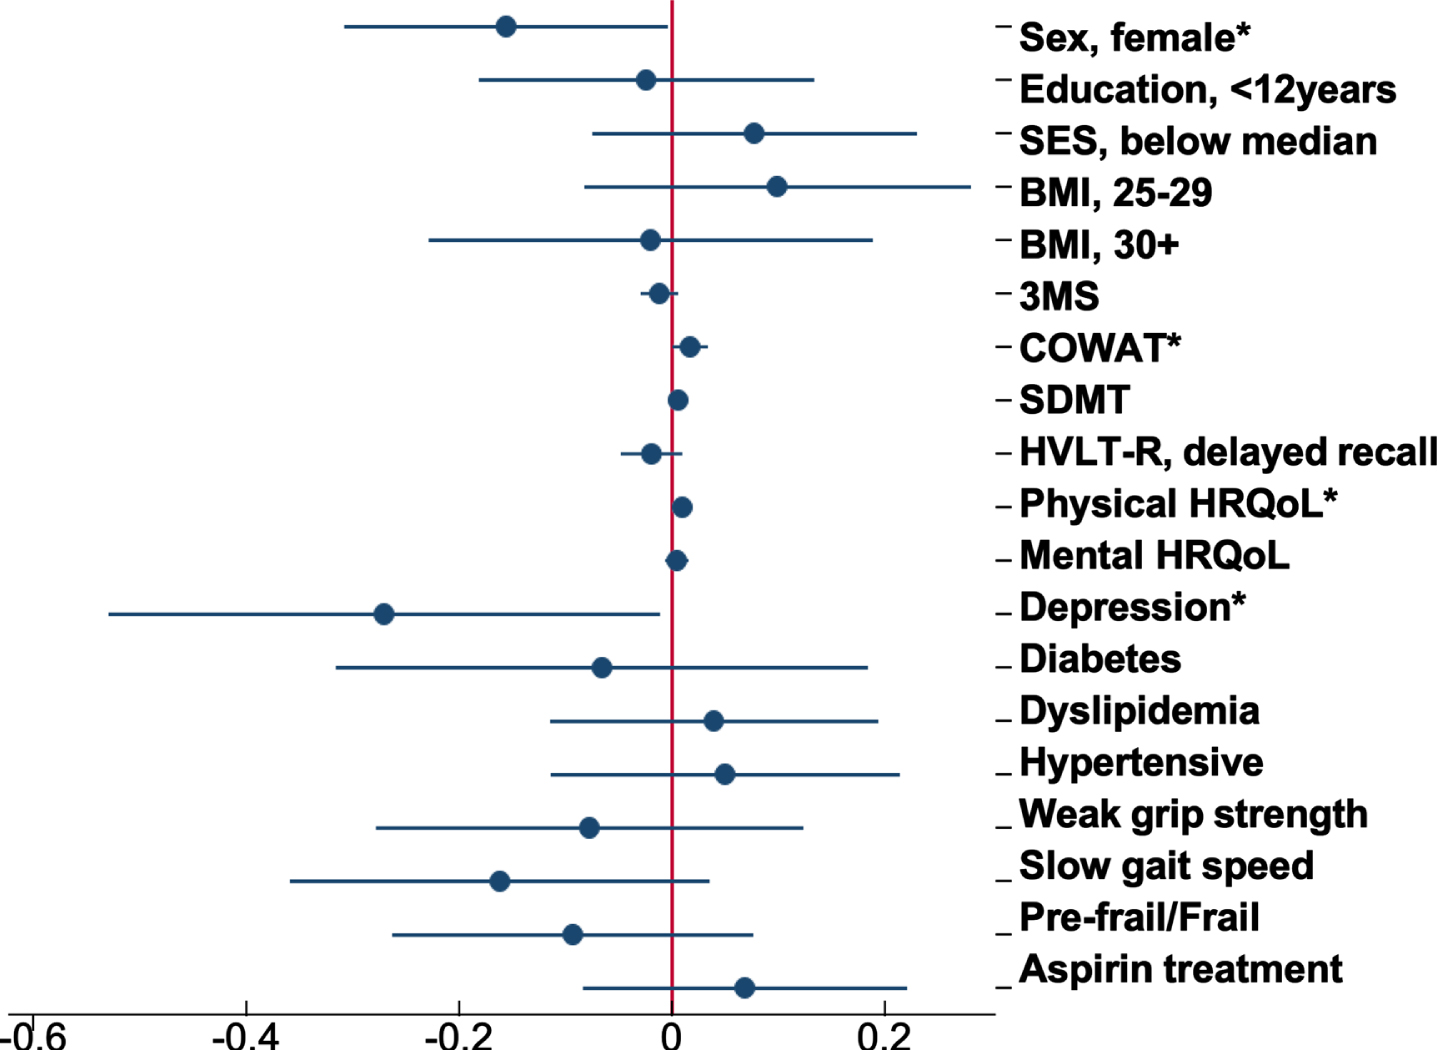
Forest plot of the association between baseline participant characteristics and the change in brain-PAD. Dots are the unstandardized beta coefficients representing the interaction between baseline characteristics and time; bars display the 95% confidence interval. Models adjusted for sex, age, and age2 *p < 0.05.
Additional analyses were performed classifying participants based on whether the change in brain-PAD remained stable (n = 274), decelerated (n = 61), or accelerated from baseline to year 3 (n = 105). Participants who decelerated had a median chronological age of 74.2 years (IQR = 71.8–77.1), which was older than individuals in the stable (72.4 [71.2–75.4]) or accelerate groups (71.6 [70.9–74.0]). Brain-PAD measured at baseline was significantly different between the three groups (p < 0.0001), with the accelerate group having a more negative brain-PAD (i.e., younger brain age relative to chronological age) than the stable (mean difference = –2.65 [95% CI = –4.21, –1.08], p < 0.0001), or decelerate groups (mean difference = –4.57 [95% CI = –6.76, –2.37], p < 0.0001). At year 3, the decelerate group had a lower brain-PAD than the accelerate group (mean difference = –2.50 [95% CI = –0.34, –4.66], p = 0.02). The accelerate group had a mean positive brain-PAD of 3.7 years (SD of 1.6), which equates to an older brain age relative to chronological age.
Multinomial logistic regression analyses, adjusting for baseline brain-PAD, sex, and chronological age, were performed to examine whether baseline factors predicted the outcome of accelerate or decelerate, with the stable group as the reference. From these we found women had a statistically significant lower risk (50%) of being in the accelerate versus stable groups (Supplementary Table 2). A higher 3MS score (i.e., representing a better global cognitive performance) was associated with a 6% lower risk of brain-PAD accelerating, while a lower SES was associated with a statistically significant higher risk (66%) of brain-PAD accelerating than remaining stable. Despite the associations described above, no association was observed with depression, COWAT, and physical HQRoL, or any other characteristic.
DISCUSSION
In a cohort of community-dwelling older adults from the ASPREE NEURO study (aged 70 years and above), we investigated the test-retest reliability of ‘brain age’, estimated from a widely-used algorithm [6]. We found excellent test-retest reliability of brain age longitudinally from baseline over one and three years, which highlights the robustness of this measure over the short and medium-term. We then examined whether factors relating to sociodemographic, health and wellbeing, and physical and cognitive function were associated with the three-year change in brain aging. We identified an association with sex, whereby a faster rate of change in brain aging (i.e., representing a greater increase, and therefore worsening of brain age relative to chronological age) was observed in men. We also found a weak, and somewhat paradoxical evidence for an association between depression and slower rates of change in brain aging (i.e., lesser change in brain age relative to chronological age), and associations between a faster rate of change in brain aging with both higher verbal fluency, and with greater physical HRQoL.
Among the determinants investigated in this study, the most consistent was the faster rate of brain aging, and thus cortical atrophy, occurring in men compared with women, although the effect sizes were small. While this finding of greater brain atrophy in men aligns with some longitudinal neuroimaging studies [65, 66], evidence from other studies is specific to certain brain regions, and relatively mixed [67, 68]. Other sex differences include a higher frequency of white matter hyperintensities in women, and cortical infarctions in men [69], and this is considered a possible explanation for some reports that women have a higher incidence of Alzheimer’s disease (AD) [70], although this remains inconclusive [71]. In terms of brain age, two small studies (n = 14 and 20) have investigated brain age prospectively, but in younger community dwelling adults [36, 72]. Of these studies, only one had examined sex differences, but this was in relation to the female menstrual cycle [36]. Findings from some cross-sectional studies indicate that women have a higher brain age than men, and thus greater age-related brain changes [25–28, 73]. Conversely, other studies report an older brain age relative to chronological age in men compared to women [6, 74], which aligns with our longitudinal finding of greater brain atrophy in men.
Although it remains inconclusive, sex differences may be linked to the involvement of sex hormones, including exposure to natural estrogen and testosterone over the lifetime, which are considered to have neuroprotective effects [75]. Declines in estrogen have been considered partially responsible for the greater loss of brain tissue volume observed in postmenopausal women, and later onset of AD in women compared to men [76], though these findings remain inconsistent [77–79]. They also do not corroborate some findings from observational studies on hormone therapies, which suggest no beneficial effects of estrogen for older women [80]. Conversely, given its primary role in males, declines in testosterone are considered an important risk factor for AD in men [81–83], and could partly explain the accelerated brain atrophy in our study cohort, though the evidence remains inconsistent [84, 85]. Few neuroimaging studies have examined sex differences in circulating testosterone, with one cross-sectional study reporting an association between higher levels of testosterone and lower cerebral amyloid burden in older women (mean age of 73 years), and a larger hippocampal volume in men (mean age of 72 years) [86]. In older men with prostate cancer, the prolonged use of androgen deprivation therapy (ADT) has been found to be cross-sectionally associated with a smaller grey matter volume [87], while a longitudinal study reports a decline in grey matter volume over 6 months of ADT [88]. Sex differences in these hormones have also been identified from brain tissue, whereby lower levels of testosterone were found in men (aged 60–79 years), and older women with AD (80 years and above), while lower levels of estrogen were identified in women with AD (aged 61–91 years), but not men (aged 60–89 years) [89].
The other findings in our study, with regards to depression, physical HRQoL, and verbal fluency, were not robust to the secondary analysis, and do not align with the limited number of studies undertaken in this area. For example, in the mixed models we found that depression was associated with a slower rate of change in brain aging, suggesting few age-related brain changes occurred over three years, but the small number of cross-sectional brain age studies, to date, have reported no association in small and larger cohorts of community dwelling adults [90–92]. Further, regarding our findings on depression, we could also not rule out the possibility of a ‘regression to the mean’, where an extremely negative, or positive baseline value is followed by a three-year estimate that is closer to the subjects mean brain-PAD [93]. Our finding of a faster rate of change in brain aging, and thus greater brain atrophy in people with better cognitive function and physical HRQoL at baseline, contradicts the well-established description of age-related declines in physical and cognitive function [94, 95]. There have been a few cross-sectional brain age studies that mostly report a statistically significant negative association with verbal fluency [26, 56]. Our prior cross-sectional analysis of verbal fluency and brain-PAD involved participants overlapping with this study and showed no association [12]. Overall, longitudinal evidence from neuroimaging studies is relatively sparse, inconsistent, and limited to regional brain volumes. Our findings are a unique contribution to the current literature, which highlight the need for further investigation.
Strengths and limitations
This study has a number of strengths. Firstly, we estimated brain age using a publicly sourced model that has been previously validated using an independent test cohort [6], and images underwent rigorous quality assessments. We assessed the test-retest reliability of this brain age algorithm over periods of 1 and 3 years, which provides strong evidence for the validity and robustness of this measure. We conducted a prospective investigation of brain age using data from a large community-based cohort of older, cognitively unimpaired participants, and thus focused on an important stage of life which is characterized by brain atrophy, and heterogeneity of aging trajectories.
Several limitations must also be considered. A high proportion of participants were white, from a higher SES percentile, and had completed 12 or more years of formal education. Participants were also generally healthy at inclusion, which limits the generalizability of these findings. In addition, dropouts between years of follow-up may have included individuals with greater brain atrophy, poor cognitive function, or physical health, which further limits these study findings. Despite the longitudinal nature of this study, our findings are limited to a three-year follow-up period. Although we observed statistical significance for some of the baseline exposures, the overall effects were small, and given the number of tests, we would expect at least one significant association by chance alone.
The moderate fit of the brain age model to predict chronological age for our study cohort was weaker than achieved in the training sample used to develop the model (n = 857, r = 0.973, MAE = 3.93 years), and the independent validation cohort (n = 611, r = 0.947, MAE = 4.90 years) [6], and may partially explain our null findings. This may relate to the narrow age range of our study sample, which is in contrast to the broad age-range used to train and validate the model (18 to 92, and 90 years, respectively), and is further supported by the difference between the mean absolute errors when adjusting for age range (0.05 and 0.07 years for the test and validation dataset vs. the 0.27 to 0.28 years identified for our study cohort). Such discrepancies may have introduced a measure of noise into our estimates, alongside true individual variability. In this regard, we cannot rule out the possibility that our select cut-off value of two-years, that was used to define participants as accelerate, decelerate and stable, may be based on measurement noise, rather than true interindividual differences.
While not a statistically significant, the weak negative correlation between brain-PAD and chronological age may point to an age bias (i.e., statistical phenomenon whereby the model underestimates brain age in older populations), that could partially explain the negative mean brain-PAD observed for our study cohort and may confound findings with other age-related exposures [37]. In attempt to overcome this limitation, we include chronological age as a covariate in all mixed models [96]. Finally, though estimates of brain age were derived from local tissue volume (i.e., grey and white matter volumes) from across the whole brain, which change with aging [3], they can provide no evidence on associations with the change in regional brain aging.
Conclusions
This was the first study to prospectively examine the association between a range of participant characteristics and the rate of change in the brain-PAD. Here we present consistent yet weak evidence that older men have faster brain atrophy than women. None of the other baseline characteristics were consistently associated with brain aging. Given the sparsity of longitudinal research on brain age in older community dwelling populations, future prospective studies are needed to confirm our findings.
Footnotes
ACKNOWLEDGMENTS
We would like to thank the participants of the Australian ASPREE and NEURO studies for volunteering their time, and to the general practitioners and medical clinics who supported participants during the trial. The authors would also like to acknowledge the hard work of all ASPREE field staff, and those at the Monash Biomedical Imaging facility.
FUNDING
ASPREE received funding from the National Institute on Aging and the National Cancer Institute at the National Institutes of Health (U01AG029824), Monash University, the Victorian Cancer Agency, and the Australian National Health and Medical Research Council (NHMRC, grant numbers 334047 and 1127060). NEURO received funding from NHMRC (1086188) and support from Monash Biomedical Imaging. Jo Wrigglesworth is the recipient of a Research Training Program stipend, awarded by Monash University and the Australian government. Ian H. Harding is supported by a NHMRC Fellowship (APP1106533). John J. McNeil receives an investigator grant funded through a NHMRC Leadership Fellowship (APP1173690). Joanne Ryan is funded by a NHMRC Dementia Research Leader Fellowship (APP1135727). Funders did not direct the conduction of this study, nor the decision to publish these findings.
CONFLICT OF INTEREST
Stephanie Ward received payment from the pharmaceutical industry company Roche Holdings AG to attend an advisory meeting on Alzheimer’s disease. All other authors declare no competing interests.