
Abstract
Background:
The present systematic review and meta-analysis of diagnostic test accuracy summarizes the last three decades in advances on diagnosis of Alzheimer’s disease (AD) in developed and developing countries.
Objective:
To determine the accuracy of biomarkers in diagnostic tools in AD, for example, cerebrospinal fluid, positron emission tomography (PET), and magnetic resonance imaging (MRI), etc.
Methods:
The authors searched PubMed for published studies from 1990 to April 2020 on AD diagnostic biomarkers. 84 published studies were pooled and analyzed in this meta-analysis and diagnostic accuracy was compared by summary receiver operating characteristic statistics.
Results:
Overall, 84 studies met the criteria and were included in a meta-analysis. For EEG, the sensitivity ranged from 67 to 98%, with a median of 80%, 95% CI [75, 91], tau-PET diagnosis sensitivity ranged from 76 to 97%, with a median of 94%, 95% CI [76, 97]; and MRI sensitivity ranged from 41 to 99%, with a median of 84%, 95% CI [81, 87]. Our results showed that tau-PET diagnosis had higher performance as compared to other diagnostic methods in this meta-analysis.
Conclusion:
Our findings showed an important discrepancy in diagnostic data for AD between developed and developing countries, which can impact global prevalence estimation and management of AD. Also, our analysis found a better performance for the tau-PET diagnostic over other methods to diagnose AD patients, but the expense of tau-PET scan seems to be the limiting factor in the diagnosis of AD in developing countries such as those found in Asia, Africa, and Latin America.
INTRODUCTION
Alzheimer’s disease (AD) is chronic neurodegenerative disease and the most common cause of dementia. AD is characterized by disturbance of multiple brain functions, including memory, thinking, orientation, calculation, learning capacity, and judgement. The cognitive impairments are accompanied by deterioration in emotional control, social behavior, and motivation [1, 2].
AD is a global disease with differential impact on countries in the world. There are over 9.9 million new cases of dementia each year worldwide, implying one new case every 3.2 seconds [3]. AD is the sixth leading cause of death in the United States (US) [1, 4] and its numbers and proportions will increase rapidly in coming years, as the population of Americans at age 65 and older is projected to grow from 56 million in 2020 to 88 million by 2050 [5]. The risk factors for AD include age, race, and ethnicity and the prevalence of AD was higher in women (12.2%) as compared with men (8.6%) worldwide [3]. Racially, Asians and Pacific Islanders had the lowest prevalence rate of AD (8.4%), then American Indian and Alaska Natives (9.1%), non-Hispanic whites (10.3%), population with mixed races (11.5%), Hispanics (12.2%), and blacks (13.8%) (percentage includes both men and women) [6, 7].
Developing countries have a considerable contribution in the increase of new AD cases as currently 58% of people with dementia has been reported in low and middle income countries (per capita income), and by 2050 it is estimated to rise by 68%. One of the reasons could be that developing countries have the fastest elderly growing population which is suffering from dementia; for example, new AD cases in China, India, South Asia, Western Pacific, and Latin American countries have emerged [3]. Developing countries have fewer resources to address the mental health issues and lack funding agencies to develop research studies which are the major challenge that public health systems have to battle in the management of AD patients.
The new diagnostic technologies developed for AD are managed and accessible in developed countries; however, because of poor economic growth, developing countries have poor diagnostic tools and lack epidemiological, clinical studies on AD. These factors are the major problems in diagnosis and estimation of prevalence rates in low-income countries (per capita income) especially in Latin America, Asia, and Africa [8]. The budget allotted for epidemiological clinical studies for AD in developed nations is based on their economic growth, per capita income levels, which will impact on the development of global health policies, clinical and pre-clinical research studies, and the management of neurodegenerative diseases in these nations.
In contrast, the developed countries like the US and Canada have a stable economy and have established funding agencies and research organizations that provide funding for research and conducts epidemiological, clinical, and pre-clinical studies on mental health diseases like AD. It is estimated that AD is one of the most financially costly diseases and managed by federal government funding agencies in developed nations [9]. The total estimated worldwide cost of dementia was US$ 818 billion in 2015, which represents 1.09% of global GDP and by 2018, the global cost of dementia raises above US$ 1 trillion. Due to slow economic growth and financial instability in developing countries (e.g., Latin American, African, and Asian countries), management of AD is not well addressed by their governments [10].
AD prevalence increases in elderly individuals (range-70–85 years), who represent the greatest burden of the disease over 43% for blacks and 40% for Hispanics. The eight epidemiological studies were conducted in Latin America between 1997–2007, to analyze AD prevalence rates in six countries (Brazil, Chile, Cuba, Peru, Uruguay, and Venezuela). It was estimated that global prevalence of dementia was 7.1% of individuals over 65 years of age in Latin America. However, there is a significant variation in the estimation of prevalence rates among these studies; for example, one of the studies carried out in Brazil estimated the frequency of dementia was 2% and another study carried out in Venezuelan estimated 13%, which is significantly different from global prevalence of AD in Latin America [11]. These differences are often attributed to the different diagnostic criteria for dementia (e.g., Diagnostic and Statistical Manual of Mental Disorders (DSM-IV), Clinical Dementia Rating Scale, etc.) used for the types of sampling and assessment. Another study conducted in Latin America, the 10/66 Dementia Research Group protocol, estimates the prevalence of dementia in the population of 65 years, in Venezuela is 6.2%, Mexico is 7.3%, Dominican Republic is 9.8%, and 12.6% for Cuba [12] which had less difference in prevalence rates. Thus, the lack of same screening tests for diagnosis of AD and identical protocols for conducting the epidemiological studies contributes to significant variation in population studies in AD in developing countries.
The clinical diagnosis of AD is based on criteria established by the National Institute of Neurological and Communicative Disorders and Stroke and the Alzheimer’s Disease and Related Disorders Association (NINCDS-ADRDA) [13], although low diagnostic specificity has been related to other dementias [14]. Recent studies have suggested that AD begins decades before the onset of clinical symptoms of dementia through the accumulation of pathological hallmarks of the disease consisting of amyloid-β (Aβ) deposits and neurofibrillary tangles (NFTs)/tau proteins [15–17].
Biomarkers are defined as objective measures of a biological or a pathogenic process that can be used to evaluate disease risk or prognosis, to guide clinical diagnosis, or to monitor therapeutic interventions [18]. NFTs are the first neuropathological hallmarks to appear in AD but amyloid deposition in the brain seems to have a closer link to AD-related pathophysiology and may be a better disease marker though it has rapidly increasing prevalence with age on both positron emission tomography (PET) and neuropathology. For AD biomarker analysis, tau-PET and amyloid-PET analysis is more relevant for non-invasive diagnosis. Cerebrospinal fluid (CSF) analysis is based on quantitative analysis of proteins and is an invasive technique. Recently, AD diagnostic biomarkers were grouped into three categories: Aβ deposits, hyperphosphorylated tau aggregates, and neurodegeneration or neuronal injury [19]. Since CSF is in direct contact with the extracellular space of the brain and has many proteins secreted in it, it is considered to be an optimal source for the assessment of AD biomarkers profile [20]. While magnetic resonance imaging (MRI) and PET are considered as imaging biomarkers of neuronal injury [21]. In the past decades, electroencephalography (EEG) analyses, with spectral and non-linear measures, have provided new insights into the understanding of physiological dynamics, including the brain alterations due to AD. Nevertheless, the gold standard for AD [22] diagnosis continues to be the histological examination of brain tissue in postmortem biopsy [23].
The overall goal of this review is to understand and highlight the major gaps in epidemiological studies of AD in developed and developing countries. Also, we investigated the best diagnostic biomarkers for AD diagnosis which contributes to estimations of prevalence rates in developed and developing nations. We performed a systematic review of the medical literature for three decades (1990–2020) and results were analyzed by meta-analysis based on the diagnostic biomarkers employed in AD diagnosis in developed and developing countries. The diagnostic biomarkers analyzed were CSF, amyloid-PET, tau-PET, EEG, and MRI. In this study we have highlighted the lack of diagnostic biomarkers AD studies from developing countries which is due to poor diagnostic infrastructure (PET, MRI scanning machines) in medical and research organizations. This will help to identify the basic need to fund the research organization for the screening of AD patients in developing countries. Thus, we hope that our findings will motivate developed and developing countries to invest and fund research studies on innovative technologies and developing new biomarkers for AD, and, hence, improve the diagnosis and accuracy of prevalence of AD that will aid in management of patients with AD.
METHODS
Search strategy and eligibility criteria
The bibliographic extraction was performed from the National Center for Biotechnology Information (NCBI) databases. PubMed is a free resource database and comprises over 28 million bibliographic records for biomedical literature from MEDLINE, and other life science journals (https://www.ncbi.nlm.nih.gov/pubmed/). PubMed provides a uniform indexing of biomedical literature, the Medical Subject Headings (MeSH terms), which form a controlled vocabulary or specific set of terms that describe the topic of a paper in a consistent and uniform manner [24]. While author keywords are particularly useful, the choice of terms can vary from paper to paper and from author to author. For this, MeSH terms were employed in the string query to improve the accuracy of the search.
The search string was performed separately for each diagnostic biomarker as follows: “Alzheimer Disease” [MeSH Terms] AND “Sensitivity and Specificity” [MeSH Terms] AND “Cerebrospinal Fluid” [MeSH Terms] for CSF; “Alzheimer Disease” [MeSH Terms] AND “Sensitivity and Specificity” [MeSH Terms] AND “Positron-emission Tomography” [MeSH Terms] AND “Amyloid” [MeSH Terms] for Amyloid-PET; “Alzheimer Disease” [MeSH Terms] AND “Sensitivity and Specificity” [MeSH Terms] AND “Positron-emission Tomography” [MeSH Terms] AND “tau Proteins” [MeSH Terms] for tau-PET; “Alzheimer Disease” [MeSH Terms] AND “Sensitivity and Specificity” [MeSH Terms] AND “Magnetic Resonance Imaging” [MeSH Terms] for MRI; and “Alzheimer Disease” [MeSH Terms] AND “Sensitivity and Specificity” [MeSH Terms] AND “Electroencephalography” [MeSH Terms] for EEG. The co-occurrence network map of MeSH terms from the biomarkers datasets was created using the VOSviewer server (Version 1.6.15) [25].
The selection of the studies was performed in three steps. Firstly, duplicated articles, non-full English articles, reviews, and meta-analysis were excluded. Secondly, titles and abstracts of the selected studies through the search strategy were analyzed, and finally, full papers were retrieved for all potentially relevant studies and for those for which the title or abstract did not provide enough information to clearly decide whether or not it should be included. From the final set of included studies, data regarding geographical distribution, number studies conducted by country, and frequency of the diagnostic tools used was also extracted.
Data extraction and meta-analysis of diagnostic test accuracy
Since diagnostic accuracy of a test is generally measured by a pair of summary points, namely, sensitivity and specificity [26], information regarding sensitivity and specificity data were manually extracted from the selected studies. Also, data regarding the number of AD patients and healthy controls were retrieved. Studies with unclear or missing data regarding the AD and healthy control groups or data describing the sensitivity and specificity obtained in the studies were excluded from further analysis.
The data obtained from the selected studies was analyzed with R “mada” package (Version 0.5.9) [27] which is a tool for the meta-analysis of diagnostic accuracy. For this, the numbers of true positives (TP), false positives (FP), true negatives (TN), and false negatives (FN) were calculated and entered in to “mada”. The data from studies regarding each diagnostic biomarker were analyzed separately and the diagnostic performance was assessed by calculation of the sensitivity (Se) and specificity (Sp). Also, accuracy statistics like: the Positive Likelihood ratio (LR+), which is the ratio of the probability of a positive test result among those with disease to that of a positive test result among those without disease; the Negative Likelihood ratio (LR-), which is the ratio of the probability of a negative test result among those with disease to that of a negative test result among those without disease; and the Diagnostic Odds ratio (DOR), which is the ratio of the OR for a positive test result among persons with disease to that among persons without disease; and their 95% confidence interval (CI) were calculated.
The diagnostic accuracy of the biomarkers was compared by summary receiver operating characteristic (sROC) curve statistics. The R “mada” package reitsma model, estimates the sROC curve using the bivariate model by default [28]. The confidence level for all calculations was set to 95%.
RESULTS
Search strategy results
In this study, a workflow for a systematic review of literature and meta-analysis of diagnostic accuracy of biomarkers employed for AD in developed and developing countries is shown (Fig. 1). The bibliographic search was performed in the PubMed database and resulted in a total of 1,376 articles selected, whereas the number of studies selected for CSF, amyloid-PET, tau-PET, MRI, and EEG was 20, 147, 51, 1,017, and 141, respectively (Fig. 2). Regarding the distribution among the time frame of the selected studies, a 30 years span of time was covered (2020-1990), whereas no articles published in 2020 were found (Fig. 2). In this sense, MeSH terms provide a powerful tool to overcome variability in language and broaden or narrow results; however, a search using only MeSH terms cannot yield results that include newly published articles.
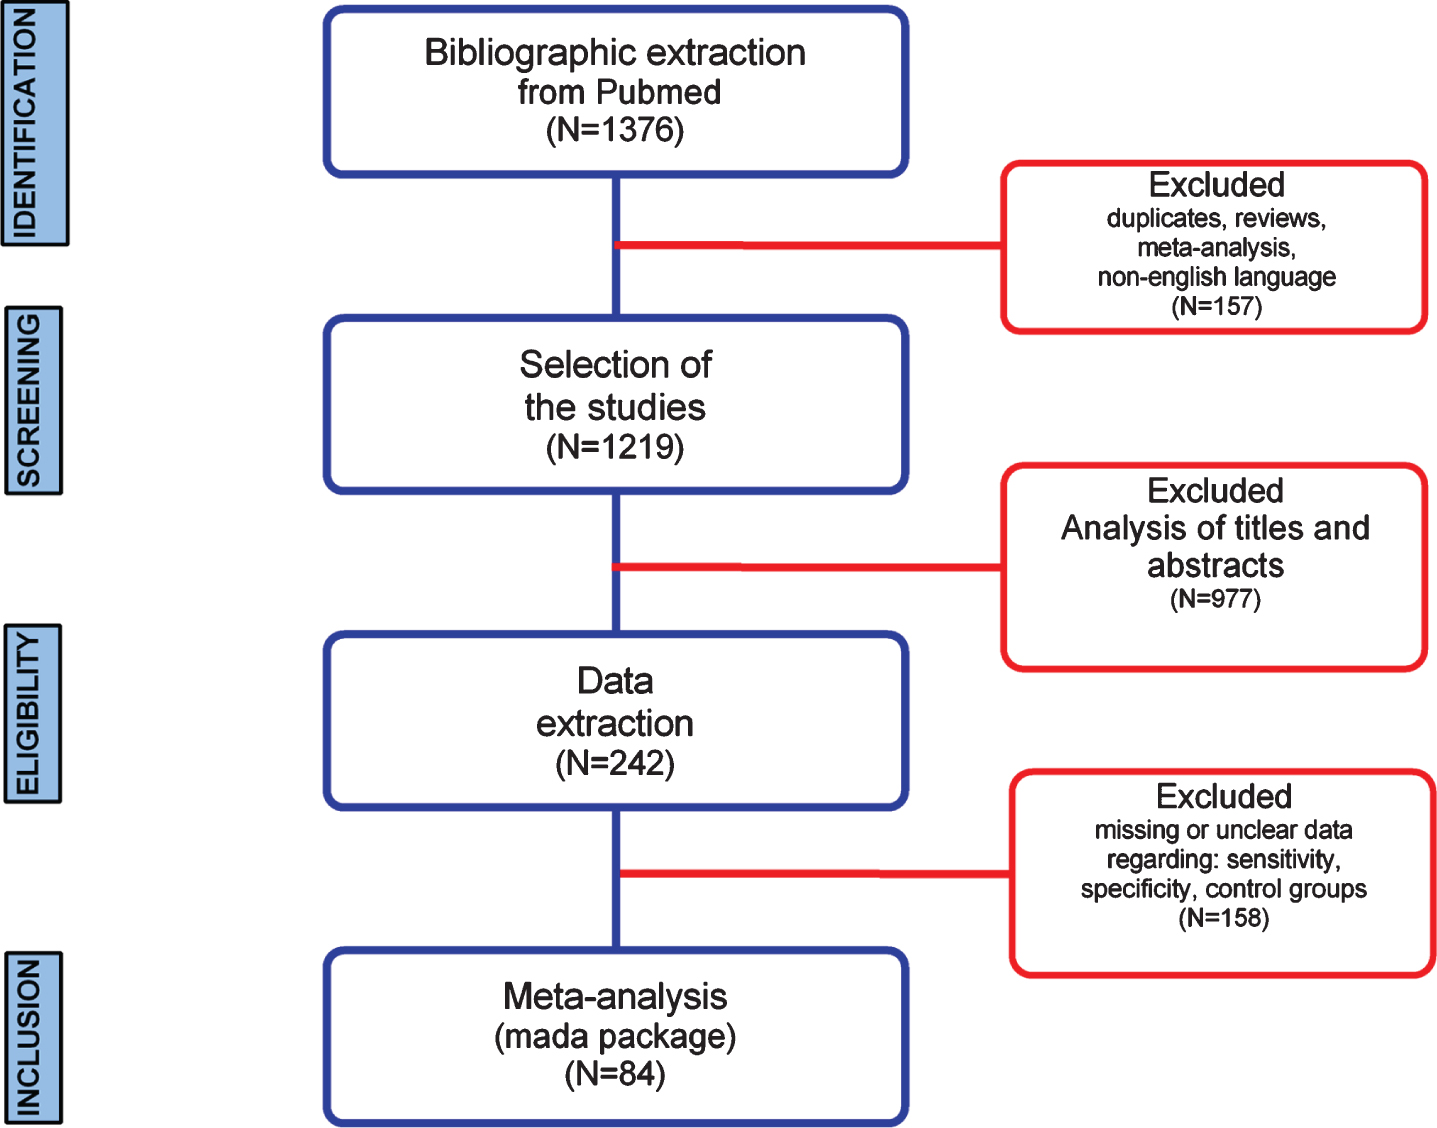
Systematic review and meta-analysis workflow diagram.
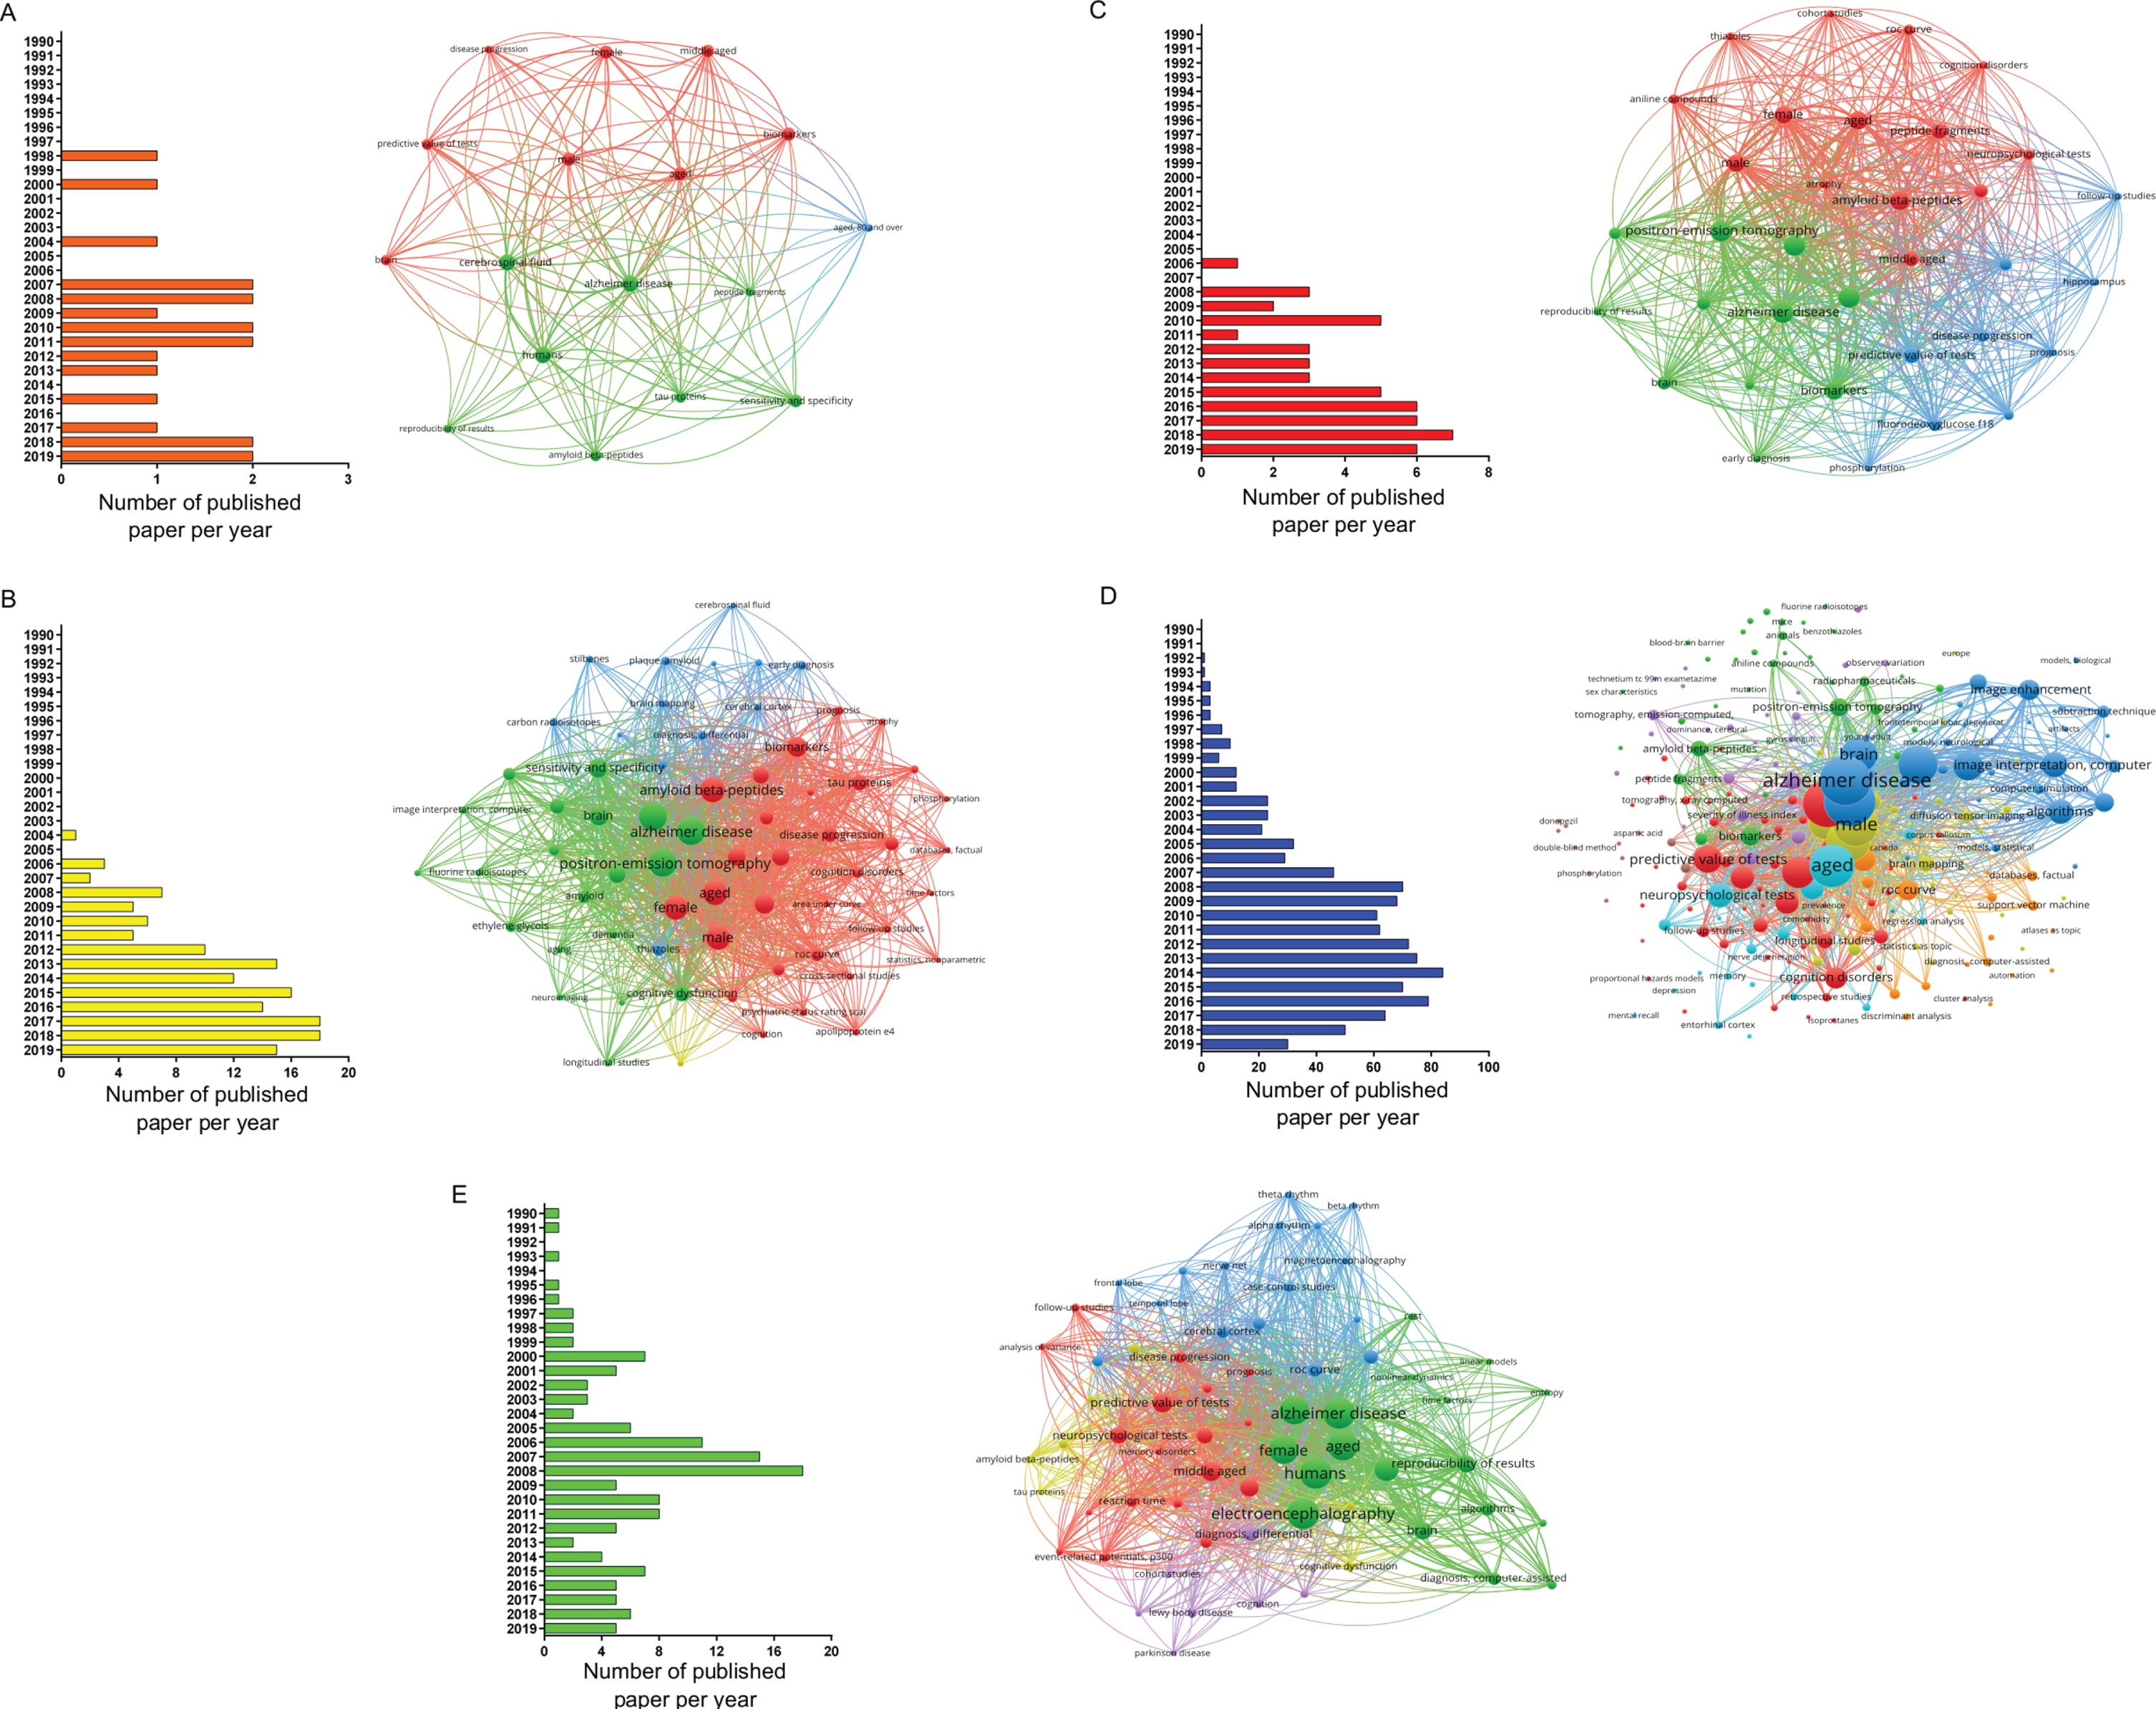
Papers selected for the different biomarkers using MeSH terms in PubMed database (from 1990 to 2019). Distribution per year of all articles found in the search and bibliometric map created by VOSviewer based on MeSH terms co-occurrence for: A) CSF, B) amyloid-PET, C) tau-PET, D) MRI, and E) EEG biomarkers.
When conducting a co-occurrences analysis of MeSH keywords, by setting the minimum number of occurrences of a keyword to five, the number of keywords that meet the threshold were 17, 65, 34, 219, and 66 for CSF, amyloid-PET, tau-PET, MRI, and EEG, respectively. When examining each network in more detail, it was possible to notice, that terms, such as brain, aged, male, female, and predictive value of tests, were common denominators (Fig. 2).
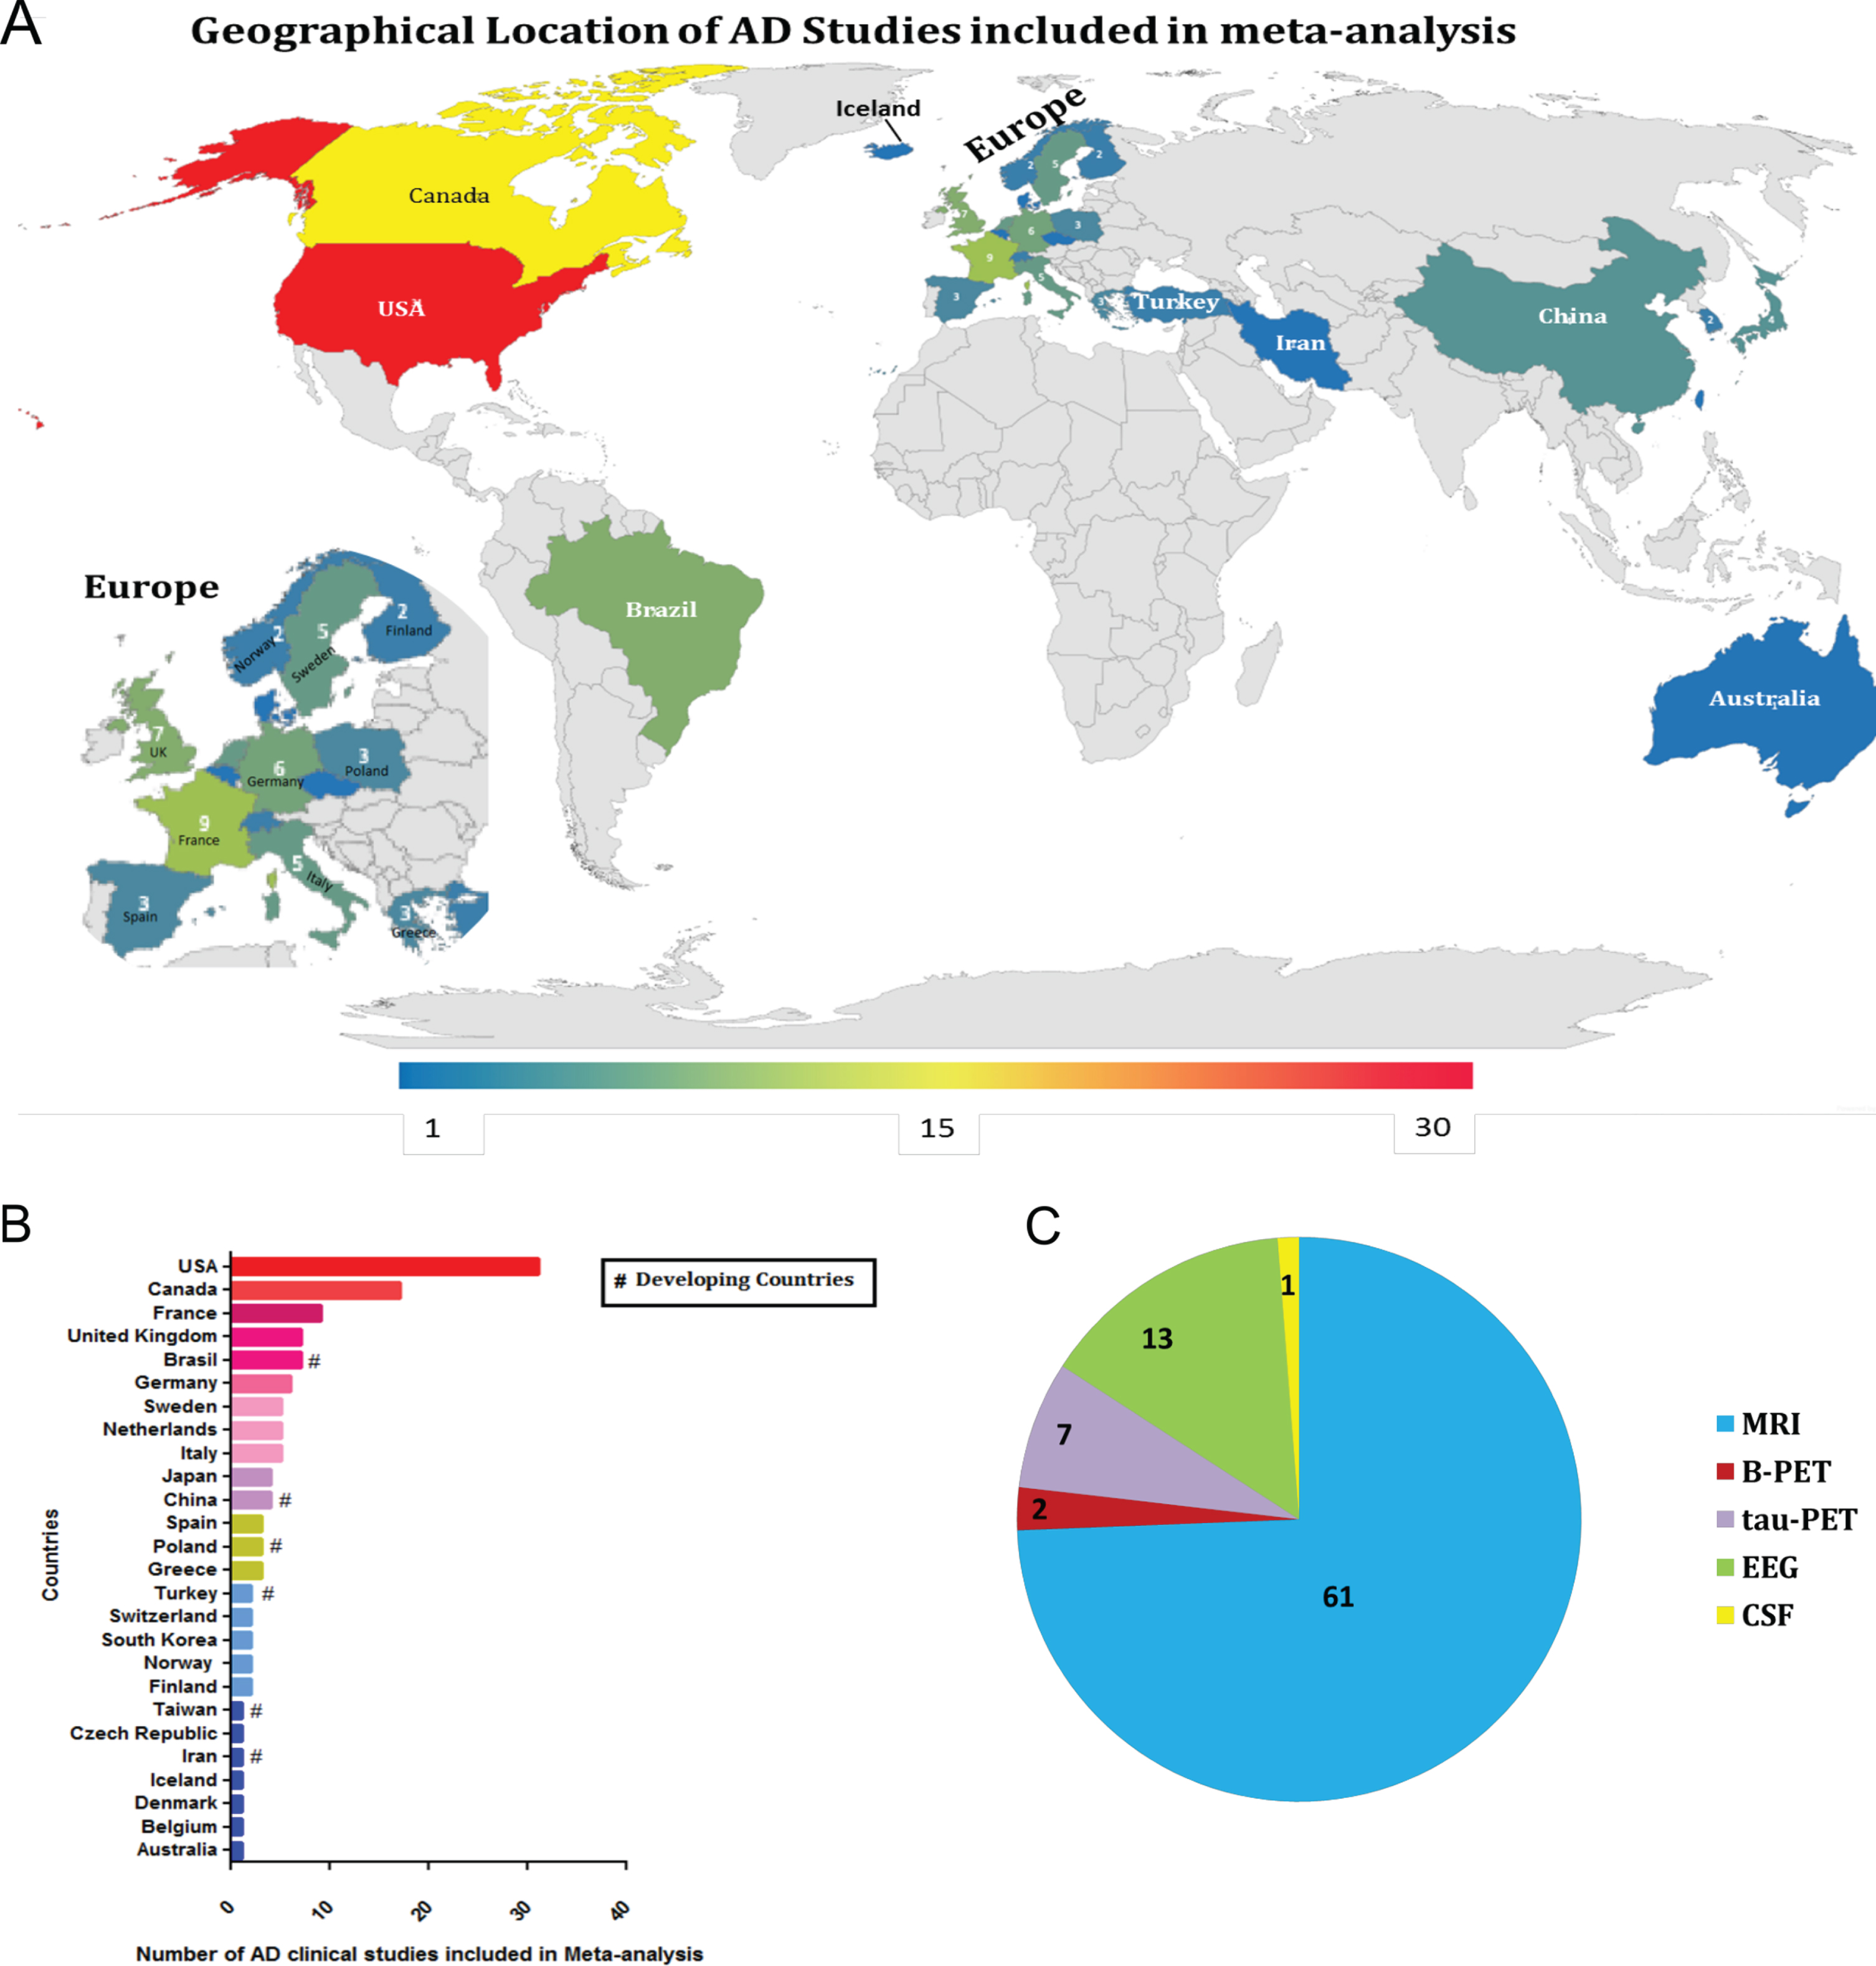
Furthermore, a three-step eligibility criteria were employed to analyze 1,376 studies, and 1,134 articles were excluded in this step. In the data extraction step, 158 articles were excluded. Thus 84 articles were selected for meta-analysis. Also, data regarding geographical features extracted from the 84 studies selected were analyzed (Fig. 3); among 25 countries in which the studies were performed, only six are considered developing countries (Fig. 2A, B); while in most of the studies, the biomarker studied was the MRI (Fig. 2C).
Diagnostic biomarkers of Alzheimer's disease
CSF and amyloid-PET biomarkers
Surprisingly, one study regarding CSF for AD diagnostic biomarker was selected [29] and two studies for amyloid-PET was found to be eligible by standards applied in the workflow [30, 31]. Thereby no analysis has been performed regarding these two diagnostic biomarkers.
Electroencephalography
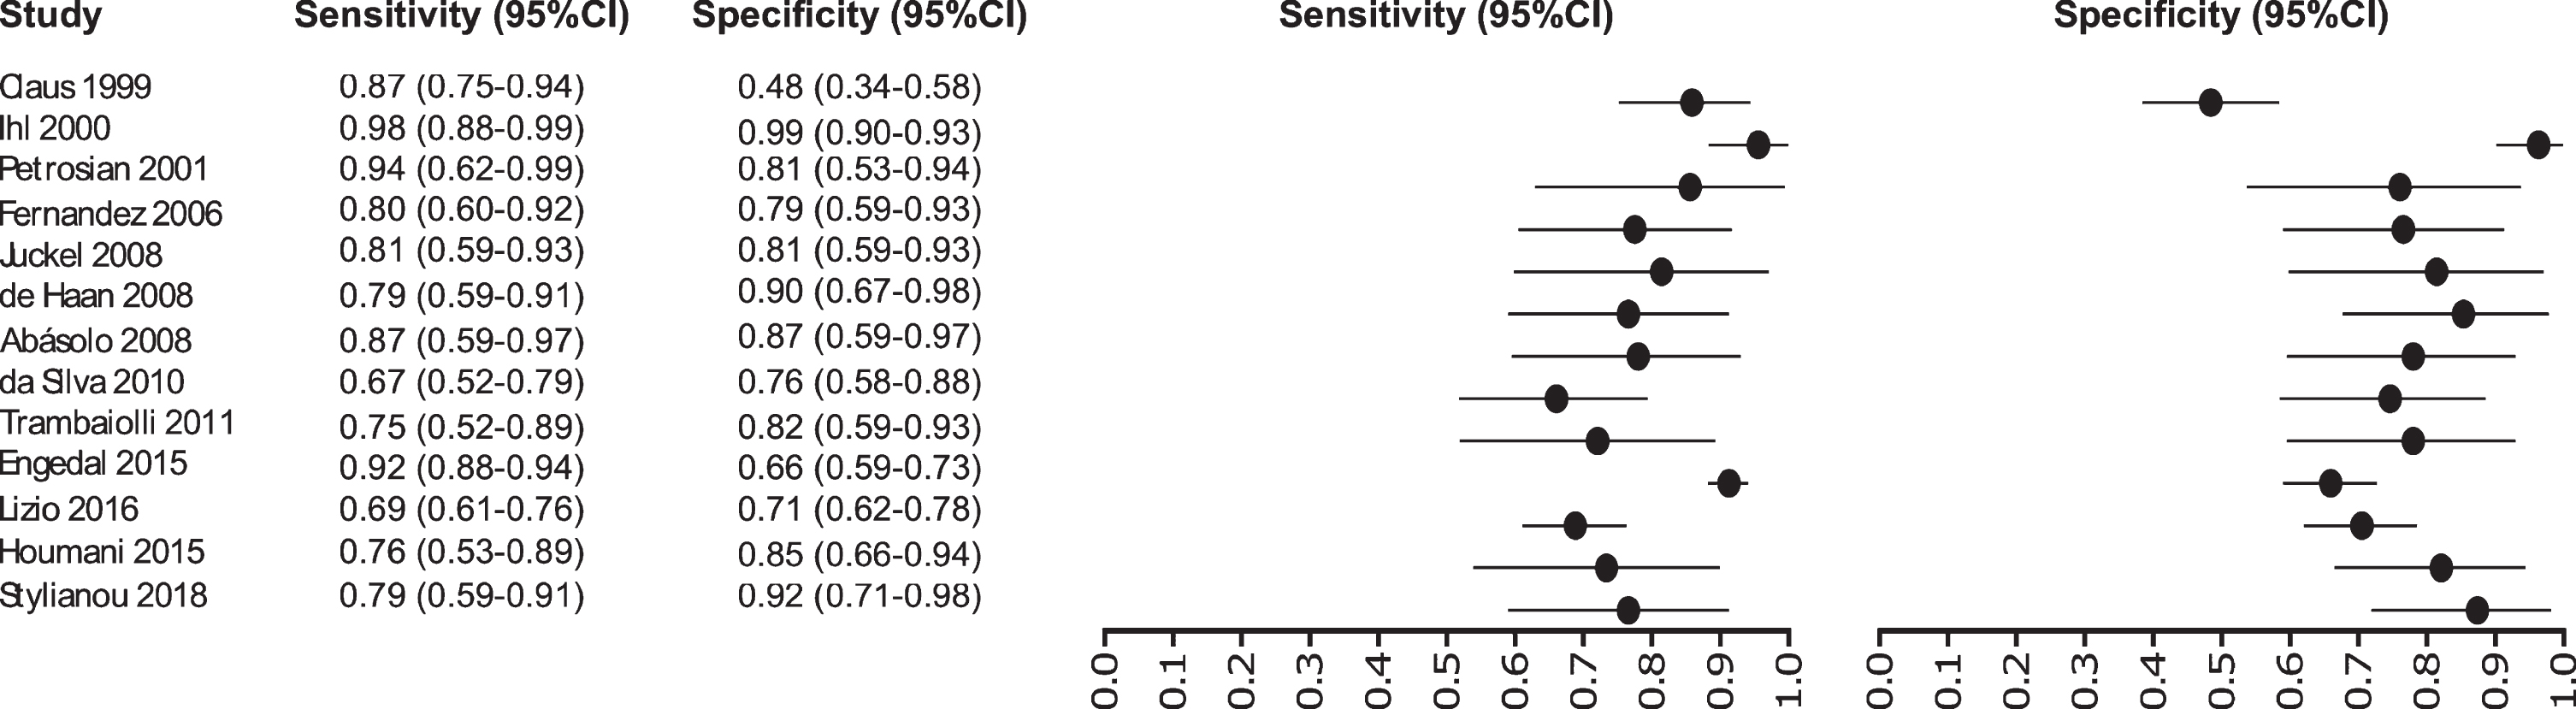
Thirteen studies were selected for EEG: [32–44] in which a total of 1,387 subjects were studied. The sensitivity was ranged from 98 to 67%, with a median of 80%, 95% CI (91, 75), while the test for equality of sensitivities presented a χ2 = 62.1255, df = 13, p-value = 2.18e-08. The specificity on the studies ranged from 98 to 48%, with a median of 94%, 95% CI (97, 76); the test for equality of specificities showed χ2 = 58.2504, df = 13, p-value = 1.08e-07. A negative correlation between sensitivities and false positive rates is shown r = –0.100, 95% CI (–0.599, 0.454). Also, the results regarding LR+{median 4.25, 95% CI (8.48, 2.71}, LR- {median 0.23, 95% CI (0.42, 0.12)}, and DOR {median 19.24, 95% CI (49.00, 6.73)} are shown. The diagnostics performance analyzed is summarized in Fig. 4 and Supplementary Table 1.
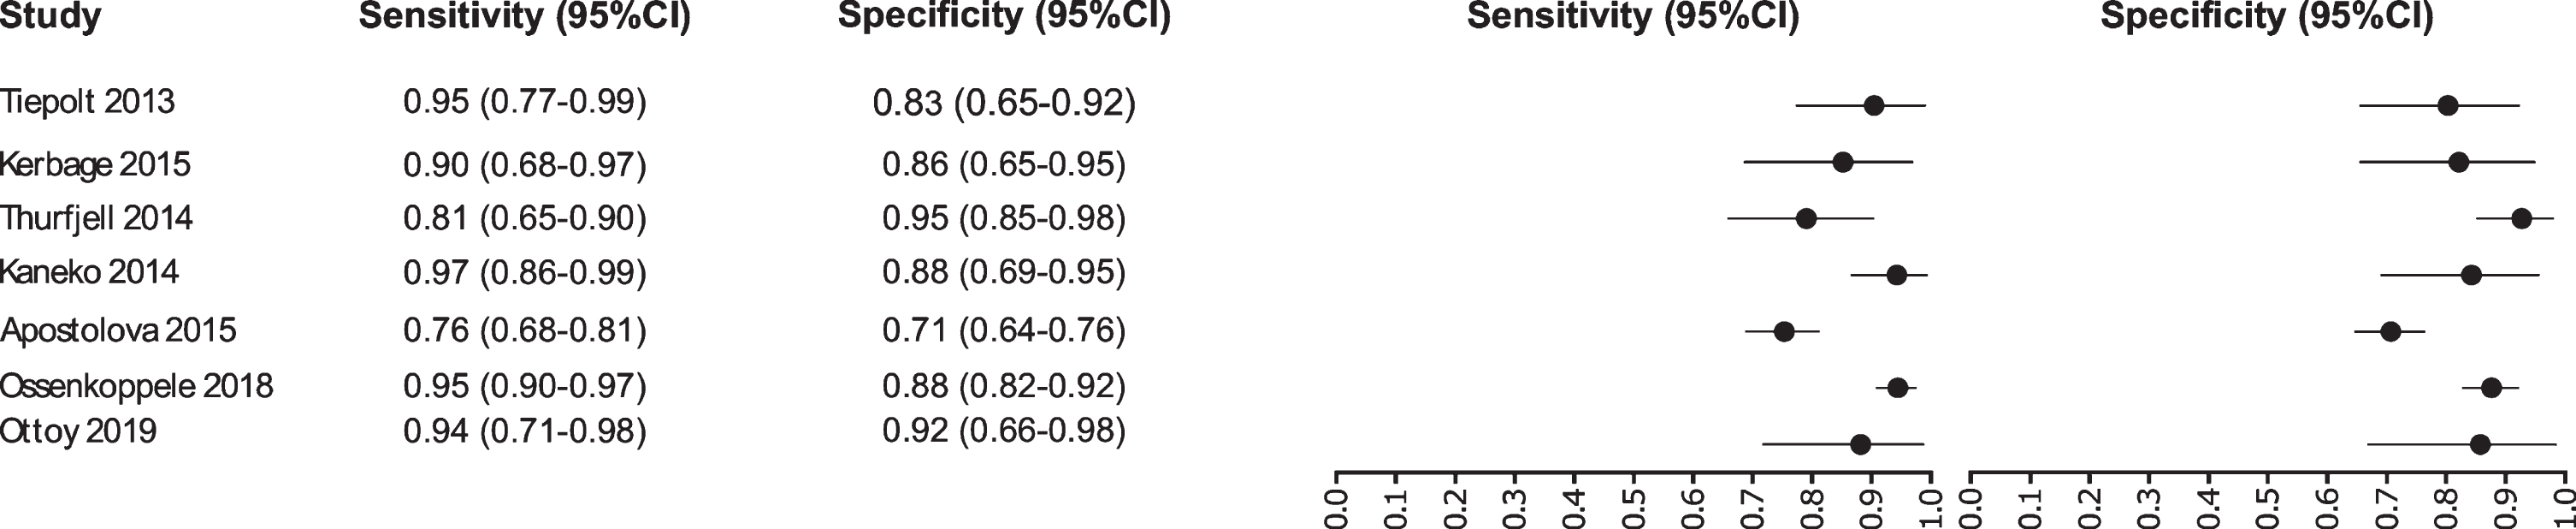
Study data and paired forest plot of the sensitivity and specificity of tau-PET in Alzheimer’s disease diagnosis. Data from each study are summarized. Sensitivity and specificity are reported with a mean (95% confidence limits). Forest plot depicts the estimated sensitivity and specificity (black circles) and its 95% confidence limits (horizontal black line).
Tau-PET biomarker
Our analysis selected seven studies for the tau-PET biomarker: [45–51]. A total of 1,012 subjects were studied. The sensitivity was ranged from 97 to 76%, with a median of 94%, 95% CI (97, 76); while the test for equality of sensitivities showed: χ2 = 36.5719, df = 6, p-value = 2.13e-06. The specificity on the studies ranged from 95 to 71%, with a median of 88%, 95% CI (95, 71); while the test for equality of specificities presented χ2 = 29.7706, df = 6, p-value = 4.35e-05. The correlation between sensitivities and false positive rates was analyzed a negative result is shown r = –0.448, 95% CI (0.898, –0.460). Also, the results regarding LR+{median 7.79, 95% CI (14.87, 2.6)}, LR- {median 0.07, 95% CI (0.35, 0.03)}, and DOR {median 96, 95% CI (259, 7.53)} are shown. The diagnostic performances analyzed are summarized in Fig. 5 and Supplementary Table 2.
Study data and paired forest plot of the sensitivity and specificity of EEG in Alzheimer’s disease diagnosis. Data from each study are summarized. Sensitivity and specificity are reported with a mean (95% confidence limits). Forest plot depicts the estimated sensitivity and specificity (black circles) and its 95% confidence limits (horizontal black line).
MRI biomarker
Initially our analysis identified 1,017 published studies that used MRI as a diagnostic biomarker. After the analysis, only 61 studies were selected [52–112]. A total of 8,072 subjects were studied. The sensitivity on the studies ranged from 99 to 41%, with a median of 84%, 95% CI (87, 81). The analysis of the test for equality of sensitivities showed: χ2 = 326.3558, df = 61, p-value = <2e-16. The specificity on the studies ranged from 99 to 59%, with a median of 84%, 95% CI (90, 80); while the test for equality of specificities: χ2 = 332.8035, df = 61, p-value = <2e-16. Also, a negative correlation between sensitivities and false positive rates is shown r = –0.096, 95% CI (–0.338, 0.158). Also, the results regarding LR+{median 5.29, 95% CI (7.78, 4.22)}, LR- {median 0.19, 95% CI (0.23, 0.14)}, and DOR {median 32.16, 95% CI (67.13, 22.41)} are shown. The diagnostic performance of the selected studies is summarized in Figs. 6–8 and Supplementary Table 3.
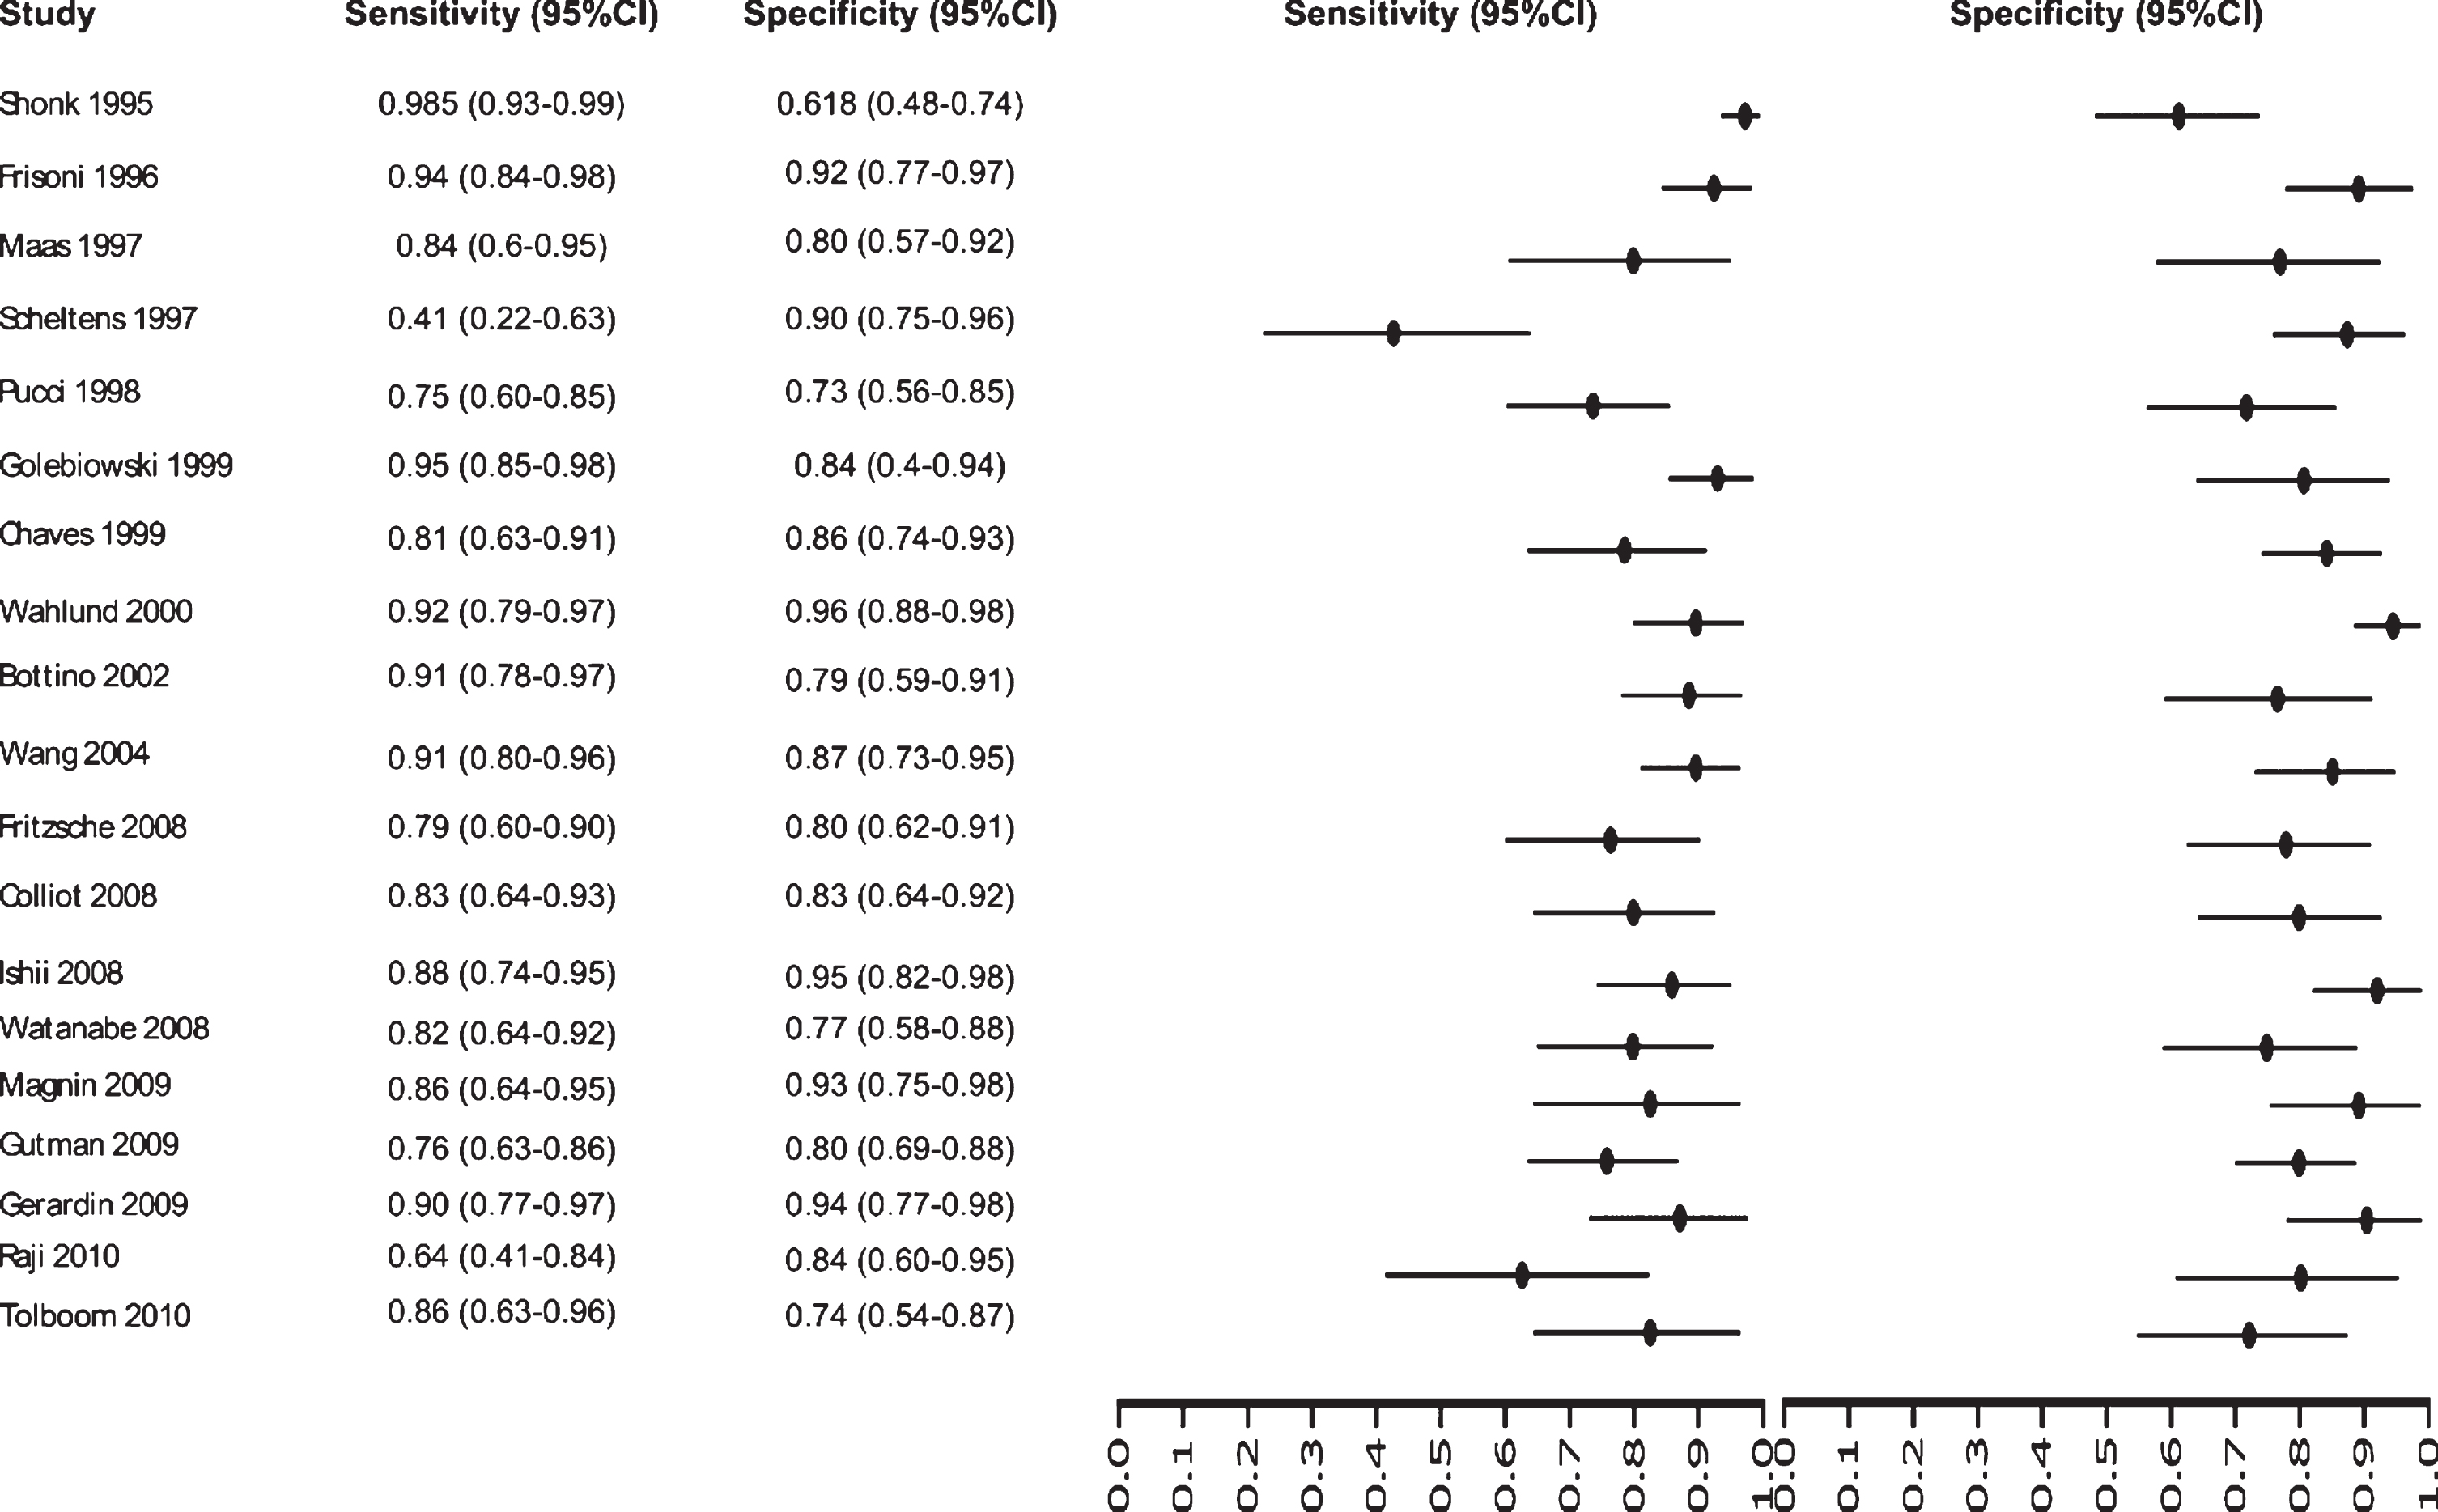
Study data and paired forest plot of the sensitivity and specificity of MRI in Alzheimer’s disease diagnosis (from 1995 to 2010). Data from each study are summarized. Sensitivity and specificity are reported with a mean (95% confidence limits). Forest plot depicts the estimated sensitivity and specificity (black circles) and its 95% confidence limits (horizontal black line).
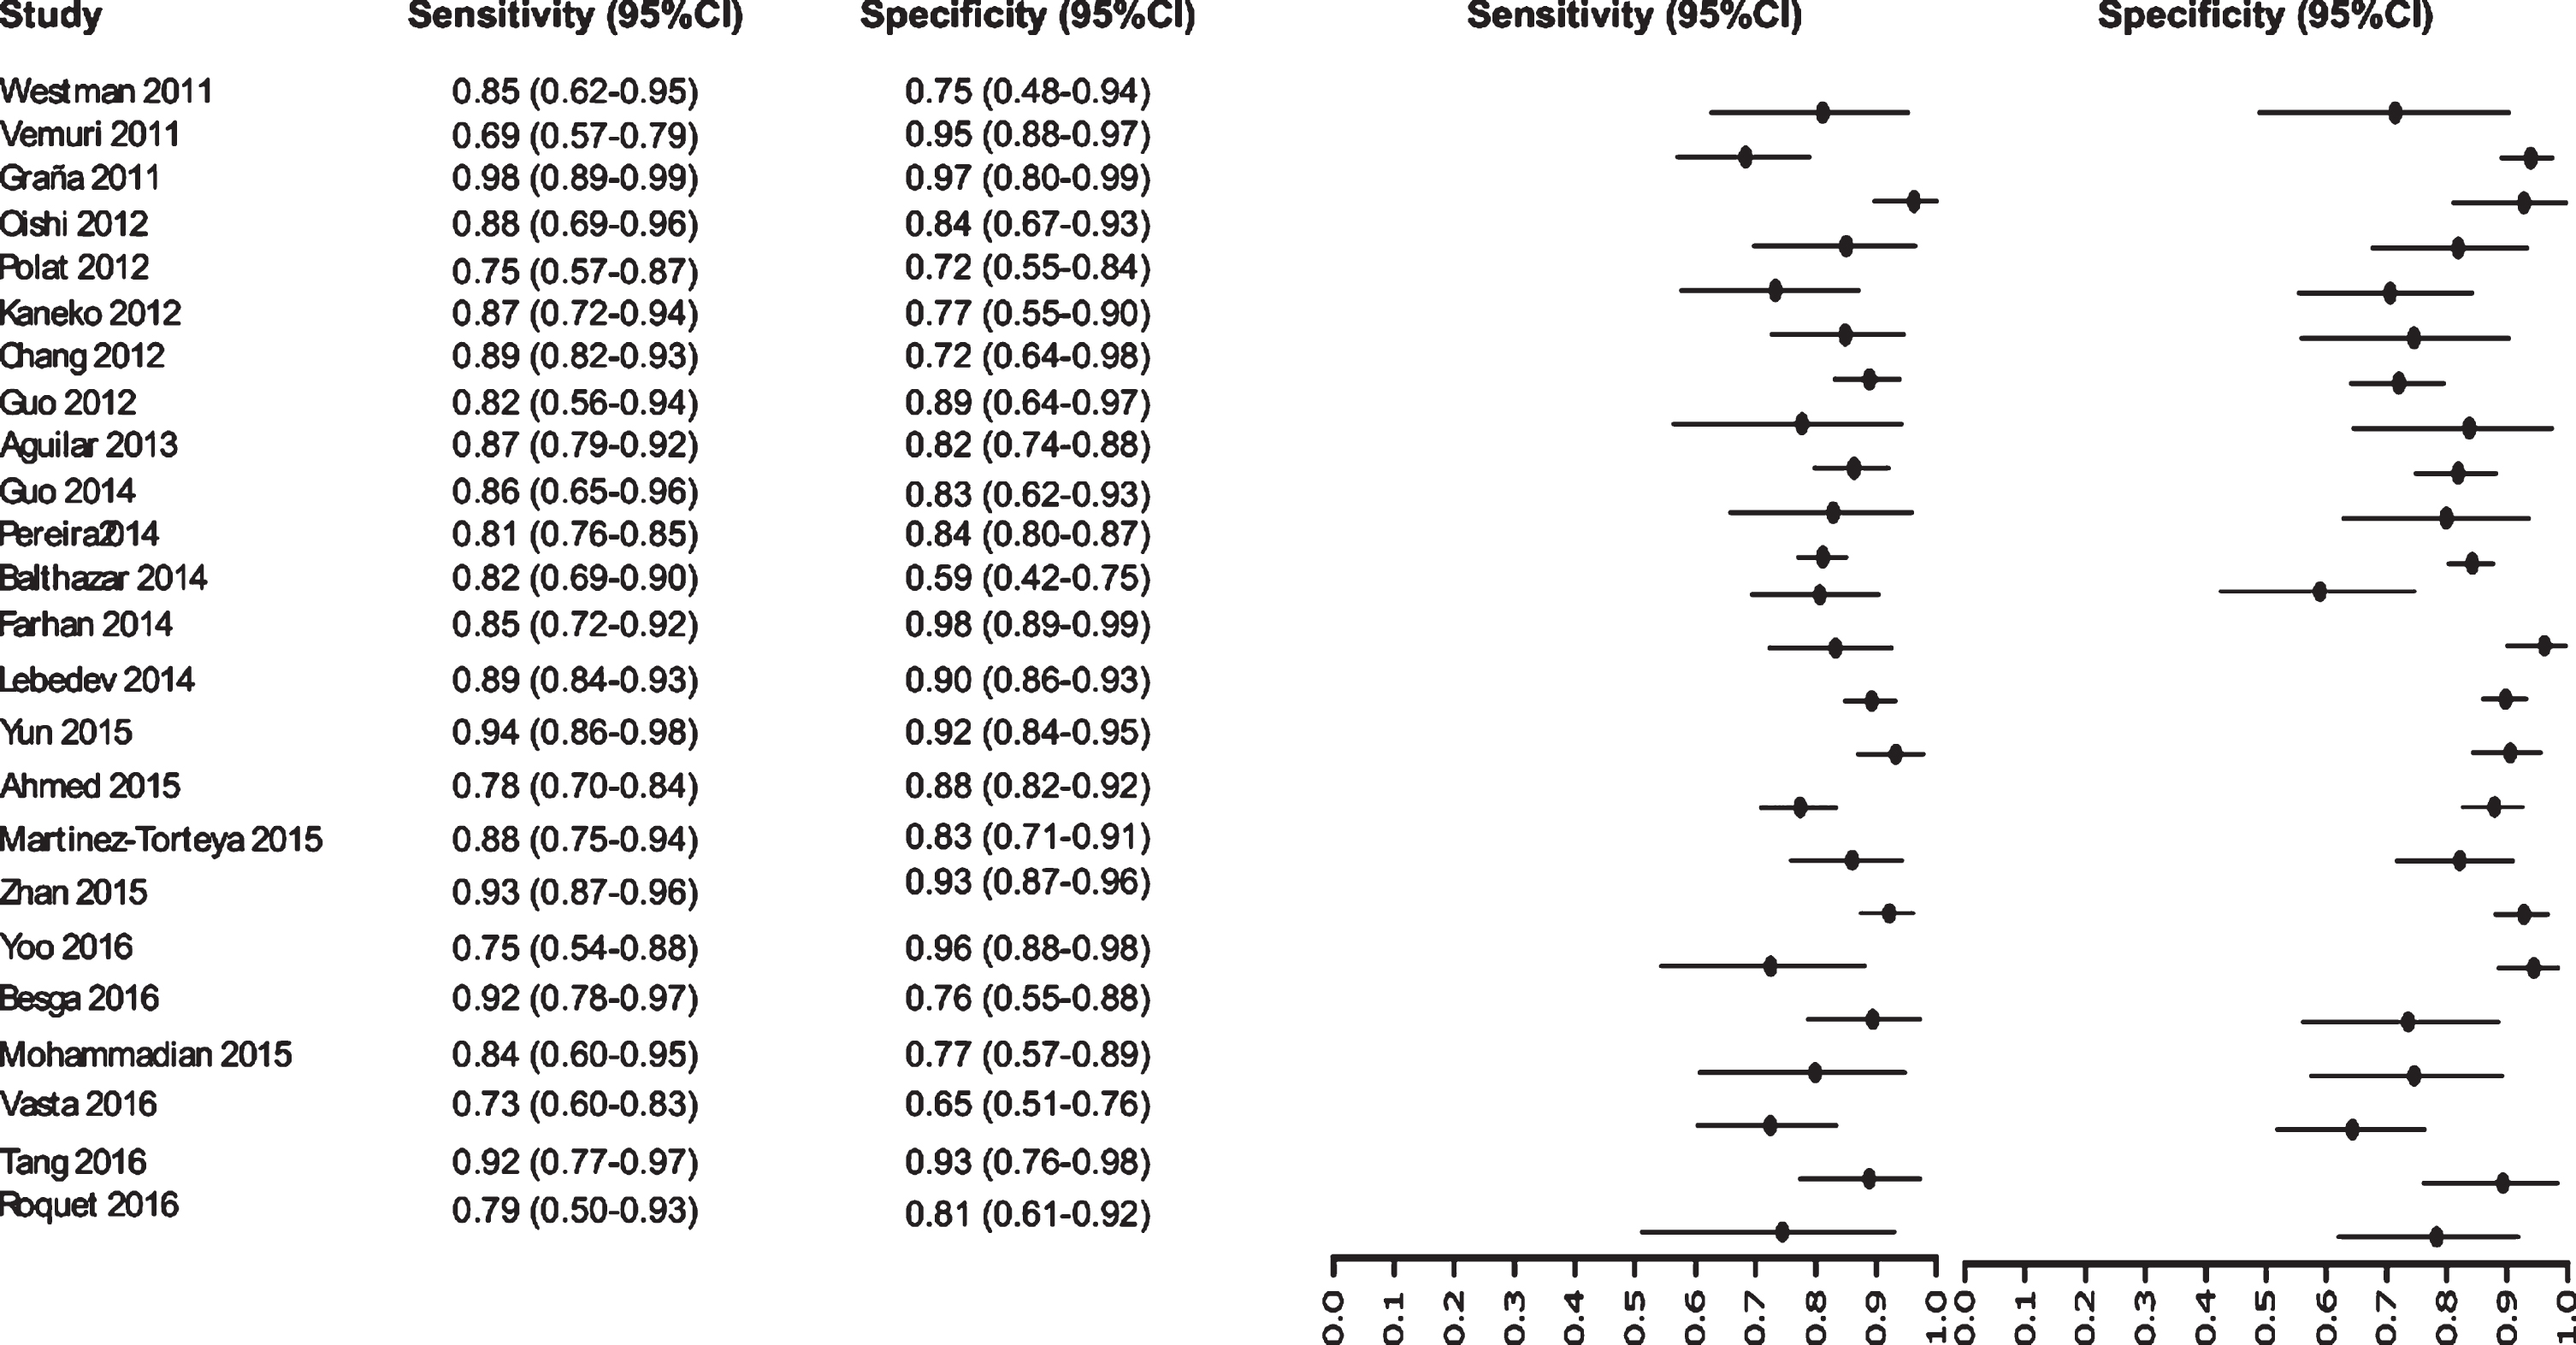
Study data and paired forest plot of the sensitivity and specificity of MRI in Alzheimer’s disease diagnosis (from 2011 to 2016). Data from each study are summarized. Sensitivity and specificity are reported with a mean (95% confidence limits). Forest plot depicts the estimated sensitivity and specificity (black circles) and its 95% confidence limits (horizontal black line).
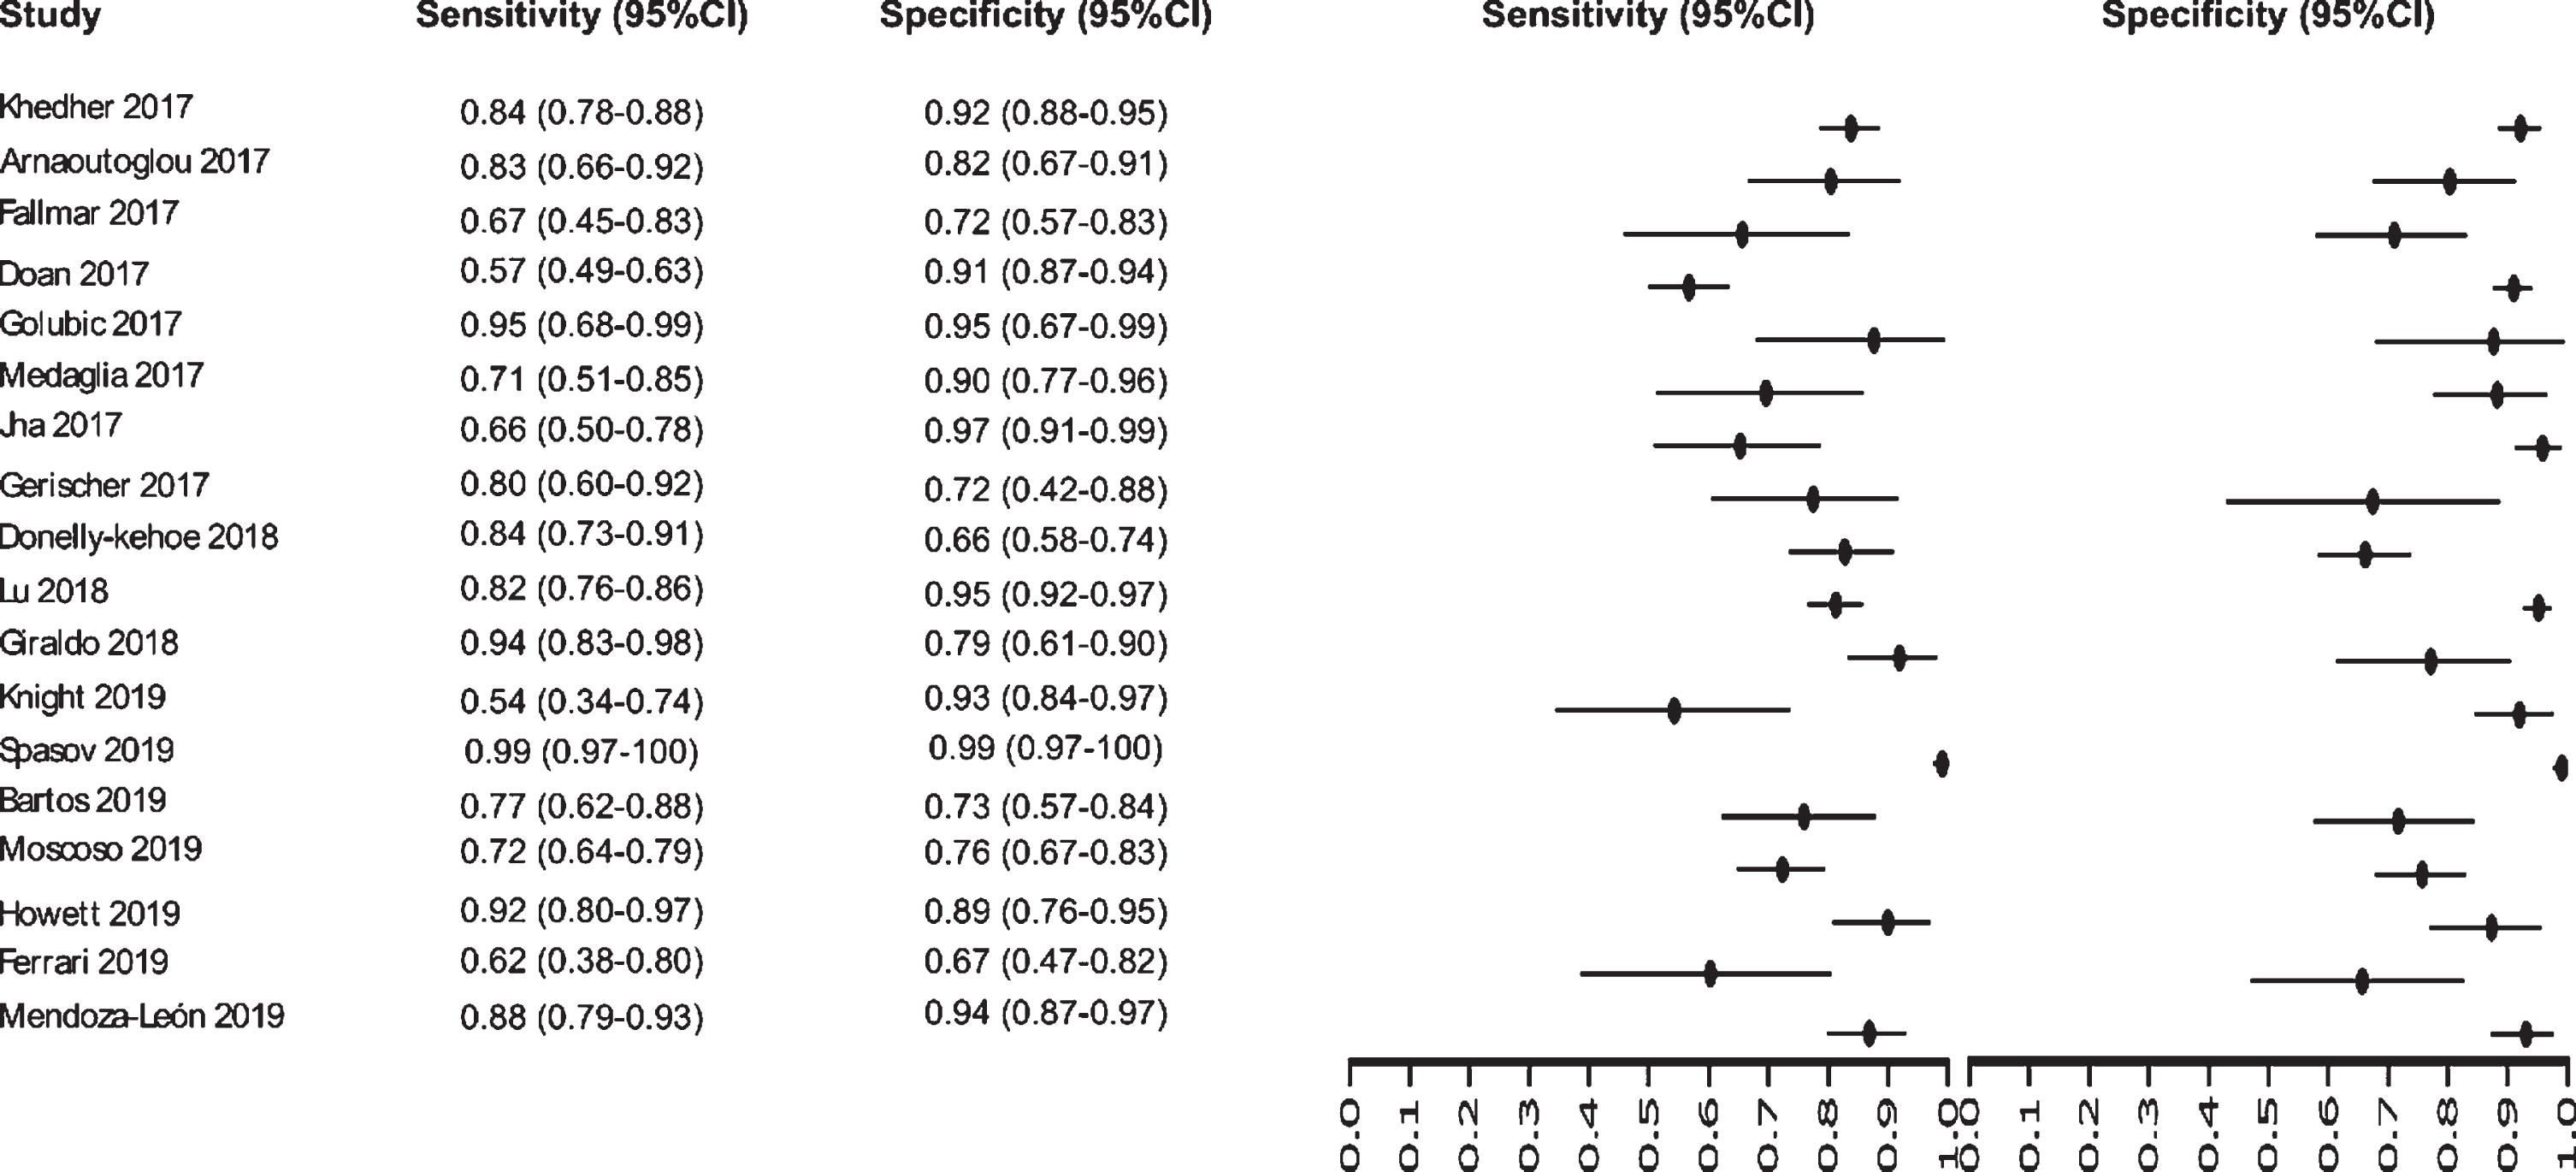
Study data and paired forest plot of the sensitivity and specificity of MRI in Alzheimer’s disease diagnosis (from 2017 to 2019). Data from each study are summarized. Sensitivity and specificity are reported with a mean (95% confidence limits). Forest plot depicts the estimated sensitivity and specificity (black circles) and its 95% confidence limits (horizontal black line).
Summary ROC curves (sROC)
Since variation in the cut-off points of the tests, implicit or explicit variations in the studies, which can generate sensitivity and specificity differences, the sROC curve analysis was chosen to compare the data regarding EEG, tau-PET, and MRI biomarkers (Fig. 9). The calculated area under de curve (AUC) for EEG (AUC: 0.85), tau-PET (AUC: 0.93), and MRI (AUC: 0.91) suggests a better performance for the tau-PET diagnostic biomarker. Even when the AUC was calculated restricted to observed False Positive Rates (FPRs) and normalized, the data showed an AUC of 0.75, 0.87, and 0.82 for EEG, tau-PET and MRI, respectively, confirming tau-PET slightly better performance (Fig. 9).
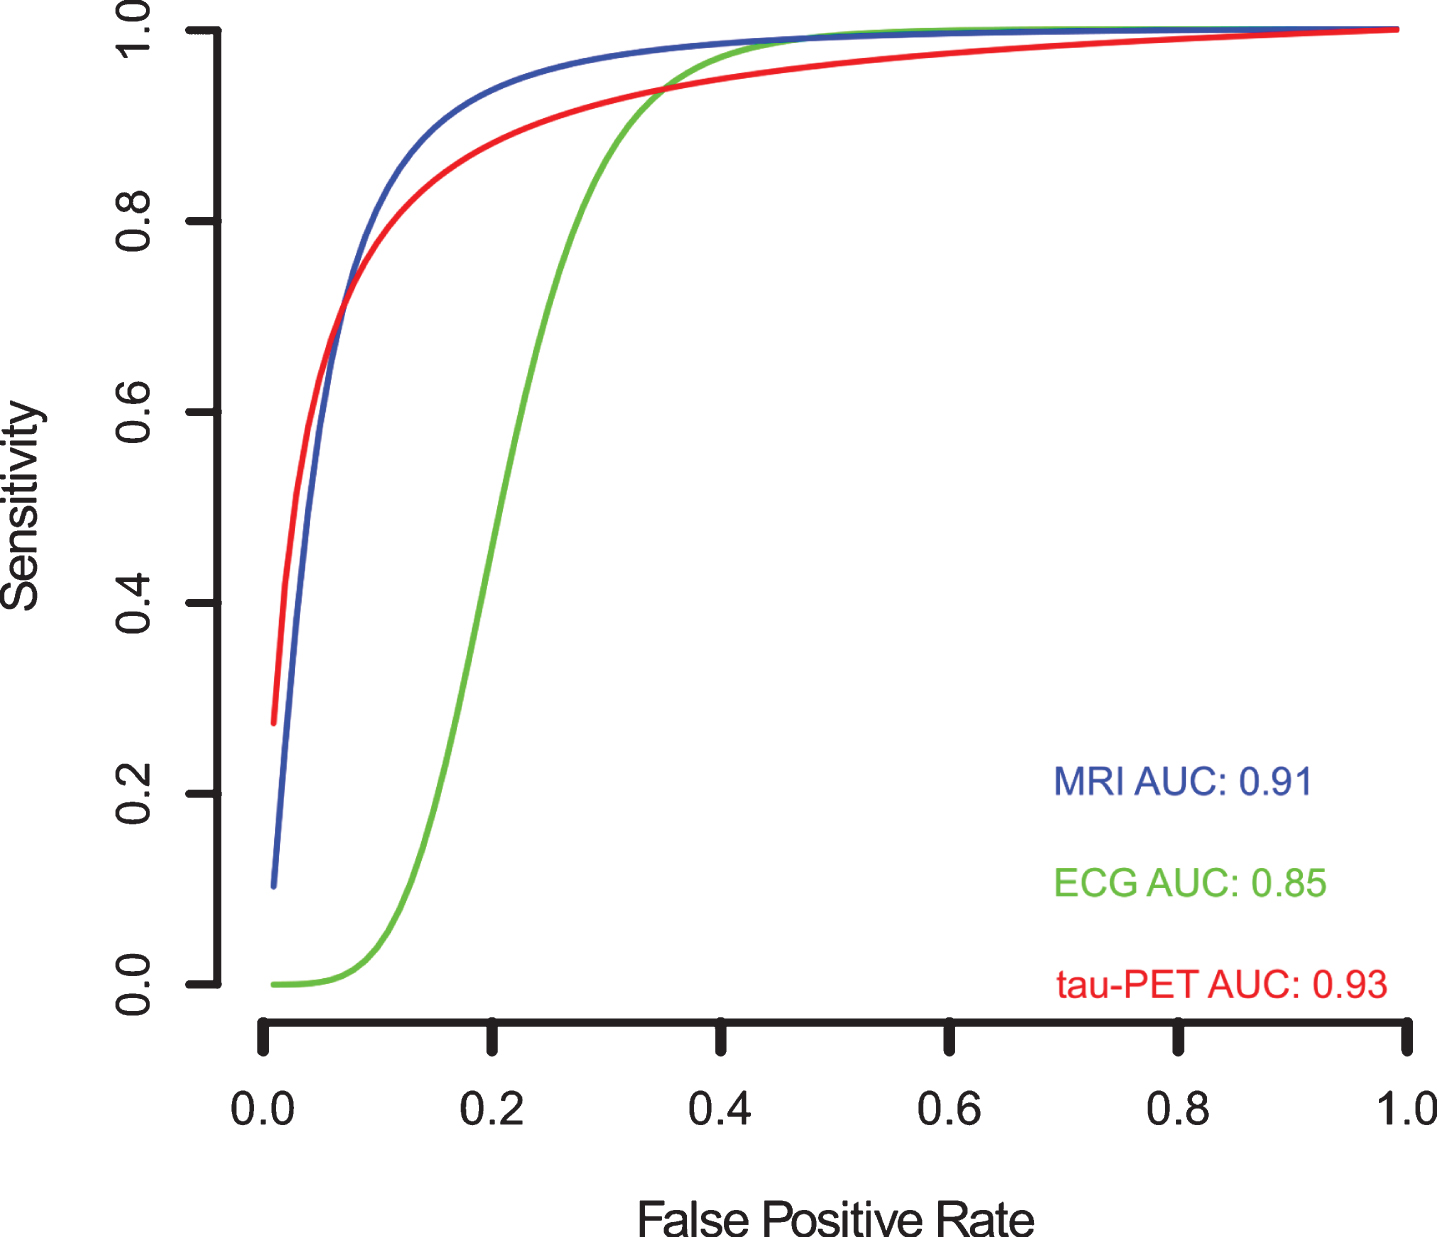
Meta-analysis of diagnostic test accuracy analysis. Summary receiver operating curve (sROC) plot of false positive rate and sensitivity. EEG studies are indicated by green crosses, while tau-PET studies are indicated by open red triangles, and MRI studies are indicated by open blue circles. Curved lines indicate the summary performance curves estimated by sROC statistics for each biomarker. For EEG in green (N = 13), for tau-PET in red (N = 07), and for MRI in red (N = 61).
DISCUSSION
Developing countries (e.g., Asian, African, and South American countries) face certain unique problems such as prevalent poverty, tropical diseases, infectious diseases, and poor infrastructure, which ensures that the population maintains dismal rates of adult literacy and conditions of general deprivation at-large. It has been estimated that Population-Attributable Risk (PAR; 19.1%, 95% confidence interval 12.3–25.6) has been reported highest in countries with low educational achievement and with poor physical. Developing nations have higher PAR due to low access to educational programs and developed countries have high PAR due to poor physical activity in their population. The PAR% is used to predict the impact of public health interventions on adverse outcomes, since it considers both the excess risk associated with the exposure and the proportion of the population that is exposed. Thus, with these socio-economically factors with physiologically complementary ultra-high PAR clusters, there are more chances that an AD epidemic could be unavoidable in the developing world in near future [113].
The diagnosis of AD is complicated by the fact that there is likely an apparent dynamic and overlapping “continuum” between AD and aging, which can be identified through biomarkers and neuropathological findings. The diagnostic biomarkers, described here, have been shown to be helpful in diagnosing AD; but some of these methods are very expensive (PET), some need personnel with high expertise to evaluate the findings (MRI), or are invasive (CSF). For these reasons, some of the diagnostic biomarkers are less assessable in poor or developing countries. Thus, harmonization of screening methods worldwide could help to define risks and to devise novel approaches for dementia prevention. In this sense, the need for diagnostic biomarkers that can be applied more widely is of high importance and extensive investigations have been done to discover plasma or serum biomarkers for AD; however, currently there are no valid biomarkers for AD diagnosis in blood [114, 115]. AD incidences are bound to increase in the developing world in contingent with the aging population. It has been shown that the data from developing countries suggest that age-adjusted AD prevalence estimates in 65-year-olds are high (≥5%) in certain Asian and Latin American countries, but consistently low (1–3%) in India and sub-Saharan Africa [113–116].
Regarding the results, CSF is considered a better source for biomarker discovery. Thereby, three CSF biomarkers, including Aβ42, total-tau (t-tau), and phosphorylated-tau (p-tau), have been found to have the highest diagnostic potential [117]. However, CSF is invasive and potentially painful for the patient since it is obtained via lumbar puncture [118–119]. Amyloid-PET has an emerging role in the diagnosis and management of patients with AD and its use is grounded on the fact that the hallmark of AD is the histological detection of Aβ at postmortem autopsy [120]. Nevertheless, it was surprising that the number of studies selected for the CSF and amyloid-PET biomarkers were 1 and 2, respectively; making it impossible to perform the analysis of the data (at least 5 studies needed to for analysis with p value < 0.05). In this sense, with regards to CSF results, one explanation could be the few numbers of studies selected. While, the single MeSH terms “Alzheimer Disease”, “Sensitivity and Specificity” and “Cerebrospinal Fluid”; accounted for 18,509, 575,930, and 91,803 studies, respectively, combined in a search, only 20 studies were found to be published in the last thirty years.
EEG has been demonstrated as a reliable diagnostic tool in AD research [121]. Potentiated with contemporary statistical methods seems to be a reliable method to classify the clinical cases of cognitive impairment, although when the comorbidity is high this classification is not so well effective [122]. EEG may therefore be a valuable add-on in dementia assessment, as an early marker of brain synaptic disturbances due to the AD molecular neuropathology [123]. MRI is an integral part of the clinical assessment of patients with suspected AD and can provide informative biomarkers even before clinical symptoms are apparent or irreversible neuronal damage has occurred [124]. MRI is included in the diagnostic criteria for the most prevalent non-Alzheimer dementias, reflecting its value in differential diagnosis [125]. The accumulation of pathological misfolded tau protein is a common feature to a collective of neurodegenerative disorders known as tauopathies, in which AD is the most common [126]. Tau imaging using positron emission tomography (tau-PET) studies have provided evidence that tau-PET is more closely related to neurodegeneration diagnostic biomarkers than to the presence of Aβ [127]. Tau-PET accumulation links to clinical phenotype and better co-localized to glucose hypometabolism compared to amyloid-PET [128] and appears to provide valuable information earlier in therapeutic trials of AD than MRI [129]. Taking this into consideration, our data suggest a slight difference between the tau-PET and MRI in the diagnoses of AD in comparison to healthy controls. Furthermore, NFT pathology is strongly associated with cognitive impairment; tau-related biomarkers may work best before NFTs are prevalent, and it may therefore be crucial to identify persons who may be at the cusp of exhibiting tauopathies [130]. Recently, a tau-PET imaging diagnostic method, with a high sensitivity and moderate to high in specificity, was able to identify the underlying presence of NFTs [131].
In this study we aimed to analyze the last three decades of clinical studies on biomarkers used for the diagnosis of AD. There are certain inherent flaws associated with systematic review and meta-analysis, such as the location and selection of studies, heterogeneity, loss of information on important outcomes, inappropriate subgroup analyses, conflict with new experimental data, and duplication of publication [132]. Despite these flaws there is an increase in the usage of the meta-analysis to enhance diagnostic test accuracy in clinical studies. In our review, the main problem we determined was the heterogeneity between studies from developed versus developing countries. The major factors were clinical settings, and the methods used to estimate the sensitivity and specificity values, in the evaluation of the AD patients [133, 134].
Our meta-analysis results have highlighted that among the 84 studies analyzed, only a few were conducted on AD patients from developing countries; for example, 7 studies were carried out in Brazil (Latin America), 4 in China, 3 in Poland, 2 in Turkey, and 1 in Iran and Taiwan each. In contrast, developed nations like the US had 31 studies, Canada had 17 studies, France had 9 studies, and the UK had 7 studies. These findings suggest that a proportionally small part of the data regarding AD diagnosis are reflected from developing nations, a fact that could hamper the global prevalence of AD. Furthermore, a recent study suggests that there are major gaps in geographical representation for many risk factors for AD and data from non-European and non-North American continents, which have not been reported. Additionally, evidence from Australia/Oceania or Africa was limited and that, except for diabetes, data were unavailable from Latin America/Caribbean [135]. As a consequence of lack of funding in research, cutting-edge technology is inaccessible, due to that only a handful of developing countries (e.g., Brazil from Latin America, India and China from Asia, and South Africa from Africa) publishes their work and managed to publish in high impact journals with valuable research publications [9, 10].
Given the socioeconomic and financial disparity in the developed (US, UK) versus developing countries (Latin America, Asian, and African countries), there is an urgent need to fund the studies for the growth in the burden of AD, particularly among minority populations, and culturally subtypes groups (having different food habits and lifestyles) should be of paramount importance. Therefore, by reducing poverty and improving the quality of education and lifestyle might contribute to achieving a better living in old age for the rapidly aging population of the developing world. Thus, a blood-based biomarker would enable a more rapid and inexpensive screening of potential participants, particularly for prevention trials for AD [136]. In this way, we suggest improving study design standards, to avoid poorness of reporting, analysis, and presentation of results; and we encourage developing countries scientist to perform studies with local subjects, studies comparing classic biomarkers and new diagnostic tools for the diagnosis of AD.
The impact of AD in developing countries deserves further epidemiological and implementation research to enable early detection, widespread adequate treatment, and caregiver support. Refining the policy agenda, increasing the health care policies and scientific grants will promote greater awareness and lead to better management of the disease.
CONFLICT OF INTEREST
The authors have no conflict of interest to report.
Footnotes
ACKNOWLEDGMENTS
This study was supported by the Consejo Nacional de Ciencia, Tecnología e Innovación y Tecnología (CONCYTEC) and the Fondo Nacional de Desarrollo Científico, Tecnológico y de Innovación Tecnológica de Peru (FONDECYT). Contract Nr. 24-2019. We would like to thank Dr. Máximo Rondon and Dra Karina Rosas and the Vicerrectorado de investigacion for providing substantial support to the Laboratory of Genomics and Neurovascular Diseases to carry out this work.